Colligative and Other Properties of Sea Water
Colligative Properties. The colligative properties—namely, vapor-pressure lowering, freezing-point depression, boiling-point elevation, and osmotic pressure—are unique properties of solutions. If the magnitude of any one of them is known for a solution under a given set of conditions, the others may readily be computed. Solutions of the complexity and concentration of sea water do not obey the generalized theories of the colligative properties, but in all cases the departures from the theoretical values are proportional.
| Salinity (V%) | Temperature, ϑm (°C) | |||||||||||
|---|---|---|---|---|---|---|---|---|---|---|---|---|
| 0 | 2 | 4 | 6 | 8 | 10 | 12 | 14 | 16 | 18 | 20 | 22 | |
| 30.0…… | 3.5 | 5.3 | 7.0 | 8.7 | 10.3 | 11.8 | 13.2 | 14.7 | 16.1 | 17.6 | 18.9 | 20.3 |
| 32.0…… | 3.9 | 5.7 | 7.3 | 9.0 | 10.6 | 12.1 | 13.5 | 15.0 | 16.4 | 17.8 | 19.1 | 20.5 |
| 34.0…… | 4.3 | 6.0 | 7.7 | 9.4 | 10.9 | 12.4 | 13.8 | 15.3 | 16.6 | 18.0 | 19.3 | 20.7 |
| 36.0…… | 4.7 | 6.4 | 8.1 | 9.7 | 11.2 | 12.7 | 14.1 | 15.5 | 16.9 | 18.3 | 19.6 | 20.9 |
| 38.0…… | 5.1 | 6.8' | 8.4 | 10.0 | 11.6 | 13.0 | 14.4 | 15.8 | 17.2 | 18.5 | 19.8 | 21.1 |
| Depth (m) | Temperature, ϑm (°C) | ||
|---|---|---|---|
| 12 | 13 | 14 | |
| 1000…………………… | 14.4 | 15.1 | 15.8 |
| 2000…………………… | 30.0 | 31.4 | 32.7 |
| 3000…………………… | 46.6 | 48.6 | 50.6 |
| 4000…………………… | 64.2 | 66.7 | 69.2 |
Only the depression of the freezing point for sea water of different chlorinities has been determined experimentally (Knudsen, 1903; Miyake,


Osmotic pressure, vapor pressure relative to that of pure water, freezing point, and temperature of maximum density as functions of chlorinity and salinity.
The vapor pressure of sea water of any chlorinity referred to distilled water at the same temperature can be computed from the following equation (Witting, 1908):

The osmotic pressure can be calculated from the freezing-point depression by means of the equation derived by Stenius (Thompson, 1932):

The osmotic pressure at any temperature may then be computed:

It will be noted that the freezing-point depression and, therefore, the other colligative properties are not linear functions of the chlorinity, because chlorinity is reported as grams per kilogram of sea water and not as grams per kilogram of solvent water, in which case a linear relationship should be expected. In agreement with this expectation, Lyman and Fleming (1940) found that the freezing-point depression could be written in the form

The magnitude of the colligative properties depends upon the concentration of ions in the solution and upon their activity. According to present concepts the major constituents of sea water exist as ions whose concentrations may be computed from data in table 35 (p. 173). Within the normal range of sea water the gram-ionic concentration per kilogram of solvent water may be obtained from the following expression:

Maximum Density. Pure water has its maximum density at a temperature of very nearly 4°, but for sea water the temperature of maximum density decreases with increasing salinity, and at salinities greater than 24.70‰ is below the freezing point. At a salinity of 24.70 ‰, the temperature of maximum density coincides with the freezing point: ϑf = −1.332°. Consequently, the density of sea water of salinity greater than 24.70 ‰ increases continuously when such water is cooled to its freezing point. The temperature of maximum density is shown in fig. 13 as a function of salinity and chlorinity.
| p (bars) | Temperature (°C) | ||||||
|---|---|---|---|---|---|---|---|
| 0 | 5 | 10 | 15 | 20 | 25 | 30 | |
| 0 | 4659 | 4531 | 4427 | 4345 | 4281 | 4233 | 4197 |
| 100 | 4582 | 4458 | 4357 | 4278 | |||
| 200 | 4508 | 4388 | 4291 | ||||
| 400 | 4368 | 4256 | |||||
| 1000 | 4009 | 3916 | |||||
Compressibility. Ekman (1908) has derived an empirical equation for the mean compressibility of sea water between pressures 0 and p bars (p. 57), as defined by αs,ϑ,p = αs,ϑ,0 (1 − kp). Numerical values are given in table 15, where the bar has been used as pressure unit.
The true compressibility of sea water is described by means of a coefficient that represents the proportional change in specific volume if the hydrostatic pressure is increased by one unit of pressure: K = (− l/α)(dα/dp). The true compressibility can be calculated from the mean compressibility, which was tabulated by Ekman, using the equation

Viscosity. When the velocity of moving water varies in space, frictional stresses are present. The frictional stress which is exerted on a
| Salinity (%) | Temperature (°C) | ||||||
|---|---|---|---|---|---|---|---|
| 0 | 5 | 10 | 15 | 20 | 25 | 30 | |
| 0………… | 17.9 | 15.2 | 13.1 | 11.4 | 10.1 | 8.9 | 8.0 |
| 10………… | 18.2 | 15.5 | 13.4 | 11.7 | 10.3 | 9.1 | 8.2 |
| 20………… | 18.5 | 15.8 | 13.6 | 11.9 | 10.5 | 9.3 | 8.4 |
| 30………… | 18.8 | 16.0 | 13.8 | 12.1 | 10.7 | 9.5 | 8.6 |
| 35………… | 18.9 | 16.1 | 13.9 | 12.2 | 10.9 | 9.6 | 8.7 |
The viscosity that has been discussed so far is valid only if the motion is laminar, but, as stated above, turbulent motion prevails in the sea, and an “eddy” coefficient must be introduced which is many times larger (p. 91).
Diffusion. In a solution in which the concentration of a dissolved substance varies in space, the amount of that substance which per second diffuses through a surface of area 1 cm2 is proportional to the change in concentration per centimeter along a line normal to that surface (dM/dt = −δ dc/dn). The coefficient of proportionality (δ) is called the coefficient of diffusion; for water it is equal to about 2 × 10⁻⁵, depending upon the character of the solute, and is nearly independent of temperature. Within the range of concentrations encountered in the sea the coefficient is also nearly independent of the salinity.
What was stated about the coefficient of thermal conductivity in the sea applies also to the coefficient of diffusion. Where turbulent motion prevails, it is necessary to introduce an “eddy” coefficient that is many times larger and that is mainly dependent on the state of motion.
Surface Tension. The surface tension of sea water is slightly greater than that of pure water at the same temperature. Krümmel (1907) carried out experimental observations from which he derived an empirical equation relating the surface tension to the temperature and salt content. This equation was revised by Fleming and Revelle (1939) to take into account the more recent values for pure water. The revised expression has the form

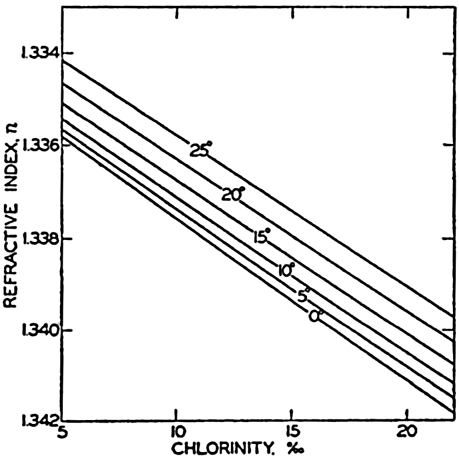
Refractive Index. The refractive index increases with increasing salinity and decreasing temperature. The problem of determining the relationship between these variables, and the types of equipment to be used, has been discussed by a number of authors (for example, Utterback, Thompson, and Thomas, 1934; Bein, Hirsekorn, and Möller, 1935; Miyake, 1939). Since the index varies with the wave length of light, a standard must be selected, usually the D line of sodium.
Utterback, Thompson, and Thomas determined at a number of temperatures the refractive index of ocean-water samples that had been diluted with distilled water. They found that the refractive index could be represented by expressions of the following type:


Electrical Conductivity. Thomas, Thompson, and Utterback (1934), and Bein, Hirsekorn, and Möller (1935) have studied conductivity as a function of chlorinity and temperature and have given tables for the specific conductance in reciprocal ohms per cubic centimeter for a wide range in conditions.

Refractive index of sea water as a function of temperature and chlorinity.
The results of the investigations of Thomas, Thompson, and Utterback are expressed at temperatures of 0, 5, 10, 15, 20, and 25°. Their results are shown graphically in fig. 15. The values for the low chlorinities were obtained by diluting ocean water with distilled water, and hence the density and other properties will not correspond exactly to those of water of the same chlorinity, as represented in Knudsen's Hydrographical Tables.