MASS PROPERTIES OF MARINE SEDIMENTS
The mass properties of sediments are the summation of those of the component grains. Because of the variety in size and composition of the ultimate particles, the mass properties are not clear-cut and in some cases statistical methods must be used to express them. Three of the mass properties, namely, color, texture, and composition, are used for the classification of marine sediments. The advantages of such a system are that preliminary examination in the field, by visual examination and from the feel of the sample when rubbed between the fingers, enables an experienced observer to classify the sample correctly. Besides being useful to designate the type of sediment, these properties give certain indications as to the source of the constituent material (particularly the grains large enough to be recognized with a hand lens), the effective transporting agencies, and the conditions in situ.
Color of Marine Sediments. The color of a recent marine sediment depends upon the following factors: (1) whether the sample is wet or dry, (2) the primary color of the larger grains, (3) the state of division (size) of the constituent particles, (4) the state of oxidation or reduction of the iron, and (5) the amount of decomposable organic matter.
Because the color may be affected by the moisture content and the oxidation-reduction potential may be modified by bacterial activity after the sample is collected, the color should be noted soon after the material has been obtained. In order to eliminate as far as possible the subjective element in judging color when an accurate estimate is desirable, a standard color chart such as that prepared by Ridgway (1912) should be employed.
The color of the individual grains is particularly important in sediments containing a relatively large proportion of material coarser than silt. Finely divided material may have an “apparent” color which depends upon the state of division. In many ways the oxidation-reduction potential in the sediment is probably the most important factor controlling the color. When conditions are such that the potential is oxidizing for iron, reddish or brown oxides are formed. This is the condition which will normally prevail in the presence of free oxygen. When there is a relatively abundant supply of organic material, bacterial activity may use up all the available oxygen and establish highly reducing conditions. If hydrogen sulphide is produced, black iron sulphides may be formed. Intermediate stages in the oxidation or reduction of the iron may possibly produce the greenish and bluish colors characteristic of many near-shore deposits. Although the state of oxidation or reduction of the iron has been considered as the most important factor in determining the color, particularly of fine-grained sediments, the problem is not yet solved, as the sediments tend to retain their color even when treated in various ways in the laboratory.
Marine sediments vary from white through gray to black, with the addition of various amounts of yellow, red, blue, or combinations of these colors. White sediments and, in general, those of light colors are relatively coarse-grained and composed of quartz or limestone. The grays may be due to the presence of black minerals or authigenic iron and manganese grains. Black deposits are typical of stagnant conditions that may prevail in basins, fjords, and other isolated environments.
Coarse-grained sediments will generally show the color of the constituent grains. As the greatest part of the sea floor is covered with fine-grained sediments, it is of interest to note the character of the material brought to the sea. River-borne debris is generally yellow, red, or brown, and in areas where the deposition is rapid, as off the mouths of large rivers, the sediments are essentially the same color as the source material and are often referred to as red muds. Along most coasts where the deposits are predominantly terrigenous, the sediments are generally green or olive green. Hence, there seems to be some change in the color of the terrigenous material that is probably associated with the oxidation-reduction potential in the environment of deposition. Further offshore the greenish or bluish muds pass gradually into the
Both the absolute and the relative rates of deposition of decomposable organic matter and of organic skeletal structures and inorganic debris may be important in determining the color of a deposit. It is a characteristic property of many terrigenous deposits that the upper few millimeters are of a browner tint than the underlying material. This may be due to the fact that the supply of oxygen is much greater at the surface and that the oxidation-reduction potential is not as low as it is in the buried material. Lamination or stratification of the sediments in core samples may frequently be recognized by color differences. Such structures can generally be confirmed by studies of the texture or of the organic-matter content. The darker bands usually contain more organic matter.
The organic-matter content of marine sediments varies from essentially zero to more than 15 per cent. Samples containing large quantities may actually be darkened by the presence of the black or brownish organic detritus. Fox and Anderson (1941) have shown that organic pigments can be extracted from certain terrigenous muds.
Color is therefore a useful character in classifying marine sediments because it tells something of the source of the material, particularly of the coarse-grained portions, and of the conditions of deposition. If the depth and distance from shore are known, certain conclusions may be drawn as to the relative and absolute rates of deposition of decomposable organic matter and of the inert constituents and as to the oxidation-reduction potential prevailing in the sediments.
Texture of Marine Sediments. Depending upon their texture, marine sediments may be subdivided into gravels, sands, silts, muds, clays, or intermediate types (p. 972). The proportions of larger grains may be estimated visually or judged by rubbing the material between the fingers. An experienced observer is able to classify a sample in this way very easily. When an accurate knowledge of the particle-size distribution is required, laboratory tests must be made by methods such as those described by Krumbein and Pettijohn (1938) and by Gripenberg (1939b).
The particles in a marine sediment may cover a wide range in size. In general, there are no sharp limits to the sizes of the constituent grains, and as a result it is necessary to employ certain conventionalized methods for the discussion or for the graphical presentation of data of this type. In practice, it is impossible to determine the size of each individual grain
The data on size-grade distribution may be graphed in various ways. The two most common forms are histograms and cumulative curves. Because of the range in particle size usually encountered and for other reasons, it is convenient to plot histograms and cumulative curves showing the percentage weight frequency against the logarithm of the equivalent diameter. In figs. 254 and 255 (pp. 980, 981), comparable data are represented in these two ways. By convention, the smaller grade sizes are always on the right-hand side of the diagram. The heights of the columns in the histograms show the weight frequency or percentage represented by the individual size grades. The cumulative curve is obtained by successive addition of the material in the different grades and shows directly the percentage by weight of material greater or less than any designated size.
Krumbein and Pettijohn (1938) and Krumbein (1939) have discussed the statistical significance of size-grade distribution data. Certain values which can be obtained directly from the cumulative curve for an individual sample are commonly used to characterize the general size and the sorting of the sediment. These are:
The median diameter (M2) which represents the diameter which in the individual sample has 50 per cent by weight of material of smaller and larger equivalent diameters.
The first (Q1) and third (Q3) quartile diameters. The first quartile diameter has 25 per cent smaller and 75 per cent larger diameter and the third quartile has 75 per cent smaller and 25 per cent larger. The difference in the quartile diameters indicates the range covered by the middle 50 per cent of the material, but tells nothing of the coarser and finer quarters.
The sorting coefficient (S0) is a measure of the degree of sorting and is defined as
The value of S0 will approach unity as the material becomes more uniform in size. Trask (1932) found that values of S0 less than 2.5 indicated well-sorted material with about 3.0 as the average for marine sediments.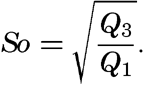 ― 971 ―When S0 is greater than 4.5, the sediment is considered to be poorly sorted.
The asymmetry of the distribution about the median is designated as the skewness (Sk). The skewness may be defined as
When the size-frequency distribution curve is symmetrical the value of Sk is unity, but the values may range from less than unity to larger figures which indicate that the distribution is skewed either towards the finer or the coarser sizes.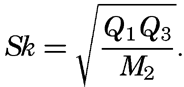
The statistical expressions given above are those recommended by Krumbein and Pettijohn (1938) and may differ from somewhat similar terms employed by other workers.
It will be seen that the median and the first and third quartile diameters and the sorting coefficient and the skewness are introduced in order to obtain simple figures to express certain features of the size-grade distribution. It is unfortunate that these expressions do not take into account the coarse and fine material lying beyond the limits of the first and third quartiles. This drawback is particularly applicable as concerns the coarser material, which may be diagnostic as to the effective transporting agencies. The finer material is not of such interest as it is more cosmopolitan in its distribution.
Composition of Marine Sediments. The composition of a sediment may be presented in various ways and a wide variety of techniques may be employed to determine it. In general, “composition” is used to indicate one of the mass properties, it may be the size-grade distribution discussed above, the chemical composition, or the percentage of different types of organic remains or minerals. On the other hand, interest may be centered upon some fraction of the sample, such as the heavy minerals or the decomposable organic matter, or upon some single chemical element. The composition is of interest because it is a way of determining the sources of the various constituents and the proportions in which they are present. Furthermore, it offers a means of determining the effects of chemical weathering and of identifying authigenic minerals.
In the field the composition of the larger grains may be determined by visual examination which may tell whether they are predominantly organic and if so, of what type, or whether they are minerals of volcanic, terrigenous, or authigenic nature. From such observations, in combination with the color and texture, the sediment may be classified. In the laboratory, examination under the microscope makes it possible to identify many more of the grains down to sizes of approximately two microns. Below this grade it is necessary to employ chemical analyses, X-ray analyses, or some other method to determine the character and
Complete chemical analyses are difficult and are rarely carried out. Much more frequently, determinations of one or more diagnostic elements are made, for example, of calcium carbonate, or organic nitrogen as a measure of the organic matter.