II. The Earth and the Ocean Basins
Figure and Size of the Earth
As a first approximation the earth may be considered as a sphere, but, according to accurate observations, its figure is more closely represented by an ellipse of rotation—that is, an oblate spheroid, the shorter axis being the axis of rotation. The figure of the earth has been defined by various empirical equations, the constants of which are based on observations and are subject to modification as the number of observations increases and their accuracy is improved. The geometrical figures defined by these equations cannot exactly represent the shape of the earth because of the asymmetrical distribution of the water and land masses.
To define the position of a point on the earth's surface, a system of coordinates is needed, and as such the terms latitude, longitude, and elevation or depth are used. The first two are expressed by angular coordinates and the third is expressed by the vertical distance, stated in suitable linear units, above or below a reference level that is generally closely related to mean sea level. The latitude of any point is the angle between the local plumb line and the equatorial plane. Because the earth can be considered as having the form of a spheroid, and as the plumb line, for all practical purposes, is perpendicular to the surface of the spheroid, any plane parallel to the Equator cuts the surface of the spheroid in a circle, and all points on this circle have the same latitude. These circles are called parallels of latitude. The latitude is measured in degrees, minutes, and seconds north and south of the Equator. The linear distance corresponding to a difference of one degree of latitude would be the same everywhere upon the surface of a sphere, but on the surface of the earth the distance represented by a unit of latitude increases by about 1 per cent between the Equator and the Poles. At the Equator, 1 degree of latitude is equivalent to 110,567.2 m, and at the Poles it is 111,699.3 m. In table 1 are given the percentages of the earth's surface between different parallels of latitude.
The line in which the earth's surface is intersected by a plane normal to the equatorial plane and passing through the axis of rotation is known as a meridian. The angle between two meridian planes through two
| Latitude | % | Cumulative % |
|---|---|---|
| 0°– 5° | 8.68 | 8.68 |
| 5–10 | 8.62 | 17.30 |
| 10–15 | 8.48 | 25.78 |
| 15–20 | 8.30 | 34.08 |
| 20–25 | 8.04 | 42.12 |
| 25–30 | 7.72 | 49.84 |
| 30–35 | 7.36 | 57.20 |
| 35–40 | 6.92 | 64.12 |
| 40–45 | 6.44 | 70.56 |
| 45–50 | 5.92 | 76.48 |
| 50–55 | 5.33 | 81.81 |
| 55–60 | 4.71 | 86.52 |
| 60–65 | 4.05 | 90.57 |
| 65–70 | 3.36 | 93.93 |
| 70–75 | 2.64 | 96.57 |
| 75–80 | l.90 | 98.47 |
| 80–85 | 1.15 | 99.62 |
| 85–90 | 0.38 | 100.00 |
| Equatorial radius, a.................... 6378.388 km |
| Polar radius, b......................... 6356.912 km |
| Difference (a − b)................ 21.476 km |
| Area of surface......................... 510,100,934 km2 |
| Volume of geoid......................... 1,083,319,780,000 km3 |
The distance between points on the earth's surface and the area represented by a given zone cannot be correctly represented unless the size of the earth is known. The values for the equatorial and polar radii are given in table 2, with other data concerning the size of the earth that can be computed from these values. The values for the equatorial and polar radii are those for sea level. The land masses are elevations upon the geometrical figure of the earth, and the sea bottoms represent depressions.
Measurements of depressions below sea level, to be strictly comparable, should be referred to the ideal sea level; that is, to a sea surface which is everywhere normal to the plumb line. In the open ocean the deviations from the ideal sea level rarely exceed 1 or 2 m. The errors that are introduced by referring soundings to the actual sea surface are insignificant in deep water, where the errors of measurement are many times greater. In coastal areas where shoal depths represent a hazard to navigation and where soundings can be made with great accuracy, the
Mean low water. United States (Atlantic Coast), Argentina, Norway, Sweden.
Mean lower low water. United States (Pacific Coast).
Mean low water springs. Great Britain, Italy, Germany, Denmark, Brazil, Chile.
Mean monthly lowest low water springs. Netherlands.
Lowest low water springs. Brazil, Portugal.
Indian spring low water. India, Argentina, Japan.
Mean semi-annual lowest low water. Netherlands East Indies.
Lowest low water. France, Spain, Norway, Greece.
International low water. Argentina.
The mean of the heights of low-water spring tides is known as the low water springs. International low water is 50 per cent lower, reckoned from mean sea level, than low water springs. Indian spring low water depends upon component tides found by harmonic analysis. Other terms are defined elsewhere (p. 562).
The topographic features of the earth's surface can be shown in their proper relationships only upon globes that closely approximate the actual shape of the earth, but for practical purposes projections that can be printed on flat sheets must be used. It is possible to project a small portion of the earth's surface on a flat plane without appreciable distortion of the relative positions. However, for the oceans or for the surface of the earth as a whole, most types of map projections give a grossly exaggerated representation of the shape and size of certain portions of the earth's surface. The most familiar type of projection is that developed by Mercator, which represents the meridians as straight, parallel lines. Although it is satisfactory for small areas and for the lower latitudes, the size and shape of features in high latitudes are greatly distorted because the linear scale is inversely proportional to the cosine of the latitude. In the presentation of oceanographic materials, this exaggeration is most undesirable and, consequently, projections should be used on which the true shape and size of the earth's features can be more closely approximated.
Numerous types of projections have been developed by cartographers. In some instances, these are geometrical projections of the surface of the geoid on a plane surface that can be flattened out, while in others the essential coordinates, the parallels of latitude, and the meridians have been constructed on certain mathematical principles. Maps and charts
In order to show the oceans with the least possible distortion of size and shape, the world maps used in this volume are based on an interrupted projection developed by J. P. Goode. Comparison with a globe will show that the major outlines of the oceans are not distorted and that the margins of the oceans are clearly represented. This projection has the additional advantage of being “equal-area”; that is, that areas scaled from the map are proportional to their true areas on the surface of the earth. To show the relationships between the various parts of the oceans in high latitudes, polar projections are used, and for smaller areas Mercator and other types of projections have been employed.
Distribution of Water and Land
The continental land masses extend in a north-south direction, with the greatest percentage of land in the Northern Hemisphere (table 3), and there is a more or less antipodal arrangement of land- and water-covered areas. The North Polar Sea surrounding the North Pole is opposite to the continent of Antarctica, which is centered on the South Pole, and the continental land masses represented by Europe, Asia, and part of Africa are antipodal to the great oceanic area of the South Pacific. The ocean waters are continuous around Antarctica and extend northward in three large “gulfs” between the continents, on the basis of which three oceans are recognized. The Atlantic Ocean extends from Antarctica northward and includes the North Polar Sea. It is separated from the Pacific Ocean by the line forming the shortest distance from Cape Horn (70°W) to the South Shetland Islands, and the boundary between the Atlantic and the Indian Oceans is placed at the meridian of the Cape of Good Hope (20°E). The boundary between the Pacific and the Indian Oceans follows the line from the Malay Peninsula through Sumatra, Java, Timor, Australia (Cape Londonderry), and Tasmania, and follows the meridian of 147°E to Antarctica. In the north the limit between the Atlantic and the Pacific Oceans is placed in Bering Strait, which is only 58 km wide and has a maximum depth of 55 m. Unless otherwise stated, the oceans as defined above are considered to include the semi-enclosed adjacent seas that connect with them.
Generally speaking, only three oceans are recognized, but it is sometimes desirable to make a further division. The waters surrounding
The nomenclature applied to subdivisions of the oceans is very confused. Generic names designating certain types of features, such as sea, gulf, and bay, are used somewhat indiscriminately and hence have little physiographic significance. For example, the term sea is used in connection with inland salt lakes, such as the Caspian Sea, with relatively isolated bodies of the ocean, such as the Mediterranean Sea, with less isolated areas, such as the Caribbean Sea, and even for some areas with no land boundaries, such as the Sargasso Sea in the western North Atlantic.
Several systems for naming parts of the oceans are employed in oceanographic, work. In certain instances the boundaries are selected arbitrarily by drawing straight or curved lines on the map where there are no land features which constitute natural boundaries. Such a system is followed by the International Hydrographic Bureau (1937). Wüst (1936) has suggested that the submarine ridges that are present at depths of about 4000 m be used to delimit the various parts of the oceans, and that the names now applied to the basins with depths greater than 4000 m be used to designate the areas above them. The general location of such boundaries may be seen in chart I. Oceanography is concerned not only with the form of the oceans as shown on a surface chart, but also with the distribution of properties and living organisms and the nature of the currents. Therefore, a system of nomenclature which indicates the relationships that exist in the sea would be very useful. Wüst's system, based on the ocean bottom topography, meets this purpose for the deep water but not for the upper layers. To formulate “natural regions” of the oceans, other workers, notably Schott (1926, 1935), have attempted to bring together not only geographic and topographic relationships, but also the distribution of properties and organisms, the climatic conditions, and currents. In the discussion of the distribution of organisms, fig. 220 (p. 804) shows how the oceans are subdivided upon the basis of the fauna1 distribution alone, and in the discussion of the water masses of the oceans, fig. 209 (p. 740) shows a subdivision based upon the characteristic temperature and salinity relations of the various regions. A comparison of such charts shows that, although there are certain boundaries which fall in approximately the same localities, there are many regions in which it is not possible to reconcile limits established in different ways.
In table 3 are given the areas of land and water between parallels of latitude five degrees apart. For the whole earth, the ocean waters cover
| Latitude (°) | Northern Hemisphere | Southern Hemisphere | ||||||
|---|---|---|---|---|---|---|---|---|
| Water (106 km2) | Land (106 km2) | Water (%) | Land (%) | Water (106 km2) | Land (106 km2) | Water (%) | Land (%) | |
| 90–85 | 0.979 | ....... | 100.0 | .... | ....... | 0.978 | .... | 100.0 |
| 85–80 | 2.545 | 0.384 | 85.2 | 12.8 | ....... | 2.929 | .... | 100.0 |
| 80–75 | 3.742 | 1.112 | 77.1 | 22.9 | 0.522 | 4.332 | 10.7 | 89.3 |
| 75–70 | 4.414 | 2.326 | 65.5 | 34.5 | 2.604 | 4.136 | 38.6 | 61.4 |
| 70–65 | 2.456 | 6.116 | 28.7 | 71.3 | 6.816 | 1.756 | 79.5 | 20.5 |
| 65–60 | 3.123 | 7.210 | 31.2 | 69.8 | 10.301 | 0.032 | 99.7 | 0.3 |
| 60–55 | 5.399 | 6.613 | 45.0 | 55.0 | 12.006 | 0.006 | 99.9 | 0.1 |
| 55–50 | 5.529 | 8.066 | 40.7 | 59.3 | 13.388 | 0.207 | 98.5 | 1.5 |
| 50–45 | 6.612 | 8.458 | 43.8 | 56.2 | 14.693 | 0.377 | 97.5 | 2.5 |
| 45–40 | 8.411 | 8.016 | 51.2 | 48.8 | 15.833 | 0.594 | 96.4 | 3.6 |
| 40–35 | 10.029 | 7.627 | 56.8 | 43.2 | 16.483 | 1.173 | 93.4 | 6.6 |
| 35–30 | 10.806 | 7.943 | 57.7 | 42.3 | 15.782 | 2.967 | 84.2 | 15.8 |
| 30–25 | 11.747 | 7.952 | 59.6 | 40.4 | 15.438 | 4.261 | 78.4 | 21.6 |
| 25–20 | 13.354 | 7.145 | 65.2 | 34.8 | 15.450 | 5.049 | 75.4 | 24.6 |
| 20–15 | 14.981 | 6.164 | 70.8 | 29.2 | 16.147 | 4.998 | 76.4 | 23.6 |
| 15–10 | 16.553 | 5.080 | 76.5 | 23.5 | 17.211 | 4.422 | 79.6 | 20.4 |
| 10–5 | 16.628 | 5.332 | 75.7 | 24.3 | 16.898 | 5.062 | 76.9 | 23.1 |
| 5–0 | 17.387 | 4.737 | 78.6 | 21.4 | 16.792 | 5.332 | 75.9 | 24.1 |
| 90–0° | 154.695 | 100.281 | 60.7 | 39.3 | 206.364 | 48.611 | 80.9 | 19.1 |
| All oceans and seas................................. 361.059 × 10⁶ km2, 70.8% | ||||||||
| All land...........:.................................. 148.892 × 10⁶km2, 29.2% | ||||||||
In table 4 are given the areas, volumes, and mean depths of the oceans and of certain mediterranean and marginal seas that together constitute the adjacent seas. The data are from Kossinna (1921), and in most instances the designated areas are readily recognized, but for details concerning the boundaries the original reference should be consulted. The Arctic Mediterranean includes the North Polar Sea, the waters of the Canadian Archipelago, Baffin Bay, and the Norwegian Sea, and is therefore separated from the open Atlantic by the line joining Labrador and Greenland in Davis Strait and running through Greenland, Iceland, Faeroe Islands, Scotland, and England, and across the English
Additional data on the areas of the adjacent seas of the Atlantic Ocean are given by Stocks (1938). Littlehales (1932) gives slightly different values for the areas of the oceans.
Relief of the Sea Floor
From the oceanographic point of view the chief interest in the topography of the sea floor is that it forms the lower and lateral boundaries of water. The presence of land barriers or submarine ridges that impede a free flow of water introduces special characteristics in the pattern of circulation and in the distribution of properties and organisms. Furthermore, as will be shown in chapter XX, the nature of the sediments in any area is closely related to the surrounding topography. On the other hand, the geomorphologist or physiographer is concerned primarily with the distribution and dimensions of certain types of topographic features that occur on the submerged portion of the earth's crust. As 71 per cent of the earth's surface is water-covered, knowledge of the major features of the earth's relief will be fragmentary if based only upon those structures that can be seen on land. During the geological history of the earth which covers a span of some thousands of million years, areas now exposed above sea level have at one or more periods been covered by the sea, and parts of the now submerged surface have been above sea level. Many problems in historical geology are therefore dependent upon knowledge concerning the configuration of the sea floor surrounding the continents and the form of the deep-ocean bottom.
Although valuable work in the open ocean has been carried on by scientific organizations, by far the greater proportion of our knowledge of submarine topography is based on soundings taken by or for national agencies in the preparation or improvement of navigational charts. In the United States the U. S. Coast and Geodetic Survey prepares charts for the waters bounding the United States and its possessions, and the Hydrographic Office of the U. S. Navy carries out similar work on the high seas and in foreign waters. The earlier hydrographic work was limited largely to the mapping of coast lines and to soundings in depths less than about 100 fathoms, where hazards to the safe operation of vessels might occur, but deep-sea soundings received a great impetus when surveys were made prior to the laying of the transoceanic cables in the latter part of the nineteenth century. Up to and including the time of the voyage of the Challenger, 1873–1876, all soundings were made with hemp ropes, which made the process a long and tedious undertaking,
| Body | Area (106 km2) | Volume (106 km3) | Mean depth (m) |
|---|---|---|---|
| Atlantic Ocean excluding adjacent seas | 82.441 | 323.613 | 3926 |
| Pacific Ocean excluding adjacent seas | 165.246 | 707.555 | 4282 |
| Indian Ocean excluding adjacent seas | 73.443 | 291.030 | 3963 |
| All oceans (excluding adjacent seas) | 321.130 | 1322.198 | 4117 |
| Aretic Mediterranean | 14.090 | 16.980 | 1205 |
| American Mediterranean | 4.319 | 9.573 | 2216 |
| Mediterranean Sea and Black Sea | 2.966 | 4.238 | 1429 |
| Asiatic Mediterranean | 8.143 | 9.873 | 1212 |
| Large mediterranean seas | 29.518 | 40.664 | 1378 |
| Baltic Sea | 0.422 | 0.023 | 55 |
| Hudson Bay | 1.232 | 0.158 | 128 |
| Red Sea | 0.438 | 0.215 | 491 |
| Persian Gulf | 0.239 | 0.006 | 25 |
| Small mediterranean seas | 2.331 | 0.402 | 172 |
| All mediterranean seas | 31.849 | 41.066 | 1289 |
| North Sea | 0.575 | 0.054 | 94 |
| English Channel | 0.075 | 0.004 | 54 |
| Irish Sea | 0.103 | 0.006 | 60 |
| Gulf of St. Lawrence | 0.238 | 0.030 | 127 |
| Andaman Sea | 0.798 | 0.694 | 870 |
| Bering Sea | 2.268 | 3.259 | 1437 |
| Okhotsk Sea | 1.528 | 1.279 | 838 |
| Japan Sea | 1.008 | 1.361 | 1350 |
| East China Sea | 1.249 | 0.235 | 188 |
| Gulf of California | 0.162 | 0.132 | 813 |
| Bass Strait | 0.075 | 0.005 | 70 |
| Marginal seas | 8.079 | 7.059 | 874 |
| All adjacent seas | 39.928 | 48.125 | 1205 |
| Atlantic Ocean | 106.463 | 354.679 | 3332 |
| Pacific Ocean, including adjacent seas | 179.679 | 723.699 | 4028 |
| Indian Ocean | 74.917 | 291.945 | 3897 |
| All oceans (including adjacent seas) | 361.059 | 1370.323 | 3795 |
Because of their practical importance and the ease with which they could be obtained, the number of soundings in depths less than a few hundred meters accumulated rapidly during the nineteenth century, but in 1895 there existed only 7000 soundings from depths greater than about 2000 m, and of these only about 550 were from depths greater than 5500 m (Bencker, 1930). These data were used by Murray in preparing the bathymetric charts accompanying the reports of the Challenger Expedition.
During the next twenty-five years the number of deep-sea soundings increased slowly, but the introduction of sonic-sounding equipment after 1920 has completely changed the picture. Devices for measuring the depth by timing the interval for a sound impulse to travel to the sea bottom and back again (only a few seconds even in deep water) are used in surveying work and are now standard equipment on many coastwise and oceanic vessels. The development of automatic echo-sounding devices (chapter X) not only made depth measurements simple but, by making accurate bathymetric charts available, introduced another aid in navigation, since passage over irregularities of the sea floor may be used to check positions. This development has necessitated extending accurate surveys into deeper water and, hence, farther from shore. Along the coasts of the United States the bottom is now being charted in detail to depths of about 4000 m. With sonic methods, if the appropriate apparatus is available, it is no more trouble to sound in great depths than it is in shoal waters, and, since many naval vessels and transoceanic commercial vessels make systematic records of their observations, the soundings in the deep sea are now accumulating more rapidly than they can be plotted.
The most common method of representing submarine topography is to enter upon a chart showing the coast lines the numerical values of the soundings at the localities in which they were obtained. Charts issued by the national hydrographic services of the English-speaking countries give depths in fathoms or, if harbor charts, in feet (1 fathom = 6 ft = 1.8288 m). Those issued by other countries generally use meters, although still other units are employed by certain European countries.
Because it is generally impossible to enter all soundings, and as numerical values alone do not give any graphic representation of the topography, contours of equal depths (isobaths) are drawn in those regions in which the number of soundings or the purpose of the chart makes it desirable. On navigational charts, contours are generally restricted to shallow areas where soundings are also shown, but, for certain regions that have been carefully examined, charts are now issued with contours entered to depths as great as 2000 fathoms (for example, U. S.
The accuracy with which submarine topography can be portrayed depends upon the number of soundings available and upon the accuracy with which the positions of the soundings were determined. Topographic maps of land surfaces are based on essentially similar data; namely, elevations of accurately located points, but the surveyor has one great advantage over the hydrographer. The surveyor is able to see the area under examination and thereby distribute his observation points in such a manner that the more essential features of the topography are accurately portrayed. The hydrographer, on the other hand, must construct the topography of the sea floor from a number of more or less random soundings. Sonic sounding methods and the introduction of more accurate means of locating positions at sea (see Veatch and Smith, 1939) have made it feasible to obtain adequate data for constructing moderately accurate charts or models of parts of the sea floor. This is particularly true of the coastal waters of the United States. Veatch and Smith have prepared contour maps of the eastern seaboard based on the investigations of the U. S. Coast and Geodetic Survey, and Shepard and Emery (1941) have made use of similar data from the Pacific Coast, where over 1,300,000 soundings were available.
In some instances it is preferable to represent the bottom configuration by vertical profiles or by relief models, but, because of the difference in magnitude of the vertical and horizontal dimensions of the oceans, it is generally necessary to exaggerate the vertical scale. The average depth of the ocean is about 3800 m, and the vertical relief of the ocean floor is therefore of the order of a few kilometers, whereas the horizontal distances may be of the order of thousands of kilometers. Hence such distorted representations give a false impression of the steepness of submarine slopes. If profiles are drawn to natural scale, the ocean waters form a shallow band with barely perceptible undulations of the bottom. Examples of undistorted profiles are given by Johnstone (1928).
In fig. 1 are shown two representations of a profile of the sea bottom in the South Atlantic based on the observations of the Meteor (Stocks and Wüst, 1935). The upper section (A) is constructed from thirteen wire soundings, and is comparable in detail to most of the profiles that could be prepared before the introduction of sonic methods. The lower section (B) is based upon over 1300 sonic soundings that were taken by the Meteor along the same route, shown in the map at the bottom part of the figure (C), where the depth contours are from chart I. The increasing complexity of the known topography of the sea bottom resulting
The water surface coincides, for all practical purposes, with the surface of the geoid, and the sea bottom, if “flat,” would be parallel to the sea surface. Irregularities of the sea floor therefore represent departures from this surface, which is convex outward. Only in small features with steep slopes are depressions actually concave outward.
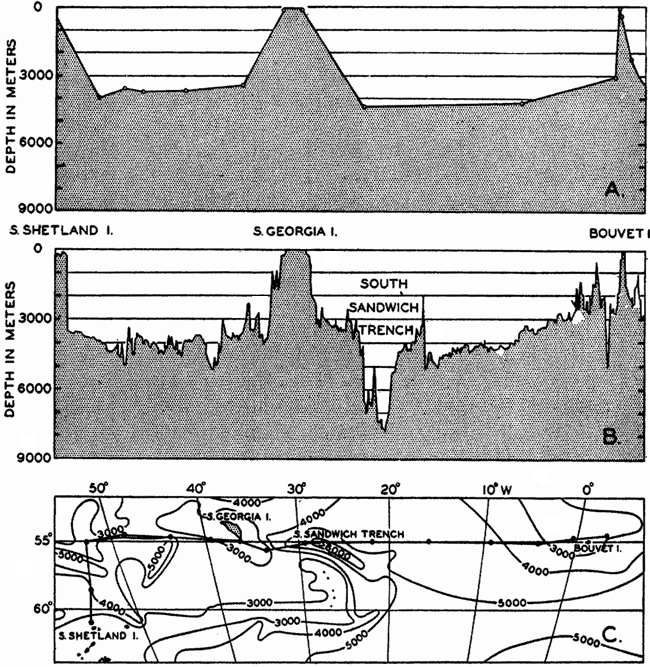
Bottom topography in the South Atlantic Ocean. (A) Profile of the bottom between the South Shetland Islands and Bouvet Island based on 13 wire soundings. (B) Profile over the same course constructed from over 1300 sonic soundings (Meteor). (C) Bottom configuration as shown in Chart I and the track of the Meteor. Vertical exaggeration in (A) and (B) about 200:1. (In part, after Stocks and Wüst, 1935.)
The greatest depths so far discovered are in the Pacific Ocean, where, in the Philippines Trench and the Japan Trench, soundings greater than 10,000 m have been obtained. In the Philippines Trench the German vessel Emden obtained a sonic sounding of 10,540 m, which, however, is considered to be about 200 m too great. The Dutch vessel Willebrord
Representations of submarine topography are usually referred to sea level, and particular interest has always been attached to those regions in which great depths are found. The greater detail with which the sea floor can now be mapped has emphasized the importance of relative relief; that is, the form and magnitude of elevations or depressions with respect to their general surroundings. In later pages it will be shown that there are two primary levels of reference on the earth's crust, one slightly above sea level, corresponding to the land masses, and a second at depths between 4000 and 5000 m, corresponding to the great oceanic basins. In comparing topographic features on land with those on the sea floor it is essential to consider them with reference to these levels.
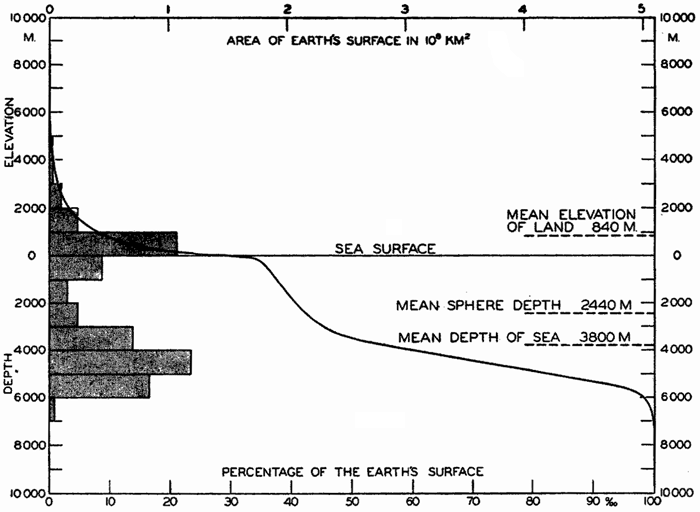
Hypsographic curve showing the area of the earth's solid surface above any given level of elevation or depth. At the left in the figure is the frequency distribution of elevations and depths for 1000-meter intervals.
One method of presenting the character of the relief of the earth's crust is by means of a hypsographic curve showing the area of the earth's solid surface above any given contour of elevation or depth. The hypsographic curve in fig. 2 is from Kossinna (1921). Although added data
The hypsographic curve of the earth's crust should not be interpreted as an average profile of the land surface and sea bottom, because it represents merely the summation of areas between certain levels without respect to their location or to the relation of elevations and depressions. Actually, the highest mountains are commonly near the continental coasts, large areas of low-lying land are located in the central parts of the continents, and the greatest depths are found near the continental masses, and not in the middle of the oceanic depressions. Entered in fig. 2 are the percentages of elevations and depressions for 1000-m intervals. These show two maxima, one just above sea level and a second between depths of 4000 and 5000 m. The significance of these maxima is discussed later (p. 23).
In table 5 are given the percentage areas of the depth zones in the three oceans, and for all oceans with and without adjacent seas. It will be noted that the shelf (0–200 m) represents a prominent feature in the Atlantic Ocean, which is also the shallowest of the oceans. By combining data in tables 4 and 5 the absolute areas of the depth zones may be computed. The hypsographic curve in fig. 2 is based on the values for all oceans, including adjacent seas.
During the geological history of the earth, great changes have occurred in the relief of the land and sea bottom. The exact nature and extent of these vertical movements is beyond the scope of the present discussion, but it should be noted that changes in relative sea level of the order of 100 m, which are readily accounted for by the withdrawal and addition of water during glacial and interglacial periods, would expose and inundate relatively large areas.
The continental shelf is generally considered to extend to depths of 100 fathoms, or 200 m, but Shepard (1939) found that the limit should be somewhat less than this; namely, between 60 and 80 fathoms (110 and
| Depth interval (m) | Including adjacent seas | Excluding adjacent seas | ||||||
|---|---|---|---|---|---|---|---|---|
| Atlantic | Pacific | Indian | All oceans | Atlantic | Pacific | Indian | All oceans | |
| 0–200 | 13.3 | 5.7 | 4.2 | 7.6 | 5.6 | 1.7 | 3.2 | 3.1 |
| 200–1000 | 7.1 | 3.1 | 3.1 | 4.3 | 4.0 | 2.2 | 2.7 | 2.8 |
| 1000–2000 | 5.3 | 3.9 | 3.4 | 4.2 | 3.6 | 3.4 | 3.1 | 3.4 |
| 2000–3000 | 8.8 | 5.2 | 7.4 | 6.8 | 7.6 | 5.0 | 7.4 | 6.2 |
| 3000–4000 | 18.5 | 18.5 | 24.0 | 19.6 | 19.4 | 19.1 | 24.4 | 20.4 |
| 4000–5000 | 25.8 | 35.2 | 38.1 | 33.0 | 32.4 | 37.7 | 38.9 | 36.6 |
| 5000–6000 | 20.6 | 26.6 | 19.4 | 23.3 | 26.6 | 28.8 | 19.9 | 26.2 |
| 6000–7000 | 0.6 | 1.6 | 0.4 | 1.1 | 0.8 | 1.8 | 0.4 | 1.2 |
| >7000 | .... | 0.2 | .... | 0.1 | .... | 0.3 | .... | 0.1 |
From the above values it may be seen that the average slope of the shelf is of the order of 2 fathoms per mile, or 0.2 per cent. This corresponds to a slope angle of about 7ʹ. Although there is a general seaward slope of the shelf, it is by no means an even-graded profile. As mentioned above, there may be terraces, ridges, hills, and depressions, and in many areas there are steep-walled canyons cutting across it. Shelf irregularities are most conspicuous off glaciated coasts, and were caused by the ice during a glacial period when this zone was exposed to glacial erosion (Shepard, 1931).
On land the slope is often more significant than the absolute range in elevation. According to Littlehales (1932) the smallest slope that the human eye can detect is 17ʹ. Therefore, except for the minor irregularities, the continental shelf would in general appear flat.
From an examination of 500 profiles, Shepard (1941) found that the inclination of the continental slope varied with the character of the coast. Continental slopes off mountainous coasts have, on the average, a slope of about 6 per cent (3°30ʹ), whereas off coasts with wide, well-drained coastal plains the slopes are about 3.5 per cent (2°0ʹ).
The submerged slopes of volcanic islands are similar to the exposed slopes of volcanic mountains, and may be as great as 50° (Kuenen, 1935). In large submarine canyons the walls are as rugged and precipitous as those of the Grand Canyon of Arizona (fig. 8, p. 40). Fault scarps above and below sea level show comparable slopes.
The average slopes of the deep-sea floor are small. Krümmel (Littlehales, 1932) found that in the North Atlantic the mean slopes varied between about 20ʹ and 40ʹ, but these are averages, or were obtained by dividing the difference in elevation by the distance between two points. Where the distances are great or when the number of soundings is small, the slopes obtained in this way do not give a true representation of the relief. The increased data now available have revealed irregularities comparable in ruggedness to the larger topographic features on land.
Major Features of Topography
The discussion of the bottom topography of the oceans will be restricted to a brief consideration of the large-scale topographic features that are represented on small charts with large contour intervals. In regions where many soundings have been obtained, it has been found that the sea bottom may be virtually as irregular as the land surface, but such details can be shown only on large-scale charts with small contour intervals, and are not included in this volume.
Submarine geology is concerned with the topography of the sea floor, the composition and physical character of the sedimentary and igneous materials that are found on the ocean bottom, and the processes involved in the development of topographic relief. The field is a relatively new one which has received great impetus from the development of sonic sounding methods that made it possible to obtain accurate maps of the sea floor, and from the development of geophysical methods (measurement and interpretation of gravity anomalies, of the earth's magnetic field, and of the path and velocity of earthquake and artificial seismic waves) that yielded estimates of the character and thickness of the materials forming the crust of the earth. However, there is yet no agreement concerning the processes involved in the geological history of the ocean basins, and the various hypotheses will not be discussed here. General reviews of the problems will be found in Johnstone (1928), Bucher (1933), Kuenen (1935), and Gutenberg (1939). A symposium on the geophysical exploration of the sea bottom (Field et al, 1938) covers many of the developments.
The distribution of elevations and depressions on the earth's crust (fig. 2) shows that there are large portions with elevations between sea level and 1000 m, and with depths between 4000 m and 5000 m. According to Bucher (1933) the larger, lower ones are related to the character of the earth's crust, while the upper ones are the result of subaerial erosion and sedimentation. The question then arises as to the extent to which the topography of the ocean bottom with reference to a depth of about 4500 m corresponds to that of the land with reference to sea level or a slightly higher level. According to Bucher, the large-scale features are essentially similar, and elevations and depressions of comparable dimensions are found both on land and on the ocean bottom. Although the major features are comparable, the details are quite different, because erosion, which plays such an all-important role in the creation of sharp relief and in the ultimate destruction of elevations on land, is virtually absent in the sea. In the sea the most effective agents of erosion are the surface waves, and these tend to produce flat-topped features that are restricted to shallow depths, since the velocity of the water particles in such waves decreases rapidly with increasing depth (p. 528). Other processes which may contribute to erosion of the sea floor are discussed in chapter XX and in the section dealing with the origin of submarine canyons (p. 41). Deposition is the characteristic process that modifies the topography of the sea bottom. Sedimentary debris accumulates in depressions, while there is little or no accumulation on topographic highs, which are devoid of fine-grained sediment and are subject to erosion if near the surface or in localities of exceptionally strong currents.
Bucher (1933) has stated that there are essentially two types of large-scale topographic features on the land and on the ocean bottom: (1) those of approximately equidimensional lateral extent, to which he applies the names swells and basins, and (2) those of elongate form, generally with steeper sides, to which he applies the names welts and furrows. On the ocean bottom the elongate welts and furrows appear to be the more common, and there is a considerable range in the size of such structures. There is a tendency for the large welts on the sea bottom to be parallel to the continental coasts, so that the oceans are divided into elongate troughs. Transverse ridges in turn subdivide these major depressions into a series of basins that are separated from one another to a greater or lesser degree. This ridge and basin topography is clearly shown by the bottom of the Atlantic Ocean and the Indian Ocean and in the western part of the Pacific Ocean, but does not appear to be so conspicuous a feature in the main part of the Pacific.
Within the smaller welts and furrows, the steepest slopes, the highest elevations, and the greatest depths are found. The welts and furrows are commonly close together, with arced outlines, and are characteristically found near the continents. The deep furrows are generally on the convex
Terminology of Submarine Topography
The terms applied to features of submarine topography will be classified according to the origin of the features rather than according to their size, although the latter procedure is the common one (for example, Niblack, 1928, Littlehales, 1932). The features of submarine relief may be grouped in two main categories, depending upon whether they have gained their characteristic form through diastrophic activity (crustal movements) or through erosion or deposition. The primary large-scale process involved in the development of relief must be diastrophic, but in many cases the characteristic feature is produced by erosion or deposition. No distinction will be made here between features that have been formed below the sea surface and those that may possibly owe their origin to subaerial erosion or deposition. As pointed out before, deposition in the sea tends to fill in the depressions and thus to level out the minor irregularities of the bottom, and, with the exception of those cases in which organisms play an important role (for example, in the formation of coral reefs), little or no deposition takes place on topographic highs.
There has been much discussion as to the processes that have led to the formation of the continental and insular shelves. Some authors maintain that they are wave-built (depositional); others consider that they are wave-cut (erosional), or that they are a combination of both processes (Johnson, 1919; Shepard, 1939). Geophysical studies on the two sides of the North Atlantic (Bucher, 1940) indicate that the shelves are composed of great prism-shaped accumulations of sedimentary rock that at the outer edge of the shelf bordering the eastern United States are 4000 m thick. To what extent these features resulted from the slow accumulation and sinking of the crust and to what extent violent diastrophic movements have been involved has not yet been decided. The characteristic form of the shelf and of isolated flat-topped banks and shoals, and other features of the shallow bottom indicate that wave erosion and transportation by currents have played an important part
The terms used to designate certain types of topographic features, their French and German equivalents, and their definitions, which are given below, correspond to those suggested by the International Hydrographic Bureau (Niblack, 1928). Unfortunately, there is still considerable confusion in the use of certain terms, particularly those which apply to the larger features of the topography. Sometimes several different descriptive terms have been applied to the same structure, and in other instances the same term is applied to features of vastly different size and probably of different origin. A committee of the International Association of Physical Oceanography (Vaughan et al, 1940) attempted to clarify many of the problems relating to the terminology, but much confusion still prevails. In order to designate any individual feature, the descriptive term is prefixed by a specific name. The specific names attached to large-scale features are generally geographical, but those assigned to such features as banks, shoals, seamounts, canyons, and sometimes deeps are often those of vessels or individuals associated with their discovery or mapping.
Features Resulting from Crustal Deformation
Elevations. The large-scale elevations of the ocean bottom are termed ridges, rises, or swells.
Ridge (F, Dorsale; G, Rücken). A long and narrow elevation with sides steeper than those of a rise.
Rise (F, Seuil; G, Schwelle). A long and broad elevation which rises gently from the ocean bottom.
Isolated mountain-like structures rising from the ocean bottom are known as seamounts. Where the ridges are curved, and particularly if parts of them rise above sea level, they are sometimes termed arcs. The broad top of a rise is termed a plateau. The expression sill is applied to a submerged elevation separating two basins. The sill depth is the greatest depth at which there is free, horizontal communication between the basins.
Depressions. The terms trough, trench, and basin are those most commonly applied to the large-scale depressions on the ocean bottom.
Trough (F, Dépression; G, Mulde). A long, broad depression with gently sloping sides.
Trench (F, Fossé; G, Graben). A long and narrow depression with relatively steep sides.
Basin (F, Bassin; G, Becken). A large depression of more or less circular or oval form.
The terms defined above are used rather loosely and are applied to features of a wide range in size.
For those parts of a depression which exceed 6000 m in depth, the term deep (F, Fosse; G, Tief) is used. As originally suggested by Murray, the term designated areas where the depths exceeded 3000 fathoms (5486 m), but it is now generally restricted to those depressions of greater depth (Vaughan et al, 1940). The term depth (F, Profondeur; G, Tiefe), prefixed by the name of the vessel concerned, may be used to designate the greatest sounding obtained in any given deep.
Features Resulting from Erosion, Deposition, and Biological Activity
As pointed out above, the features in this category have been produced by erosion of, or deposition upon, structures which may be primarily of diastrophic origin. The most prominent types of features in this group are the shelf and the slope.
Shelf. The zone extending from the line of permanent immersion to the depth, usually about 120 m, where there is a marked or rather steep descent toward the great depths. Continental Shelf (F, Plateau continental; G, Kontinental-Schelff) is applied to the feature bordering the continents, while Insular Shelf (F, Socle; G, Insel-schelff) is used for the feature surrounding islands.
Slope. The declivity from the outer edge of the shelf into deeper water. Continental Slope (F, Talus continental; G, Kontinental-Abfall) and Insular Slope (F, Talus insulaire; G, Inselabfall) are applied to the slopes bordering continents or islands.
The following terms are applied to the upper parts of elevations which show the effects of erosion or deposition.
Bank (F, Banc; G, Bank). A more or less flat-topped elevation over which the depth of water is relatively small, but which is sufficient for surface navigation.
Shoal (F, Haut-fond; G, Untiefe or Sandgrund). A detached elevation with such depths that it is a danger to surface navigation and which is not composed of rock or coral.
Reef (F, Récif; G, Riff). A rocky or coral elevation (generally elongate) which is dangerous to surface navigation. It may extend above the surface.
A variety of names has been applied to the steep-walled fissures that penetrate the slope and cut across the shelf. The most commonly used terms are canyon and valley, but gully, gorge, and mock-valley are also applied to these features.
In addition to the terms given above, many expressions are employed in descriptions of submarine topography with the same meanings that they have when used for land topography.
Bottom Configuration of the Oceans
The major features of the topography of the ocean bottom are of such large dimensions that they are readily shown on a chart with contour intervals 1000 m apart. Such a representation is given in chart I, where the contours are entered for 1000-m intervals between 3000 m and 7000 m. The areas with depths less than 3000 m represent a rather small part of the sea floor, and the complex nature of the contours for depths less than this would confuse rather than add to the value of a chart of this kind. The topography is based upon the most recent charts available, and primarily upon the bathymetric chart prepared by the International Hydrographic Bureau in 1939 (Vaughan et al, 1940). Other sources that may be consulted for details concerning the configuration of the ocean floor are listed on page 29. It will be noted that the complexity of the topography varies in different regions. This difference must be attributed, in part, at least, to the variable amount of data available, because in those regions where the soundings are widely spaced the contours will be smooth and rounded, whereas in those areas where there are numerous soundings the contours are more complex and irregular. The Atlantic Ocean, the central part of the North Pacific Ocean, the Northern Indian Ocean, and the area surrounding Antarctica are fairly well sounded, but in many other regions, such as the North Polar Sea and the Southern Indian and South Pacific Oceans, the observations are very sparse. The increase in the complexity of the known topographic features that follows the accumulation of more depth measurements can be seen by comparing recent bathymetric charts with those published in the early years of the present century. The status of bathymetric knowledge in 1937 is shown by a series of charts in Vaughan et al (1937).
As stated above, the topography of the ocean bottom is characterized by depressions and elongated ridges. Some of these features are of very
A longitudinal ridge, the Indian Ridge, is present in the Indian Ocean and extends from India to Antarctica, but differs from the one in the Atlantic Ocean in that it is wider and does not extend so near the surface. In the Pacific Ocean the longitudinal elevations are not so conspicuous; however, the West Pacific Ridge, which is actually composed of several shorter ridges, can be traced from Japan to Antarctica, and is continuous at depths less than 4000 m except for breaks at 11°N, 10°S, and 53°S. A second elevation extends from Central America to the south and west, reaching Antarctica in the longitude of New Zealand. This East Pacific Ridge is continuous at depths less than 4000 m and separates the central depression from the deep basins bordering Central and South America and the Pacific Antarctic Basin. The effect of these major elevations on the distribution of bottom-water temperatures is shown in fig. 211, p. 749.
Within the major depressions or troughs which are bordered by the continents and the longitudinal ridges are transverse ridges that separate to a greater or lesser degree a number of basins. Wüst (Vaughan et al, 1940) has suggested that the 4000-m contour be used as the boundary in designating basins, but this is a purely arbitrary delimitation that places undue emphasis upon the absolute depth rather than upon the relative relief, which in many instances is of greater significance. For example, the Mediterranean Sea Basin is virtually excluded from such a classification, although it is a deep, isolated basin, much of it extending more than 3000 m below the sill in the Strait of Gibraltar. In the tabulation accompanying chart I are listed the names for the major parts of the oceanic depressions which Wüst has termed basins; namely, those parts which have depths exceeding 4000 m. Certain individual basins are clearly
In the tabulation of the basins given on chart I are listed some of the more prominent deeps; namely, those features where the depths exceed 6000 m. Some deeps are located more or less centrally in the large basins; for example, Wharton Deep, Byrd Deep, and the numerous deeps in the central part of the North Pacific, but these rarely exceed 7000 m in depth. On the other hand, numerous deeps of elongate character are located near and parallel to continental coasts, island arcs, or submarine ridges which correspond to the furrows discussed on p. 23. These marginal deeps, to which the term trench or sometimes trough is applied, are the features within which the greatest depths are found, in nearly all cases exceeding 8000 m. Only one such trench is found in the Indian Ocean; namely, the Sunda Trench. In the Atlantic are to be found the Romanche Trench, the South Sandwich Trench, and the Puerto Rico and Cayman Troughs. The greatest number are in the western part of the Pacific Ocean, although there is a chain of such features paralleling the mountainous coast of parts of Central and South America. As stated before, the regions in which these deep trenches occur are sites of volcanic and seismic activity. The complex topography of the East Indian Archipelago, which has been described by Kuenen (1935), is shown schematically in fig. 208, p. 736.
For a detailed description of the features of the sea bottom the reader should consult Littlehales (1932). Vaughan (1938) has described the topography of the Southern Hemisphere. There is much information of value in the large report by Vaughan and others (1940), which also contains the small-scale bathymetric chart prepared by the International Hydrographic Bureau on a Mercator projection, a special chart of the North Pacific prepared by the U. S. Hydrographic Office, and an excellent, detailed chart of the Caribbean Sea region prepared by the same agency. The standard charts on the bathymetry of the oceans are those in the series known as the Carte Générale Bathymétrique des Océans, published by the International Hydrographic Bureau at Monaco. These charts comprise twenty-four sheets which are revised from time to time
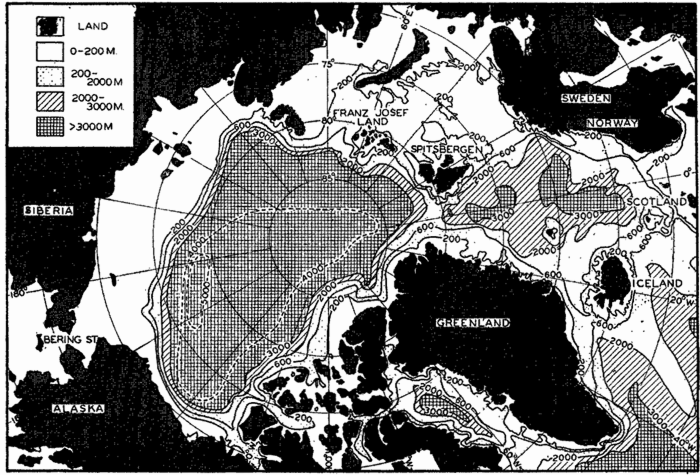
Polar projection of the Arctic regions showing the generalized topography of the sea bottom. (Cherevichny's soundings of 1941 not included.)
Bottom Configuration of the Arctic and Antarctic Regions
Fig. 3 has been prepared to show the submarine topography of the North Polar regions, which cannot be properly visualized from the interrupted projection used in chart I. The figure is based on a chart by Stocks (1938) and incorporates all of the available data. Because of the larger scale it is possible to show the contours for the shallower depths that form such a large part of this area. The conspicuous topographic
Very little is known of the topography of the North Polar Basin, and the form of the contours is largely hypothetical. Soundings greater than 3000 m are fairly numerous to the north of Europe, and there are some to the north of Alaska. A line of soundings also extends from the Pole and parallels the east coast of Greenland. These soundings were obtained by the Russian expedition which landed on the ice from planes and, in 1937–1938, drifted with the pack ice until picked up off the east coast of Greenland. Within 100 km of the Pole, this party obtained a sounding of 4300 m. The 5000-m contour is inserted on the basis of a single sounding of 5440 m obtained in 1927 by Sir Hubert Wilkins, who flew out by plane from Alaska, landed on the ice, and measured the depth with a portable sonic sounding instrument. The correctness of this sounding appears doubtful, however. In April, 1941, the Russian aviator Cherevichny, who landed on the ice in three different localities to the north of Wrangel Island and spent from three and a half to six days in each place, obtained much smaller depths (unpublished data communicated through the American Russian Institute, San Francisco, California). Cherevichny's soundings are as follows:
| Latitude, north | Longitude | Depth, m |
|---|---|---|
| 81°02ʹ | 180°00ʹE | 2647 |
| 78 30 | 176 40 E | 1856 |
| 80 00 | 170 00 W | 3430 |
These soundings were not available when the bathymetric chart of the Arctic region (fig. 3) was prepared.
The more or less elliptical North Polar Basin is connected with the Norwegian Basin by a fairly deep channel between Greenland and Spitsbergen, in which the sill depth is about 1500 m (table 6). The Norwegian Basin, in which there are two depressions with depths exceeding 3000 m, is separated from the open Atlantic by a ridge extending from Greenland to Scotland, from which Iceland and the Faeroe Islands rise above sea level. The sill depths in Denmark Strait, between Greenland and Iceland, and over the Wyville Thomson Ridge, between the Faeroes and Scotland, are about 500 m. Rising from the floor of the Norwegian Basin is an isolated elevation that extends above the surface as Jan Mayen Island.
Another depression of considerable magnitude that does not appear on chart I is in Baffin Basin between Baffin Island and Greenland, where the depths exceed 2000 m. This basin is separated from the open Atlantic by a ridge in Davis Strait between Baffin Island and Greenland, where the sill depth is about 700 m.
Interesting topographic features which are well developed in the Arctic regions are the “troughs” that cut across the shelf. These U-shaped furrows were apparently cut by glaciers at a period when the sea surface stood at a lower level. One such trough extends around the southern tip of Norway, and others may be traced by the irregularities of the 200-m contour to the north of Russia and between the islands of the Canadian Archipelago. Nansen (1928), in a discussion of the topography of the North Polar Basin, has described these features.
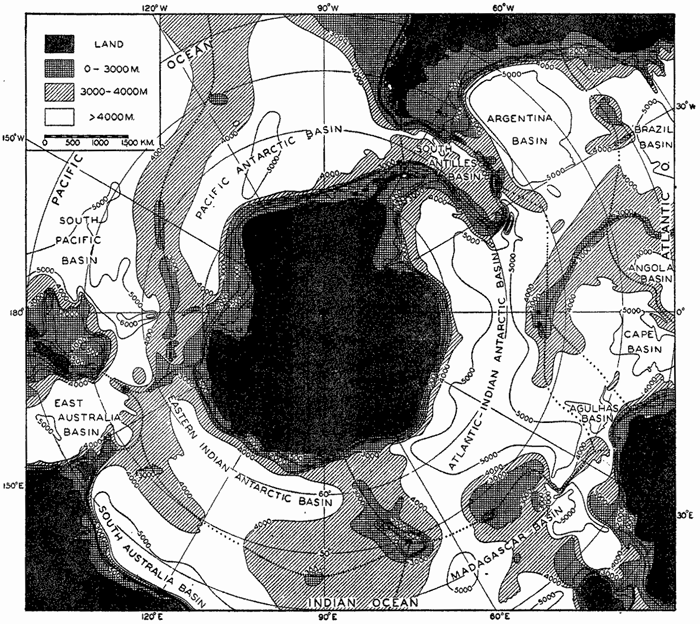
Polar projection showing the generalized sea-bottom topography of the Antarctic regions. Depths less than 4000 m shaded. Heavy dotted lines show the location of the elevations which separate the various basins. Contours at depths of 3000 m and more Correspond to those in chart I.
Fig. 4 is a polar projection of the Antarctic regions which shows the relationships between the major features of the submarine topography that cannot be visualized from chart I. The topography is based on the same data used for the preparation of chart I supplemented from other sources. All major depressions are also shown in the world map, but it has been possible to enter in this figure the contours above 3000 m. There are many striking differences between the topography of the North
The deep basins extend close to the continent of Antarctica, and the slopes are relatively steep. Joining South America to Antarctica is the South Antilles Arc, upon which are located South Georgia, South Sandwich, South Orkney, and South Shetland Islands. The ridge is continuous at 4000 m, and at 3000 m there are only relatively narrow openings. The Atlantic Ridge does not extend as far south as Antarctica, but is terminated in the vicinity of Bouvet Island. The ridge to the south of Africa and Madagascar is known as the Crozet Ridge, after the island of that name that rises from it. Forming a part of the Indian Ridge is the conspicuous elevation surrounding Kerguelen Island known as the Kerguelen Ridge. The ridge extending from Australia to Antarctica supports Macquarie Island and is known as the Macquarie Ridge. The importance of these ridges in determining the distribution of properties and the character of the circulation around Antarctica is discussed in chapter XV, p. 610 et seq. The greatest depths found in the region shown in fig. 4 are in the Byrd Deep to the south of New Zealand and in the South Sandwich Trench on the convex side of the South Antilles Arc.
Bottom Configuration of Adjacent Seas
It is beyond the scope of this volume to present charts or descriptions of the many marginal and adjacent seas. In table 4 are listed the area, volume, and mean depth of some of these features. The adjacent seas of the Arctic regions are shown in fig. 3, and in figs. 5 and 6 are shown the generalized topographies of the European and American Mediterraneans. Details of the topography of other marginal areas are presented elsewhere. The degree of isolation—namely, the extent to which free exchange of water with the adjacent ocean is impeded by the presence of land or submarine barriers—plays an important role in determining the characteristic distribution of properties in such regions (see chapters IV and XV).
The European Mediterranean, which comprises the Mediterranean Sea, the Black Sea, and the waters connecting them (namely, the Dardanelles, the Sea of Marmora, and the Bosporus) forms an intercontinental sea bordered by Europe, Asia, and Africa. The Mediterranean Sea occupies a deep, elongated, irregular depression with an east-west trend, and the Black Sea occupies a small and topographically simpler depression offset to the north. The Black Sea Basin, with depths exceeding 2200 m, is virtually isolated from the Mediterranean Sea proper, the connection
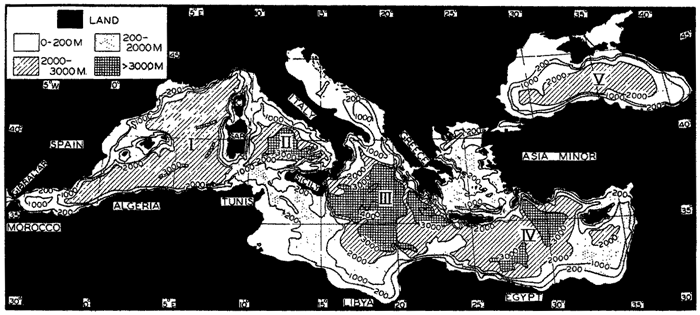
Generalized bottom topography of the European Mediterranean. The larger basins are (I) Algiers-Provençal, (II) Tyrrhenian, (III) Ionian, (IV) Levantine, and (V) Black Sea Basin.
The generalized topography of the European Mediterranean is shown in fig. 5, which is based on a chart prepared by Stocks (1938). The Black Sea Basin (V) is of more or less elliptical form except in the north, where there are irregular shallow seas of which the largest is the Sea of Azov, east of the Crimean Peninsula. The connection with the Mediterranean Sea is through the Bosporus, the Sea of Marmora, and the Dardanelles into the Aegean Sea, where the irregular topography is reflected in the large number of islands. The Mediterranean Sea Basin is subdivided by a series of transverse ridges with a north-south trend, parts of which extend above sea level. The primary division into the western and eastern depressions is effected by a ridge extending from Europe to Africa—namely, Italy, Sicily, and the submerged part of the elevation between these land areas and Africa. The sill depth in the strait between Sicily and Tunis is about 400 m. The Western Mediterranean, in turn, is subdivided into the Algiers-Provençal Basin (I) and the Tyrrhenian Basin (II) by the ridge extending from northwestern Italy to Tunis, from which Corsica and Sardinia rise above the sea surface. The Eastern Mediterranean is subdivided into two major depressions: the Ionian Basin (III), in which maximum depths of 4600 m are found,
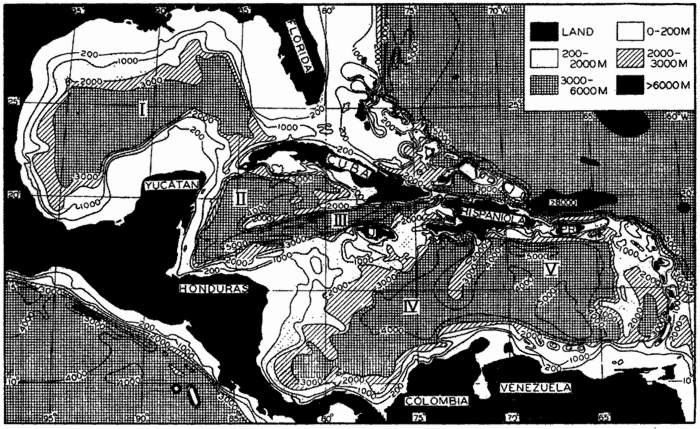
Generalized bottom topography of the American Mediterranean. The larger basins are (I) Mexico Basin; (II) Cayman Basin and (III) Cayman Trough, in the Western Caribbean; (IV) Colombia Basin and (V) Venezuela Basin, in the Eastern Caribbean. The greatest known depth in the Atlantic Ocean, 8750 m, is located in the Puerto Rico Trough to the north of Puerto Rico.
The American Mediterranean encompasses the partially isolated basins of the wide gulf bordered by North, Central, and South America which are separated from the open Atlantic by ridges, parts of which rise above sea level. The generalized topography of the region is shown in fig. 6, which is based on a chart by Stocks (1938). The chief difference between the European Mediterranean and the American Mediterranean is that the latter has numerous shallow and several deep connections with the open Atlantic. The topography of the American Mediterranean is extremely rugged, with deep trenches adjacent to steep-sided ridges, many of which rise above sea level. This is particularly true in the central and southern parts of the region, which are areas of pronounced gravity anomaly, volcanism, and strong seismic disturbances (Field et al, 1938). Bordering the low-lying coast of the Gulf of Mexico, off part of Honduras and Nicaragua, and surrounding the Bahama Islands are extensive shelves. The slopes leading down to deep water are in general rather steep, particularly between Cuba and Jamaica and along the
The American Mediterranean is subdivided into two major depressions, the Gulf of Mexico and the Caribbean Sea, by a ridge between Yucatan and Cuba, and by the island of Cuba. The sill depth in the Yucatan Channel is less than 1600 m. The Mexico Basin (I) is a relatively simple depression lacking the irregularities that characterize the topography of the Caribbean region. Maximum depths of nearly 4000 m are found in the western part of the basin. The Caribbean region is separated into two major basins, the Western and the Eastern Caribbean, by the Jamaica Rise, which extends from Honduras to Hispaniola and from which Jamaica rises above the surface. The Western Caribbean is in turn divided into Yucatan Basin (II) and the Cayman Trough (III) by the Cayman Ridge, which extends westward from the southern extremity of Cuba. The Cayman Trough is the deepest depression in the American Mediterranean, and within the Bartlett Deep to the south of Cuba the U.S.S. S-21 obtained a maximum sounding of 7200 m. The Windward Passage between Cuba and Hispaniola appears to be a continuation of the depression forming the Cayman Trough. The greatest saddle depth between the Western and Eastern Carribbean is located in the passage between Jamaica and Hispaniola, where it is about 1200 m. The Eastern Caribbean is partially divided into two basins by the Beata Ridge, which extends south and west from Hispaniola toward South America. The western portion of the depression is known as the Colombia Basin (IV) and the eastern as the Venezuela Basin (V). The Aves Swell separates a small basin with depths greater than 3000 m in the eastern part of the Venezuela Basin, which is called the Grenada Trough.
The terminology to be applied to the features of the American Mediterranean is discussed by Vaughan in the report by Vaughan et al (1940), which also includes an excellent bathymetric chart of the Caribbean region prepared by the U. S. Hydrographic Office. The currents and distribution of properties in this area are described in chapter XV, p. 637.
| Basin | Max. depth (m) | Adjacent deep depression | Surface feature | Location of sill | Sill depth (m) | Max. depth — sill depth (m) |
|---|---|---|---|---|---|---|
| Arctic Mediterranean Region | ||||||
| North Polar Basin | 5400 | North Pacific | Bering Strait | Siberia-Alaska | 55 | .... |
| Norwegian Basin | Greenland-Spitsbergen | 1500 | 3900 | |||
| Norwegian Basin | 3700 | North Atlantic | Denmark Strait | Greenland-Iceland | 500 | 3200 |
| North Atlantic | Faeroe Is.-Scotland | 500 | 3200 | |||
| Baffin Basin | 2200 | North Atlantic | Davis Strait | Baffin Is.-Greenland | 700 | 1500 |
| European Mediterranean Region | ||||||
| Western Mediterranean Basin | 3700 | North Atlantic | Strait of Gibraltar | Gibraltar-Morocco | 320 | 3400 |
| Eastern Mediterranean Basin | 4600 | Western Mediter-ranean | Sicily-Tunis | 400 | 4200 | |
| Black Sea Basin | 2200 | Eastern Mediter-ranean | Bosporus | 40 | ||
| Dardanelles | 70 | 2200 | ||||
| American Mediterranean Region | ||||||
| Eastern Caribbean Basin | 5500 | North Atlantic | Anegada and Jungfern Passages | Virgin Is.-Lesser Antilles | 1600 | 3900 |
| Western Caribbean Basin | 7200 | North Atlantic | Windward Passage | Cuba-Hispaniola | 1600 | 5600 |
| Eastern Caribbean | Jamaica Channel | Jamaica-Hispaniola | 1200 | .... | ||
| Mexico Basin | 3900 | Western Caribbean | Yucatan Channel | Yucatan-Cuba | 1600 | 2300 |
| North Atlantic | Strait of Florida | Florida-Bahama Is | 800 | .... | ||
| Other Regions | ||||||
| Japan Sea Basin | 3700 | Philippines Basin | Tsushima Strait | Korea-Japan | 150 | 3550 |
| Red Sea Basin | 2800 | Indian Ocean | Strait of Bab-el-Mandeb | Somaliland-Arabia | 100 | 2700 |
| Baltic Sea Basin | 300 | North Atlantic | Danish Sounds | Danish Is.-Germany | 20 | 280 |
Isolated basins are of great interest from an oceanographic point of view, and in table 6 are brought together some of the data relating to the larger basins in adjacent seas. This tabulation does not include the basins in the East Indian Archipelago, which are discussed elsewhere (table 87, p. 738). The maximum depth within each basin and the greatest sill depth at which there is horizontal communication with the adjacent basins are listed as well as the difference between the greatest depth in the basin and the sill depth. The latter value corresponds to the depth of the “lake” that would be formed if the water level were lowered to the greatest sill depth. It will be seen that most of the basins listed are without horizontal communication through vertical distances of 3000 to 4000 m, and that in the Yucatan Basin the greatest depth is 5600 m below the sill. In great contrast to these deep basins is the Baltic Sea (average depth, 55 m), where depths greater than 300 m are restricted to small, isolated depressions and where the sill depth is only 20 m.
In fig. 7 is shown the topography of the area off the coast of Southern California. This coastal area is one of considerable interest in that it is physiographically similar to the adjacent land area and apparently represents a down-warped portion of the continent. The continental shelf is relatively narrow, and offshore is a series of basins and ridges upon which several islands are located. In the southern part the real continental slope leading down to the oceanic abyss is approximately 150 miles from the coast. This is not shown in the map. Several small canyons are also depicted in the figure.
Submarine Canyons
For many years it has been known that there were furrows cutting across the shelf in certain regions, but only since it became possible to obtain large numbers of accurately located soundings of the shelf and slope were such features found to be numerous and widespread. Variously termed canyons, valleys, mock-valleys, and gullies by different authors, they have stimulated a great deal of interest among geologists, and a large literature has been built up dealing with the character and mode of formation of these canyons. The data concerning the topography of the canyons have largely been obtained by national agencies engaged in the careful mapping of nearshore areas. Such data have been used by Veatch and Smith (1939) and by Shepard and Emery (1941) to prepare general and detailed topographic charts of the canyons off the east and west coasts of the United States. Stetson (1936) has carried out independent observations on the east coast, and Shepard
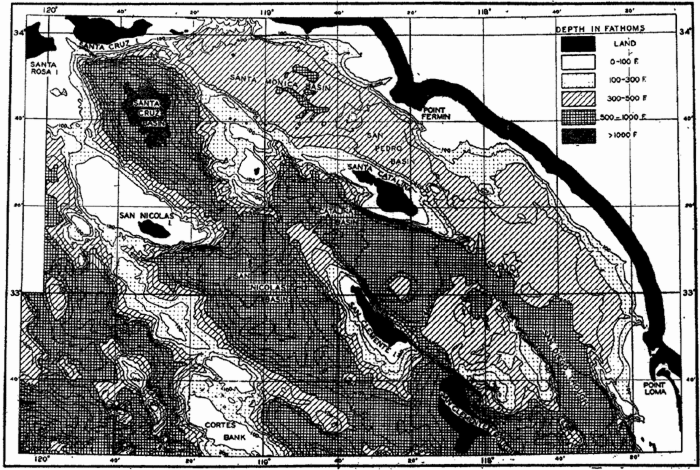
Topography of a part of the very irregular sea bottom off the coast of southern California where there is a basin and ridge topography very similar to that on the adjacent land. Depths in fathoms (after Revelle and Shepard, 1939).
Although the terms listed above have been used more or less synonymously, the size and general character of the canyons vary greatly. Some of them off the mouths of rivers, such as the Hudson (fig. 9), Congo, and Indus Canyons, have depressions that can be traced across the shelf and even into the mouths of the rivers. Some canyons extend across the shelf, but others—for example, many of those shown in the charts prepared by Veatch and Smith—are limited to gashes in the continental slope and do not cut far across the shelf. The upper parts of the canyons are generally found to be steep-walled, V-shaped in profile, with the bottom sloping continuously outward (fig. 8). Some are winding, and many show a dendritic pattern, having smaller tributary canyons. In size they vary from small gullies to vast structures of the same dimensions as the Grand Canyon of the Colorado River (fig. 8).
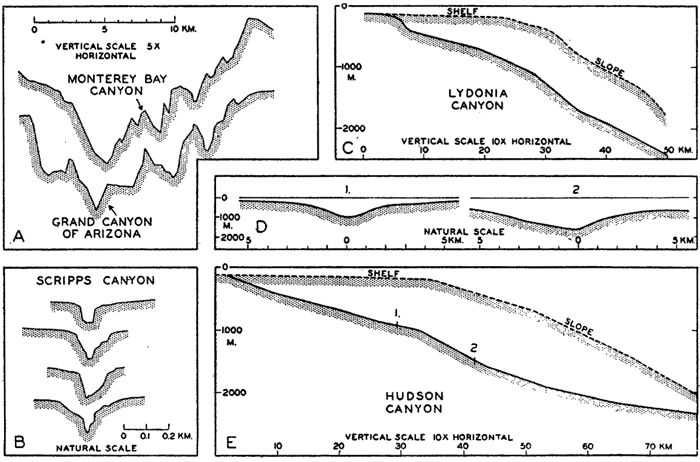
Profiles of submarine canyons. (A) Transverse profile of the submarine canyon in Monterey Bay compared to a profile of the Grand Canyon of the Colorado River in Arizona (cf. fig. 10). (B) Transverse profiles of a small, steep-walled canyon off the southern California coast. (C) Longitudinal profiles of the Lydonia Canyon and the adjacent shelf and slope. (D) and (E) Transverse and longitudinal profiles of the Hudson Canyon, showing the relation to the adjacent shelf and slope. The locations of the transverse sections (D) are shown on the longitudinal profile. Note the vertical exaggeration in certain of the diagrams and the differences in horizontal scales (A and B after Shepard, 1938; C, D, and E after Veatch and Smith, 1939).
The steep walls of the canyons are generally free of unconsolidated sediment, and in those canyons where special investigations have been made the walls appear to be generally of sedimentary rock; in a few cases (for example, Monterey Canyon off the California coast, fig. 10) the canyons are cut into granite that is overlain by sedimentary rock. The sediments in the bottom of the canyons are generally coarser than those on the adjacent shelves, and in some of them cobbles and gravel have been found.
The following agencies have been advanced as possible causes for the formation of the canyons:
Diastrophism.
Erosion by submarine currents. Daly (1936) advanced the theory that “density currents” produced by suspension of much fine-grained sediment may have flowed down the slope and cut the canyons, particularly during intervals of lowered sea level during the glacial periods. Density currents occur in reservoirs, but there is no evidence of their existence in the sea, where the density stratification of the water impedes vertical flow.
Spring sapping. Johnson (1939), in a thorough review of the literature concerning the character and origin of submarine canyons, develops the hypothesis that solution and erosion resulting from the outflow of underground water might contribute to the formation of the canyons.
Mudflows and landslides. Mudflows are known to occur in the canyons (Shepard and Emery, 1941) and are agents which tend to keep the canyons clear of unconsolidated debris, but it is doubtful whether they are capable of eroding rock.
Tsunamis or earthquake waves (p. 544). Bucher (1946) pointed out that most of the currents that might be found in canyons are of relatively low velocity and are therefore incapable of active erosion of rock. As a possible explanation of the submarine origin of the canyons he suggested that the rapid currents associated with earthquake waves set up in the sea by violent seismic motion of the sea bottom might be effective agents.
Subaerial erosion. The five explanations listed above are compatible with the formation of the canyons below the sea surface. Because of their many resemblances to river-cut canyons on land, many investigators, notably Shepard, believe that the canyons must have had a subaerial origin. However, there is no accepted geological theory that would account for the world-wide exposure of the shelf and slope within relatively recent geological time. To overcome this difficulty, Shepard has suggested that during the ice ages the amount of water removed from the ocean and deposited as ice caps may have been much greater than ordinarily believed (p. 25).
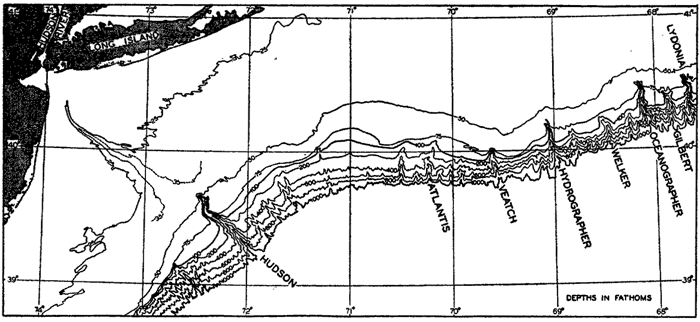
Topography of the shelf and slope off part of the eastern coast of the United States showing different types of submarine canyons. The Hudson Canyon can be traced far across the shelf; others, such as the Lydonia, Oceanographer, and Hydrographer Canyons, cut into the outer margin of the shelf, while others are restricted to the slope itself. Depth contours in fathoms. (Simplified from chart in Veatch and Smith, 1939.)
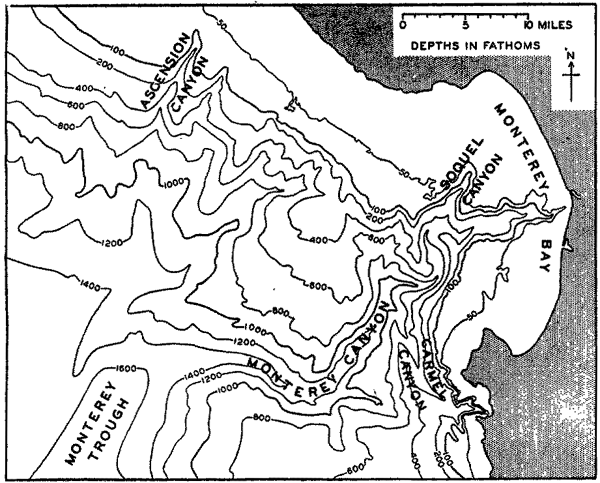
Monterey Canyon off the coast of California.
Shepard (Shepard and Emery, 1941) has carefully evaluated the arguments in favor of and opposed to these various hypotheses concerning the origin of submarine canyons, and he concludes that no single hypothesis yet advanced can account for their characteristic features. Problems also exist concerning the processes which remove the sedimentary debris that must be swept into the canyons from the shelf. Mudflows and transportation by currents are known to be operative, but their effectiveness has not yet been determined.
Shorelines
The study of the development of shorelines has been carried out by geologists and physiographers who have classified the different types of coasts largely upon the basis of the extent to which erosion and deposition have affected the coastal configuration. Johnson (1919, 1925) has described the characteristic features of the coast and shallow-water zone, and these and other sources should be consulted in order to appreciate the complex nature of the transition zone between land and sea, where the effects of erosion and deposition, both subaerial and marine, must be
The classification of shorelines has been treated by Johnson (1919) and Shepard (1937). Shepard's primary classification is based upon a consideration of the following factors:
Primary or youthful coasts with configurations due mainly to nonmarine agencies.
Those shaped by terrestrial erosion agencies and drowned by deglaciation or down-warping.
Those shaped by terrestrial depositional agencies such as rivers, glaciers, and wind.
Those shaped by volcanic explosions or lava flows.
Those shaped by diastrophic activity.
Secondary or mature coasts with configurations primarily the result of marine agencies.
Those shaped by marine erosion.
Those shaped by marine deposition.
The beach is defined as the zone extending from the upper and landward limit of effective wave action to low-tide level. Consequently, the beach represents the real transition zone between land and sea, since it is covered and exposed intermittently by the waves and tides. The characteristics of beaches depend so much upon the nature of the source material composing their sediments and the effects of the erosion, transportation, and deposition by waves and currents that they can be more profitably discussed in the chapter on marine sedimentation. The upper part of the beach is covered only during periods of high waves, particularly when storms coincide with high spring tides. The slope of the beach is largely determined by the texture of the sediments (p. 1018), but the extent of the beach will depend upon the range in tide. The terminology applied to the various parts of the beach and the adjacent regions is shown in fig. 11, taken from a report by the Beach Erosion Board (U. S. Beach Erosion Board, 1933).
Beaches composed of unconsolidated material are characteristically regions of instability. Every wave disturbs more or less of the smaller sedimentary particles, and the character of the waves will determine whether or not there is a net removal or accretion of sediment in any
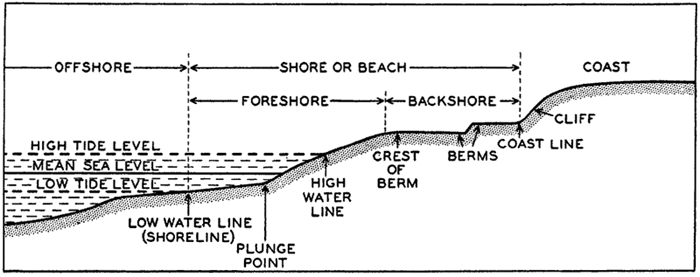
Terminology applied to various parts of the beach profile. Berms are small impermanent terraces which are formed by deposition during calm weather and by erosion during storms. The plunge point is the variable zone where the waves break, hence its location depends on the height of the waves and the stage of the tide.
Although subject to short-period disturbances, the beach in general represents an equilibrium condition, despite the slow erosion of the coast or the permanent deposition that may be taking place. If the normal interplay of waves and currents is impeded in any way, as by the building of piers, breakwaters, or jetties, the character of the beach may be entirely changed. In some instances, highly undesirable erosion of the coast may result, and in others equally undesirable deposition may result. These changes will proceed until a new equilibrium is established that may render the value of the structure worthless for the purpose for which it was originally intended. The construction of breakwaters, jetties, sea walls or groins, and similar structures on an open coast should be undertaken only after a careful investigation of the character and source of the sedimentary material, the prevailing currents, the strength and direction of the waves, and other factors that determine the equilibrium form of the beach. The Beach Erosion Board of the U. S. Army, Corps of Engineers, as well as various private organizations, are engaged in studies of this type.
Bibliography
Bencker, H.1930. “The bathymetric soundings of the oceans” . Hydrographic Review, v. 7, no. 2, p. 64–97, 1930. Monaco.
Bucher, Walter H.1933. The deformation of the earth's crust. Princeton Univ. Press, 518 pp., 1933.
Bucher, Walter H.1940. “Submarine valleys and related geologic problems of the North Atlantic” . Geol. Soc. Amer., Bull., v. 51, p. 489–512, 1940.
Daly, Reginald A.1934. The changing world of the ice age. New Haven, Yale Univ. Press, 271 pp., 1934.
Daly, Reginald A.1936. “Origin of submarine “canyons.”” Amer. Jour. Sci., v. 31, p. 401–420, 1936.
Field, Richard M., et al.1938. “Symposium on the geophysical exploration of the ocean bottom arranged by the American Geophysical Union” . Amer. Philos. Soc., Proc., v. 79, p. 1–144, 1938.
Fowle, Frederick E.1933. “Smithsonian physical tables” . Smithsonian Misc. Coll, v. 88, 682 pp., 1933.
Gutenberg, Beno, ed. 1939. “Internal constitution of the earth” . v. 7 of Physics of the Earth. (Nat. Research Council.) New York, McGraw-Hill, 413 pp., 1939.
International Hydrographic Bureau. 1937. “Limits of oceans and seas” . Internat. Hydrogr. Bur., Spec. Pub. no. 23, 2d ed., 25 pp., 1937.
Johnson, Douglas W.1919. Shore processes and shoreline development. New York, Wiley & Sons, 584 pp., 1919.
Johnson, Douglas W.1925. The New England-Acadian shoreline, New York, Wiley & sons, 608 pp., 1925.
Johnson, Douglas W.1939. The origin of submarine canyons. New York, Columbia Univ. Press, 126 pp., 1939.
Johnstone, James. 1928. An introduction to oceanography. Liverpool, University Press, 368 pp., 1928.
Kossinna, Erwin. 1921. Die Tiefen des Weltmeeres. Berlin Univ., Institut f. Meereskunde, Veröff., N. F., A. Geogr.-naturwiss. Reihe, Heft 9, 70 pp., 1921.
Kuenen, Ph. H., 1935. “Geological interpretation of the bathymetrical results. Snellius Exped. in the eastern part of the Netherlands East Indies 1929–1930” , v. 5, Geological Results, pt. 1, 123 pp. and charts, 1935. Utrecht.
Littlehales, G. W.1932. “The configuration of the oceanic basins” . p. 13–46 in Physics of the Earth, v. 5, Oceanography. Nat. Research Council, Bull. no. 85, 1932. Washington, D. C.
Nansen, Fridtjof. 1928. “The oceanographic problems of the still unknown Arctic regions” . p. 3–14 in: Problems of Polar Research. Amer. Geogr. Soc., Spec. Pub. no. 7, 479 pp., 1928. New York.
Niblack, A. P.1928. “Terminology of submarine relief” . Hydrographic Review, v. 5, no. 2, p. 1–23, 1928. Monaco.
Raisz, Erwin. 1938. General cartography. New York, McGraw-Hill. 370 pp., 1938.
Revelle, Roger, and F. P. Shepard. 1939. “Sediments off the California coast” . p. 245–282 in: Recent Marine Sediments, A symposium. Amer. Assn. Petrol. Geol.736 pp., 1939. Tulsa.
Schott, G.1926. Geographie des Atlantischen Ozeans. Hamburg, C. Boysen, 368 pp., 1926.
Schott, G.1935. Geographie des Indischen und Stillen Ozeans. Hamburg, C. Boysen, 413 pp., 1935.
Shepard, Francis P.1931. “Glacial troughs of the continental shelf” . Jour. Geol., v. 39, p. 345–360, 1931.
Shepard, Francis P.1933. “Geological misconceptions concerning the oceans” . Science, v. 78, p. 406–408, 1933.
Shepard, Francis P.1937. “Revised classification of marine shorelines” . Jour. Geol., v. 45, p. 602–624, 1937.
Shepard, Francis P.1938. “Submarine canyons off the California coast” . Calif. Jour. Mines and Geol., Report 24, State Mineralogist, p. 298–310, 1938.
Shepard, Francis P.1939. “Near-shore sediments—hemipelagic deposits” . p. 219–229 in: Recent Marine Sediments, A symposium. Amer. Assn. Petrol. Geol., 736 pp., 1939. Tulsa.
Shepard, Francis P.1941. Unpublished data.
Shepard, F. P., and K. O. Emery. 1941. “Submarine topography off the California coast: canyons and tectonic interpretations” . Geol. Soc. Amer., Spec. Paper, no. 31, 171 pp., 4 charts, 1941.
Shepard, F. P., and E. C. La Fond. 1940. “Sand movements along the Scripps Institution pier” . Amer. Jour. Sci., v. 238, p. 272–285, 1940.
Stetson, Henry C.1936. “Geology and paleontology of the Georges Bank canyons” . Geol. Soc. Amer., Bull., v. 47, p. 339–366, 1936.
Stocks, Theodor. 1938. “Morphologie des Atlantischen Ozeans. Statistik der Tiefenstufen des Atlantischen Ozeans” . Deutsche Atlantische Exped., Meteor, 1925–1927, Wiss. Erg., Bd. 3, 1. Teil, 2. Lief., p. 35–151, 1938.
Stocks, Theodor, and G. Wüst. 1935. “Die Tiefenverhältnisse des offenen Atlantischen Ozeans” . Deutsche Atlantischen Exped. Meteor, 1925–1927, Wiss. Erg., Bd. 3, Teil 1, l., Lief., 31 pp., 1935.
U. S. Beach Erosion Board. 1933. Interim report. April 15, 1933.
van Riel, P. M.1934. “The bottom configuration in relation to the flow of the bottom water” . Snellius Exped. in the eastern part of the Netherlands East Indies 1929–1930, v. 2, Oceanographic results, pt. 2, chap. 2, 62 pp., 1934. Utrecht.
Vaughan, Thomas Wayland. 1938. Recent additions to knowledge of the bottom configuration of the southern oceans. Congrès Internat. de Géographie, Amsterdam, 1938, Comptes rendus, IIb, Océanographie, p. 160–174, 1938.
Vaughan, T. W., et al.1937. “International aspects of oceanography” . Washington, D. C., Nat. Acad. Sci., 225 pp., 1937.
Vaughan, T. W., et al.1940. “Report of the Committee on the criteria and nomenclature of the major divisions of the ocean bottom” . Union Géod. et Géophys. Internat., Assn. d'Océanographie phys., Pub. sci., no. 8, 124 pp., 1940. Liverpool.
Veatch, A. C., and P. A. Smith. 1939. “Atlantic submarine valleys of the United States and the Congo Submarine Valley” . Geol. Soc. Amer., Spec. Pap. no. 7, 101 pp., 1939.
Wüst, Georg. 1936. “Die Gliederung des Weltmeeres” . Hydrographic Review, v. 13, no. 2, p. 46–56, 1936. Monaco.