The Equatorial Region of the Pacific Ocean
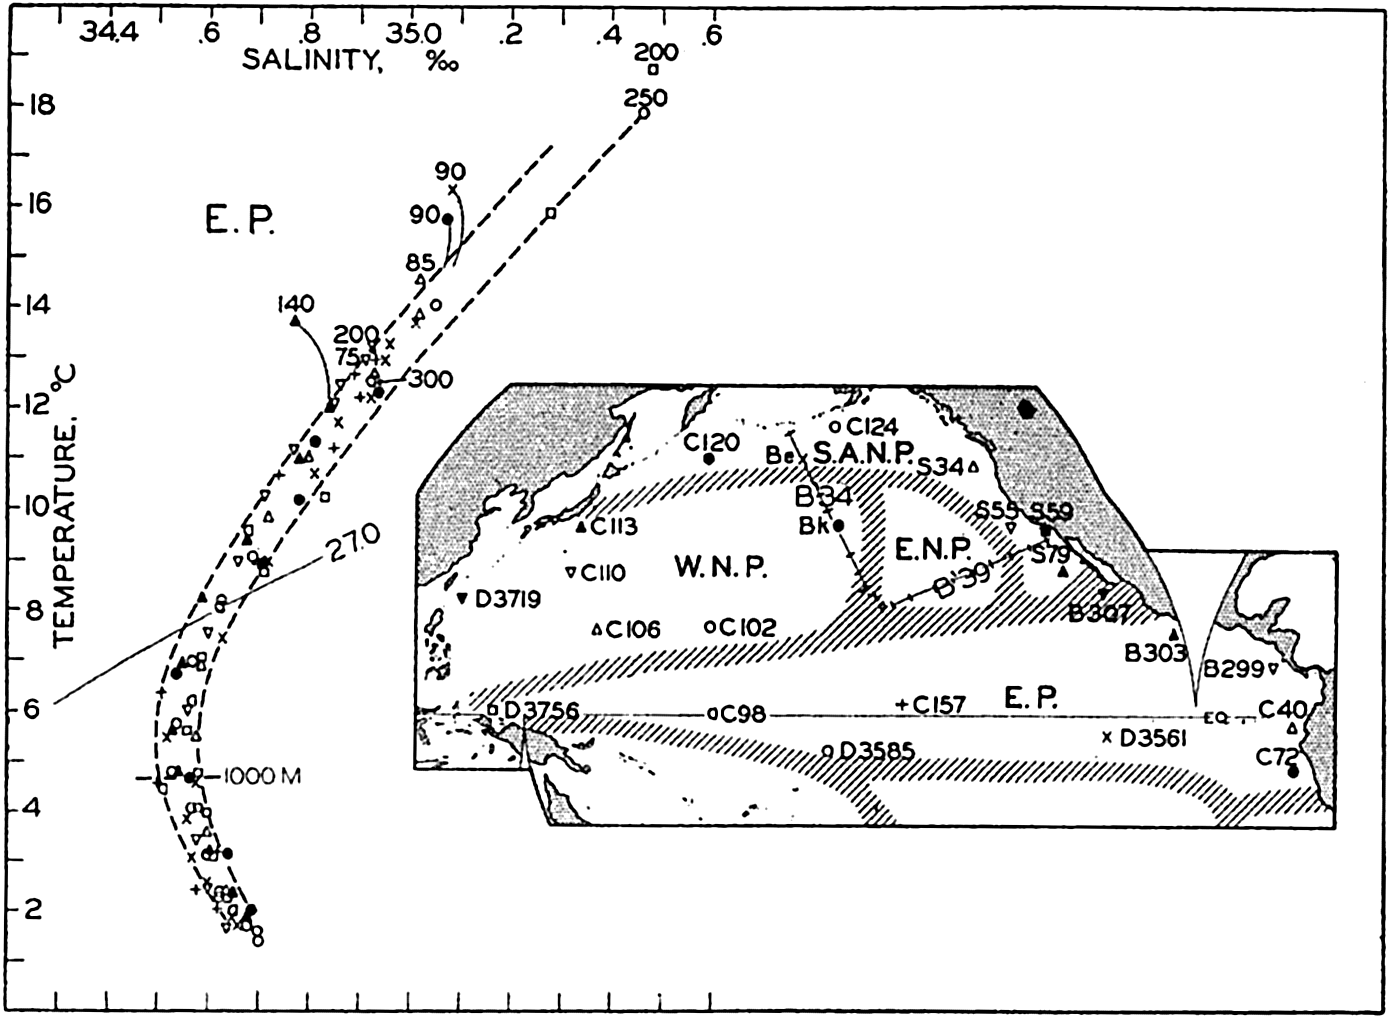
Water Masses of the Equatorial Pacific. In the equatorial region of the Pacific and below the tropical discontinuity layer, one finds an Equatorial Water mass of a remarkably uniform character which extends over the entire Pacific Ocean from east to west, as is evident from fig. 196, in which the temperature-salinity values at nine stations have been plotted. This Equatorial Water mass has its greatest north-south extension along the American coast, where it is present between latitudes 18°S and 20°N. Towards the west it appears to become narrower although, as will be shown, Equatorial water is occasionally found near the Hawaiian Islands. For points still further west detailed information is lacking, but at Dana station 3750, close to the Equator in long. 135°E, characteristic Equatorial Water was encountered, as is evident from the figure.
The Equatorial Water is probably formed off the coast of South America by gradual transformation of the Subantarctic Water, as suggested by the T-S curves in fig. 194, and spreads to the north and to the west. In the extreme western part of the Pacific the Dana data indicate that some of this water enters the North Pacific Ocean.
The Pacific Equatorial Water mass is characterized by a nearly straight T-S correlation between T = 15°, S = 35.15 ‰, and T = 8°, S = 35.6 ‰. At a depth of about 800 m where the temperature is about 5.5°, a salinity minimum exists in which the minimum values lie between 34.50 ‰ and 34.58 ‰. Below a depth of 1000 m the T-S

Temperature-salinity relations in the Equatorial Pacific. The depths of the shallowest values are shown. Locations of stations and boundaries of water masses are shown in the inset map. Abbreviation: C, Carnegie, B, Bushnell, S, E. W. Scripps, D, Dana, B34, Bushnell, 1934; B39, Bushnell, 1939; E.P., Equatorial Pacific; W.N.P., Western North Pacific; E.N.P., Eastern North Pacific; S.A.N.P., Subarctic North Pacific.
[Full Size]
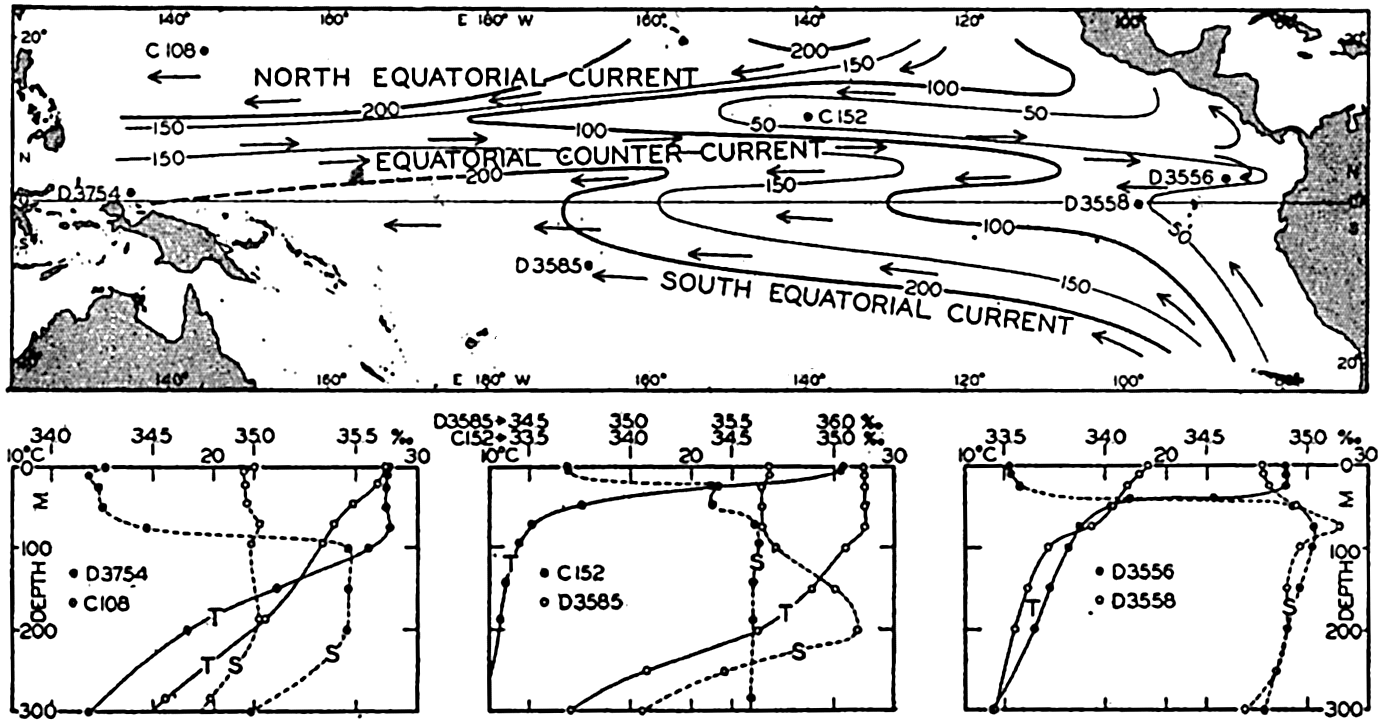
The water masses near the surface are separated from the Equatorial Water mass by a layer of transition within which the temperature decreases and the density increases so rapidly with depth that in many localities the layer has the character of a discontinuity surface. In or directly above the discontinuity layer a salinity maximum is present over large areas. Within the surface layer the temperature is nearly constant to a depth that varies from as little as 10 or 15 m up to nearly 100 m. These conditions are quite similar to those in the tropical regions of the Atlantic and Indian Oceans, but the scarcity of data makes it impossible to study the upper layers in the equatorial part of the Pacific in such detail as can be done in the Atlantic Ocean. A few general features can, however, be pointed out. In fig. 197, which covers the tropical region of the Pacific Ocean, is shown the approximate depth to the thermocline by means of curves drawn at intervals of 50 m. The

Upper: Topography of the discontinuity surface in the equatorial region of the Pacific and corresponding currents. Lower: Vertical temperature and salinity curves at six stations, the locations of which are shown in the upper figure. C, Carnegie, D, Dana.
[Full Size]
Currents of the Equatorial Pacific. The chart of the depth to the thermocline immediately gives an idea of the currents in the upper layers in the tropical region. If the motion of the water below the discontinuity
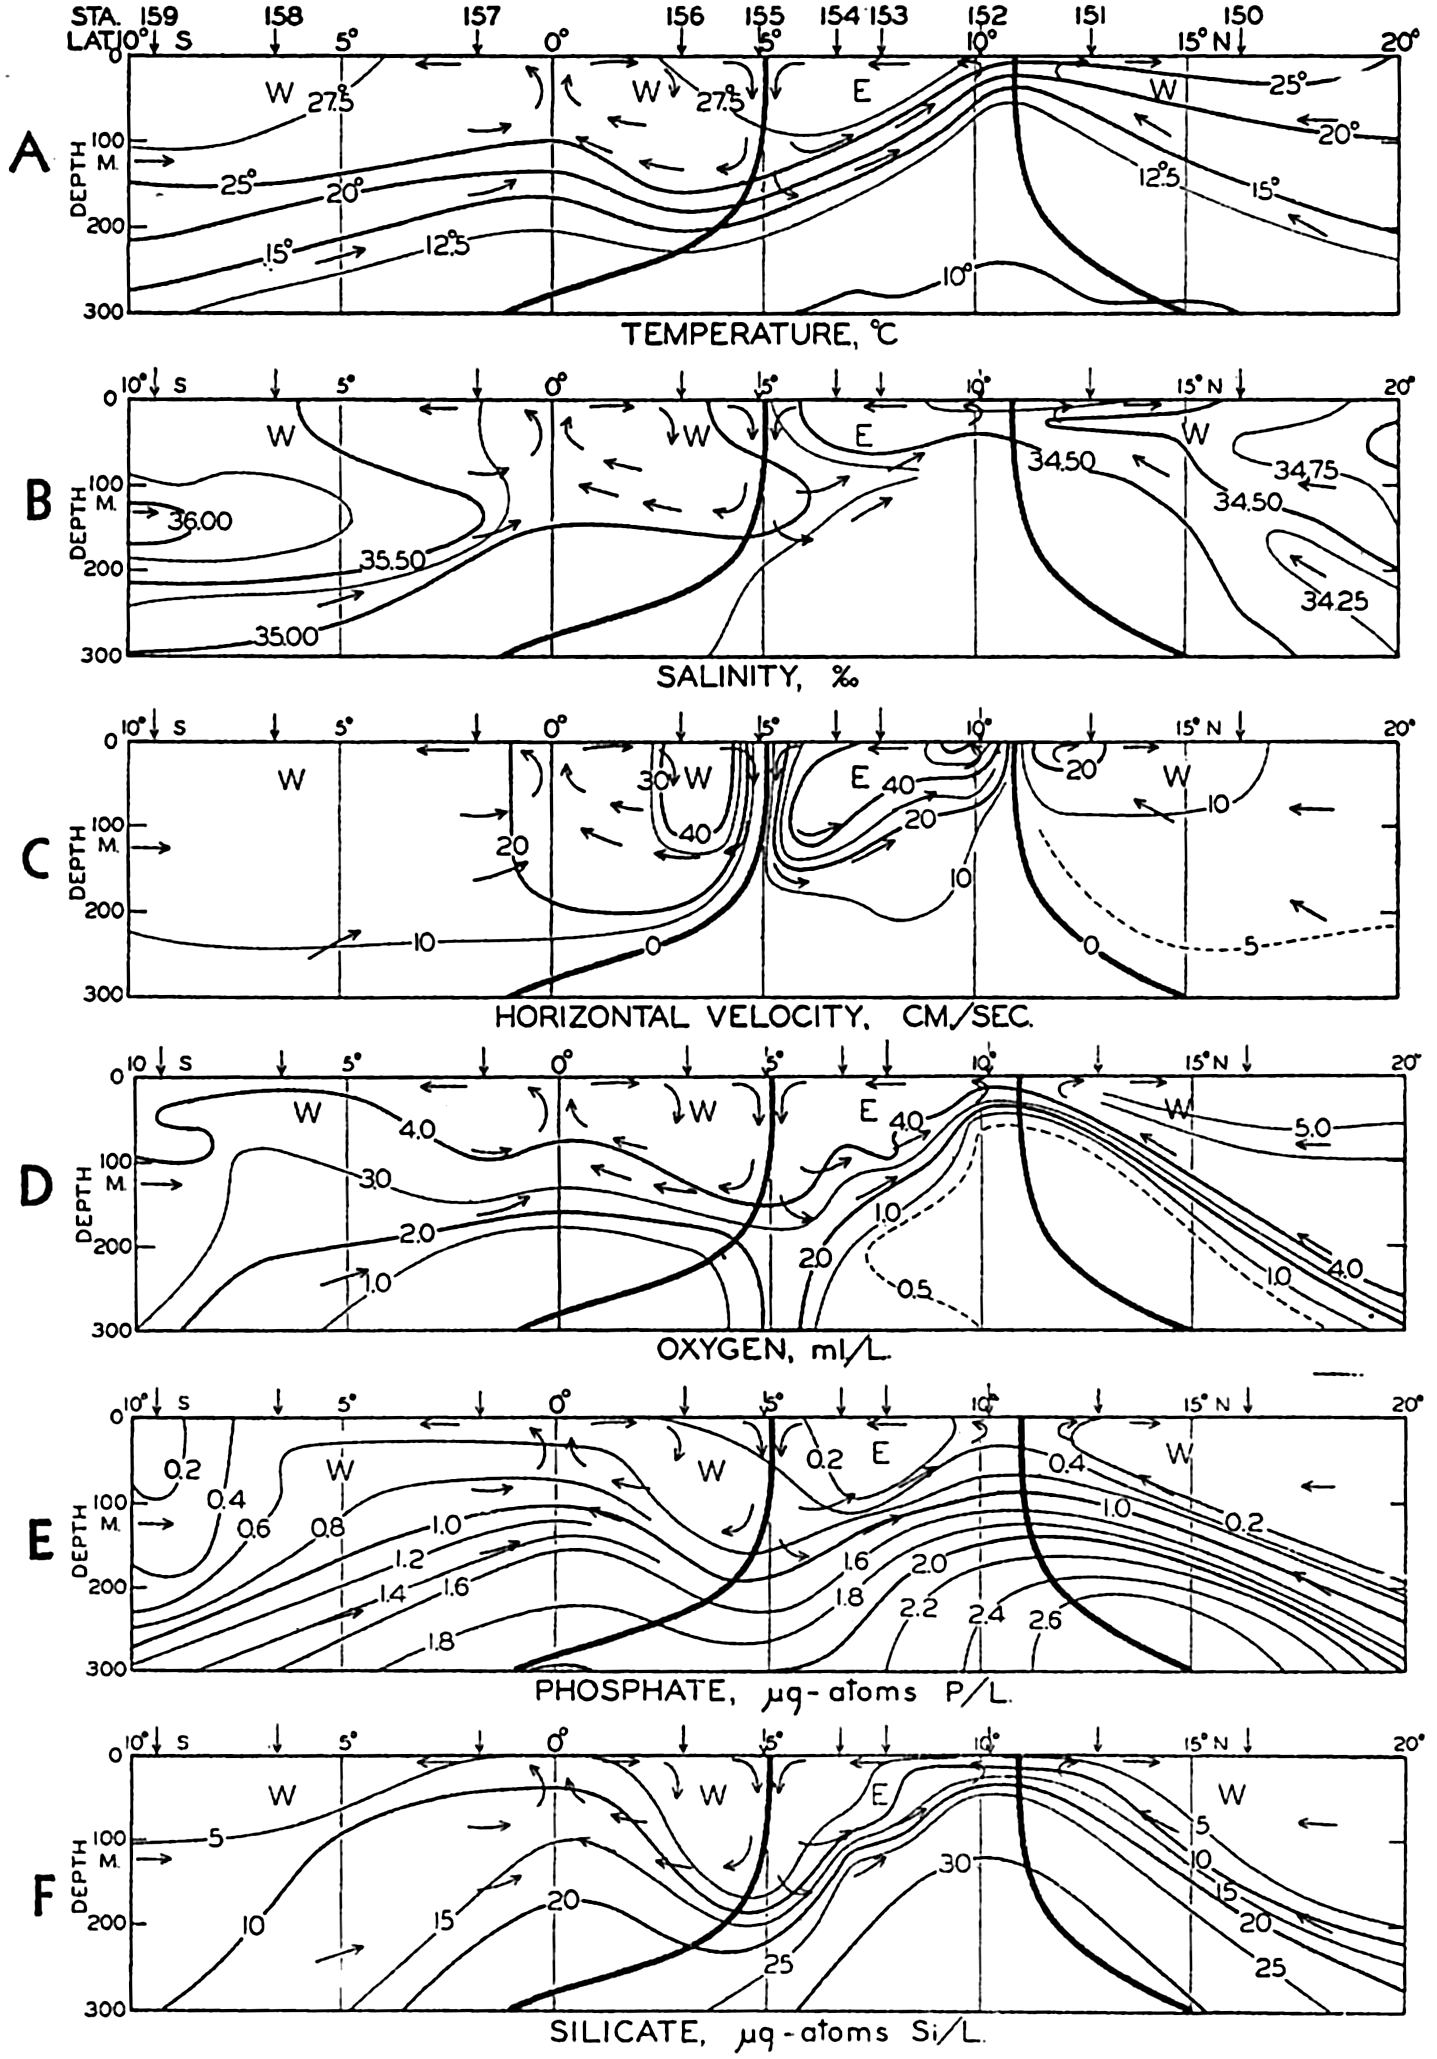
The Equatorial Countercurrent is remarkably well developed in the Pacific Ocean where, according to charts by Puls (1895), it is present at all seasons of the year, lying always in the Northern Hemisphere but further away from the Equator in the northern summer. In this season the velocities of the current also appear to be higher, reaching values up to 2 knots at the surface. The structure of the water masses was first demonstrated by the Carnegie section in approximately long. 140°W, which was obtained in October, 1929. Figure 198A and 198B show the distribution of temperature and salinity in this section between the surface and 300 m. The figure brings out the great variation in the depth to the thermocline in a north-south direction, and the presence of the surface layer of uniform temperature and the tongues of maximum salinity. In figure 198C is shown the velocity distribution, computed on the assumption of no motion at the 700-decibar surface. These computations are uncertain near the Equator, but the resulting picture is remarkably consistent. In this case the Equatorial Countercurrent lies between 3°N and 10°N, as indicated by the letters stating the direction in which the currents flow.
Montgomery and Palmén (1940) have shown that the Equatorial Countercurrent in the Pacific Ocean, as well as that in the Atlantic Ocean, is maintained by the piling up of the light surface water against the western boundary of the ocean. They have made use of one Dana station, 3558, in long. 99°07′W, and of three Dana stations, 3775, 3756, 3767, in long. 134°44′E, all near the Equator. A comparison between the dynamic heights of the sea surface relative to the 1000-decibar surface shows that in long. 135°E the surface lies 62.6 dyn. cm higher than in long. 99°W, but the difference decreases with increasing depth and the 300-decibar surface is parallel to the 1000-decibar surface. If dynamic centimeters are replaced by centimeters one obtains the result that along the Equator the slope of the sea surface is 4.5 × 10⁻⁸. This slope of the surface and the slopes of the isobaric surfaces above the 300-decibar surface can be maintained by an east wind of velocity 4 m/sec, which is lower than the observed velocity of the trades. The stress of wind, therefore, more than accounts for the observed conditions (p. 488). Owing to the slope of the sea surface the Equatorial Countercurrent flows downhill in the calm belt between the trade winds, and the distribution of mass adjusts itself to the presence of the current. The maximum velocity at the surface, as computed from the Carnegie section (fig. 198C) is a little over 50 cm/sec or about 1 knot, in good agreement with values reported from ships.

Temperature, salinity, computed velocity, oxygen, phosphate, and silicate in a vertical section between 10°S and 20°N in the Pacific Ocean. According to the Carnegie observations. Arrows indicate direction of north-south flow. E indicates flow to the east; W, flow to the west.
[Full Size]
The Carnegie section gives a transport to the east by the Equatorial Countercurrent of approximately 25 million m3/sec; the volume transport of this countercurrent in the Pacific is therefore comparable to that of the Florida Current. The surface observations seem to indicate that the transport is somewhat less in the western part of the ocean and that water is drawn into the current as it crosses the Pacific Ocean.
Within the Equatorial Countercurrent and between that current and the Equator, a distinct transverse circulation is superimposed upon the flow toward the east or the west. The character of this transverse circulation is evident, particularly from the distribution of salinity, oxygen, phosphate, and silicate (figs. 198B, D, E, and F). The arrows shown in the figures have been derived from the distribution of oxygen and have been transferred to the other representations, where they fit equally well with the course of the isolines. Within the Equatorial Countercurrent descending motion takes place at the southern boundary and ascending motion at the northern boundary, and between the Equator and the countercurrent descending motion takes place at the boundary of the countercurrent and ascending motion at the Equator. Thus, two cells appear with divergence at the northern limit of the countercurrent and at the Equator, and with a convergence at the southern boundary of the countercurrent. This system, which appears so clearly in the Carnegie section, is quite similar to the one which Defant (1936b) has derived for the Equatorial Countercurrent in the Atlantic Ocean on the basis of theoretical considerations (fig. 172, p. 635).
Owing to the convergence and the divergences the water does not flow due east or due west; but a spiral motion is superimposed upon the major current, and within the countercurrent this motion carries water from the northern to the southern boundary at the surface and carries water in the opposite direction at depths between 50 and 200 m. Within the Equatorial Current the surface water moves from the Equator toward the countercurrent, but at depths between 100 and 150 m the water moves in the opposite direction. To the north of the Equatorial Countercurrent and to the south of the Equator, subsurface water moves toward the divergences at the surface, and this water must originate from the regions of the Tropical Convergences which lie outside the section under consideration. According to Defant's estimate the maximum
The divergences at the Equator and at the northern boundary of the countercurrent must be expected to be regions of high productivity, because the ascending motion brings water which is rich in plant nutrients into the euphotic zone. The plankton collections made on board the Carnegie when crossing the Equator confirm this expectation (see p. 788). The region in the vicinity and to the west of the Galapagos Islands is known to be abundant in marine life, but observations are not detailed enough to show whether two maxima of abundance of marine life occur, related to the two divergences. From the above discussion it is evident that the equatorial divergence, with all its consequences, is not related to the proximity of land, and that the conditions met with in the Galapagos area and to the west do not simply represent a continuation of the conditions off the coast of Peru, as had previously been assumed.
The character of the Equatorial Countercurrent is complicated both at the origin of the current between New Guinea and the Philippines and at the termination against the American coast. Schott (1939) has shown that large seasonal changes take place to the north of New Guinea. From June to August the South Equatorial Current follows the north coast of this Island and converges sharply with the North Equatorial Current in about lat. 5°N, where the countercurrent begins. From December to February, part of the North Equatorial Current bends completely around off the southern islands of the Philippines, sending one branch toward the southeast along the north coast of New Guinea, and another branch, the countercurrent, toward the east.
Similarly, great seasonal variations occur in the Central American region, as is evident from the data presented on the United States Hydrographic Pilot Charts, but in this region the picture is complicated by numerous eddies, the locations of which appear to vary from one year to another. The only persistent features are that the Equatorial Countercurrent is in most months well developed between lat. 5°N and 6°N and that the greater volume of water transported by the Countercurrent is deflected to the north and northwest, where a strong current prevails off the coast of Central America. Another branch, weaker and much more irregular, turns to the south. In the Gulf of Panama large seasonal changes occur which are associated with the change in the prevailing wind direction (Fleming, 1941).