Salinity and Temperature of the Surface Layer
The Surface Salinity. In all oceans the surface salinity varies with latitude in a similar manner. It is at a minimum near the Equator, teaches a maximum in about latitudes 20°N and 20°S, and again decreases toward high latitudes.
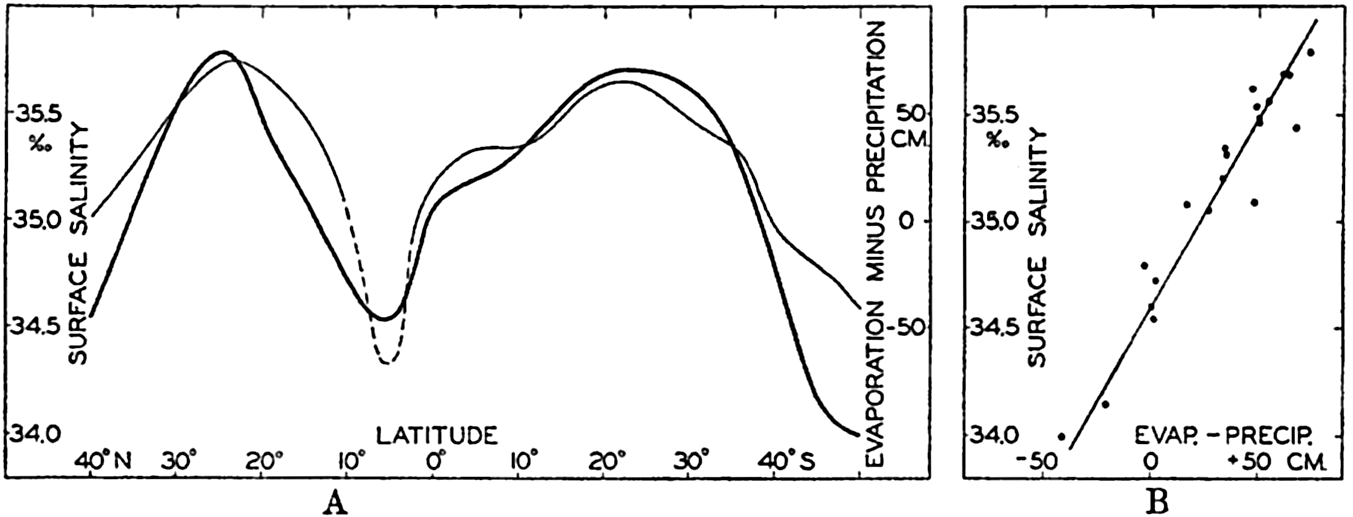
(A) Average values for all oceans of surface salinity and the difference, evaporation minus precipitation, plotted against latitude. (B) Corresponding values of surface salinity and the difference, evaporation minus precipitation, plotted against each other (according to Wüst, 1936).
[Full Size]
Table 30 contains average values of the surface salinity, the evaporation, the precipitation, and the difference between the last quantities for the three major oceans and for all combined, according to Wüst (1936).
Wüst points out that such an empirical relationship is found because the surface salinity is mainly determined by three processes: decrease of salinity by precipitation, increase of salinity by evaporation, and change of salinity by processes of mixing. If the surface waters are mixed with water of a constant salinity, and if this constant salinity is represented by S0, the change of salinity due to mixing must be proportional to S0 – S, where S is the surface salinity. The change of salinity due to processes of evaporation and precipitation must be proportional to the difference (E – P). The local change of the surface salinity must be zero; that is,
orAs this simple formula has been established empirically, it must be concluded that the surface water is generally mixed with water of a salinity which, on an average, is 34.6 ‰. This value represents approximately the average value of the salinity at a depth of 400 to 600 m, and it appears therefore that vertical mixing is of great importance to the general distribution of surface salinity. This concept is confirmed by the fact that the standard value of the salinity differs for the different oceans. For the North Atlantic and the North Pacific, Wüst obtains similar relationships, but the constant term, S0, has the value 35.30 ‰ in the North Atlantic and 33.70 ‰ in the North Pacific Ocean. The corresponding average values of the salinity at a depth of 600 m are 35.5 ‰ and 34.0 ‰, respectively. For the South Atlantic and the South Pacific Oceans, Wüst finds S0 = 34.50 ‰ and 34.64 ‰, respectively, and the average salinity at 600 m in both oceans is about 34.5 ‰. In these considerations the effect of ocean currents on the distribution of surface salinity has been neglected, and the simple relations obtained indicate that transport by ocean currents is of minor importance as far as average conditions are concerned. The difference between evaporation and precipitation, E – P, on the other hand, is of primary importance, and,
The distribution of surface salinity of the different oceans is shown in chart VI, in which the general features that have been discussed are recognized, but the details are so closely related to the manner in which the water masses are formed and to the types of currents that they cannot be dealt with here.
Periodic Variations of the Surface Salinity. Over a large area, variations in surface salinity depend mainly upon variations in the difference between evaporation and precipitation. From Böhnecke#x0027;s monthly charts (1938) of the surface salinity of the North Atlantic Ocean, mean monthly values have been computed for an area extending between latitudes 18° and 42°N, omitting the coastal areas in order to avoid complications due to shifts of coastal currents. The results of this computation (fig. 30) show the highest average surface salinity, 36.70‰ in March, and the lowest, 36.59 ‰, in November. The variations from one month to another are irregular, but on the whole the salinity is somewhat higher in spring than it is in the fall.
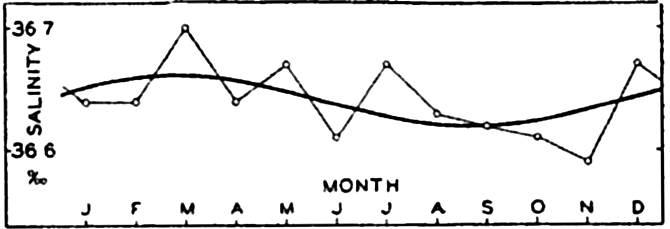
Annual variation of surface salinity in the North Atlantic Ocean between latitudes 18°N and 42°N.
[Full Size]
Harmonic analysis leads to the result
and thus Because ∂S/∂t is proportional to E – P, it follows that the excess of evaporation over precipitation is at a minimum at the end of June and at a maximum at the end of December. This annual variation corresponds closely to the annual variation of evaporation (p. 122), for which reason it appears that in the area under consideration the annual variation of the surface salinity is mainly controlled by the variation in evaporation during the year. For a more exact examination, subsurface data are needed, but nothing is known as to the annual variation of salinity at subsurface depths.More complicated conditions are encountered in the northwestern part of the Atlantic Ocean, where, according to G. Neumann (1940),
From the open ocean no data are available as to the diurnal variation of the salinity of the surface waters, but it may be safely assumed that such a variation is small, because neither the precipitation nor the evaporation can be expected to show any considerable diurnal variation.
| North latitude | Atlantic Ocean | Indian Ocean | Pacific Ocean | South latitude | Atlantic Ocean | Indian Ocean | Pacific Ocean |
|---|---|---|---|---|---|---|---|
| 70°–60° | 5.60 | ...... | ...... | 70°–60° | − 1.30 | − 1.50 | − 1.30 |
| 60–50 | 8.66 | 5.74 | 60–50 | 1.76 | 1.63 | 5.00 | |
| 50–40 | 13.16 | 9.99 | 50–40 | 8.68 | 8.67 | 11.16 | |
| 40–30 | 20.40 | ...... | 18.62 | 40–30 | 16.90 | 17.00 | 16.98 |
| 30–20 | 24.16 | 26.14 | 23.38 | 30–20 | 21.20 | 22.53 | 21.53 |
| 20–10 | 25.81 | 27.23 | 26.42 | 20–10 | 23.16 | 25.85 | 25.11 |
| 10–0 | 26.66 | 27.88 | 27.20 | 10–0 | 25.18 | 27.41 | 26.01 |
Surface Temperature. The genera1 distribution of surface temperature cannot be treated in a manner similar to that employed by Wüst when dealing with the salinity, because the factors controlling the surface temperature are far more complicated. The discussion must be confined to presentation of empirical data and a few general remarks.
Table 31 contains the average temperatures of the oceans in different latitudes according to Krümmel (1907), except in the case of the Atlantic Ocean, for which new data have been compiled by Böhnecke (1938). In all oceans the highest values of the surface temperature are found somewhat to the north of the Equator, and this feature is probably related to the character of the atmospheric circulation in the two hemispheres. The region of the highest temperature, the thermal Equator, shifts with the season, but in only a few areas is it displaced to the Southern Hemisphere at any season. The larger displacements (Schott, 1935, and Böhnecke, 1938) are all in regions in which the surface currents change
The average distribution of the surface temperature of the oceans in February and August is shown in charts II and III. Again the distribution is so closely related to the formation of the different water masses and the character of the currents that a discussion of the details must be postponed.
Difference Between Air and Sea-Surface Temperatures. It was pointed out that in all latitudes the ice-free oceans received a surplus of radiation, and that therefore in all latitudes heat is given off from the ocean to the atmosphere in the form of sensible heat or latent heat of water vapor. The sea-surface temperature must therefore, on an average, be higher than the air temperature. Observations at sea have shown that such is the case, and from careful determinations of air temperatures over the oceans it has furthermore been concluded that the difference, air minus sea-surface temperature, is greater than that derived from routine ships' observations. In order to obtain an exact value, it is necessary to measure the air temperature on the windward side of the vessel at a locality where no eddies prevail, but where the air reaches the thermometer without having passed over any part of the vessel. For measurements of the temperature a ventilated thermometer must be used. According to the Meteor observations (Kuhlbrodt and Reger, 1938) the air temperature over the South Atlantic Ocean between latitudes 55°S and 20°N is on an average 0.8 degree lower than that of the surface, whereas in the same region the atlas of oceanographic and meteorological observations published by the Netherlands Meteorological Institute gives an average difference of only 0.1 degree. The reason for this discrepancy is that the air temperatures as determined on commercial vessels are on an average about 0.7 degree too high because of the ships' heat. The result as to the average value of the difference, υw – υa, is in good agreement with results obtained on other expeditions when special precautions were taken for obtaining correct air temperatures. Present atlases of air and sea-surface temperatures have been prepared from the directly observed values on board commercial vessels without application of a correction to the air temperatures. This correction is so small that it is of minor importance when the atlases are used for climatological studies, but in any studies that require knowledge of the exact difference between air- and sea-surface temperatures it is necessary to be aware of the systematic error in the air temperature.
The difference of 0.8 degree between air and surface temperatures, as derived from the Meteor observations, is based on measurements of air temperature at a height of 8 m above sea level. At the very sea surface the air temperature must coincide with that of the water, and consequently the air temperature decreases within the layers directly above the sea. The most rapid decrease takes place, however, very close to the sea surface, and at distances greater than a few meters the decrease is so slow that it is immaterial whether the temperature is measured at 6, 8, or 10 m above the surface. The height at which the air temperature has been observed on board a ship exercises a minor influence, therefore, upon the accuracy of the result, and discrepancies due to differences in the height of observations are negligible compared to the errors due to inadequate exposure of the thermometer.
The statement that the air temperature is lower than the water temperature is correct only when dealing with average conditions. In any locality the difference, υw – υa, generally varies during the year in such a manner that in winter the air temperature is much lower than the sea-surface temperature, whereas in summer the difference is reduced or the sign is reversed. The difference also varies from one region to another according to the character of the circulation of the atmosphere and of the ocean currents. These variations are of great importance to the local heat budget of the sea because the exchange of heat and vapor between the atmosphere and the ocean depends greatly upon the temperature difference.
It was shown that the amount of heat given off from the ocean to the surface is, in general, great in winter and probably negligible in summer. Owing to this annual variation in the heat exchange, one must expect that in winter the air over the oceans is much warmer than the air over the continents but in summer the reverse conditions should be expected. That such is true is evident from a computation of the average temperature of the air between latitudes 20°N and 80°N along the meridian of 120°E, which runs entirely over land, and along the meridian of 20°W, which runs entirely over the ocean (von Hann, 1915, p. 146). In January the average temperature along the “land meridian” of 120°E is −15.9 degrees C, but along the “water meridian” of 20°W it is 6.3 degrees. In July the corresponding values are 19.4 and 14.6 degrees, respectively. Thus, in January the air temperature between 20°N and 80°N over the water meridian is 22.2 degrees higher than that over the land meridian, whereas in July it is 4.8 degrees lower. The mean annual temperature is 7.0 degrees higher along the water meridian.
Annual Variation of Surface Temperature. The annual variation of surface temperature in any region depends upon a number of factors, foremost among which are the variation during the year of the radiation income, the character of the ocean currents, and of the prevailing
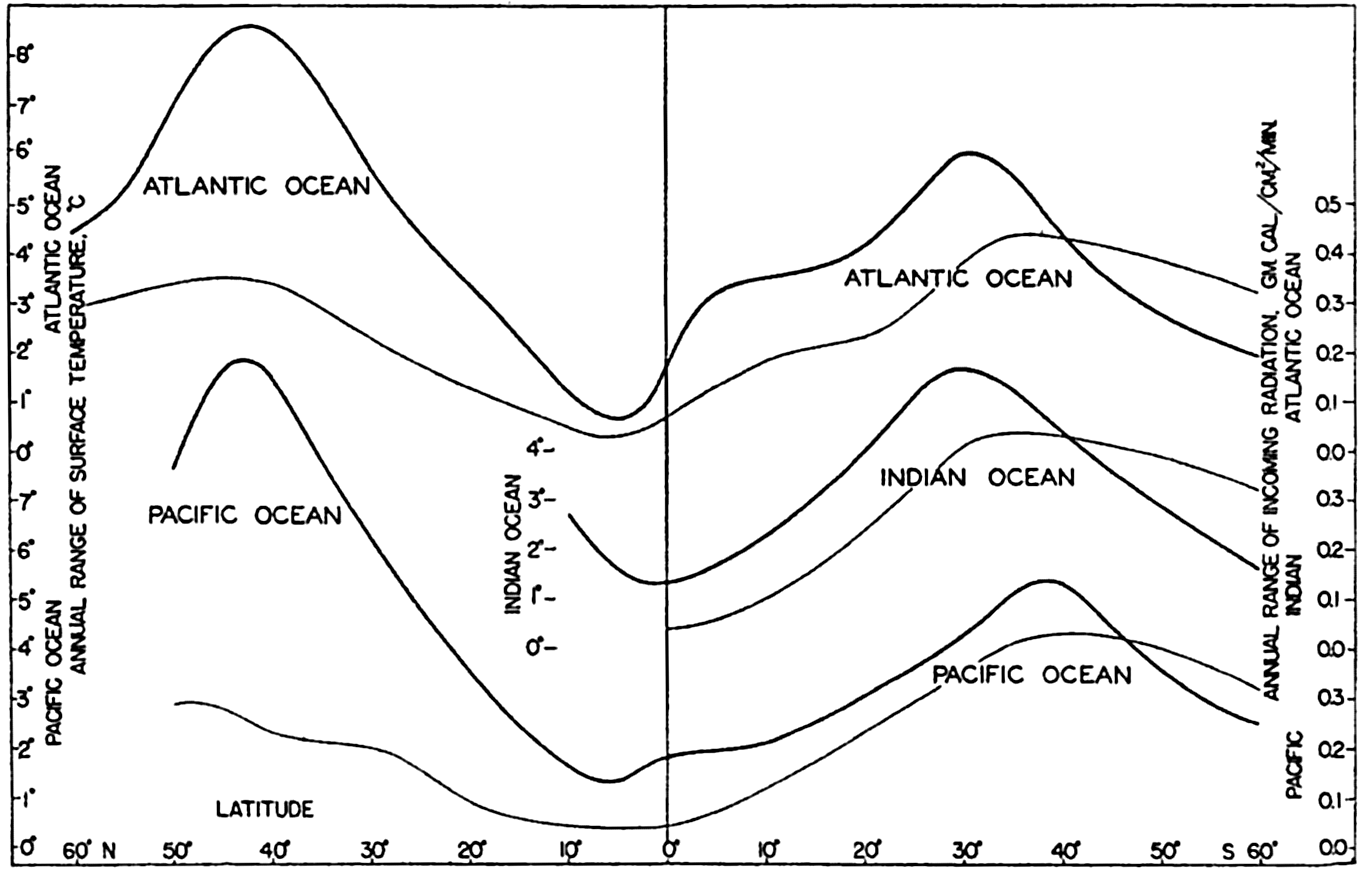
Average annual ranges of surface temperature in the different oceans plotted against latitude (heavy curves) and corresponding ranges in the radiation income (thin curves).
[Full Size]
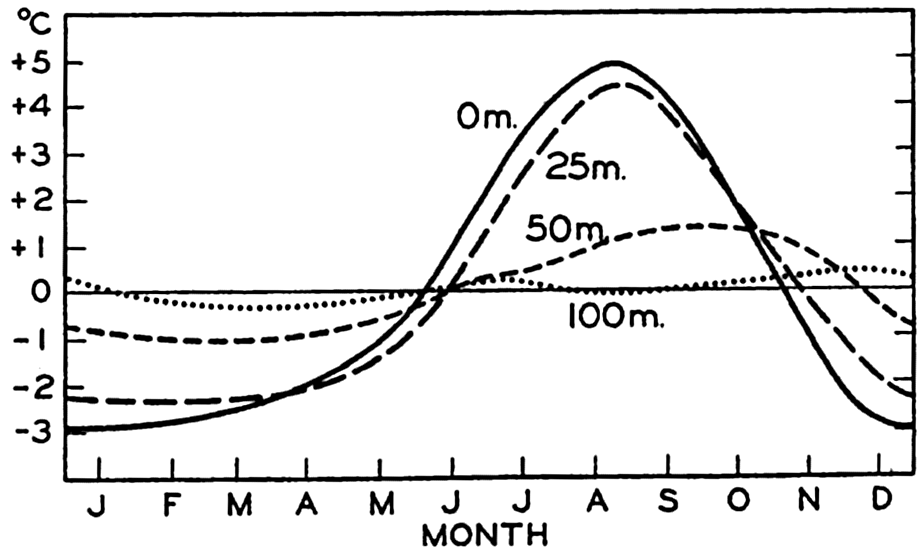
Annual Variation of Temperature in the Surface Layers. At subsurface depths the variation of temperature depends upon four factors: (1) variation of the amount of heat that is directly absorbed at different depths, (2) the effect of heat conduction, (3) variation in the currents related to lateral displacement of water masses, and (4) the effect of vertical motion. The annual variation of temperature at subsurface depths cannot be dealt with in a general manner, owing to lack of data, but it is again possible to point out some outstanding characteristics, using two examples from the Pacific and one from the Atlantic Ocean. The effects of all four of the important factors are illustrated in fig. 32A, which shows the annual variation of temperature at the surface and at depths of 25, 50, and 100 m at Monterey Bay, California (Skogsberg, 1936). Skogsberg divides the year into three periods: the period of the Davidson Current, lasting from the middle of November to the middle of February; the period of upwelling, between the middle of February and the end of July; and the oceanic period, from the end of July to the middle of November. The California Current off Monterey Bay during the greater part of the year is directed to the south, but during winter, from the middle of November to the middle of February, an inshore flow to the north, the Davidson Current, is present (p. 724). The water of this inshore flow is characterized by relatively high and uniform temperature and appears in the annual variation of temperature as warm water at subsurface depths. The upper homogeneous layer is relatively thick, as is evident from the fact that the temperature is nearly the same at 25 m as it is at the surface, and that at 50 m it is only slightly lower. At the end of February the California Current again reaches to the coast and, under the influence of the prevailing northwesterly winds, an overturn of the upper layers
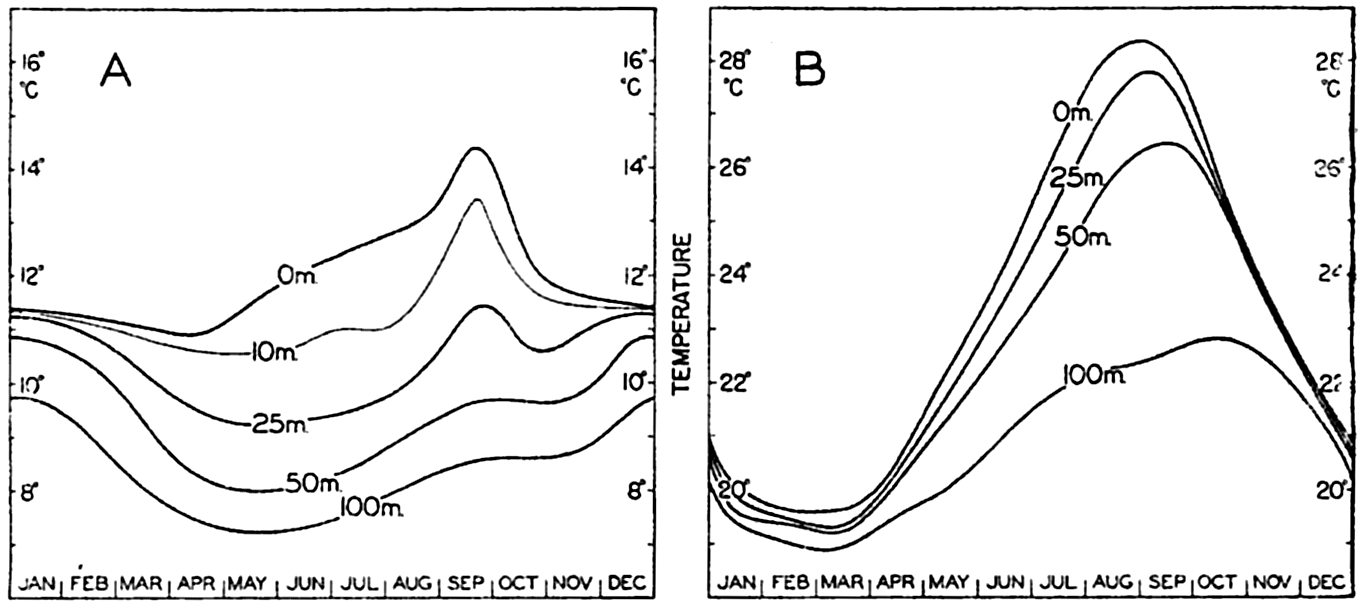
(A) Annual variation of temperature at different depths in Monterey Bay, California. (B) Annual variation of temperature at different depths in the Kuroshio off the South Coast of Japan.
[Full Size]
The annual variation of temperature in the Kuroshio off the south coast of Japan (Koenuma, 1939), as shown in fig. 32B, gives an entirely different picture. The annual variation has the same character at all depths between the surface and 100 m, with a minimum in late winter and a maximum in late summer or early fall, but the range of the variation decreases with depth, and the time of maximum temperature occurs later with increasing depth. From the course of the curves it may be concluded that the annual variation is due to heating and cooling near the surface and is transmitted to greater depths by processes of conduction (p. 136). This appears to be correct, but the heating and cooling is only partly caused by variations in the net radiation, and it also depends on excessive cooling in winter by cold and dry winds blowing toward the sea (Sverdrup, 1940).
In order to be certain that observed temperature variations are related to processes of heating and cooling only, it is necessary to examine whether the water in a given locality is of the same character throughout the year. For this purpose Helland-Hansen (1930) developed a method that is applicable in areas in which it is possible to establish a definite relation between temperature and salinity (p. 142). He assumed that any temperature value above or below that determined by the temperature-salinity relation can be considered as resulting from heating or cooling of the water, and he used the method within three areas in the eastern North Atlantic. Fig. 33 shows the curves which he determined for an area off the Bay of Biscay with its center in approximately 47°N and 12°W. The character of the curves, the reduction of the range, and the displacement of the times of maxima clearly show that one has to deal with heat conduction. In this case the variation in the heat content
These examples serve to illustrate different types of annual variation of temperature that may be encountered in different localities and also to stress the fact that conclusions as to the temperature variations associated with processes of local heating are valid only if the data are such that the influences of shifting currents and vertical motion can be eliminated.
Diurnal Variation of Surface Temperature. The range of the diurnal variation of surface temperature of the sea is not more, on an average, than 0.2 to 0.3 degree. Earlier observations gave somewhat higher values, particularly in the Tropics, but new, careful measurements and reexamination of earlier data in which doubtful observations have been eliminated have shown that the range of diurnal variation is quite small. Meinardus (Kuhlbrodt and Reger, 1938, p. 301–302) summarizes his examination of a large number of data by stating, “in general, the diurnal variation of water temperature in lower latitudes can be represented by a sine curve with extreme values between 2:30h and 3h and between 14:30h and 15h, and a range of 0.3° to 0.4°. In higher latitudes the extreme values come later and the range is even smaller.” The Meteor observations give ranges of only 0.2 to 0.3 degree in the Tropics. The Meteor data and the Challenger data, which have been discussed by Wegemann (1920), both show that close to the Equator the diurnal variation of surface temperature is somewhat unsymmetrical, the temperature increasing rapidly after sunrise and decreasing slowly after sunset, but at greater distances from the Equator the curve becomes somewhat more symmetrical.
Annual variation of temperature at different depth off the Bay of Biscay in approximately 47°N and 12°W.
[Full Size]
The changes through the year of the range of diurnal variation of surface temperature have been examined in some coastal areas. At forty-four stations around the British Isles, Dickson (see Wegemann, 1920) found that on an average the diurnal range varied between 0.20 degree in December and 0.69 degree in May. At individual stations both the mean annual range and the variation of the range from month to month were dependent upon the exposure of the locality and the depth of the water at which the measurements were made. This annual variation in range is closely related to the annual variation in the diurnal amount of net heat received by processes of radiation.
| Temperature range, °C | |||
|---|---|---|---|
| Wind and cloudiness | Average | Maximum | Minimum |
| 1. Moderate of fresh breeze | |||
| a. Sky Overcast | 0.39 | 0.6 | 0.0 |
| b. Sky clear | 0.71 | 1.1 | 0.3 |
| 2. Calm or very light breeze | |||
| a. Sky overcast | 0.93 | 1.4 | 0.6 |
| b. Sky clear | 1.59 | 1.9 | 1.2 |
The range of the diurnal variation of temperature depends upon the cloudiness and the wind velocity. From observations in the Tropics, Schott (Krümmel, 1907) found the mean and extreme values that are shown in table 32. Similar results but higher numerical values were found by Wegemann from the Challenger data. In both cases the numerical values may be somewhat in error, but the character of the influence of cloudiness and wind is quite evident. With a clear sky the range of the diurnal variation is great, but with great cloudiness it is small, at calm or light breeze it is great, and at moderate or high wind it is small. The effect of cloudiness is explained by the decrease of the diurnal amplitude of the incoming radiation with increasing cloudiness. The effect of the wind is somewhat more complicated, but the main feature is that at high wind velocities the wave motion produces a thorough mixing in the surface layers and the heat which is absorbed in the upper meters is distributed over a thick layer, leading to a small range of the temperature, whereas in calm weather a corresponding intensive mixing does not take place, the heat is not distributed over a thick layer, and consequently the range of the temperature near the surface is much greater.
Diurnal Variation of Temperature in the Upper Layers. Knowledge as to the diurnal variation of temperature at depths below the surface is very scanty. It can be assumed that the depth at which the diurnal variation is perceptible will depend greatly upon the stratification of the water. A sharp increase of density at a short distance below the free-water surface will limit the conduction of heat (p. 477) to such an extent that a diurnal variation of temperature will be present above the boundary surface only.
On the Meteor expedition, hourly temperature observations were made at the surface and at a depth of 50 m at a few stations in the Tropics where an upper homogeneous layer was present which had a thickness of 70 m. Defant (1932) has shown that in these cases the diurnal oscillation of temperature at subsurface depths is in agreement with the laws that have been derived on the assumption of a constant heat conductivity (p. 136). At 50 m the amplitude of the diurnal variation was reduced to less than two tenths of the amplitude at the surface, and the maximum occurred about 6.5 hours later.
The diurnal variation of sea temperature in general is so small that it is of little importance to the physical and biological processes in the sea, but knowledge of the small variations is essential to the study of the diurnal exchange of heat between the atmosphere and the sea (p. 124). The data which are available for this purpose, however, are very inadequate at the present time.


