The South Atlantic Ocean
The three major oceans, the Atlantic, the Indian, and the Pacific, can be considered as deep bays that are in open communication with the Antarctic Ocean to the south but are closed at their northern ends. Of these oceans the Atlantic extends farthest to the north, and several large adjacent seas, the Mediterranean, the Caribbean, the Gulf of Mexico, Baffin Bay, the Norwegian Sea, and the North Polar Sea, exercise characteristic effects on the waters of the North Atlantic. The communication between the North Atlantic Ocean and the Antarctic takes place through the South Atlantic Ocean, which is of nearly constant width and without adjacent seas. This wide and short channel is divided lengthwise by the South Atlantic Ridge, which rises from depths exceeding 5000 m to within 2000 m from the surface. The two deep troughs on either side of the ridge are divided into basins by ridges running more or less in an east-west direction, the most conspicuous of which is the Walfish Ridge which closes the eastern trough off to the south.
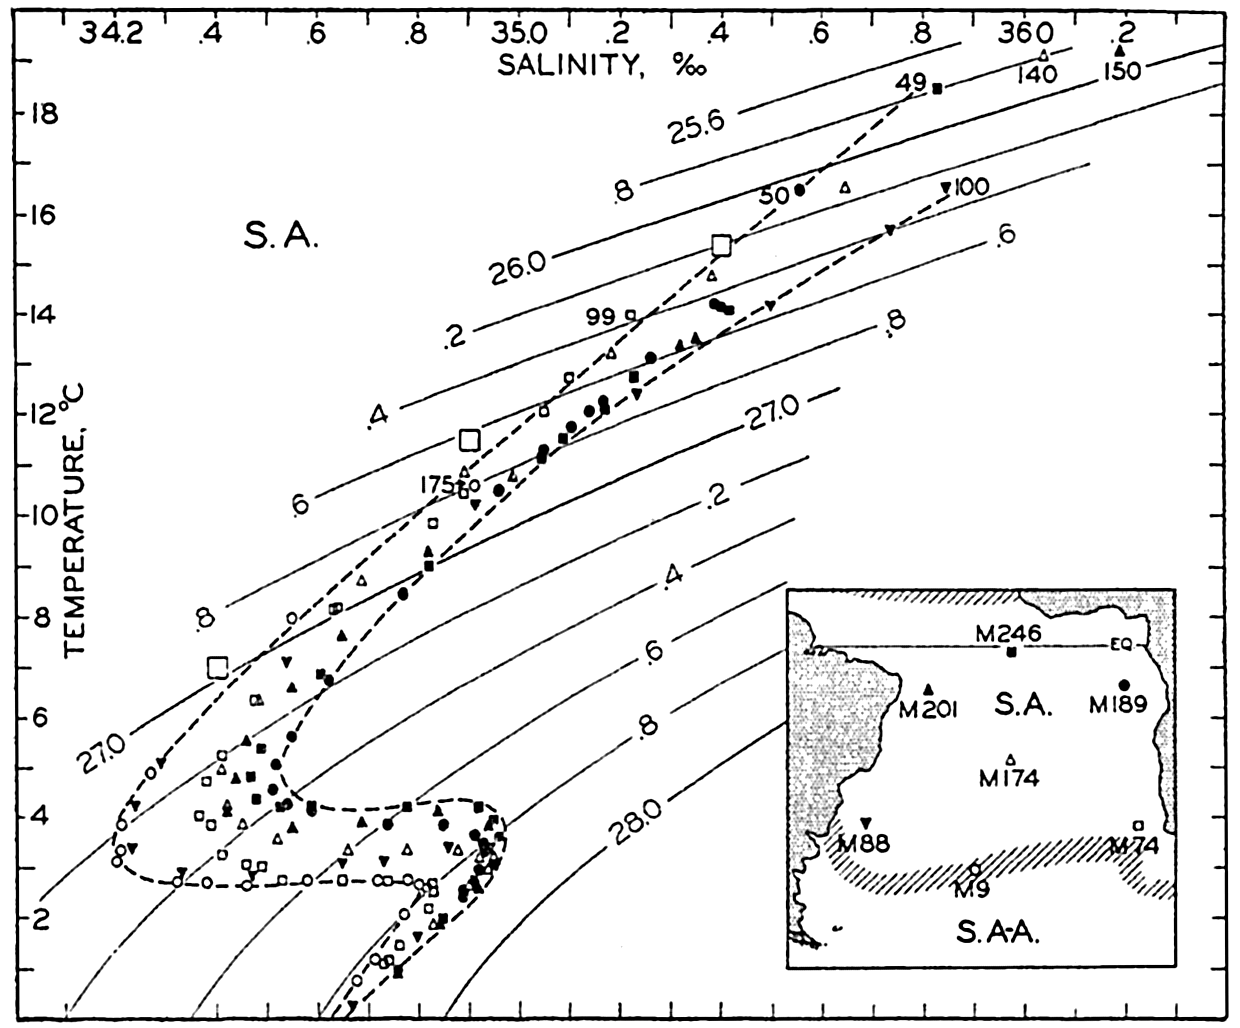
The Water Masses of the South Atlantic Ocean. In order to illustrate the character of the water masses in the South Atlantic Ocean, seven Meteor stations have been selected, the locations of which are shown in the inset map in fig. 168. The stations are equally distributed over the entire South Atlantic Ocean between latitudes 41°S and the Equator.

Temperature-salinity relation in the South Atlantic Ocean. Depths of shallowest values are shown. Winter surface values in latitudes 30°S to 40°S indicated by large squares. Inset map shows location of Meteor stations used. S.A. indicates South Atlantic region; S.A-A., subantarctic region.
[Full Size]
Below the Central Water the Antarctic Intermediate Water shows up by the characteristic salinity minimum which is found over the greater part of the ocean at a depth of approximately 800 m. The Antarctic Intermediate Water is most typically present at the southern stations and at the stations close to South America, and appears to be considerably mixed with other water masses at the northern stations off the African
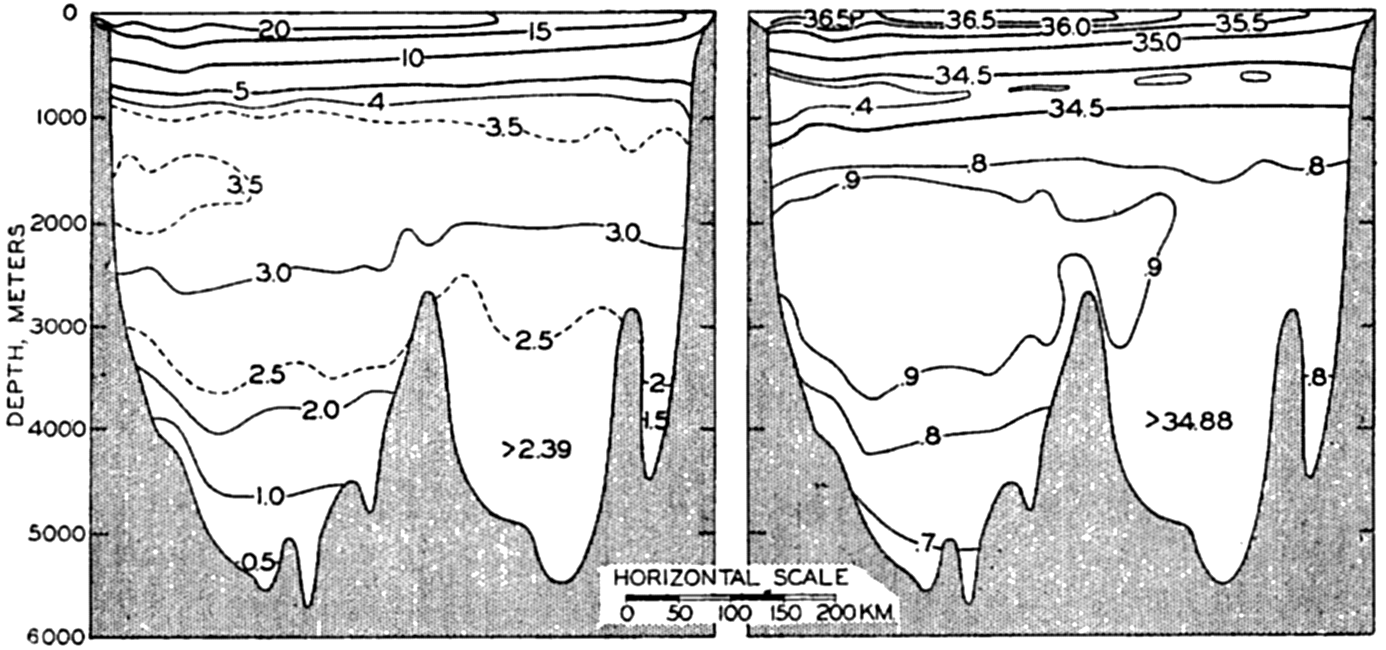
The T-S data in fig. 168 give no information as to the vertical extension of the different water masses because indications of depths have been omitted in order to avoid making the presentation too complicated. The vertical extension can be seen from fig. 169, showing the distribution of temperature and salinity in the Meteor profile VII (Wüst and Defant, 1936), which nearly follows the parallel of lat. 22°s. The central water, which is approximately bounded by the isohalines 36 ‰ and 34.65 ‰ is found in a layer which is about 450 m thick; the intermediate water, of salinity less than 34.65 ‰, is about 750 m thick, whereas the deep and bottom water is of greater thickness than the two other water masses together. The figure also demonstrates the presence of a thin layer of surface water which in this particular profile is of high temperature and high salinity. The upper water and the surface layer, as shown in the figure, together comprise the troposphere according to Defant's definition (p. 141). In these layers the strongest currents are encountered.

Distribution of temperature and salinity in vertical sections across the South Atlantic Ocean in about latitude 22°s (after Wüst.) Sections are seen from the south.
[Full Size]
The Currents of the South Atlantic Ocean. The most outstanding current of the South Atlantic Ocean is the Benguela Current, which flows north along the west coast of South Africa and is particularly conspicuous between the south point of Africa and lat. 17° to 18°S. In agreement with the dynamics of currents in the Southern Hemisphere, the denser water of low temperature is found on the right-hand side of the current, that is, close to the African coast. Under the influence of the prevailing southerly and southeasterly winds the surface layers are carried away from the coast, and upwelling of water from moderate
Proceeding towards the Equator the Benguela Current gradually leaves the coast and continues as the northern portion of the South Equatorial Current, which flows towards the west across the Atlantic Ocean between lat. 0° and 20°S. In the charts showing the distribution of surface temperatures (charts II and III), the tongue of low temperature along the Equator is due not only to the cold waters of the Benguela Current but also to a divergence along the Equator. The South Equatorial Current partly crosses the Equator, continuing into the North Atlantic Ocean, and it partly turns to the left and flows south along the South American coast, where it shows up as a tongue of water of high temperature and high salinity, the Brazil Current. Close to the coast of Argentina a branch of the Falkland Current extends from the south to about latitude 30°S, carrying water of lower temperature and lower salinity. The most conspicuous feature of the currents of the South Atlantic is represented by the counterclockwise gyral with the cold Benguela Current on the eastern side, the warm Brazil Current on the western side, the South Equatorial Current flowing west on the northern side, and the South Atlantic Current flowing east on the southern side. It is a system of shallow currents because the entire circulation takes place above the Antarctic Intermediate Water or within the troposphere, and near the Equator it is probably limited to a depth of less than 200 m.
In agreement with this circulation, the water within the southern and eastern parts of the current system is of somewhat lower salinity than that of the northern and western parts (see fig. 168, p. 626). In the south, admixture of subantarctic water lowers the salinity, but in the north admixture of saline surface water increases the salinity.
A quantitative study of the currents of the South Atlantic Ocean on the basis of the Meteor data (Defant, 1941) leads to results similar to those that have been described here. Defant computed the absolute geopotential topographies of a series of isobaric surfaces by the third method described on p. 457. His conclusions are essentially in agreement with those which can be derived by making use of the equation of continuity (the fourth method, p. 457).
For calculations of the transport through vertical sections between South Africa and South America (p. 465), the Meteor data lead to the result that the transport above a depth of 4000 m is directed towards the north, but this is obviously impossible because the net transport through
| Latitude | Water mass | Current | Transport in million m3/sec toward | |
|---|---|---|---|---|
| North | South | |||
| 30°S | Benguela Current | 16 | ||
| Upper water | Brazil Current | 10 | ||
| Central part of South Atlantic gyral | 7 | 7 | ||
| Intermediate water | 9 | |||
| Deep water | 18 | |||
| Bottom water | 3 | |||
| 0° | Upper water | 6 | ||
| Intermediate water | 2 | |||
| Deep water | 9 | |||
| Bottom water | 1 | |||
The transport through vertical sections in the South Atlantic can be studied in greater detail, and approximate values can be computed for the amounts of the different types of water which are carried to the north and to the south, taking the continuity of the system into account. In table 76 are shown results of such computations, as referred to a section in 30°S. The table also contains values for the transport across the Equator, but these have been obtained in a different manner. The value of a northward transport of about 6 million m3 per second of upper water is mainly based on a comparison between the waters of the Caribbean Sea and the Sargasso Sea, and the values of the northward transports of intermediate and bottom water are estimated.
The approximate correctness of the figures can be checked by considering that the net transport of salt must be zero. A calculation of the net transport of salt requires knowledge of the velocity distribution within the different parts of the current system, but a rough computation which is based on average values confirms the above conclusions. We shall have to return to some of these matters when discussing the deep-water circulation, but here it will be emphasized that a large quantity of South Atlantic Central and Intermediate Water crosses the Equator and enters the North Atlantic Ocean, where it exercises an influence on the character of the waters along the coast of South America and in the Caribbean Sea and in the Gulf of Mexico.
In his discussion of the currents of the South Atlantic, Defant (1941) shows that in lat. 30°S to 45°S the stream lines of the currents are wave-like, the apparent wave length being 850 to 880 km. He points out that according to a theory of Rossby, extended by Haurwitz (1940), stationary wave patterns in a primary current are possible, provided that a relation exists between the velocity and width of the primary current and the wave length of the disturbance. Using this relation and introducing measured values of the width of the current across the South Atlantic and the wave length of the disturbances, Defant obtains a velocity of about 27 cm/sec for the primary current, in good agreement with values derived from the geopotential topography of the sea surface.
The wave pattern must be quasi-stationary because it is derived from observations in different years. Defant suggests that it is related to the topography of the bottom, but if this is true the deflections caused by the bottom topography must be in the opposite direction from those which were described on p. 466 (see fig. 116, p. 467 and fig. 117, p. 468). It is perhaps more likely, as also suggested by Defant, that the wavelike disturbance originates where the Brazil Current and the Falkland Current meet.
Oxygen Distribution. The major features of the oxygen distribution are shown in the longitudinal sections in fig. 43, p. 210, and fig. 210, p. 748. According to these sections the oxygen content of the central water is low near the Equator where, off west Africa, minimum values below 0.5 ml/L are found at a depth of about 350 m. This minimum is less pronounced off the coast of South America, where the minimum values are only slightly below 3 ml/L. The great depletion of oxygen along the African west coast is probably due to the oxidation of remains of organisms which fall towards the bottom from the productive region of the Benguela Current.
On the American side (fig. 210, p. 748), the Antarctic Intermediate Water is characterized by high oxygen content and this water mass can therefore be traced by means of a tongue of maximum oxygen values which extends nearly to the Equator. In the transition layer, below the