The North Pacific Ocean
Water Masses of the North Pacific Ocean. In the North Pacific Ocean one encounters a Subarctic Water mass which is characterized in about lat. 50°N by an average temperature between 2° and 4° and by a salinity which at the surface may be as low as 32.00 ‰ but
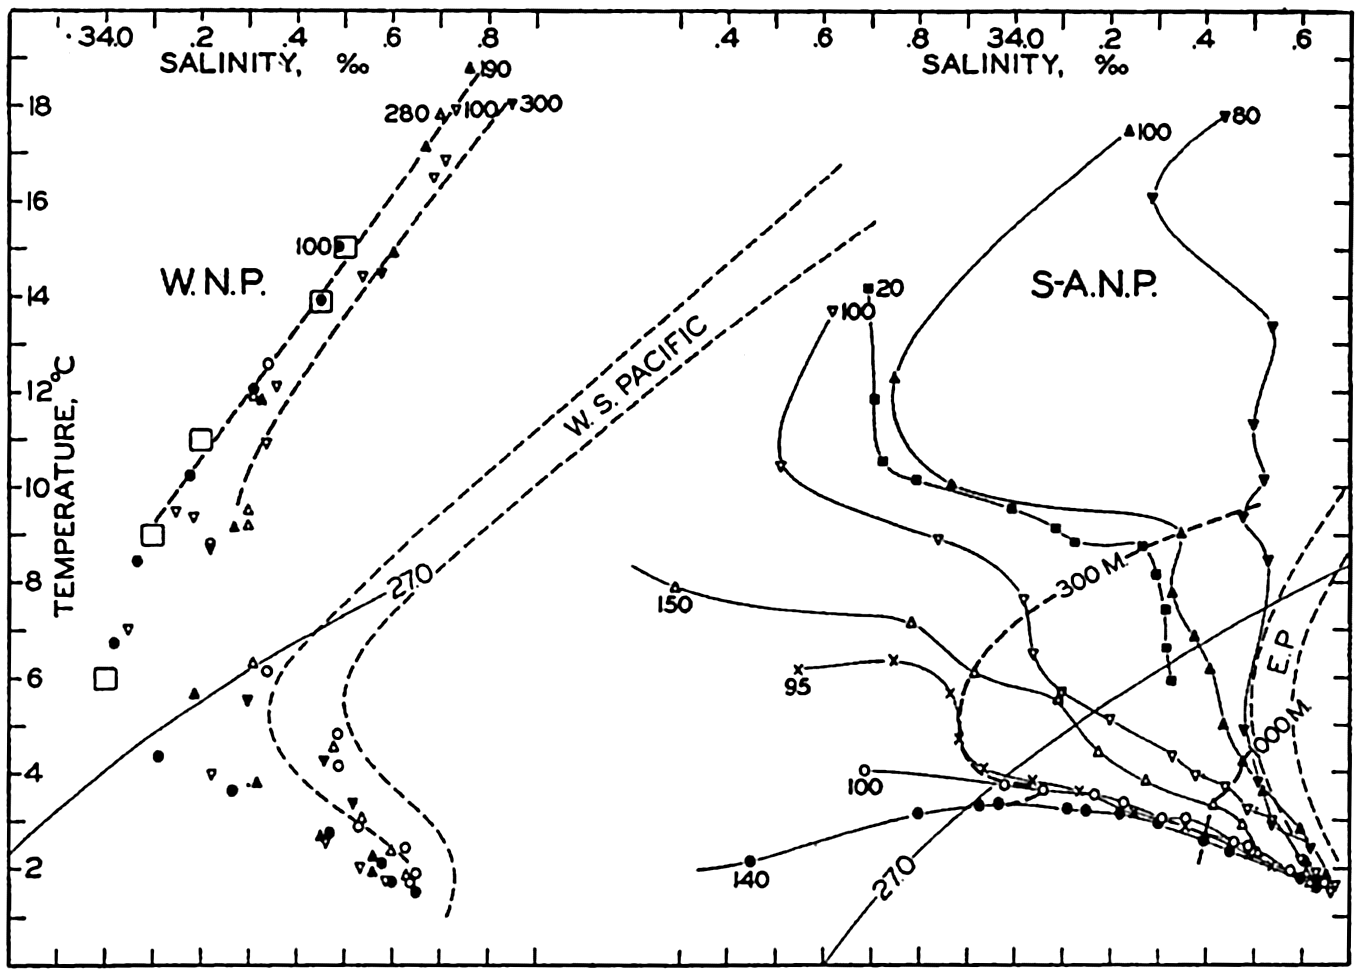
Temperature-salinity relations in the North Pacific Ocean. The areas of the Subarctic and the Western North Pacific waters and the locations of stations are shown in fig. 196. The depths of the shallowest values are entered, and to the left the large squares represent winter surface values near the Subtropical Convergence. W.N.P., Western North Pacific; S-A.N.P., Subarctic North Pacific.
[Full Size]
The term Subarctic Water should be applied strictly only to the water to the north of 45°N, but for the sake of convenience the name will be used for the entire North Pacific Subarctic Water mass, the character of which is illustrated to the right in fig. 199. In about lat. 23°N, off the south coast of Lower California, the Subarctic Water converges with the Equatorial Water. At Station B 307 in lat. 22°22′N, nearly pure Equatorial Water was present; at Station S 79 in lat. 25°22′N the water below a depth of 300 m, where a temperature of 9° and a salinity of 34.35‰ was observed, approached the equatorial type. The bend in the T-S curve at that station suggests that an intrusion of Equatorial Water takes place below the depth of 300 m where the bend occurs.
Below 300 m the stations between lat. 22°N and 45°N show T-S curves intermediate in character between those characteristic of the true Subarctic Water of the North Pacific and the Equatorial Water; this fact suggests that the water at these stations is formed by lateral mixing between those two large and well-defined water masses. Such mixing is facilitated by a northward penetration along the coast of water that contains a large component of Equatorial Water (Sverdrup and Fleming, 1941, Tibby, 1941). This penetration is shown in fig. 199 by the T-S curve at station S 59, which lies about 30 km from the coast and at which the water is of more equatorial character than at station 55 in nearly the same latitude but about 550 km from the coast.
In the western North Pacific a well-defined Central Water mass appears to be present, because very similar T-S curves have been obtained from such widely separated localities as Carnegie station 106 in lat. 16°N and long. 152°E and Bushnell station k in lat. 24°N and long. 163°W (fig. 199, left). At Dana station 3719, 21°N and 126°E, and Carnegie station 113, 34°N and 142°E, water of nearly the same character was encountered, but of a slightly higher salinity due perhaps to admixture of Equatorial Water. This Central Water mass covers an area nearly as great as the area of the North Atlantic Ocean, but it does not extend all the way across the Pacific Ocean. It is perhaps formed in latitudes 30°N to 40°N and longitudes 150°E to 160°E, where in February the T-S relation at the surface is similar to the vertical T-S relation of the water mass.
Other observations indicate that between the Hawaiian Islands and the American coast an Eastern Central Water mass occurs, but this is of much smaller extent and is separated from the adjoining water masses by wide areas of transition. In order to demonstrate the character of this water mass, the T-S curves have been plotted from a series of stations between San Diego and the Hawaiian Islands occupied by the Bushnell in 1939, and from a series of stations between Dutch Harbor, Aleutian Islands, and the Hawaiian Islands occupied by the Bushnell in 1934 (fig. 200).
At the two stations closest to the coast of California, Subarctic Water was present of the same character as that shown by the curves in fig. 199. Between stations 309 and 310 a very marked transition took place; at station 309 the water of a temperature of 15° had a salinity of 33.55‰, whereas at station 310 the corresponding salinity was 34.40‰. In the central area between the coast and the Hawaiian Islands the T-S curves show considerable similarity to each other, but the slope of the curves is much greater than the slope of the corresponding curves which characterize the Western Central Water mass. In order to demonstrate this feature the T-S relations of the latter water mass have been indicated in the figure. Close to the Hawaiian Islands station 316 shows considerable
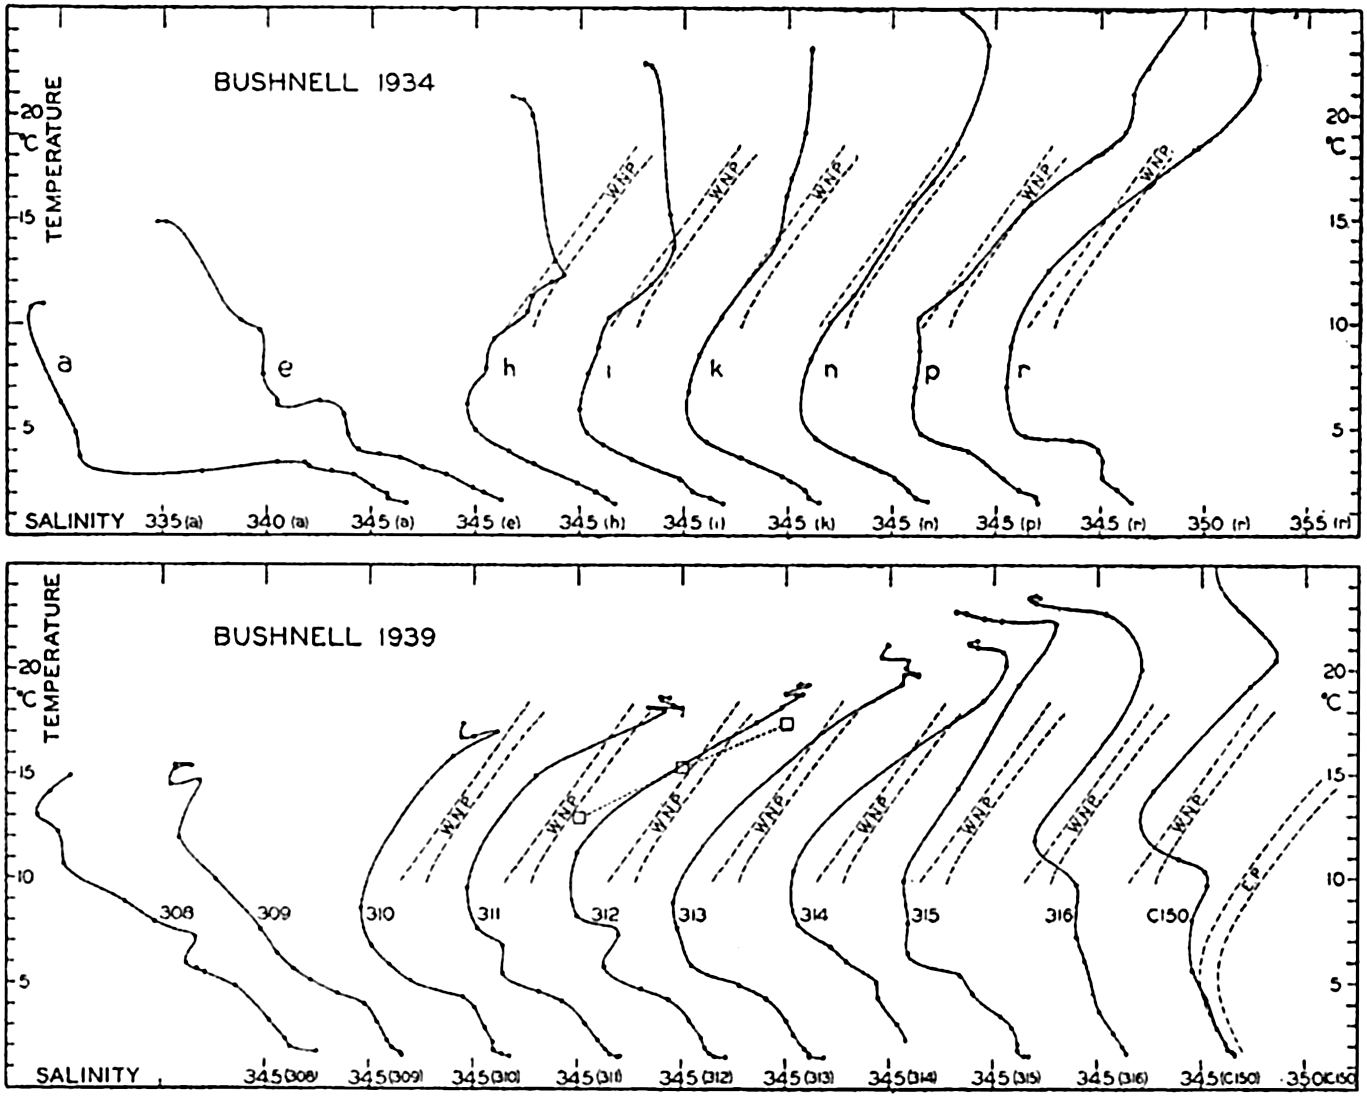
Upper: T-S curves at a number of Bushnell stations of 1934 between the Aleutian and the Hawaiian Islands. Lower: T-S curves at a number of Bushnell stations of 1939 between San Diego, California, and the Hawaiian Islands, and at station Carnegie 150 to the southeast of the Hawaiian Islands. The T-S relations of the Western North Pacific and the Equatorial Pacific are shown. Large squares represent winter surface values in about lat. 40°N, long. 140°W. The stations used are located along B34 and B39 in fig. 196.
[Full Size]
Proceeding south from the Aleutian Islands, the northern stations show Subarctic Water, but between stations e and h a transition takes place. At station e Subarctic Water is found, but at station h Western Central Water is present, as is evident from the lines marked WNP in the figure. This same water mass is present at stations i, k, and n, but between stations n and p a new transition takes place, water more similar to the Eastern Central Water being present at stations p and r.
From this description it is evident that in the North Pacific (as in the South Pacific, see p. 701) we encounter three typically different water masses which are separated by regions of transition: the Subarctic Water mass which penetrates toward the south along the west coast of North America and two Central Water masses of which the western occupies the larger area. The existence of these two Central Water masses indicates that in the North Pacific the circulation is also characterized by the presence of two separate gyrals of which the western is the larger. The location of the eastern gyral coincides approximately with the average location of the Pacific high-pressure area, but on an average no corresponding high-pressure area is found over the western Pacific. The development of the western gyral can therefore not be a direct effect of the prevailing winds but may be related to the boundaries of the ocean.
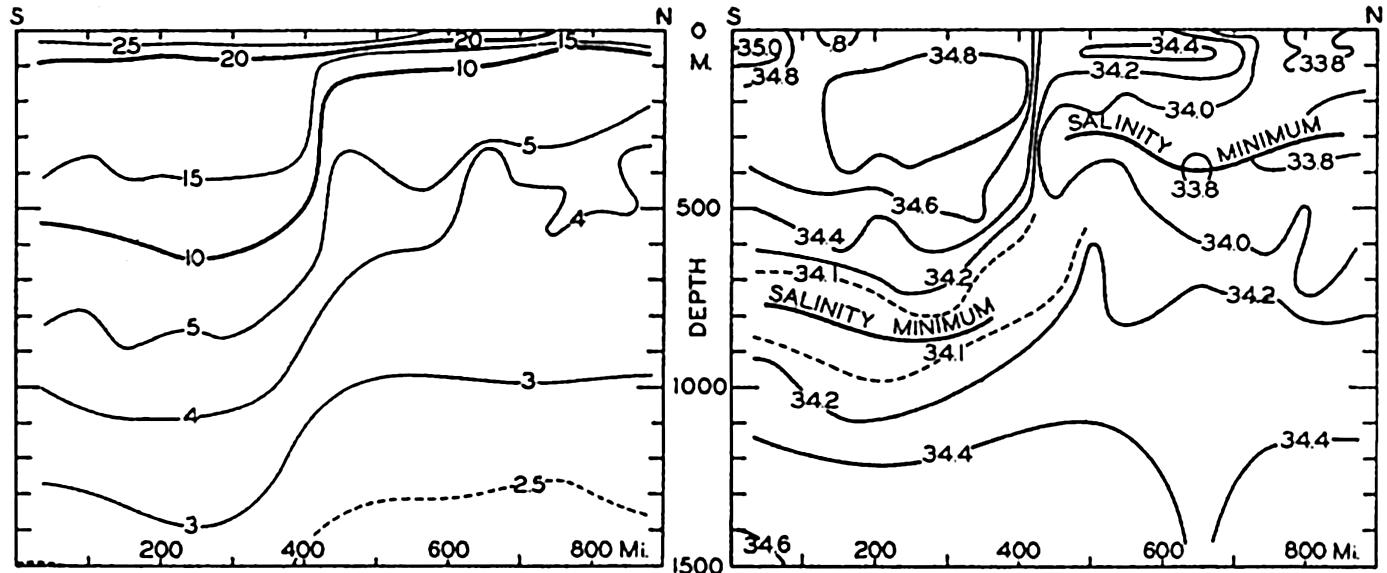
Distribution of temperatures and salinities in a vertical section between lat. 30°28′N, long. 150°04′E, and lat. 42°40′N and 157°00′E. (After Uda.)
[Full Size]
In the North Pacific the most complicated hydrographic conditions are encountered in the waters to the northeast of Japan, where the Subarctic Water carried south by the cold Oyashio meets the warm Central Water carried northeast by the Kuroshio. The Kuroshio follows closely along the coast of Japan as far as lat. 35°, where it turns east, sending branches off toward the northeast, where intensive mixing with the waters of the Oyashio takes place. Numerous eddies are present and the different branches of the current are often separated by sharp lines of demarcation, which are visible as “tide rips” on the sea surface (Uda, 1938a).
The sharp transition from one water mass to another is illustrated in fig. 201, showing temperatures and salinities in a vertical section between the points lat. 30°28′N, long. 150°04′E and lat. 42°40′N, long. 157°0′E, about 1000 km from the coast. The waters of the Kuroshio are present to the south of lat. 36°N, where an abrupt transition takes place to waters which, above 200 m, represent Kuroshio water greatly diluted by
Both to the north and to the south of lat. 36°N an Intermediate Water is present, characterized by a salinity minimum. Below the Kuroshio water the salinity minimum is found at a depth of about 800 m, and the lowest salinity values are between 34.00‰ and 34.1‰, whereas below the mixed water to the north of lat. 36°N the salinity minimum is found at a depth of 300 m, the lowest salinities being less than 33.8‰. The oxygen content of the Northern Intermediate Water is considerably higher than that of the Southern.
Intermediate Water is present below the Central Water masses all over the North Pacific Ocean. On the basis of the Carnegie data, the Bushnell data, and the numerous observations on Japanese expeditions in the western part of the Pacific, the somewhat schematic picture in fig. 202 has been prepared, showing the value of the salinity at the minimum layer. Smooth curves have been drawn in the western area in order to bring out the main features, omitting the numerous details which would confuse the presentation. Within the Subarctic Water no salinity minimum is present; the curves have therefore been carried only to the boundary region between the Subarctic Water and the Central Water masses. The depth of the layer of minimum salinity is indicated by a few numerical values. In lat. 10°N two depths have been entered because there the layer of salinity minimum appears to divide, one branch rising toward the surface at the northern limit of the Equatorial Countercurrent, and one branch sinking and approaching the minimum layer of the Equatorial Water mass (see fig. 198). Similarly two depths are entered in lat. 28°N, long. 130°W, because several stations in that region show a double minimum (see fig. 200).

Salinity in the layer of minimum salinity of the North Pacific. The direction of flow is indicated by arrows. The approximate depths (in meters) of the minimum values are shown. Where two minima are present, one of the depths is entered in parenthesis.
[Full Size]
In order to understand the distribution of salinity within the minimum layer it is necessary to discuss the probable flow of the water, to which we
Below the Intermediate Water the salinity increases regularly, reaching maximum values of 34.65‰ to 34.67‰ at the bottom. No salinity maximum is present between the minimum layer and the bottom, but in several regions the salinity is constant in the lower 1000 m.
The Currents of the North Pacific Ocean. There is considerable similarity between certain currents of the North Pacific and of the North Atlantic Oceans, but there are also striking differences due mainly to the occurrence of large quantities of Subarctic Water in the North Pacific, as contrasted to the small amounts of that type in the North Atlantic. The Subarctic Water of the Pacific and the currents that carry Subarctic Water are present in the northern and eastern areas and similarity to the North Atlantic is therefore found in the southern and western part of the ocean, where the North Equatorial Currents correspond to each other and where the Kuroshio corresponds to the Florida Current and the Gulf Stream.
The North Equatorial Current of the Pacific Ocean runs from east to west, increasing in volume transport because new water masses join the current from the north. The very beginning of the North Equatorial Current is found where the waters of the Equatorial Countercurrent turn to the north off Central America. To these water masses are later added the waters of the California Current, which have attained a relatively higher temperature and salinity owing to heating and evaporation, and which have been mixed with waters of the tropical region. Between the American coast and the Hawaiian Islands, Eastern North Pacific Water is added to the equatorial flow, and to the west of the Hawaiian Islands a considerable addition of Western North Pacific Water appears to take place. In about long. 160°W the volume transport of the North Equatorial Current above a depth of 1000 m is, according to Carnegie
It is probable that, before reaching the western boundary of the ocean, the Equatorial Current begins to branch off, mainly to the north but partly to the south, feeding the countercurrent. To the east of the Philippine Islands a definite division of the current takes place, one branch turning south along the coast of the island of Mindanao and the larger branch turning north, following closely the east side of the northern Philippine Islands and the island of Formosa. The intensity of the flow to the south varies with the season (p. 712) and so probably does the flow to the north.
After having passed the island of Formosa, the warm waters continue to the northeast between the submarine ridge on which the Riukiu Islands lie and the shallow areas of the China Sea. On reaching lat. 30°N the current bends to the east and then to the northeast, following closely the coast of Japan as far as lat. 35°N. The name Kuroshio is particularly applied to the current between Formosa and lat. 35°N, but in agreement with the nomenclature used when dealing with the currents of the Atlantic, and following Wüst (1936), we shall apply the name “Kuroshio System” to all branches of the current system and shall introduce the following subdivisions:
The Kuroshio. The current running northeast from Formosa to Riukiu and then close to the coast of Japan as far as lat. 35°N.
The Kuroshio Extension. The warm current which represents the direct continuation of the current and flows nearly due east, probably in two branches, and can be traced distinctly to about long. 160°E.
The North Pacific Current. The further continuation of the Kuroshio Extension which flows toward the east, sending branches to the south and reaching probably as far as long. 150°W.
To these three major divisions of the Kuroshio System can also be added the Tsushima Current, the warm current that branches off on the left-hand side of the Kuroshio and enters the Japan Sea following the western coast of Japan to the north, and the Kuroshio Countercurrent, part of a large eddy on the right-hand side of the Kuroshio.
The Kuroshio. The great similarity between the Kuroshio and the Florida Current has been pointed out by Wüst (1936). Wüst compares the Kuroshio between the Riukiu Islands and the continental shelf to the current through the Caribbean Sea and the flow of the Kuroshio across the Riukiu Ridge in lat. 30°N to the flow through the Straits of Florida. This part of the Kuroshio, as well as the current to the south of Shiono-misaki in lat. 33°N, long. 135°W, has been studied by Japanese oceanographers, who have conducted current measurements and have occupied a large number of oceanographic stations. The results have been discussed mainly by Wüst (1936) and Koenuma (1939). According to Koenuma, the current between Formosa and the southern of the Riukiu Islands reaches to a depth of about 700 m and the maximum velocity near the surface is 89 cm/sec. These figures are based on computations, but are in good agreement with direct measurements at one station in the passage. The transport amounts to about 20 million m3/sec. Similar conditions are encountered further north, between the northern of the Riukiu Islands and the continental shelf; here, however, a weak counter current appears to be present on the left-hand side of the main flow. The maximum velocities in this profile are somewhat above 80 cm/sec and the computed transport is 23 million m3/sec.
The profile to the south of Shiono-misaki has been discussed both by Wüst and Koenuma, who do not agree in their interpretation of the measurements, particularly as to the depth of the level of no motion. Wüst assumed that the level of no motion coincides approximately with the 10° isothermal surface, which nearly represents the upper boundary of the Intermediate Water; but this assumption leads to computed velocities which are considerably below the observed ones. Koenuma, on the other hand, assumes that close to the coast the observed velocity of the Intermediate Water, 16 cm/sec to the northeast, is correct, and furthermore assumes that at greater distances from the coast the Intermediate Water flows toward the southwest at a velocity of about 5 cm/sec. These assumptions are based on a number of considerations that appear to be valid. In this manner Koenuma arrives at a computed velocity distribution in good agreement with observations. The Kuroshio runs here very close to the coast with maximum velocities up to 160–180 cm/sec (up to 3½ knots), but extends only to a distance of 140 km from the coast. At greater distances a countercurrent flows to the southwest within which maximum velocities up to 20 cm/sec are encountered, in agreement with ships’ observations. The character of the Kuroshio is here closely related to that of the Florida Current to the south of Cape Hatteras. The transport of the Kuroshio between the coast and its outer limit is greatly increased, but the countercurrent on the right-hand side carries large amounts of water in the opposite direction.
The temperatures of the Kuroshio water are comparable to those of the Florida Current but the salinities are much lower, the maximum salinity in the Kuroshio being slightly less than 35.00‰, whereas the maximum salinity in the Florida Current is about 36.50‰. This difference reflects the general lower salinity of the Pacific as compared to the Atlantic. The temperature of the Kuroshio is subject to a large annual variation (p. 131) related to excessive cooling in winter by cold offshore winds. Off Shiono-misaki the annual range at the surface amounts to nearly 9° and at 100 m the range is still nearly 4.5°.
The Kuroshio Extension. In lat. 35°N, where the Kuroshio leaves the coast of Japan, it divides into two branches; one major branch turns due east and retains its character as a well-defined flow as far as approximately long. 160°E, and one continues toward the northeast as far as lat. 40°N where it bends toward the east. The major branch is evident on charts showing the anomaly of the surface temperature or the difference between air and surface temperatures in winter. According to Schott (1935) a tongue within which this difference is greater than 4°C extends east toward long. 170°E, that is, beyond the eastern limit of the well-defined flow. Between long. 155° and 160°E considerable water masses turn toward the south and southwest, forming part of the Kuroshio countercurrent which runs at a distance of approximately 650 km from the coast as the eastern branch of a large whirl on the right-hand side of the Kuroshio.
According to the vertical sections of temperature and salinity in fig. 201, the Kuroshio Extension is, in long. 153°E, still a narrow current, but continuing toward the east a section in long. 162°E (Uda, 1935) shows that the current has been broken up into a number of branches separated by eddies and countercurrents. The change corresponds to the one which, in the Atlantic Ocean, takes place between the regions to the south of the Grand Banks and to the north of the Azores (see fig. 186, p. 681).
The northern branch of the Kuroshio Extension becomes rapidly mixed with the cold waters of the Oyashio that flow south close to the northeastern coasts of Japan, reaching nearly to 35°N. The extensive work of Japanese oceanographers (Uda, 1935, 1938b) shows that along the boundary between the Kuroshio Extension and the Oyashio numerous eddies develop, within which a thorough mixing of the water masses takes place. From the sections in fig. 201 it is evident that to the north of lat. 36°N the Kuroshio waters, which can be traced to lat. 41°N, have been greatly diluted by the Oyashio water. These processes of mixing gradually form the water mass that is present in the northwestern
The North Pacific Current. Under this name is understood the general eastward flow of warm water to the east of long. 160°E. Details of this flow are not known, but from the Bushnell section of 1934 (fig. 200) it is evident that Kuroshio water crosses long. 170°W, because at a number of Bushnell stations the T-S curves are similar to those of the Kuroshio Water. The greater part of this water appears to turn around toward the south before reaching 150°W, and only a small portion continues and flows south between the Hawaiian Islands and the west coast of North America after having been mixed with waters of different origin. The main part of the North Pacific Current does not, therefore, extend across the Pacific Ocean but turns back toward the west in the longitude of the Hawaiian Islands.
The Aleutian (Subarctic) Current. To the north of the North Pacific Current one finds a marked transition to an entirely different type of water, the Subarctic Water, which also flows toward the east. According to the Bushnell observations the transport of Subarctic Water between the Aleutian Islands and lat. 42°N amounts to about 15 million m3/sec above the 2000-decibar surface. This water mass must have been formed by mixing of Kuroshio and Oyashio water, the temperature of the mixture having been reduced by cooling and the salinity of the upper layer decreased by excessive precipitation. One branch of the Aleutian Current turns north and enters the Bering Sea, following along the northern side of the Aleutian Islands and circling the Bering Sea counter clockwise. In the Bering Sea these waters are further cooled, and flowing south they reach the northern islands of Japan as the cold Oyashio. The amount of water in this gyral is not known, but inflow and outflow from the Bering Sea must be nearly equal, wherefore it follows that the 15 million m3/sec of Subarctic Water which continues east on the southern side of the Aleutian Islands are supplied by the Kuroshio, the waters
Before reaching the American coast the Aleutian Current divides, sending one branch toward the north into the Gulf of Alaska and another branch toward the south along the west coast of the United States. The former branch is part of the counterclockwise gyral in the Gulf of Alaska. It enters the gulf along the American west coast, and since it comes from the south it has the character of a warm current in spite of the fact that it carries Subarctic Water. It therefore exercises an influence on the climatic conditions similar, on a small scale, to that which the North Atlantic and the Norwegian Currents exercise on the climate of northwestern Europe. The major branch, which turns toward the south along the west coast of the United States, is known as the California Current, but before dealing with this it is desirable to discuss the warm-water currents between the Hawaiian Islands and the American West Coast.
The Eastern Gyral in the North Pacific Ocean. The existence of an eastern gyral is recognized mainly by the character of the water masses and by the results of computations based on observations between the Hawaiian Islands and the coast of California and between the Hawaiian Islands and the Aleutian Islands. The study of water masses (fig. 200, p. 715) brought out that a distinctly different water mass was present in the region to the east of the Hawaiian Islands, a mass in part formed at the boundary between the warmer waters and the Subarctic Water between long. 130° and 150°W. Computation of currents and transport, the results of which are shown schematically in fig. 205, p. 727, leads to the conclusion that a clockwise rotating gyral is present in the eastern North Pacific with its center to the northeast of the Hawaiian Islands. It is probable that the location of this gyral changes with the seasons and shifts from year to year, so that occasionally the gyral may lie entirely to the northeast of the Hawaiian Islands, whereas in other circumstances the Hawaiian Islands may lie inside the gyral. If the gyral is displaced considerably to the north, Equatorial Water may reach as far north as to the Hawaiian Islands, as was observed in 1939 at Bushnell station 316 (see fig. 200, p. 715). At the surface the gyral is masked by wind-driven currents.
The existence of this gyral is confirmed by the values of the salinity at the salinity maximum (fig. 202). The high values which are found to the northeast of the Hawaiian Islands must be associated with a flow to the northeast, and the presence of two salinity minima in about lat. 28°N and long. 130°W must be related to the circulation. The upper minimum at which the salinity is about 33.95‰ is probably formed where the Central Water mass spreads over the Subarctic Water; the lower minimum at which the salinity is about 34.10‰ represents the
The California Current. The California Current represents, as already explained, the continuation of the Aleutian Current of the North Pacific. The name is applied to the southward flow between lat. 48° and 23°N, where the Subarctic Water converges with the Equatorial (fig. 199, p. 713). The outer limit of the California Current is represented by the boundary region between the Subarctic Water and the Eastern North Pacific Central Water, and lies in lat. 32°N at a distance of approximately 700 km from the coast, according to the observations by the Carnegie in 1929, the Louisville in 1936, and the Bushnell in 1939. The total volume transport of the California Current above the 1500-decibar surface is probably not more than about 10 million m3/sec, and in view of the great width of the current no high velocities are encountered except within local eddies. As a whole, the current represents a wide body of water which moves sluggishly toward the southeast.
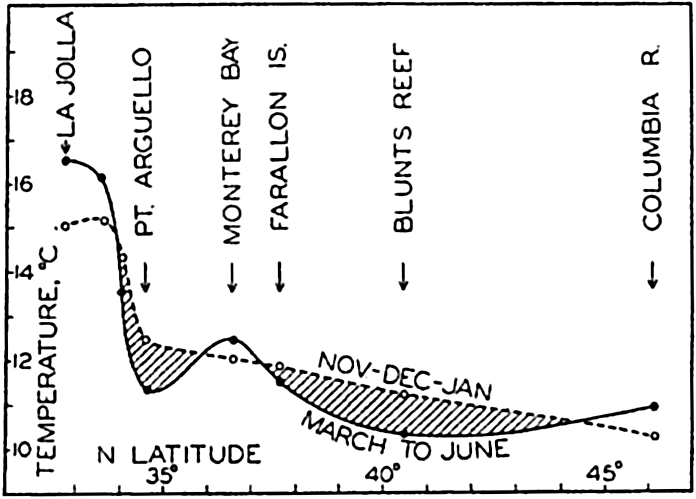
Surface temperatures along the coast of California in March to June and in November to January. In regions of intense upwelling, the average surface temperature is lower in March to June than in December to January.
[Full Size]
In spring and early summer the California Current is a counterpart to the Peru Current, several characteristic features of the two currents being strikingly similar. During these months north-northwest winds prevail off the coast of California, giving rise to upwelling that mostly begins in March and continues more or less uninterruptedly until July. Records of surface temperatures show that on the coast the lowest temperatures regularly occur in certain localities separated by regions with higher surface temperatures. This is demonstrated by fig. 203, in which are plotted the surface temperatures between lat. 32°N and 45°N along the American west coast in March to June and in November, December, and January. In the regions of intense upwelling the spring temperatures are lower than the winter temperatures, but in regions of less intense upwelling they are higher.
Recent work of the Scripps Institution of Oceanography shows that from the areas of intense upwelling tongues of water of low temperature extend in a southerly direction away from the coast; these tongues are separated from each other by tongues of higher temperature extending in toward the coast. Within the tongues of higher temperature the flow
To the north of lat. 30°N the two most conspicuous centers of upwelling are located in lat. 35°N and 41°N. The two swirls associated with these centers of upwelling and the alternating movements away from and toward the coast are shown in fig. 204, which is based on observations in May to July, 1939. The coast to the south of 34°N is under the influence of water which returns after having traveled a long distance as surface water, and, correspondingly, the surface temperatures are much higher there than those encountered where the water was recently drawn to the surface (fig. 203). A third region of intense upwelling is found perhaps in about latitude 24°N, on the coast of Lower California (Thorade, 1909).
The upwelling water rises from moderate depths only, probably less than 200 m (Sverdrup and Fleming, 1941), and the phenomenon therefore represents only an overturning of the upper layers such as is the case in other regions which have been examined. According to McEwen (1934) the rate of upwelling is about 20 m a month and on an average the process is therefore a very slow one. It is, however, of the greatest importance to the productivity of the waters off the coast, because the rising water brings nutrient salts into the euphotic zone. The importance of upwelling to the distribution of phytoplankton (p. 785) has been discussed by Sverdrup and Allen (1939).
During the entire season of upwelling a countercurrent that contains considerable quantities of Equatorial Water flows close to the coast at depths below 200 m (Sverdrup and Fleming, 1941). This subsurface countercurrent appears to be analogous to the subsurface countercurrent off the coast of Peru, the existence of which was shown by Gunther (p. 703). In spring and early summer the currents off the coast of California are therefore nearly a mirror image of those off the coast of Peru, but the similarity is found in this season only because the character of the prevailing winds off California changes in summer, whereas off Peru the winds blow from nearly the same direction throughout the year.
Toward the end of the summer the upwelling gradually ceases and the more or less regular pattern of currents flowing away from and toward the coast breaks down into a number of irregular eddies, some of which carry coastal waters far out into the ocean (Johnson, 1939). Other eddies carry oceanic waters in toward the coast, particularly in the regions between the centers of upwelling, as shown by Skogsberg (1936) in his discussion of the waters of Monterey Bay (p. 131).
In the fall upwelling ceases, and in the surface layers a countercurrent develops, the Davidson Current which in November, December, and January runs north along the coast to at least lat. 48°N. In this season the subsurface countercurrent still exists and the main difference between the seasons without and with upwelling is therefore that in the former a countercurrent is present at all depths on the coastal side of the California Current, whereas when upwelling takes place the countercurrent has disappeared in the surface layer where, instead, a number of long-stretched swirls have developed. This difference suggests that in the absence of prevailing winds that cause upwelling, a countercurrent would appear on the coastal side, as is the case in other localities (see p. 677). In the presence of upwelling the overturn of the surface layers destroys the countercurrent above a depth of 200 m and leads to an entirely different pattern of flow.
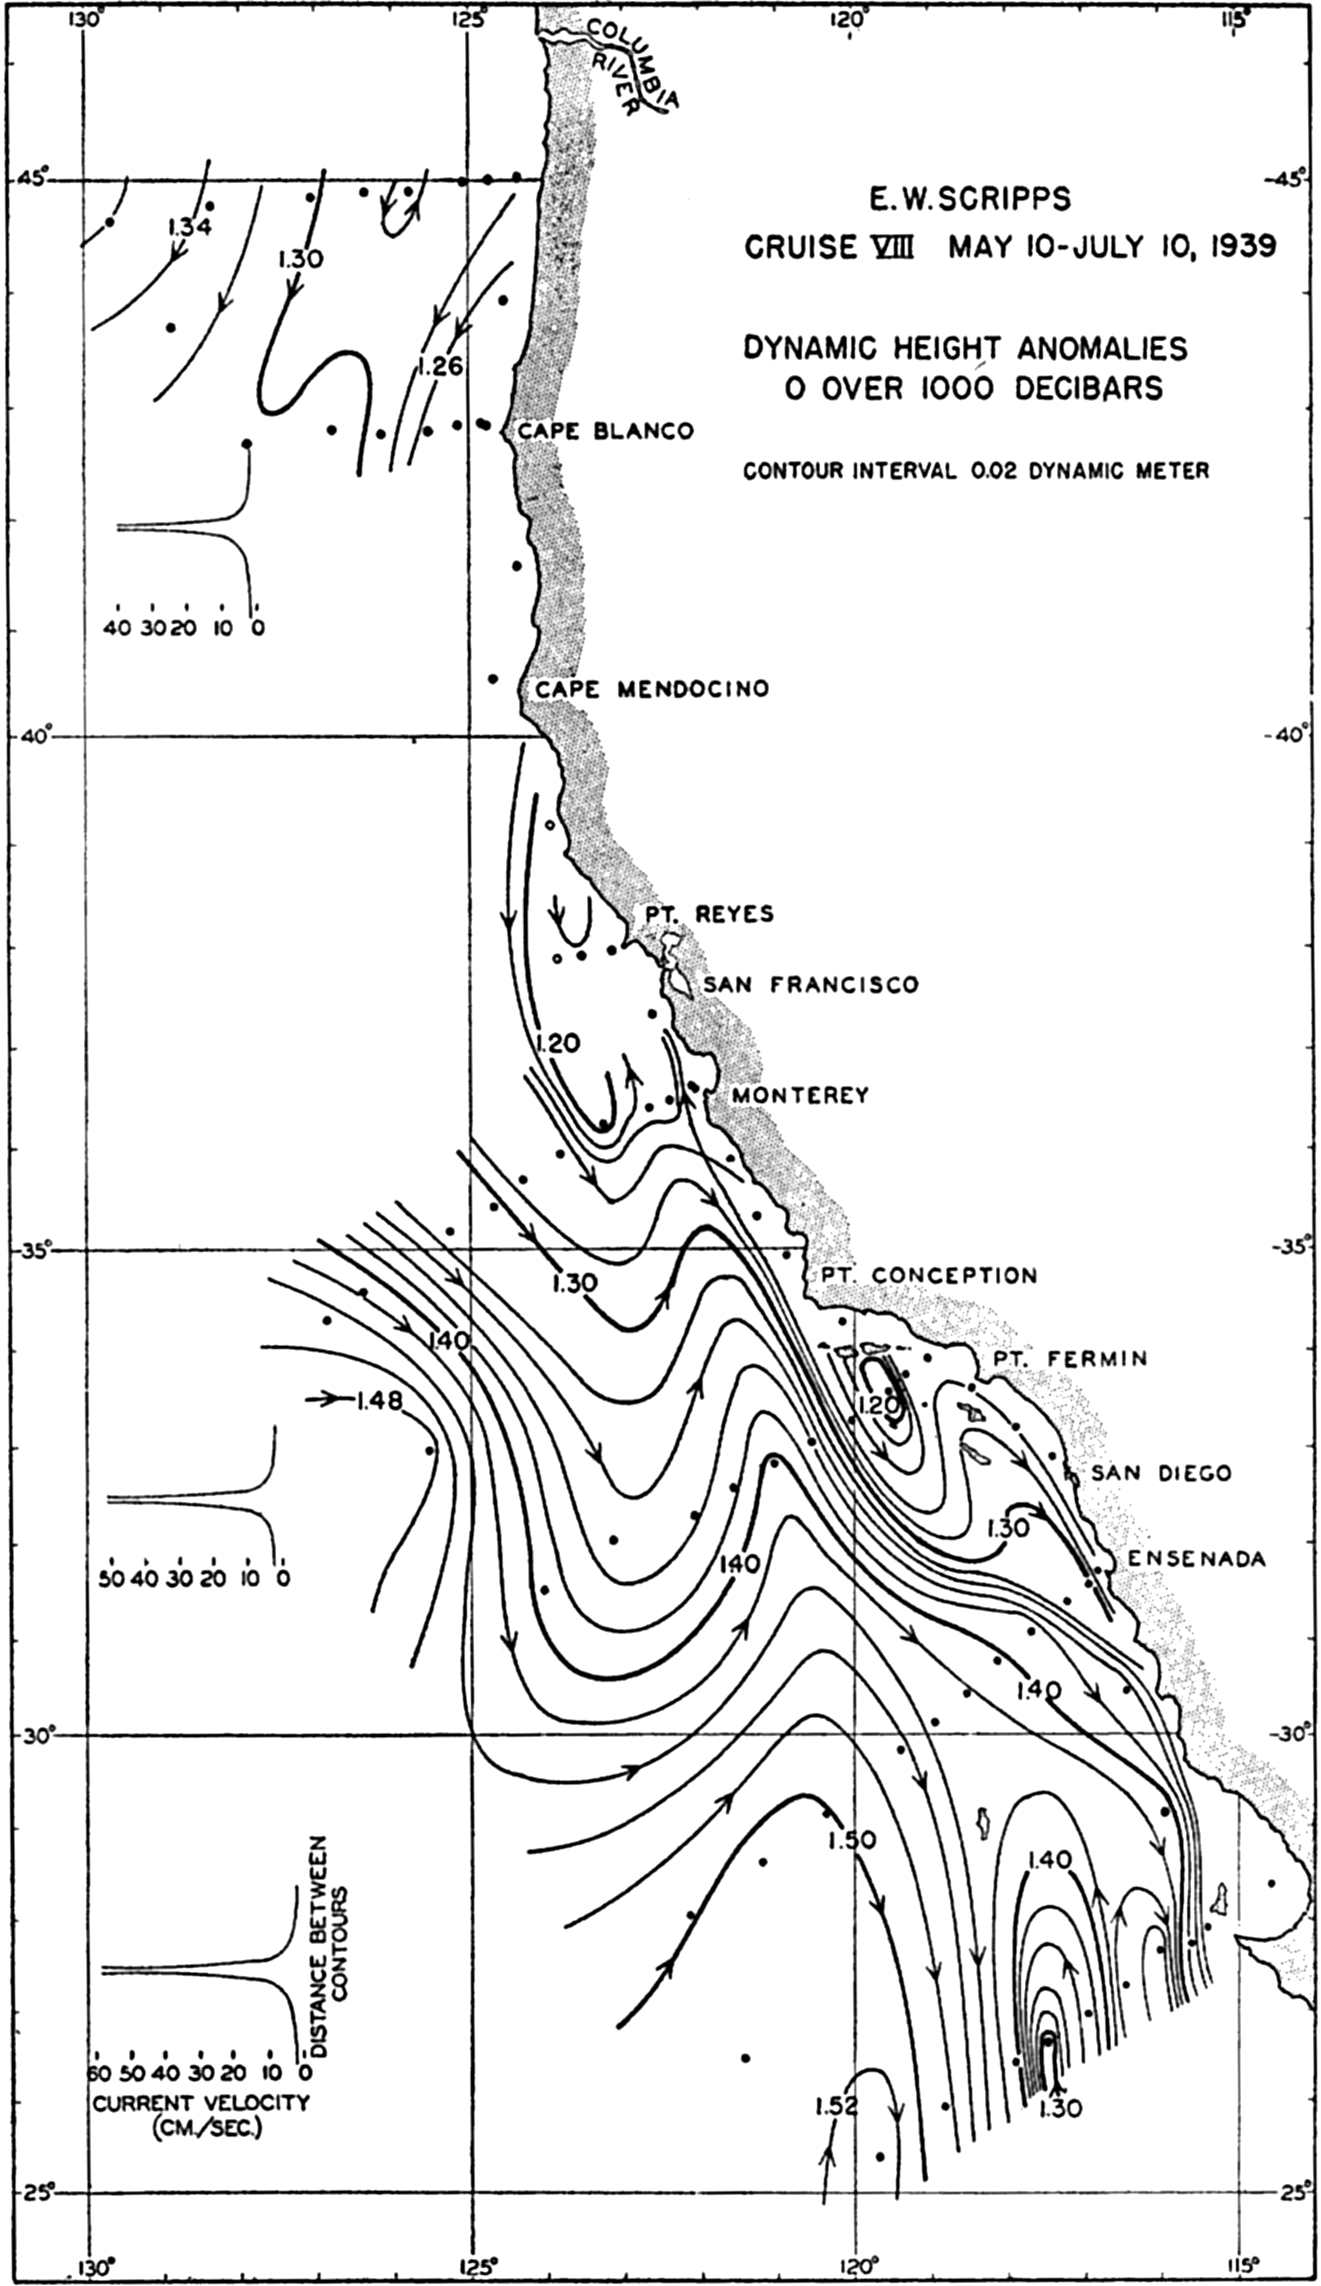
Geopotential topography of the sea surface relative to the 1000-decibar surface off the American west coast in May to July, 1939, showing flow alternating away from and towards the coast.
[Full Size]
Transport. On the basis of the values of the volume transport of the different branches of the current system that have been mentioned and others that have been computed, the schematic picture in fig. 205 has been prepared. The lines with arrows give the approximate direction of the transport and the numbers give the volume transport in millions of m3/sec. In this case the transport numbers include the motion of the Upper and the Intermediate Water because the Intermediate Water of the Pacific appears to flow in general in the same direction as the Upper Water (fig. 202). The lines showing the direction of transport are full-drawn where the upper water masses are warm and dashed where they are cold.
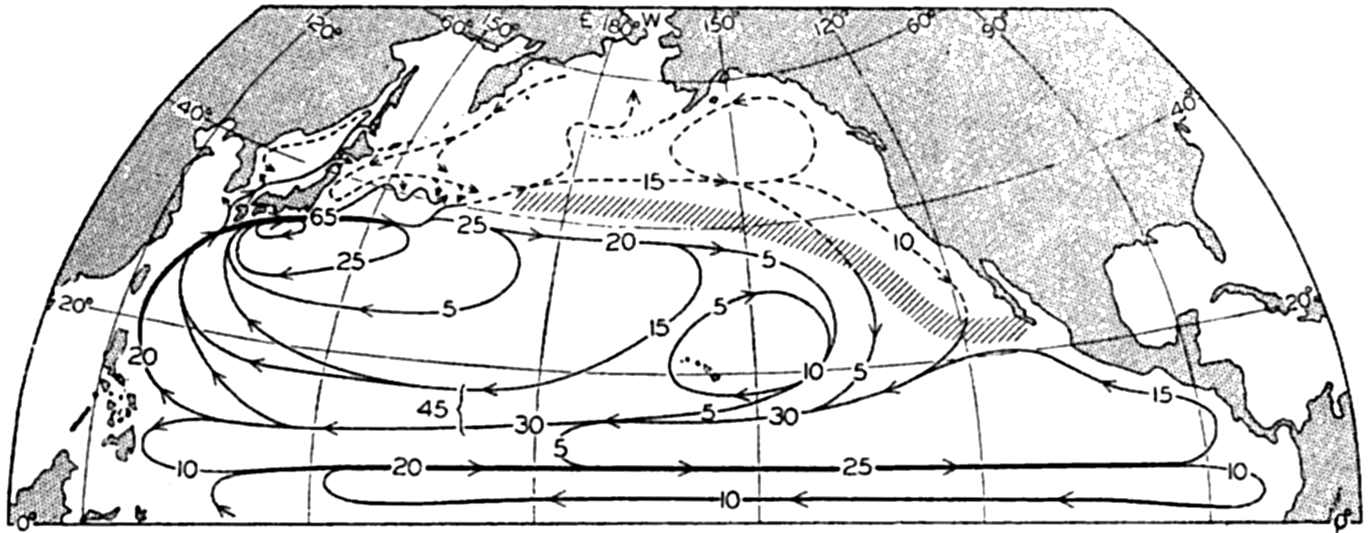
Transport chart of the North Pacific. The lines with arrows indicate the approximate direction of the transport above 1500 meters, and the inserted numbers indicate the transported volumes in millions of cubic meters per second. Dashed lines show cold currents; full-drawn lines show warm currents.
[Full Size]
The figure brings out that in the North Pacific Ocean the Equatorial Countercurrent and the Kuroshio are the two outstanding, well-defined currents. Over the greater part of the Pacific Ocean weak or changing currents are present, and the transport numbers that are entered refer therefore to broad cross sections. The figure intends only to bring out
The Oxygen Distribution in the Pacific Ocean. In the South Pacific Ocean no oxygen observations are available from the central and eastern parts except for a few at two Carnegie stations in about lat. 33°S and long. 110°W. On board the William Scoresby oxygen determinations were made in the waters of the Peru Coastal Current, but so far the data have not been published. From the western South Pacific and from the equatorial part of the South Pacific oxygen values are available at a number of Dana and Carnegie stations.
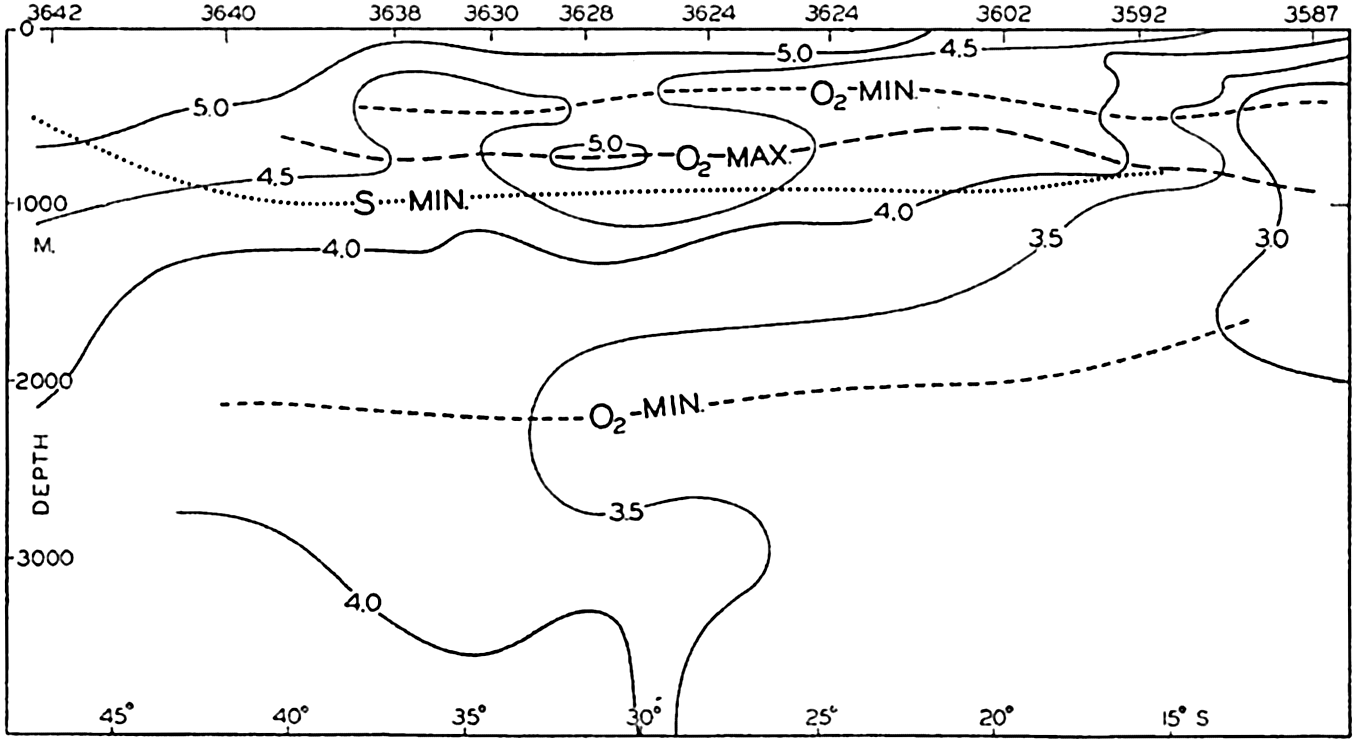
Oxygen distribution (ml/L) in a vertical section along the 180° meridian between latitudes 48°S and 10°S. (According to observations of the Dana.)
[Full Size]
Figure 206 shows the distribution of oxygen in a vertical section which nearly follows the meridian of 180° between latitudes 48°S and 10°S. Near the Antarctic the oxygen content of the water is generally high, decreasing more or less regularly from the surface to a depth of about 2000 m, where the content is a little below 4 ml/L. At greater depth a small increase takes place, such that below 2500 m the content is greater than 4 ml/L. To the north of 40°S an oxygen minimum is present at about 400 m, but below this minimum an intermediate maximum is found between 600 and 800 m. This intermediate maximum lies a few hundred meters above the core of the Antarctic Intermediate Water, which is indicated by the line marked S-min. At about 2000 m a second layer of minimum oxygen is found and below this the oxygen content slowly increases toward the bottom. In a horizontal direction an abrupt decrease in the oxygen content takes place at about 15°S. At 11°S the oxygen content is below 3 ml/L between 300 m and 2000 m and a
According to observations at two Carnegie stations in about lat. 33°S and long. 110°W (see Schott, 1935), the oxygen distribution is there quite similar to that found off New Zealand; but from analogy with conditions within the Benguela Current it appears highly probable that the oxygen content of the subsurface waters is low within the Peru Current, particularly within the Peru Coastal Current. At Dana stations 3559, 3560, and 3561, located to the south of the Equator between long. 104° and 117°W, minimum oxygen values as low as 0.09 ml/L were observed at 400 m. This low-oxygen water probably comes from the coast off Peru, indicating that there a minimum oxygen layer is present within which the oxygen content is even lower than that found off the coast of South Africa. Such conditions should be expected because of the great productivity of the Peru coastal waters and, consequently, the great consumption of oxygen at subsurface depths by decomposition of sinking remnants of organisms.
In the North Pacific the oxygen content of the subsurface waters is as a rule lower than in the South Pacific, but a similar contrast exists between west and east, the oxygen content in the eastern areas being lower than in the western. The lowest oxygen values are consistently found 400 or 500 m below the salinity-minimum layer where such a layer is present, and in the Subarctic Waters at a depth of 600 or 800 m. Minimum values higher than 2 ml/L are found only in the extreme western part to the west of long. 160°E and between the Equator and 36°N. Over the greater part of the North Pacific the minimum values are below 1 ml/L, and off the west coasts of Central America and Mexico the content is nearly nil. Below the minimum layer the oxygen content increases toward the bottom, at which values somewhat above 3 ml/L are found in the western part and somewhat below 3 ml/L in the eastern part.
The most striking feature of the oxygen distribution in the North Pacific is the presence of a very large body of water within which the oxygen content is exceedingly small. This body is found off the American coast between lat. 28°N and the Equator; it extends toward the west like a wedge, gradually becoming more and more narrow, and reaches at least past long. 140°W. Close to the coast the layer of oxygen content less than 0.25 ml/L is found between the depths of 200 to 300 m and 1200 m, and according to Carnegie observations it is found in long. 140°W between 100 and 600 m. It is probable, as already stated, that another water mass of equally low oxygen content extends toward the west from the coast of Peru, but the two water masses appear to be separated by a region of slightly higher oxygen content.
The character of the oxygen distribution off the American west coast is illustrated in fig. 207, showing a section which runs parallel to the
A systematic study of the types of organisms which may be found in this oxygen-poor water has not yet been made. A few scattered observations indicate that organisms are found even where the oxygen content is as low as 0.1 ml/L; the further examination of the distribution of such organisms and their adaptation to the extreme conditions represents one of the fascinating biological problems of the Pacific Ocean.
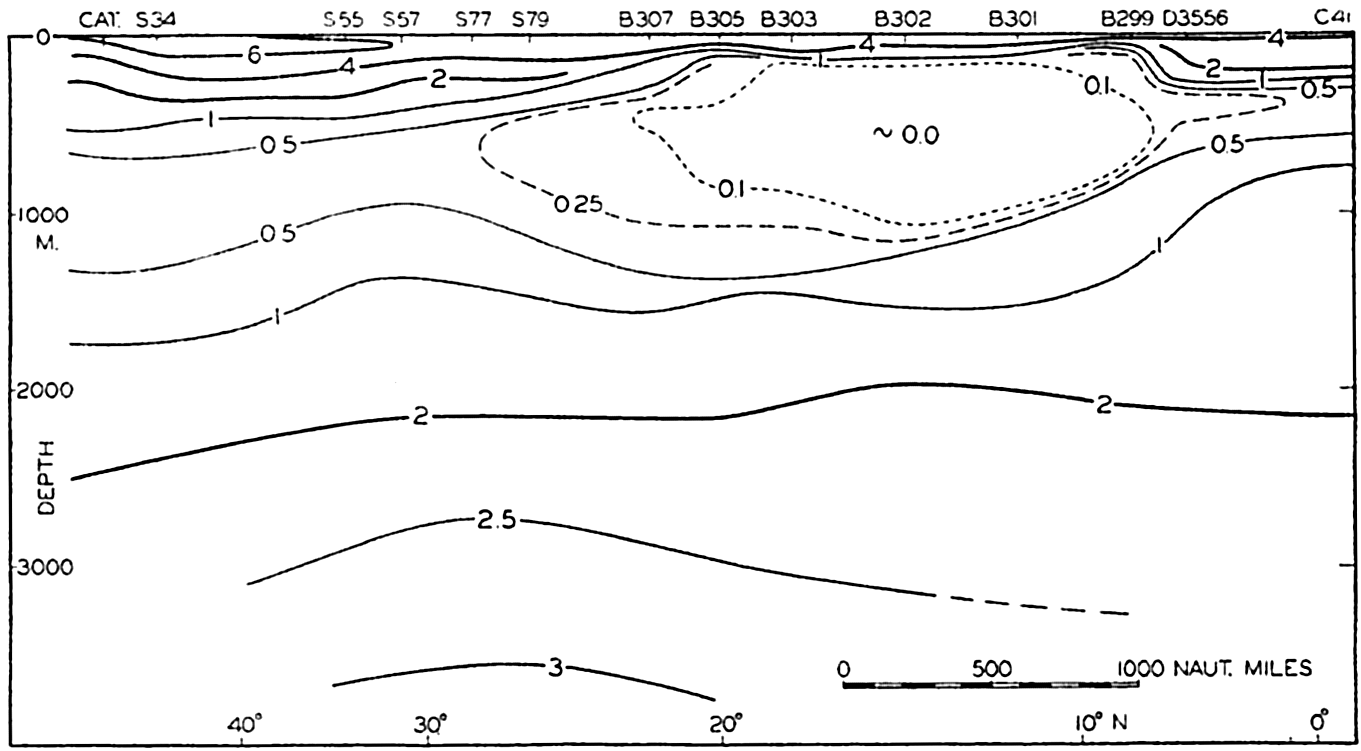
Oxygen distribution (ml/L) in a vertical section along the west coast of North and Central America at a distance of a few hundred miles from the coast (mainly based on observations of E.W. Scripps and Bushnell).
[Full Size]