NINE
Wind Power in California A Case Study of Targeted Tax Subsidies
Alan J. Cox, Carl J. Blumstein, and Richard J. Gilbert
I. INTRODUCTION
The National Energy Act of 1978 and the California acts, AB 1558 and AB 3623, provided a 15% federal energy tax credit and a 25% California energy tax credit for investment in renewable energy sources. In addition to these tax incentives, California utilities, acting in compliance with the provisions of the Public Utility Regulatory Policies Act (PURPA), of-feted attractive rates for the purchase of power from independent electricity producers, further encouraging the development of wind systems.
Wind energy was one of the primary beneficiaries of these tax credits. The impact was greatest in California where a substantial wind industry emerged. In 1980 the California Energy Commission's (CEC's) short-term goal was to have 500 megawatts (MW) of wind-generated capacity on-line by 1987.[1] In fact, there were 1,141 MW on-line by the end of 1985. The number of turbines installed rose from virtually none to over 13,000 by 1986, while energy production from wind grew from essentially zero to over 671 million kwh in 1985. By the end of 1987, there were 1,436 MW installed and 1,700 million kwh were produced from wind machines that year.
This remarkable development provides a good opportunity to examine the consequences of tax subsidies. In this chapter we look at these consequences from a number of perspectives, including those of wind investors, federal and California taxpayers, and California electricity ratepayers. We are interested in finding the costs and benefits of the program and in discovering whether the program could have been better
[1] California Energy Commission (1980b), p. 66. The long-term goal stated in that report was to have 7,000 to 10,000 MW in place by the year 2000. California Energy Commission (1980a), contains similar objectives.
timed, by either limiting the amount of investment in wind turbines or altering the tax and price incentives. We undertake this analysis with the same benefit (and limitations) of hindsight that we employed in examining the Diablo Canyon nuclear project in Chapter 7. We also discuss the impact of the wind program on the direction in which wind technology has been developed. We use the term wind program to refer to the total package of tax incentives and energy payments available to builders of windmills.
The undiscounted economic cost of developing the wind industry in California, net of energy savings, could be as high as a billion dollars, with this cost distributed among electric utility customers and federal and California taxpayers. It is still unclear what costs and performance standards the wind industry will achieve.[2] As a result we cannot be sure whether, for this public investment, a viable wind industry has been created. We do conclude, however, that the amount of investment in wind power in California has been excessive. Too much wind power has been developed at too great an expense, given actual and anticipated energy costs and requirements.
When Congress passed the National Energy Act in 1978, it hoped to achieve several objectives. These objectives included the enhancement of energy security after the 1973 oil embargo by reducing the share of imported oil used in U.S. energy production. Congress also wanted to encourage the development of cleaner, less environmentally damaging sources of energy. Despite these concerns, the 15% tax credit established for wind investments was passed almost as an afterthought, with little evidence that any attempt was made to estimate the cost and benefits of a wind subsidy program.[3] The appropriate analysis should have included some examination of the optimal timing of subsidies if the goals listed above could not be met without such subsidies. Instead of providing such analyses, proponents of wind appealed to traditional arguments for "infant industry" subsidies. Not until about 1985, after the price of oil had collapsed, was there a substantial amount of analysis of the cost targets that windmills had to achieve in order to justify the program.[4]
The infant industry argument rests on the potential to exploit economies of scale by subsidizing early operations. An infant industry would
[2] This uncertainty is expressed in an article in the EPRI Journal of May 1984 and in Merriam (1986) and Smith (1987).
[3] This lack of attention to wind was seen by some to have been one reason that research and development could proceed at an orderly pace. The editorial of the March 1980 issue of the EPRI Journal states: "During the formative years, the U.S. wind program's security lay in its obscurity" (p. 2).
[4] See, for instance, California Energy Commission (1988). Earlier discussion is provided in California Energy Commission (1983). Most reports before 1988 do not even mention the potential impact of the tax credits.
qualify for possible government support if the agents responsible for developing the technology and/or the product cannot appropriate the benefits of their work, as might be the case in basic research. These and other nonmarketable benefits that accrue to society in general are referred to as positive externalities.
Positive externalities are a crucial element in any justification of a subsidy to the introduction of a new technology. In the absence of positive externalities firms will attempt to introduce a new technology as soon as they expect that it can be profitably marketed. Therefore any subsidy directed at speeding up the introduction of the technology will merely reduce the net benefits to be derived from it. If there are externalities, then a subsidy might be justified because benefits will accrue to other firms and individuals.
In 1980 a company that undertook the task of developing an economical wind machine could not ensure that it would receive an adequate return on its investment in research. If the technology is easily imitated, with slight variations to avoid patent infringement, competition would limit the financial return from research and development. Alternatively, the government could undertake all the research and development work in wind and then transfer the technology to firms after it had been fully developed. However, the federal and California governments decided that the most appropriate way to overcome the roadblocks to wind power development was the establishment of generous tax credits and price guarantees for electricity sales.
Because tax credits were chosen as the instrument to spur the development of alternative energy sources, the capital to support that development had to come from private investors who could use the tax credits. With the interaction of the state and federal credits, along with the accelerated depreciation of the machines, most investors could recover about two-thirds of their investment through the reduction of their taxes in less than three years, even with no sales of electricity. If the turbine did perform as projected, the investor could expect to earn a high return (10-20%) from the investment. The large tax write-offs and the promises of wind energy electricity revenues attracted a huge amount of private capital and supported the rapid growth of the industry from 1980 until their expiration at the end of 1986.
There were also some deleterious effects of creating an industry with tax subsidies. The ease of raising private capital, whether through small private partnerships or much larger Wall Street brokerage house-sponsored partnerships, attracted wind farm developers and financial intermediaries with a wide variety of motives. Some manufacturers were more devoted to the sale of tax shelters than the development of a reliable wind turbine. Indeed, most investments failed to live up to their
promised levels of availability or production. Because the tax benefits were based on turbine capital cost rather than performance, it was easy for a developer to sell inferior machines at a hefty profit. A lack of any standardized performance rating system and the newness of the industry also contributed to developers being able to sell turbines with grossly exaggerated performance claims. In 1985 the California wind industry produced only 45% of the energy they projected it would produce (California Energy Commission, 1986b, p. 7).
The huge number of windmills that resulted from the wind program was clearly well above the number needed to develop the technology. But with tax credits in place and contracts to purchase electricity at guaranteed rates the government had little control on the number of windmill tax havens that were established. Once established, the wind incentives proved difficult to eliminate because alternative power providers had a strong incentive to keep the tax credits in place and the costs of the subsidy were spread over large numbers of taxpayers and electric utility customers.
In this chapter we first briefly describe the technology of producing electricity from wind. We then review government policies to encourage wind through its own research, through tax credits, and by mandating favorable rates for electricity purchased from wind generators. This leads to a brief discussion of the type of financial organization that most wind farms formed to maximize the private benefits of the government programs. We then undertake a detailed analysis of who paid the costs and who enjoyed the benefits from investments in two particular wind projects. The results there indicate that about 12% of the total costs of the wind projects were borne by the electric utility. The federal and California governments paid about 16% and 18%, respectively, in foregone tax revenue. In the next section we formally examine the infant industry argument by simulating the wind program. There we try to determine under what conditions, if any, launching an effort on the scale of the wind program would have made economic sense in 1980 or in subsequent years. We find that under the expectations for future prices of oil and gas, the economic losses from starting the wind program in 1980 were not huge. On the other hand, under the revised expectations brought about by the decline in world oil prices, the costs of continuing the program past 1983 should have been anticipated to be very large. The program should have been phased out at the end of 1983 as was called for under the original legislation.
II. WIND TECHNOLOGY
Figure 9.1 shows three basic designs of wind machines; downwind, upwind, and the vertical-axis Darrieus. Each has engineering advantages
and disadvantages. For instance, the downwind machines do not require any controls to keep them pointed into the wind (yaw control), but they lose energy due to the tower's shielding effect, which also results in uneven strain on the rotors. Darrieus windmills, the object of considerable federal research efforts, incorporate the gearbox and generator on the ground. This configuration allows for easier servicing and reduces the amount of structure that would otherwise be required to hold this machinery aloft. In addition, the Darrieus windmill does not have to be pointed into the wind either, thus eliminating the need for yaw control.
Machines are also classified as small (rotor diameter 5 meters or less), intermediate (5-30 meters), and large (30 meters or more). Small to intermediate windmills can be made of relatively simple, off-the-shelf components. Large windmills, however, require more elaborate controls and very heavy structures to prevent damage in high-wind situations. A large part of the research effort in large-scale wind turbines has been in developing the control components and in paring down the size of the structures to reduce cost while at the same time maintaining a reasonable level of reliability.
Most government research effort in the 1970s focused on large machines. Possibly the best result of tax-induced private investment in wind is the diversification it provided in development. Although there has been no commercial spinoff from the government's large windmill effort, private investment has resulted in impressive improvements in the intermediate-scale technology. Reasons for this divergence between the government's research and private development are discussed further below. It may yet turn out that the large-scale wind systems will provide the lower-cost technology.
Large turbines typically have generators above 1 MW, intermediate-sized between 50 and 250 kW, and small turbines are in the range of 1 to 10 kW. The appropriate size of generator for a particular size of rotor depends on wind variability and average wind speed. Figure 9.2 shows output versus wind speed for a hypothetical wind turbine. Below the cut-in speed, the machine cannot operate; above this speed output rises rapidly until the rated speed is reached. Above the rated wind speed, output is constant until the wind reaches the cut-out speed. At that point the machine is turned off to protect it from damage that might result from the stresses of high winds.
The choice of rated speed involves a trade-off between the extra output that can be obtained at higher rated speeds and the extra cost of a larger generator. These trade-offs will be modified for different locations by the distribution of wind speeds. The trade-off is made more complicated by the fact that a windmill operates more efficiently if it rotates faster at higher wind speeds. However, conventional alternating current generators can operate only at a single fixed speed. Requiring rotors to
turn at a fixed speed reduces system efficiency at most wind speeds. The energy in wind increases with the cube of its velocity, but the varying efficiency of the turbines at different wind speeds due to the fixed-rotation constraint results in less than cubic increase in output with wind speeds.[5] Efficiencies are improved by some turbine manufacturers by having two generators, the higher rated of which (in terms of kilowatts) is substituted for the smaller generator as wind speeds increase. Windmills can also be geared at varying ratios, allowing discrete jumps in turbine rotation as wind speed increases.
Because actual wind speed is lower than the rated speed much of the time, the effective capacity of a wind generator is lower than its rated or "nameplate" capacity. The ratio of average output to nameplate capacity (the capacity factor) depends on the wind speed distribution for the site, the curve of output vs. wind speed for the machine and its availability. A typical machine at a good site would have a capacity factor of from 15% to 30% if it operated perfectly and its maintenance could be scheduled when average wind speeds were low.
The intermediate-sized turbines currently prevalent in California have been located in wind parks in which large numbers of wind turbines are clustered. This arrangement offers economies in the construction of roads and tower foundations; in the use of substations, transmission lines, and control facilities; and in maintenance. The clustering of turbines on wind farms does result in problems of interference among windmills, creating variation in power production.
These interactions and, more important, the variability of wind speeds result in wind being a stochastic source of supply. There is already an extensive literature on estimating the value of randomly available electricity supply.[6] The basic concept is that these systems should be credited with the increased reliability that they provide the system. In essence, they are credited with the expected value of the capacity that they produce at a particular, critical time. This is analogous to the treatment of dispatchable power in that there is always some probability that a power plant will not be available when required.
The appropriate credit for wind is something that will change as our understanding of the systems improves. Wind is generally more available in the summer months when California's demand for electricity is greater. On the other hand, peak daily wind output misses the system
[5] Constant speeds are maintained by either of two methods, stall regulation or pitch control. Under the former, the blade of the turbine is designed to cause a stall at higher winds in combination with generators that have high induction resistance at higher speeds. Pitch control merely changes the angle of the blade.
[6] See, for instance, Kahn (1979), VanKuiken et al. (1980), Katzman (1984), and Tabors, Finger, and Cox (1981).
daily peak demand by about eight hours (Smith, 1987, p. 178, and see Chapter 6 of this volume).
Despite this particular phenomenon, wind generation clearly should be given some capacity credit. Smith (1987) estimates a capacity credit equal to 13% of the nameplate capacity of the wind turbines in the Alta-mont Pass. Other areas of the state may provide superior load-matching capabilities.
III. GOVERNMENT POLICIES SUPPORTING THE DEVELOPMENT OF WIND ENERGY
Research and Development
Before the Arab oil embargo there was little government support for the development of wind energy. After the embargo, fairly substantial expenditures were made by the Department of Energy (DOE) and its predecessor agencies. Total expenditures for wind energy research and development in the fiscal years from 1973-1985 were $391 million. These expenditures were small initially but grew rapidly to a peak of $63.4 million in FY 1980 during the Carter administration. They fell steeply during the Reagan administration; expenditures in FY 1985 were only $29.1 million.
Table 9.1 shows the DOE funding by category. The centerpiece of DOE's program has been the development of very large wind turbines. The development efforts have progressed through a series of prototypes and are now focused on producing machines that will have a capacity in excess of 3 MW. These machines are intended to be suitable for commercial use in the 1990s, producing electricity at 4¢/kWh (1985 dollars). Direct expenditures for design and construction in this development effort have consumed approximately a third of DOE's wind-energy budget.[7] In addition to the direct expenditures, work that was primarily for the support of large-turbine development consumed a significant fraction of the funds in the "generic" category.
Results from the large-turbine development program have not been very encouraging to date. Only a few large machines have been built, and none of these machines is operating reliably. Among companies that were experimenting with large wind turbines, several have dropped out of the industry or severely cut back their involvement.[8] Although DOE remains officially optimistic, development seems to have shifted
[7] These expenditures are included in the intermediate and large turbine categories in Table 9.1.
[8] EPRI Journal (May, 1984). This article also describes some of the problems that large turbines have experienced, including damaging "overspeed events" and cracks in turbine shafts.
decisively to the intermediate-scale machines. As discussed below, this shift may have arisen from the desire to spread an investor's performance risk over several machines rather than a single large machine and cannot be taken as compelling evidence of the superiority of intermediate-scale technology.
The productivity of other research and development expenditures is harder to assess. Darrieus turbines received substantial support. Intermediate-scale versions of these machines were deployed in significant numbers by private developers. In addition, many of the engineers currently working in the field got their initial experience working on government contracts. Needed engineering data and techniques were developed with government support. In sum, however, given the expenditure of $391 million, results from the DOE wind energy program have been modest.
Tax and Financial Assistance to Wind Generators[9]
Federal Programs—Tax Credits and Depreciation Allowances. The Energy Tax Act of 1978 (PL 95-618) established a business investment tax credit for certain energy properties including wind turbines. The tax credits were 15% of the amount invested and expired on December 31, 1985. This tax credit was in addition to the 10% investment tax credit (ITC) in effect over the same period.
Wind investments also benefitted from rapid depreciation under the accelerated cost recovery system (ACRS) established in 1981 as part of the Economic Recovery Act. The ACRS provided for a five-year depreciation of wind turbines. Although ACRS and the ITC also applied to most other investments, it had stronger incentive effects on capital-intensive projects such as wind. Furthermore, utilities were specifically excluded from using ACRS and the energy tax credit.
Federal Programs—Technical Assistance and Loans. Under the Wind Energy Systems Act of 1980, DOE had $100 million authorized in 1980 for cooperative agreements, outright grants (not exceeding 50% of the cost of the wind system), and subsidized loans. Additional federal support was available from the Small Business Administration in the form of loans and loan guarantees. Other programs of the federal government could be used by particular categories of potential purchasers of wind systems for their own use, including cooperatives, farmers, nonprofit corporations, public agencies, and homeowners. Neither the federal government's research program nor its technical assistance and loans are included in the cost/benefit analysis in this chapter.
[9] Hirsh et al. (1981) provides more information on Federal and California financial assistance programs.
California Programs. The most important of the California programs that applied to wind farm developers was a 25% energy investment tax credit. This credit was reduced to 15% on January 1, 1986 and expired completely on December 31, 1986. Accelerated depreciation was also available, although not on terms as favorable as ACRS.
The net effect of these tax advantages for an investor depended on the investor's marginal tax rate, interactions between state and federal taxes, and the financial arrangements involved. Typically, between 60 and 80% of the gross investment was returned to the investor as a consequence of these tax advantages. In many cases, the total cost of an investment could be recovered in three to five years even if no electricity was produced (provided that the Internal Revenue Service did not view nonproduction as a reason to "recapture" the tax credits).
Public Utility Regulatory Policies Act
Tax advantages alone would not have stimulated significant development of wind projects without other government actions that were taken to make a market for the energy produced. These actions included passage of PURPA by the Congress in 1978 and implementation of the act in California by the California Public Utility Commission (CPUC). PURPA required utilities to purchase electricity from independent power producers at prices corresponding to avoided costs. Interpretation of the language of the act has caused considerable dispute over the extent to which avoided cost should reflect short-run or long-run marginal cost. Although this controversy is still simmering, it is sufficient for the purposes of this chapter to know that the prices offered by utilities under the CPUC's jurisdiction were high enough to provide encouragement for wind developers; peak rates paid to some producers by PG&E were 24 cents/kWh during one period in 1984 (Smith, 1987, p. 149).
In California contracts were established between independent power producers and electric utilities by the mechanism of Standard Offers. Under state regulations, public utilities in California must buy power from independent producers under the terms established by the CPUC. The last and most attractive of those contracts, Standard Offer 4 (since suspended), set off a stampede of potential power producers signing contracts with utilities. One option under this contract was particularly attractive to those attempting to establish wind farms. This option locked in for a period of 10 years an escalating series of prices for energy and capacity delivered to the utility's grid. The price was based on forecasts of the utility's marginal energy costs. This reduced uncertainty about prices, making the raising of capital for wind farms easier. With the decline in oil and gas prices in 1986, it became apparent that the long-term standard offers were much higher than expected avoided
costs and the CPUC indefinitely suspended these offers. However, independent electricity producers who already had signed contracts to sell power under these terms and with the required approvals were not affected.l0
IV. THE EFFECT OF THE WIND ENERGY PROGRAMS ON CALIFORNIA
Installed Capacity
California has become the world center of wind energy development for several reasons. These include the 25% state tax credit, avoided-cost rates favorable to alternative energy producers, some good wind locations, and a relatively large number of wealthy individuals with sufficient income to take advantage of the tax incentives. Of all electricity produced from wind in the world during 1985, 87% was produced in California. According to estimates by the CEC and reports from California utilities as shown in Table 9.2, the number of machines installed grew from 144 at the end of 1981 to over 13,000 at the end of 1985. During this period, rated capacity grew from 7 MW to 1,141 MW; by the end of 1987 total cumulative investment was in excess of $2 billion in nominal dollars.
The largest site for wind farm development in terms of power produced is the Altamont Pass area, which contains about 60% of all machines installed in California. Other important sites for development are San Gorgonio Pass (23% of installed machines) and Tehachapi Pass (21%). Figure 9.3 shows the locations of these sites.
Technological Development
The wind industry has made substantial improvements in the quality of intermediate-sized windmills since 1981 when the first machines were sold. Reliability has improved significantly, resulting in higher capacity factors.[11] Capacity factors for 1985 averaged 17% at Altamont, 18.4% in San Gorgonio, and 13.8% in Tehachapi (California Energy Commission, 1988, pp. 117-119). Although these are well below the 25 to 35% predicted by wind proponents, they represent a significant improvement over the early experience.
[10] Chapter 6 contains further discussion of avoided-cost rates and standard offers.
[11] This trend can be seen by dividing the figures in row 3 of Table 9.2 by the product of the figures in row (4) and 8.76, the number of thousands of hours in a year. However, the actually achieved capacity factors are much higher than such an exercise would indicate because most wind turbines are installed at the end of a year to delay the investment costs while allowing for a quick tax credit claim. The last quarter of the year also has lower-than-average wind speeds at the wind farm locations.
In addition, the cost of wind turbines has fallen over time. The average price of a wind turbine in 1981 was $3,984 (in 1986 dollars) per rated kilowatt. By 1985 this figure had dropped to $1,900 (California Energy Commission, 1986a, p. 17) and may now be as low as $1,100 (Smith, 1987). The ultimately achievable cost for windmills is still not clear, and estimates of the possible costs vary. What projections are published come with little substantiation. A low estimate is provided in a report to the CEC (California Energy Commission, 1988), which forecasts $600/kW. Smith (1987) suggests that $750/kW may be attainable while the Office of Technology Assessment (1985) provides a range of $900-$1,200/kW for the 1990s.
The strong tax incentives to private investment in wind systems provided an alternative approach to the development of wind from that of the government. One of the most striking differences between government-sponsored wind research and the strategy adopted by private developers has been the size of the wind turbines. It was originally believed that the most efficient way to extract electrical energy from the wind was with large, megawatt-scale machines. The technical complexity and early difficulties with large windmills resulted in the refusal of the manufacturers to guarantee the performance of their machines.[12] Without assurances from the manufacturer as to the turbines' performance, investors were unwilling to underwrite a large turbine wind farm.
The lump-sum costs of wind turbines was another major influence in the popularity of the intermediate turbines over the large turbines. At a cost of $5 million and more for a large turbine, the risks to the investor, in the absence of a proven performance record, were too great. (This cost compares with between $150,000 to $300,000 for an intermediate-sized turbine.) Instead of a few large turbines, windmill manufacturers (who had to provide performance guarantees) chose to produce and sell many intermediate-sized turbines, thereby spreading the performance risk over many more machines and enabling them to lower costs through higher production levels. It was also easier to isolate and identify turbine problems with a greater number of machines to compare and analyze.
The fact that intermediate-sized windmills were used in private investments does not prove that they represent the best solution to extracting energy from wind. All that can be said is that they were the most readily available technology to take advantage of high electricity prices and tax incentives. As we show in this paper, the intermediate-scale technology has not provided a cost-effective source for electricity. If wind ever does become commercially viable, it may yet be large windmills that will provide the most economic use of this resource.
[12] Personal communication with M. V. Russo.
The nature of the inducements to the wind industry also resulted in a wide variety in the design of intermediate-scale windmills. However, there were some clearly economically wasteful results of the capital-biased nature of the tax incentives that manifested themselves in the wind program and limited the variety of designs. As we have stated, the incentives allowed the cost of an investment to be recouped in three or four years even with no significant output. Such a scheme is bound to result in some systems being built with little prospect of producing large amounts of electricity or of providing any information to further improve the technology.
A more subtle waste is due to the tax-induced preference for higher up-front cost and lower operations and maintenance costs. The tax benefits allow investors to reduce the net cost of the initial investment, whereas yearly overhead and maintenance expenses continued to be treated in the same way as any other investment might be.
This bias might go some way to explaining the popularity of Danish wind machines. These machines were certified (in a program of the Danish government) to withstand the stronger average winds off the North Sea. Not only was maintenance lower in these machines, but they had a reputation for quality construction and superior reliability in an industry where reliability is one of the major unknowns and consequently of great importance to general partners and investors. Failure of a turbine to remain in service for five years after a tax credit was taken would result in serious potential financial consequences to investors in the form of a tax credit recapture and other penalties.
Financial Organizations of the Wind Industry
Two forms of ownership arrangements of wind turbines are prevalent in the industry: limited partnerships and direct ownership by individuals or small general partnerships. Limited partnerships are the dominant form of organization; direct ownership is a relatively recent innovation. Often the limited partnerships have direct or indirect links with a wind turbine manufacturer. A common practice is for the manufacturer to incorporate a wholly owned subsidiary in California. A limited partnership is organized by the subsidiary with the subsidiary as managing general partner. The managing partner then sells limited partnership interests to investors. The proceeds from these sales (less commissions and other fees) are then applied to the purchase of wind turbines from the manufacturer who initiated the whole process. In addition to the proceeds from the sale of partnership interests, the manufacturer may receive a note from the partnership for a portion of the wind turbine sale price (e.g., if the sale price were $170,000, the partnership would pay $100,000 in cash and would give the manufacturer a note for $70,000).
This type of arrangement has some significant advantages for investors. First, a limited partnership does not pay income tax; the profits and losses flow through directly to the partners. Thus the limited partners receive the tax credits and the losses that result from depreciation (subject to limitations in the tax code). Second, a limited partnership provides limited liability; if the partnership defaults on its loan, the limited partners are not liable for this obligation. The note that the manufacturer takes back is usually nonrecourse (i.e., unsecured by any assets other than windmills) with terms of 10-20 years. Because the note is included in the basis of the investment, it increases the tax credit available without increasing the necessary investment.
The limited partnership form of organization does have some disadvantages. The commissions and other fees associated with organizing and offering the limited partnership units are not eligible for tax credits. Losses are limited to the amount at risk (i.e., the amount invested net of any income received). Finally, although the investor is not liable for the partnership's notes to the manufacturer, some of his tax credits can be recaptured by the government if the partnership defaults.
In a direct ownership arrangement, a wind turbine is purchased outright by an individual or small general partnership. The financing, if any, is recourse to the individuals involved (i.e., the lender has a claim on other assets of the borrower in addition to the wind turbine). The advantages of this arrangement are that the entire purchase price is eligible for the tax credits, deductions for losses may be greater because of the higher amount at risk, and the risk of recapture of tax credit is reduced because no nonrecourse financing is involved. The disadvantage is, of course, that the investor has 100% of the purchase price at risk (as opposed to approximately 60% in a limited partnership) and thus his losses may be greater if the wind turbine fails to perform. Also, default on his recourse debt may lead to (property) losses other than his wind investments.
The Detailed Economics of Wind Projects
In this section we quantify the costs incurred and the benefits gained by different parties in two wind farm projects. Before doing so it is instructive to look at the impact of the federal and state tax credits on the private costs of wind-generated electricity. Table 9.3 shows the amount by which the tax credits alone bring the private costs of electricity below the social costs.[13] (Depreciation and operating costs are handled exactly the same way for both cost calculations.) The results indicate that, depending
[13] The social cost includes the value of all resources that go into the construction and maintenance of a windmill. For private costs we subtract the tax credits. The discount rate used is 10% and the assumed life of the plant is 20 years. For the private investor the discount rate is after-tax.
upon the capital cost assumptions, the private cost is between 40% and 55% of the total social cost.
In order to identify all the costs and benefits to the participants of a wind project, we analyzed two projects. The projects being modeled are organized as a limited partnership. The parties included in our consideration are the investors in the wind farm (the limited partners), the government of California, the federal government, and the ratepayers of the utility that is buying the wind farm's electricity. In addition, the project is also evaluated from the point of view of the economy as a whole. The net economic benefit of a wind project is the cost of the electricity displaced by wind minus the economic costs of the wind project. (Economic costs do not include such transfer payments as property taxes.) The benefits to the two levels of government are merely the increase in the tax revenue due to the wind project net of tax revenue that would have been earned on alternative projects. Profits are the change in the after-tax positions of the investors in this partnership, net of after-tax profits that could have been earned on other investments. The costs of a wind project to the utility ratepayers is the amount paid by the utility to the wind farm operators minus the reduced expenditures by the utility to produce electricity. The amount paid for the electricity will, for the first 10 years of the project, be determined by projections made under Standard Offer 4 contracts. As noted above, these contracts called for high payments to the windmill-owner for electricity purchased by the utility. The payments were so high that purchasing electricity imposed a cost on the utility, not a saving. All costs and benefits of the project are discounted back to 1985 at 10%. For the private investors, this is an after-tax discount rate. Except where otherwise noted, all costs and benefits are taken from the partnership offerings.
The first project being modeled here, FloWind Partners 1984, is one that was constructed during the latter part of 1984 and early 1985 and is located in the Tehachapi Mountains. According to the prospectus, the general partners expected the price of electricity sold to Southern California Edison (SCE) to reach 12.8¢/kWh (nominal) by 1994 from 6.6¢ in 1985. About one-sixth of these payments were for capacity. We use these price projections through 1994 (correcting for their inflation assumptions), after which the price is held constant in real terms. The base case also utilizes the pre-1987 maximum marginal federal tax rate of 50%. We do not take into account any at-risk provisions of the tax code.
The construction cost of the project, as described in the prospectus, is $36.6 million. Another $4 million was required to cover organizing costs and working capital requirements, giving a total cost of about $41 million. Of this, $25 million was equity raised from the limited partners with the rest coming as a loan from the FloWind Corporation. The
project had an expected total output of 45,600 MWh per year generated from wind turbines that are rated at about a total of 22,000 kW. The construction costs give a cost per kilowatt of about $1,700. Under these base case assumptions, the equity portion of the investment would be fully recovered after 3.5 years even if no electricity is produced.
Columns I and 2 of Table 9.4 show some of our other results for the FloWind project. The largest contributor to the project (net of benefits) is SCE, which will pay almost $35 million for the power projected to be produced by FloWind. The present value of avoided costs in that service area, under our base case assumptions (see Table 7.3) is about 5.6¢/kWh. That means that about $8.5 million of the $26.7 million will be paid by SCE to FloWind over and above the cost to the utility of producing that electricity itself. The largest government contribution made to covering the cost of the project ($8.4 million in 1985 dollars) is that of California. The federal government's total contribution through the additional 15% tax credit (partly offset by the decreased state tax deductions due to California's tax credit) is $7.44 million. The net present value of the project to the limited partners is almost $1.75 million, not huge considering the riskiness of the investment. The present value of the economic cost of the wind farm, including operating and maintenance, is over $48 million.
The public costs do not include the ITC and the ACRS because these can be taken for most other investments and therefore do not result in a net economic cost to the governments. However, the ACRS cannot be taken by electric utilities. To the extent to which wind investment displaces conventional investment by electric utilities, the cost of wind to the governments is understated in Table 9.4.
The third and fourth columns of Table 9.4 present the same figures for an investment as a partner in a single machine of the Zond program. This program, which was scheduled to come on line in 1986, sold individual turbines in a project in the Tehachapi Mountains for $175,000 or a cost of about $1,871/kW when capacity is measured at maximum rated wind speed.
The California government has a lost revenue of over $38,000 for each turbine in this project. The federal government's contribution is $36,000. But SCE makes the largest contribution. Of the present value of SCE's expected per-windmill payments of $144,000, about $45,000 will be above its costs to produce an equivalent amount of electricity. The full economic cost of a windmill in this project is $219,000.
The larger per-kilowatthour profit for the Zond Painted Hills windmill is due to the much higher capacity factor that the Zond partnership forecasts in its prospectus (30% as opposed to 23%) and the slightly higher capital cost, allowing for a greater deduction of the investment
tax credit. Both projects show an average variable cost of about 2.3¢/ kWh. These costs include operations and maintenance, management fees, land rentals, and insurance but exclude property taxes[14] and are in general agreement with those found in Smith (1987).
Table 9.5 illustrates the sensitivity of the financial performance of the FloWind project to the underlying assumptions. The first two columns of the table indicate the net benefits to the partners if, after the 1995 expiration of the partnership's electricity purchase contract, the price paid for electricity is close to that predicted by the CEC. The other two columns indicate the results if the price of electricity after 1995 is based on the base case assumptions used to evaluate the Diablo Canyon nuclear project in Chapter 7. These numbers indicate that the total overpayment by SCE will likely be on the order of $6.7 million when discounted back to 1985.
The calculations undertaken for these wind projects indicate the importance of the tax credits and the high expected payments to the wind farms for the electricity produced. Of these, the tax credits clearly had the largest impact on the expected profitability of these projects. They represented about one third of the total discounted costs of the ventures. SCE ratepayers would provide another 18% of the total cost if the difference between the value of the electricity displaced by wind and the price paid for that electricity persists. In addition, a downward shift in any of the very favorable projections included in the prospectuses would result in serious losses to the investors.
Optimal Timing of a Wind Program
Expenditures on commercial wind systems in California have totaled over $2 billion, and in this section we discuss the net economic benefits of these expenditures. In particular, we are interested in the timing of wind energy investments and when, if ever, it would have been economically rational to enter into such a program. To undertake this analysis it is necessary to make predictions about the cost of wind energy in the future. These predictions are then compared with the estimates of the value of the energy and capital that is displaced by wind. To measure the efficacy of the wind program, we also have to make some assumptions about the behavior of potential investors in the event that there were neither tax incentives nor high purchase rates. We can use these assumptions about behavior to evaluate the efficacy of alternative programs.
Before we estimate the costs of a wind program, it will be helpful if we have some idea of the sort of cost reductions that would have to be
[14] Property taxes are excluded because they largely represent a transfer between property owners and government. To the extent that property taxes compensate local governments for services that are provided to the wind farms, excluding them underestimates the full economic costs of operating windmills.
achieved for wind to be a competitive technology. In Table 9.6 we show the maximum costs of wind turbines necessary for wind to compete with fossil-fuel-fired gas turbines. The capacity credit for wind is assumed to be 0.5¢ kWh, and the heat rate for the plants displaced by wind is assumed to be 11,300 or 10,300 Btu/kWh, in keeping with our assumptions from the Diablo Canyon review. The variable cost of the wind turbines are assumed to be 2.5¢/kWh. The first column of Table 9.6 shows different possible costs of the wind turbine in $/kW. Column 2 shows the resulting average total cost of wind-generated electricity. Column 3 shows the cost of oil, in dollars per barrel, that wind turbines could compete against at the prices shown in column 1. For example, if the level-ized cost of oil is $30/barrel, and the heat rate of the oil-burning plants displaced by wind averages 11,300 Btu/kWh, then the capital cost of wind energy would have to be less that $700/kW for wind to be competitive with oil-fired capacity. To evaluate the wind program we first estimate the costs and benefits of the program through the end of 1985. We assume that at the end of 1985 all investment tax credits are terminated and that no new wind farms are built. Windmills that have already been built continue to produce electricity.
Electricity is sold to California utilities at prices that are established by contract when the windmill comes on-line. The prices established in these contracts are assumed to be based on ten-year forecasts of the cost of electricity. The projections used are for a 3%/year increase of the value of electricity from the date that the wind project comes on-line.[15] All costs and benefits are discounted back to 1980, the assumed first year of the program. The costs of installed wind turbines are those found in Smith (1987).
Table 9.7 indicates that the present value of the capital and operating costs of all windmills built through 1985 is $1.8 billion, and the fuel and capacity savings are $1.1 billion. The negative net benefits of $463 million were paid for by $373 million in tax subsidies and $152 million in payments by electric utilities over and above their own costs of producing electricity. (Recall that these are all present values discounted back to 1980.)[16]
But some of the windmills that were built while the tax program was in effect would have been built anyway, although possibly not very many.
[15] These are essentially the same assumptions used in evaluating the Diablo Canyon nuclear power plant. See the discussion of Table 7.3.
[16] The estimates for the costs of the tax credits are lower than those found in Table 6 of Merriam (1986) for several reasons. First, we have discounted back to 1980. Second, Merriam uses higher estimates of the capital costs of wind machines installed before 1986. We have used the lower costs in keeping With the generally optimistic assumptions used in this chapter. Our estimates of the costs of the tax credits also do not include the usual 10% tax credit available for most investments. Finally, we take into account the increased taxes to the federal government that result from lower state taxes due to the California tax credit.
Also, the infant industry argument predicts that more windmills would have been built sooner once the program was over, because the industry would have been brought down the learning curve by the program. To measure the net effect of the wind program, we have to make some assumptions about the manner in which investment in wind would have taken place in its absence. We also have to make some assumptions about the effect of wind investment in driving down the cost of windmills.
A fairly simple model of investment in wind was created to examine this question. The total capacity of installed windmills for any given year is described by an investment schedule the first five years of which is made up of the investment figures presented in Table 9.2. For later years the investment consists of a logistic function that is parameterized to fit the last year of the wind program's investment history. The cost of wind systems is a decreasing function of the installed capacity of windmills.
None of these relationships are statistically estimated because there are not many years of data. Instead we have calibrated the model to fit the data that we have available. Once the results presented below were generated some sensitivity runs were undertaken by changing the parameters of the model. None of the conclusions were appreciably altered. In our simulations of the wind program from 1980 we employ, for oil prices, base-case expectations of a 3% real increase from the observed price from 1980. We also present results under the assumption that a 1% increase in oil prices was expected. Heat rates for the fossil fuel plants that wind might displace are based upon the same average heat rate that is presumed to prevail in the Diablo Canyon study; 11,300 Btu/kWh.[17] In all cases the average capacity factor ultimately achieved by windmills is 25%. The average operating cost of the windmills is assumed to be 2.5¢/kWh.[18]
We first used this model to predict the optimal timing of a wind program, given the expectations for oil price increases and assuming that yearly investment in wind is characterized by our logistic function. The optimal time of a wind program is characterized as the year of initial wind development that maximizes the discounted net benefits of the wind program.[19] It is the year in which a profit-maximizing firm that had a monopoly on wind production would initiate its own wind program. This rule is also the appropriate one that the government should employ, optimizing the expenditure of funds so that all the benefits (in-
[17] This average marginal heat rate actually comes into effect after the 1985 start-up date of the Diablo Canyon nuclear plant. Before that date we employ the average marginal heat rate of 12,400 Btu/kWh.
[18] This operating cost includes all the items listed for the two case studies above.
[19] Initial development we define as the year in which more than 10 MW is built.
cluding the external benefits) exceed the costs by the greatest amount. Searching for the optimal time to begin the program was undertaken merely by shifting the investment schedule described above from year to year and comparing the net present values of the program started in different years.
Table 9.8 presents estimates of the net benefits of the wind program under different scenarios. The first row of results assumes that oil prices rise at the 3% rate from their 1980 levels; the second row shows the results of an expected 1% real increase in prices. Columns 1 and 2 show the results if the cost of wind turbines falls to $900/kW; columns 3 and 4 contain results using the $700/kW ultimately achievable cost. Columns 1 and 3 show the result of starting the program in the year that resulted in the highest net present value of the program, whereas columns 2 and 4 show the result of starting the program in 1980.
Turning first to the 3% real increase expectations: For the $900 windmill capacity cost, our results indicate that the optimal time to have started the program was in 1984. In that case the present value of the program would have been $667 million. Starting the program in 1980 would have resulted in net benefits of $561 million, had prices risen as forecasted. The loss from starting the program early was $106 million. Under the lower windmill price scenario, the loss to starting the program in 1980 instead of the optimal year was only $40 million.
Under the assumption of a 1% real increase in oil prices there is no time before the year 2000 that it would have made economic sense to start the wind program. The losses due to starting the program in 1980 are $406 million for the $900 cost scenario and $139 million for the lower-cost scenario. These losses would have had to be recovered from either tax credits or overpayment for wind-generated electricity.
The results in Table 9.8 indicate that only under very favorable cost and price scenarios was it worthwhile to proceed in 1980 with a wind program of the scale that eventually transpired. Although there is still some uncertainty about the costs that windmills will achieve, it is now clear that the sort of high-oil-price scenarios that would have justified a large-scale wind program are no longer likely to be borne out. Our re-suits indicate that the program could have been profitably postponed (when profits include only the measurable costs and benefits of the program). Had it been postponed, additional information on the likely price path of oil would have been available. On the other hand, losses due to starting the program two years early were not great had there been a reasonable expectation that wind machines were going to cost $700/ kW and oil prices were going to continue to rise at a very high real rate.
However, it was clear by 1983 that prices for oil were going to be well below the lower of the trajectories assumed for Table 9.8. Given what
was known about oil prices in 1983 and given the experience gained in producing electricity from wind, it seems reasonable to ask whether it was appropriate to continue the program after the end of 1983. That year is an appropriate date upon which to base a review because the California Tax credits were scheduled to expire on December 31 and the CEC undertook such a review of all solar, wind, and conservation credits (California Energy Commission, 1983).[20] The legislature eventually extended the credits beyond their initial sunset date.
To determine whether it was appropriate to continue the program, we reran our simulations retaining the reductions in the cost of windmills that had been achieved through 1983. Here we are undertaking essentially the same analysis that we did for the Diablo Canyon study. We are ignoring previous expenses, treating them as sunk, unrecoverable cost. Also, we assume a 1% real increase in the cost of oil from its 1985 level.[21]
The previous investment results in the achievement of an average cost of windmills in 1984 of $1,400. Even if the ultimately achievable cost was expected to be $700/kW, continuing the program to the end of 1985 resulted in a net present value of —$560 million. The investment tax credits absorbed about $278 million of this expenditure. Despite these huge losses, no wind industry could expect to be established. We can see this by looking at the results presented on Table 9.6 which shows that, at the price of oil prevailing in 1985 (see footnote 21), windmills would have to cost less than the target $700/kW.
If we ignore the externality arguments necessary to the infant industry justification of the program, proceeding with the wind program can only be justified if the ultimately achievable cost is so low that the returns in later years in reduced energy costs will offset the high costs of the initial development of the wind machine. We can use our model to determine the per-kilowatt cost that would have to have been thought achievable to raise the net present value of the wind program to zero. That price would have to have been $550/kW. This figure is below any of the estimates found in the literature for intermediate-scale wind turbines.
In summary, these simulations were undertaken under fairly optimistic assumptions for the ultimately achievable cost of wind machines, the
[20] This report also attempted to quantify other benefits, such as additional taxes collected from manufacturers and labor involved in the wind industry. These are not, of course, net benefits because other tax expenditures would have had similar multiplier impacts,
[21] The average price of heavier fuel oil delivered to U.S. electric utilities in 1985 was about $24.00/barrel. For the first nine months of 1987 the average was $17.51/barrel (En-erg), Information Administration, 1987). Our use of the 1985 figure as the base point for escalating the price, therefore, still represents a fairly high price for the alternative energy source.
rate at which these costs would be achieved, and the windmills' capacity factor. Oil price forecasts were also high. If the predictions for wind technology were reliable, then proceeding with a wind program in the first half of the decade would have achieved the highest present value for the program. Proceeding with the wind program in 1980 resulted in relatively small decreases in the present value of the program.
On the other hand, the costs of proceeding with the wind program beyond the end of 1983 have been high. Taxpayers and electric utility customers in California could have saved at least half a billion dollars had the program been terminated then. In fact, the total saving would probably have been greater because it is unlikely that wind will achieve a cost of $700/kW.
It is important when considering these estimates of the losses of the wind program to remember that they do not include any of the research costs listed in Table 9.1. These amounted to almost $400 million by 1985. Nor do they include the cost of other funding, through grants and loan guarantees, available from the federal government and described above. The allocation in 1980 alone for these programs was $100 million.
V. CONCLUSIONS
The scale of the development of the wind industry was an almost unanticipated result of various tax expenditure programs and the regulatory changes of PURPA. The cost of the program, net of any fuel savings, will be about half a billion dollars when discounted back to 1980. The largest part of these costs was borne by federal and California taxpayers with the electric utility ratepayers also contributing large amounts. These costs do not include expenditures on research or technical assistance.
In 1980, it was not unreasonable to undertake a wind program given the prevailing expectations of future energy prices. However, it would have been better to delay the wind program in California by at least two more years. By that time more information would have been available on the ultimately achievable costs and on the likely trajectory of oil prices.
As expectations of future energy prices changed to reflect lower then-current prices, it was much less easy to justify the continuation of the program after 1983. By that time an annual 3% rate of increase in the price of oil from real levels that prevailed in 1980 was not a reasonable scenario. The cost of continuing the program beyond that point is at least half a billion dollars, discounted back to 1983. This cost is based on a continuous 1% annual increase in oil prices from 1983. In fact oil prices have dropped another 35% since then.
These expenditures have not led to the development of a wind power industry that is likely to be economically viable in the next 10 years, given recent forecasts of energy prices. Tax subsidies were so large and CPUC-mandated prices were so high that investments could be made in wind farms with little concern for maintaining the long-term viability of a firm in the industry.
These conclusions tend to underline problems that arise with subsidies of the sort that were used in the development of the wind industry. In the absence of major externalities, an infant industry or new technology that is likely to be viable in the long run will not need subsidies. Infant industries or new technologies that cannot survive without massive subsidies will likely fail anyway. The extent to which subsidies are used to encourage new industries or technologies should be limited.
The amount of wind power capacity that is currently installed in California is about three times the original goal set by the CEC. Had this goal been maintained and had other, performance-based, incentives been provided, the wind program would certainly have cost less. It may also have been more successful at achieving the technological targets that were expected to be achieved. Several performance-based incentives could have been used. For instance, the government could have auctioned the right to have access to price supports which would then only be available upon certain performance goals being met.
This study also shows the cost of not terminating a program after circumstances are altered. No special legislation was required to kill the tax credits. In fact, the opposite was true; the original California legislation had a provision that eliminated the credits at the end of 1983. In effect, the nonsunk-costs arguments of Chapter 7 are reversed to some extent here. Expenditures made in subsidizing wind through 1983 should have been ignored in any evaluations of future expenditures. It is inappropriate to make further expenditures just because so much money has already been spent.
REFERENCES
California Energy Commission (1980a). "Renewables and Alternative Technologies Synopsis, Staff Draft," P500-80-012, Sacramento.
California Energy Commission (1980b). Solar/Wind Programs, Final Environmental Impact Report . P700-80-005.
California Energy Commission (1983). "California's Solar, Wind, and Conservation Tax Credits, Draft Report." Tax Credit Committee, P103-83-001.
California Energy Commission (1986a). Results From the Wind Project Performance Reporting System, 1985 Annual Report , P500-86-013.
California Energy Commission (1986b). Solar and Wind Technology Tax Incentive Impact Analysis , Report Prepared by Polydyne, Inc. P500-86-010.
California Energy Commission (1988). Forecasts of Annual Capacities of the Supply of Electricity Likely to be Available from Quailing Facilities Not Subject to CEC Jurisdiction , Prepared by Regional Economic Research, Inc.
Energy Information Administration (1987). Monthly Energy Review , October. DOE/EIA-0035(87/10).
EPRI Journal (1980). "Going With the Wind," Vol. 5, No. 2, March, pp. 6-18.
EPRI Journal (1984). "Wind Power: A Question of Scale," Vol. 9, No. 4, May, pp. 6-16.
Hirsh, E., L. Briefly, and V. Schwent (1981). "A Guide to Financial Assistance for Wind Energy," Sacramento: California Energy Commission.
Kahn, E. (1979). "Wind and Solar With Conventional Technology," Annual Review of Energy , Vol. 4, pp. 313-352, Palo Alto, Calif.: Annual Reviews, Inc.
Katzman, M. T. (1984). Solar and Wind Energy An Economic Evaluation of Current and Future Technologies . Rowman and Allanheld.
Merriam, M. F. (1986). "Wind Electricity for California: Costs and Benefits," Universitywide Energy Research Group Working Paper No. UER-164, Berkeley: University of California.
Office of Technology Assessment (1985). New Electric Power Technologies: Problems and Prospects for the 1990s , Washington, D.C.: OTA-E-246.
Smith, D. R. (1987). "The Wind Farms of the Altamont Pass Area," Annual Review of Energy , Vol. 12, pp. 145-183, Palo Alto, Calif: Annual Reviews, Inc.
Solar Energy Research Institute (1981). A New Prosperity, Building a Sustainable Future, The SERI Solar/Conservation Study. Andover, Mass.: Brick House Publishing.
Tabors, R. D., S. Finger, and A. J. Cox (1981). "Economic Operation of a Distributed Power System Within an Electric Utility," IEEE Transactions on Power Apparatus and Systems , Vol. PAS—100. No. 9.
Van Kuiken, J. C. (1980). "Reliability, Energy, and Cost Effects of Wind-Powered Generation Integrated With a Conventional Generating System," Argonne, Ill.: Argonne National Laboratory, ANL/AA-17.
TABLE 9.1 | ||
Expenditure | % of Total | |
Intermediate and Large Turbines | 202.1 | 51.7 |
Small Turbines | 60.0 | 15.3 |
Darrieus Turbines | 22.3 | 5.7 |
Generic a | 106.8 | 27.3 |
NOTE: Includes policy studies, wind resource assessments and fundamental engineering studies. | ||
TABLE 9.2 | |||||
Before | 1982 | 1983 | 1984 | 1985 | |
Cumulative Number of Turbines | 144 | 1,300 | 3,800 | 8,100 | 13,500 |
Investment/Year ($ In Millions) | 21 | 139 | 326 | 680 | 1,100 |
Installed Capacity (MW) | 7 | 71 | 239 | 583 | 1,121 |
Energy Generated (MWh/yr) | 0 | 6 | 51 | 195 | 661 |
TABLE 9.3 | ||
Cost of | Resulting Average Total | |
Wind Turbine | Social Cost | Private Cost |
900 | 7.5 | 4.1 |
1,200 | 9.1 | 4.6 |
1,500 | 10.8 | 5.0 |
1,800 | 12.3 | 5.5 |
2,100 | 13.9 | 6.0 |
TABLE 9.4 | ||
FloWind 1984 | Zond Painted-Hills | |
Total $ | Average | Total $ | Average | |
(in millions) | (¢/kWh) | (in millions) | (¢/kWh) | |
Partners' After-Tax | 1,750 | 0.4 | 66 | 3.1 |
Payments by SCE | 26,704 | 7.3 | 146 | 7.3 |
Lost Revenue to | 7,440 | 1.9 | 36 | 1.7 |
Lost Revenue to | 8,429 | 2.3 | 38 | 1.8 |
Total Economic Cost | 48,298 | 12.4 | 219 | 10.3 |
Variable Costs | 8,775 | 2.3 | 49 | 2.3 |
TABLE 9.5 | ||
CEC Estimates of | Avoided-Cost Rates From | |
Total | Average | Total | Average | |
($ in thousands) | (¢/kWh) | ($ in thousands) | (¢/kWh) | |
Partners' After-Tax | - 1,121 | -0.29 | -264 | -0.70 |
Payments by SCE | 23,426 | 6.41 | 25,100 | 6.87 |
TABLE 9.6 | |||
Cost of | Resulting Average | Price of Oil ($/barrel) to Produce | |
Wind Turbine | of Electricity | at Heat Rate of | at Heat Rate of |
700 | 6.5 | 27.49 | 30.15 |
800 | 7.0 | 29.16 | 33.18 |
900 | 7.5 | 33.00 | 36.19 |
1,000 | 8.1 | 35.76 | 39.21 |
1,100 | 8.6 | 38.50 | 42.24 |
1,200 | 9.1 | 41.24 | 45.25 |
1,300 | 9.7 | 44.00 | 48.28 |
1,400 | 10.2 | 46.75 | 51.30 |
TABLE 9.7 | |
Present Value | |
Total Costs | 1,602 |
Total Benefits | 1,139 |
Net Benefits | -463 |
Utility Subsidy | 152 |
Tax Credits | 373 |
TABLE 9.8 | ||||
Present Value of Net Benefits (1986 $in millions) | ||||
Target Price of | Target Price of | |||
Wind Program Starting in | Wind Program Starting in | |||
Expectations on Oil Price | 1984 | 1980 | 1982 | 1980 |
3% per year | 667 | 561 | 935 | 895 |
1% per year | No positive value for any start date | -406 | No Positive value for any start date | -139 |
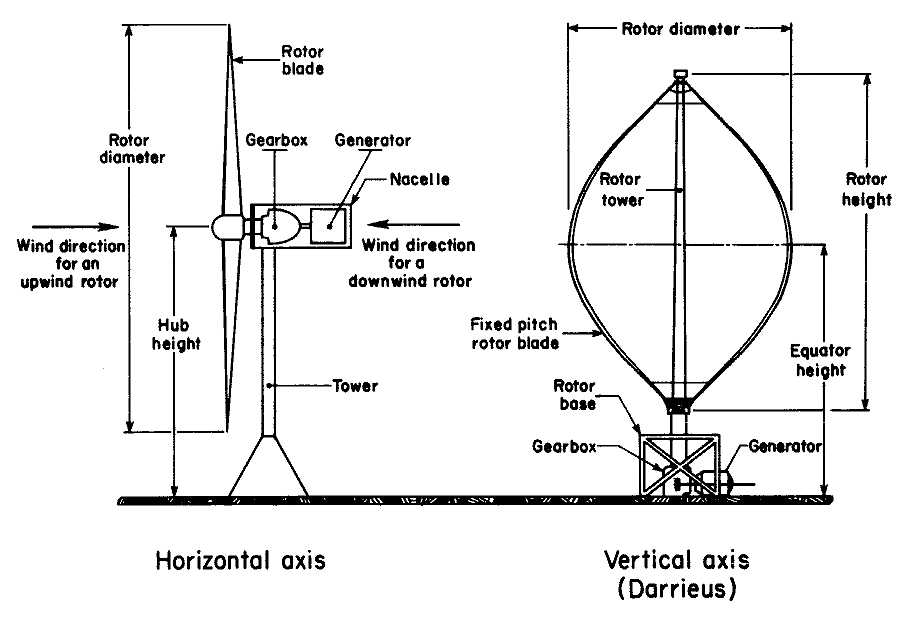
9.1. Vertical axis and horizontal axis wind turbines.
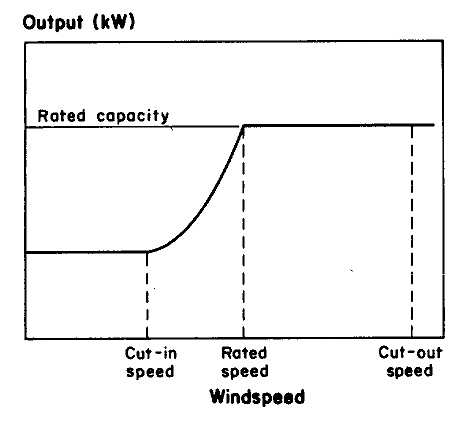
9.2. Windspeed vs. output.
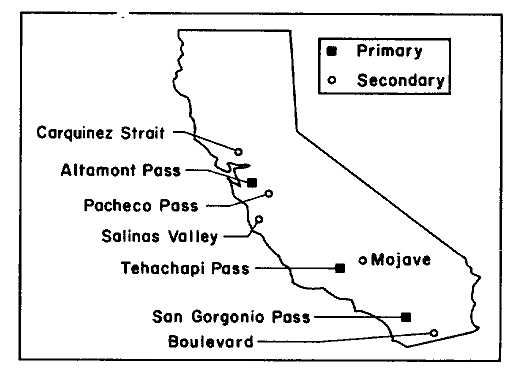
9.3. Major wind farm sites in California.