So How Does Display Benchmarking Work?
Consider the brittle book and how best to display it. Recall that it may contain font sizes at 1 mm and above, so we have scanned each page at 600 dpi, bitonal mode. Let's assume that the typical page averages 4" ³ 6" in size. The pixel matrix of this image will be 4³ 600 by 6 ³ 600, or 2400 ³ 3600-far above any monitor pixel matrix currently available. Now if I want to display that image at its full scanning resolution on my monitor, set to the default resolution of 800 ³ 600, it should be obvious to many of you that I will be showing only a small portion of that image- approximately 5% of it will appear on the screen. Let's suppose I went out and purchased a $2,500 monitor that offered a resolution of 1600 ³ 1200. I'd still only be able to display less than a fourth of that image at any one time.
Obviously for most access purposes, this display would be unacceptable. It requires too much scrolling or zooming out to study the image. If it is an absolute requirement that the full image be displayed with all details fully rendered, I'd suggest converting only items whose smallest significant detail represents nothing smaller than one third of 1% of the total document surface. This means that if you had a document with a one-millimeter-high character that was scanned at 600 dpi and you wanted to display the full document at its scanning resolution on a 1024 ³ 768 monitor, the document's physical dimensions could not exceed 1.7" (horizontal) ³ 1.3" (vertical). This document size may work well for items such as papyri, which are relatively small, at least as they have survived to the present. It also works well for items that are physically large and contain large-sized features, such as posters that are meant to be viewed from a distance. If the smallest detail on the poster measured 1", the poster could be as large as 42" ³ 32" and still be fully displayed with all detail intact.[18]
Most images will have to be scaled down from their scanning resolutions for onscreen access, and this can occur a number of ways. Let's first consider full display on the monitor, and then consider legibility. In order to display the full image on a given monitor, the image pixel matrix must be reduced to fit within the monitor's pixel dimensions. The image is scaled by setting one of its pixel matrixes to the corresponding pixel dimension of the monitor.[19]
To fit the complete page image from our brittle book on a monitor set at 800 ³ 600, we would scale the vertical dimension of our image to 600; the horizontal dimension would be 400 to preserve the aspect ratio of the original. By reducing the 2400 ³ 3600 pixel image to 400 ³ 600, we will have discarded 97% of the information in the original. The advantages to doing this are several: it facilitates browsing by displaying the full image, and it decreases file size, which in turn decreases the transmission time. The downside should also be obvious. There will be a major decrease in image quality as a significant number of pixels are discarded. In other words, the image can be fully displayed, but the information contained in that image may not be legible. To determine whether that information will be useful, we can turn to the use of benchmarking formulas for legible display.
Here are the benchmarking resolution formulas for scaling bitonal and grayscale images for on-screen display:[20]
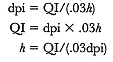
Note: Recall that in the benchmarking resolution formulas for conversion, dpi refers to the scanning resolution. In the scaling formulas, dpi refers to the image dpi (not to be confused with the monitor's dpi).
Let's return to the example of our 4" ³ 6" brittle page. If we assume that we need to be able to read the 1-mm-high character but that it doesn't have to be fully rendered, then we set our QI requirement at 3.6, which should ensure legibility of characters in context. We can use the benchmarking formula to predict the scaled image dpi:
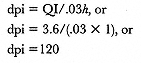
The image could be fully displayed with minimal legibility on a 120 dpi monitor. The pixel dimensions for the scaled image would be 120 ³ 4 by 120 ³ 6, or 480 ³ 720. This full image could be viewed on SVGA monitors set at 1024 ³ 768 or above; slightly more than 80% of it could be viewed on my monitor set at 800 ³ 600.
We can also use this formula to determine a preset scaling dpi for a group of documents to be conveyed to a particular clientele. Consider a scenario in which your primary users have access to monitors that can effectively support an 800 ³ 600 resolution. We could decide whether the user population would be satisfied with receiving only 80% of the document if it meant that they could read the smallest type, which may occur only in footnotes. If your users are more interested in quick browsing, you might want to benchmark against the body of the text
rather than the smallest typed character. For instance, if the main text were in 12-point type and the smallest lowercase e measured 1.6 mm in height, then our sample page could be sent to the screen with a QI of 3.6 at a pixel dimension of 300 ³ 450, or an image dpi of 75-well within the capabilities of the 800 ³ 600 monitor.
You can also benchmark the time it will take to deliver this image to the screen. If your clientele are connected via ethernet, this image (with 3 bits of gray added to smooth out rough edges of characters and improve legibility) could be sent to the desktop in less than a second-providing readers with full display of the document, legibility of the main text, and a timely delivery. If your readers are connected to the ethernet via a 9600-baud modem, however, the image will take 42 seconds to be delivered. If the footnotes must be readable, the full text cannot be displayed on-screen and the time it will take to retrieve the image will increase. Benchmarking allows you to identify these variables and consider the trade-offs or compromises associated with optimizing any one of them.