Planting Design Inventory Techniques for Modeling the Restoration of Native Riparian Landscapes[1]
Kerry J. Dawson[2]
Abstract.—Inventory techniques for assessing vegetative distribution patterns in native riparian communities are discussed along with their use and applicability in formulating working drawings for planting design. Such techniques involve a review of historical context and the selection of comparable areas in which to inventory for distribution, community and soil patterns, canopy heights, and elevational transects in relation to streamflow.
Introduction
As native riparian landscapes are increasingly impacted by flood control and water resources development projects, the need has grown for restoration mitigation, not only along existing streams but also on newly created floodways and distribution canals. In the past, governmental reclamation agencies have relied heavily on planting design techniques dependent on exotic plant materials to achieve simplistic goals of erosion control, environmental tolerance (drought tolerance and/or flooding tolerance, soil tolerance, browsing tolerance, etc.), and aesthetic improvement. Today, the use of exotic plant materials is still entrenched in riparian projects. But as more and more managers realize the value and the increasing rarity of ecological diversity that native riparian systems offer, it should be expected that their use will grow.
Cost is more a factor of influence now than ever before as governmental agencies are increasingly required to adhere strictly to cost: benefit ratios. The greater the benefits and the cheaper the cost, the better chance a project has of proceeding. Native riparian communities are certain to benefit from this phenomenon in that the mitigation of habitat loss for endemic species is a much-needed benefit. In addition, native riparian species can reduce installation costs because of their inherent ecological tolerance, fast-growing character, and regenerative efficiency, lacking in ornamentals. Riparian vegetation has evolved under constraints of erosion and streambed stabilization within community associations which allow all species to attain an optimum locale.
Perhaps, though, the largest influence on riparian design philosophy has been a new attitude among the general populace and increasingly among environmental designers toward the management of public lands. This new attitude places less value on engineered landscapes and more emphasis on the aesthetics of native landscapes. This is especially true in the West where native riparian plant communities provide landscape patterning to otherwise homogeneous rangelands and biological diversity to largely evergreen forestlands.
Traditionally, the engineered or manicured landscape used in riparian development projects has represented design based on garden design styles made popular along highways and in city parks (fig. 1). The use of garden design style reflects a concern that native riparian vegetation is too vigorous and will clog channels, and in the first successional stages it contributes a weedy appearance. However, the realities of the engineered style now recognize that as irrigation water grows scarce, the drought-tolerant ornamentals used more and more frequently can rival any landscape for the weedy look. While riparian landscapes can evolve rapidly to lush, attractive woodland, this is definitely not the case with ornamentals. Additionally, riparian landscapes can be installed and managed to minimize channel clogging, while even the best of the low-maintenance engineered landscapes require some clearance management.
General Discussion
There are two primary factors which presently impair full-scale implementation of vegetative restoration for native riparian landscapes: 1) lack of planting design techniques; and 2) lack of management specifications. With the existing
[1] Paper presented at the California Riparian Systems Conference. [University of California, Davis, September 17–19, 1981].
[2] Kerry J. Dawson is Assistant Professor of Landscape Architecture, University of California, Davis, and Landscape Architect, University of California Agricultural Experiment Station, Berkeley.
Figure 1.
A classic example of garden design as applied to planting design along
State Highway 30 near Sterling Avenue in San Bernardino, California.
This represents the static rather than the successional approach.
speed at which demands are being made for water resources development and the subsequently astonishing rate at which existing riparian systems are disappearing, the need for rapid growth in the development of restored riparian areas has become crucial for replacement habitat. This has meant that instead of relying primarily on downstream seed dispersal and natural succession, heavily disturbed riparian landscapes must be aided in their development by supplemental seeding or planting to speed succession. In the present construction industry, new types of planting plans and creative specifications in vegetative management to accompany them are called for. Unfortunately, neither concept has been adequately developed.
Planting plans for riparian restoration need to reflect all major components of the ecological system, including some representative water-edge and emergent zones. This means that either the overall engineering context has to be altered for differing circumstances, from small floodways relying heavily on rapid water movement with minimized vegetation in the channel, to larger floodways which temporarily store floodwaters; or the overall concept has to include a pool and channel concept where some areas have completely restored systems while others are partially restored. In either instance, coordinated research and implementation strategies amongst professionals are also necessary for informed, economical decision making.
Of the two factors above, planting design is most limiting in developing riparian restoration because of the uncertainty displayed by landscape architects and other environmental design professionals as to what procedures or guidelines to follow in developing planting design concepts for restoration. With disturbance dynamics as the population ecology norm for riparian systems, the question of what is the proper successional pattern for a severely degraded situation has always been difficult to answer. And, unlike the easily definable standards for ornamental design, standards have not been developed for simplifying riparian planting design criteria.
Historical Context
To begin to develop standards, it seems obvious that the historical contexts which have controlled the parameters of existence for native systems need to be investigated. First, the study site should be categorized in relation to to its physiographic province. Suppositions can then be made as to past plant community relationships and the respective ecological niches for species of special interest. This can be accomplished by studying relic evidence if the site has been historically riparian or, if adequate on-site information does not exist, by studying comparable areas.
In California, there are six basic "ecoregions" for riparian modeling (as adapted from Griffin and Critchfield 1972 and Walters etal . 1980). The first three can be thought of as "subregions" of the western Mediterranean or California physiographic region. They are the California grassland ecoregion, chaparral ecoregion, and the Sierran forest ecoregion. The fourth ecoregion is the northwest ecoregion associated closely with Oregon ash and the northern species. A miscellaneous or mixed community occupies the fifth ecoregion and occurs irregularly in isolated or eastern slope communities dominated by continentals. The sixth ecoregion is restricted to the low desert and is typified by the seasonal wash.
After physiographic classification by eco-region, historic research into development patterns as they relate to the study site is essential. In "Riparian Forests of the Sacramento Valley" (Thompson 1961), a lengthy discussion on the pristine condition of the riparian lands of the Sacramento Valley is found. The vivid accounts of early fur-trappers, explorers, botanists, military expeditions, and surveyors are surprisingly detailed and site specific. For records before European settlement in California, researchers have had to rely heavily on fossil flora. In the "Geologic History of the Riparian Forests of California" (Robichaux 1977), such fossil records are combined to reveal specific information on the existence of riparian forests over the past 20 million years which remained basically unchanged until today.
During this century, the best historical records of land-use change in riparian communities have come with aerial photography and remote sensing. Accurate inventories of in-place resources can be made, and change through time can be assessed. A good example of application of this method is provided by the studies by McGill (1975, 1979) on land-use changes along the Sacramento River riparian zone from Redding to Colusa during the period 1952 through 1979.
On-Site and Comparable Area Inventories
In degraded situations where historical information is insufficient to formulate a design format, the use of comparable areas may be necessary to guide the planting plan. When relatively natural conditions exist upstream or downstream of a study site, these areas will prove valuable for comparison. This was the practice utilized by the Santa Clara Valley Water District in riparian revegetation completed on previously excavated earth channels where natural succession was encouraged. Comparative information for study sites came almost completely from upstream or downstream areas.
The best comparable areas are those that have been least disturbed and managed as natural areas. Such areas often have previous research which can save time and survey expenses. Examples of these areas include Caswell Memorial State Park on the Stanislaus River[3] and The Nature Conservancy's recently purchased Kern River Preserve. In comparable areas where previous research on community distribution is not available, studies to determine community and soil patterns, canopy heights, and elevational transects are necessary. These studies relate to the common formats of working drawings in landscape architecture by emphasizing the base (horizontal) plan and transect (vertical) elevation.
Base Plan Development
Base plan development first involves selecting a sample plot within the study site or a comparable area where homogeneous distribution of characteristic species occurs. Next, the designer must determine whether to utilize random or non-random species sampling for the distribution studies. Random sampling is usually used where the site is large[4] and/or statistical analysis is desirable. The random technique most commonly employed is the gridding of quadrants over the site with random sampling combinations used to ascertain sub-plots (fig. 2).

Figure 2.
The grid above is an example of random pairing of quadrants
for the sampling and statistical analysis of spatial patterns.
Frequency of species occurrence in the quadrants is the
basis for the analysis (adapted from Goodall 1974).
Figure 3.
When the curve in the graph begins to flatten, enlarging
the study site area will result in fewer additional species.
In the instance of riparian systems, so few species hold
fidelity on the high terraces that sample plot expansion
should be streamside (adapted from Kershaw 1964).
Non-random sampling implies the inventory of the whole plot and is used when ecological accuracy is the foremost consideration. If cost and time are major factors, statistical analysis difficult, and the plot size greatly enlarged due to limited species lists, carefully selected (but non-random) subplots might suffice.
Vegetative association is the primary classification arrangement for determining base-plan design patterns. The characteristics of an asso-
[3] Great Valley Museum. Undated. Flora and fauna of Caswell State Park, Ripon, Calif. Regional Biota Series, No. 1. Modesto, Calif.
[4] The site size is usually determined by enlarging the plot until the species list gets progressively shorter (fig. 3).
ciation rely primarily on the totality of homogeneous releves (lists) of species which relate floristically to one another in the plot. Associations should, however, also be characterized by geography, dynamics, and ecological niche (Kershaw 1964) (fig. 3).
The indicators for riparian associations depend primarily on one or two high-fidelity species. High fidelity can be thought of as faithfulness to a relatively narrow ecological niche. Other species may have wide ecological tolerance and occur in several associations, while still others may have such a limited tolerance that true consistency of association is not possible (plants on the limit of their range for example). Degree of faithfulness to a relatively narrow ecological niche is the key.
Patterns are drawn by placing an enclosing two-dimensional shape on the base map; this shape outlines individual species in primary association (fig. 4).[5] The actual location of the enclosing line is determined using either a multi-dimensional or hierarchical clustering method for correlation. The multi-dimensional method is controlled by positive associations detected between pairs of species, where distance is directly related to degree of association between them (ibid .). On the other hand, the hierarchical method relies on species clustering by descending order of importance (dominance rather than distance). Hierarchical clustering is generally considered an oversimplification (Webb 1954); while multi-dimensional clustering is considered the most applicable to patterning for design.
Soil types and topography can be mapped separately or as overlays to vegetative associations. Information usually comes from existing soil surveys or from field data collection. As with vegetative association, soil bores are also clustered by similarity and location.
Figure 4.
After location symbols have been placed on the base map
for all individual species locations, the enclosing line for an
association should form a continuous and flowing line based
on inclusion of only those individuals and species in close
proximity to the key indicator species. Some species will
occur constantly throughout all associations so judgments
based on fidelity to ecological niche are essential.
Transect Elevation Development
Transect elevations can be placed randomly or non-randomly within the study site or comparable area. They profile the plot in representative locations for topography, soil depth, canopy height, and vegetative association. As with the base plan, the random selection of transects would apply mostly to a large plot where statistical analysis is desirable. Non-random sampling, on the other hand, would be most acceptable on smaller plots and where the quality of the base map has been sufficiently detailed.
Two basic forms of delineation are possible for transect elevations. The first is the histogram of occurrence for individual species; it compares percentage of cover to horizontal distribution along the transect (fig. 5). This inventory technique is very valuable for quantifying plants along the transect.
Figure 5.
An example of a histogram of occurrence (as adapted from Kershaw 1964).
The second transect form is the profile diagram. The profile diagram identifies individual plants along the transect, shows stratification of canopy, which adds a third dimension to the base map, and delineates soil depths and topographical relationships (fig. 6). In addition, if wildlife habitat loss mitigation and ecological
[5] An important point here is that the survey to locate individual species is the foundation for clustering. This information typically is accumulated through field work although remote sensing, especially with infra-red photography, is growing in popularity because of the time and expense involved in field work.
Figure 6.
Profile diagrams indicate a variety of design factors including
canopy height, species niche, vegetative structure, and elevational
relationships (topography, water levels, and soil depths).
stability are the foremost considerations for the project, crown density, basal area, vigor, and stand structure (age) should be added as inventory components (Davis 1977).
Interpreting Planting Design
Design programs for developing a planting plan in riparian restoration usually include a number of structural decisions which are the true test of the designer. Included in these decisions are such program items as fire lane access, levee arrangements, channel alterations, and recreational facility locations. All of these program items should make use of planting as options in design. Unfortunately, this often does not often happen. As an example, gabions can often be combined with willow cuttings but are not, and willow mats will easily substitute for jute mats and nets. Normally, with either of these treatments (gabions and nets), vegetation has difficulty colonizing engineered channels because bare earth is not available. Most structural design decisions have to be made in relation to planting design. What erosion control is necessary, and what structures are appropriate (cribbing, bermed willow rolls, gabions, etc.)? Will recreation be non-structural or are facilities required, and if so, for what activities? The list of program needs can go on, and all will have some relationship to planting.
The basis for the planting plan must be successional pathways. Although highly statistical pathways can be established for most landscapes (Cattelino etal . 1979), riparian design can be simplified to three major successional stages. These are: a) the pioneer stage, usually associated with surface water and freshly exposed sand- and gravelbars dominated by willows; b) the low terrace, usually the moderately wet bottomland dominated by cottonwood; and c) the high terrace, the somewhat drier, infrequently flooded floodplain component, dominated by oak and other more drought-tolerant mesic species.
With succession as a primary design determinant, another determinant should be vegetative structure. Modelled vegetative structure designed into plans is crucial for habitat restoration. With western riparian systems serving as the principal corridors of biological diversity in an increasingly man-altered landscape, they offer the only habitat for both native wildlife and native plants (Dawson 1981).
As shown in figure 7, designers have been thinking about the evolving landscape since the English country gardens of the 1800s. What is new is the commitment to ecological integrity and the hopeful development of accurate native landscape survey methods to model design decisions. With a new commitment and tools available for
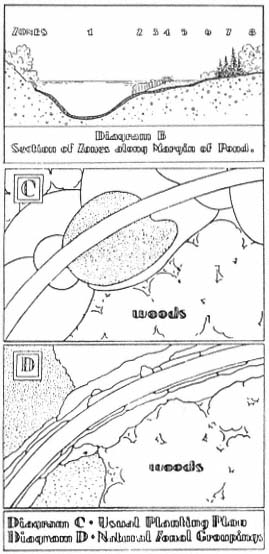
Figure 7.
These sketches represent early 20th century work in
interpreting natural succession for design (Waugh
1931). Diagram B (upper drawing)—section of zones
along margin of pond. Diagram C—usual planting
plan. Diagram D—natural zonal grouping.
implementation, surely the minimum levels of mitigation measures necessary to satisfy CEQA are within our grasp.
Recently, methods outlined in this paper were used to complete planting design working drawings for riparian forest restoration along a two mile stretch of the Sacramento River near Interstate 5. In addition to vegetative modelling, endemic avian species were surveyed for preferred vegetative structure as a habitat restoration success indicator. The project will go to bid for installation in 1984. Copies of research methods will be available through the author during 1984.
Acknowledgments
Special thanks to Landscape Architecture Magazine Archives for the use of the Waugh sketches.
Literature Cited
Cattelino, Peter J., J.R. Noble, R.O. Slatyer, and S.R. Kessell. 1979. Predicting the multiple pathways of plant succession. Environmental Management 3(1):41–50. Springer-Verlag, New York, N.Y.
Davis, Gary A. 1977. Management alternatives for the riparian habitat in the Southwest. p. 59–67. In : R.R. Johnson and D.A. Jones (tech. coord.). Importance, preservation and management of riparian habitat: a symposium. [Tucson, Ariz., 9 July 1977.) USDA Forest Service GTR-RM-43. Rocky Mountain Forest and Range Experiment Station, Fort Collins, Colo. 217 p.
Dawson, Kerry J. 1982. Bioregional landscapes as frontier. p. 208–210. 1982–83 yearbook of the International Federation of Landscape Architects. IFLA Secretariat, Versailles, France.
Goodall, David W. 1974. A new method for the analysis of spatial pattern by random pairing of quadrats. Vegetatio 29(2): 135–146.
Griffin, James R., and William B. Critchfield. 1972. The distribution of forest trees in California. USDA Forest Service Research Paper PSW-82. (Reprinted with Supplement, 1976.) Pacific Southwest Forest and Range Experiment Station, Berkeley, Calif. 118 p.
Hackett, Brian. 1979. Planting design. McGraw-Hill Book Company, New York, N.Y. 174 p.
Kershaw, Kenneth A. 1964. Quantitative and dynamic ecology. Edward Arnold (Publishers) Ltd., London, England. 183 p.
McGill, Robert R., Jr. 1975. Land-use changes in the Sacramento River riparian zone, Redding to Colusa. 23 p. California Department of Water Resources, Northern District Report, Sacramento, Calif.
McGill, Robert R., Jr. 1979. Land-use change in the Sacramento River riparian zone, Redding to Colusa. An update—1972 to 1977. 34 p. California Department of Water Resources, Northern District, Sacramento, Calif.
Robichaux, Robert. 1977. Geologic history of the riparian forests of California. p. 21–34. In : A. Sands (ed.). Riparian forests in California: their ecology and conservation. Institute of Ecology Pub. 15, University of California, Davis. 122 p.
Thompson, Kenneth. 1961. Riparian forest of the Sacramento Valley, California. Ann. Assoc. Amer. Geogr. 51(3):294–315.
Walters, Alice M., R.O. Teskey, and T.M. Hinckley. 1980. Impact of water level changes on woody riparian and wetland communities. Vol. 3, FWS/OBS-78/93. USDI Fish and Wildlife Service, Washington, D.C. 55 p.
Waugh, Frank A. 1931. Natural plant groups. Landscape Architecture 21(3): 169–180. Landscape Architecture Publishing Co., Boston, Mass.
Webb, D.A. 1954. Is the classification of plant communities either possible or desirable? Saer. Dot. Tidssk. 51:362–370.