PART I—
GENERAL CHARACTER AND CLIMATIC HISTORY OF AREA
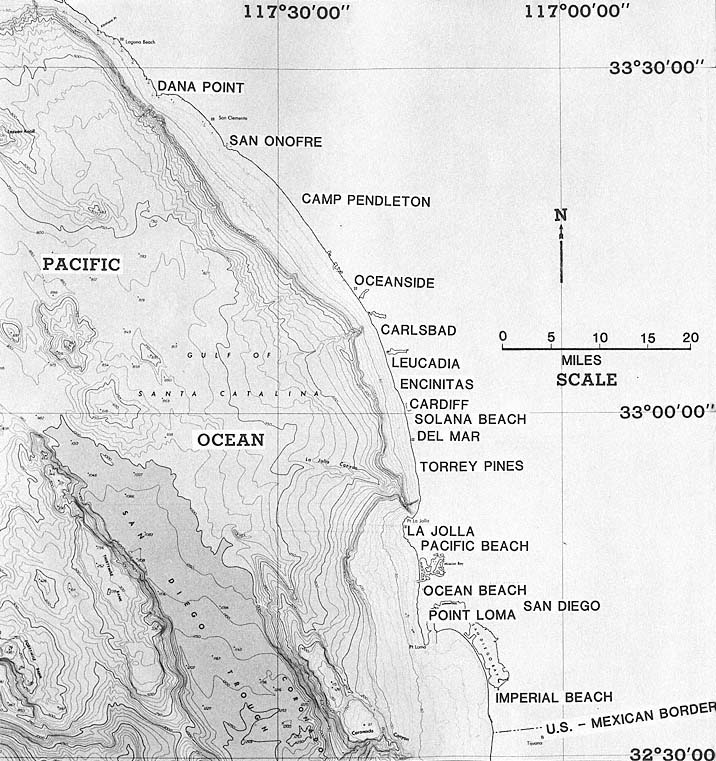
Figure 1
Location map of the study area.
1—
General Description of Coastal Area
The coast of San Diego County is a combination of both sea cliffs and lowlands, the latter occurring where valleys enter the sea and estuaries are cut off by barriers (fig. 1). Thus we have few embayed coasts, which are so common on the east coast and Gulf Coast as well as in the northwestern United States. The cliffed coasts are, for the most part, relatively straight, although considerable irregularities exist off Point La Jolla. This irregularity is not as pronounced now as it was a half-century ago, before waves had cut back some of the projecting spurs. The cliffed coasts are cut mostly in consolidated rock of somewhat uniform material, which usually results in straight coastlines. The cliffs vary in height; the highest portion is between La Jolla north to Sorrento Valley, where some vertical cliffs reach 350 feet. Except where the cliffs are on projecting points, they are bordered by sand beaches which are denuded from time to time, exposing underlying gravel and cobbles.
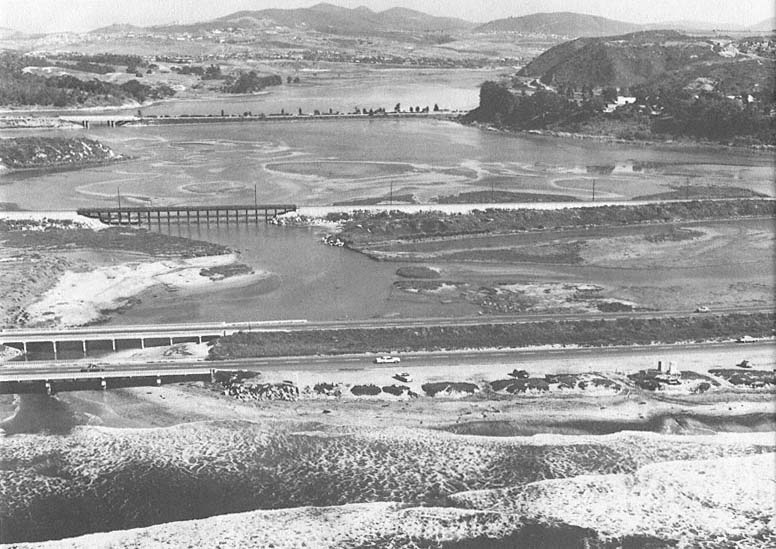
Figure 2
Batiquitos Lagoon showing sediment flowing out to sea after artificial opening, 1980.
Photo : G. Kuhn.
Another type of cliffed beach consists of unconsolidated alluvium. These cliffs are usually quite low, rarely exceeding twenty feet. Like the rock cliffs, the alluvial ones are quite straight and are bordered by sand beaches, except when the sand is temporarily stripped away to expose gravel or underlying rocks. The most extensive stretch of high alluvial cliffs is south of San Onofre, extending south through Camp Pendleton almost to Oceanside. Another example, of low alluvial cliffs extending a third of a mile, is at Scripps Institution of Oceanography in La Jolla.
The low coasts occur at the mouths of major river valleys. These lowlands were estuaries in the past, after the sea level rose owing to melting continental glaciers, which raised the level of the ocean by some 400 feet and flooded all these valleys, except where the rise in the land exceeded the rise in sea level. Considerable erosion from the highlands filled these estuaries sufficiently in recent years so that longshore currents were able to build barriers across their mouths; in the case of San Diego Bay, the entrance has been kept open by the strong tidal currents and probably to some extent by earth movements. Other estuaries are opened artificially to let floodwater out from time to time (fig. 2). The barrier beaches include one south of San Diego Bay, which extends all the way from the U. S.–Mexican border north to what were formerly the Coronado Islands (not to be confused with Los Coronados located off Baja California). The U. S. Coronado Islands have been tied to the mainland by predominantly north-flowing, sediment-laden currents (fig. 3).
A large U. S. Navy base and airfield on Coronado has considerably changed the contour of the former islands by ground-filling; the breakwater at the entrance to the bay has also played an important part, as has the building of high-rise condominium apartments at the north end of the spit. The importance of artificial earth movements, however, is not known.
One special type of coast is represented in the San Diego area along the north side of Point La Jolla. A row of sandstone bluffs with deeply penetrating caves at their base probably represents a fault scarp. There is no wave-cut
Figure 3
Longshore current observations along the Coronado and Imperial
Beach (Silver Strand) during the late 1940s. From Shepard 1950.
terrace directly at the base of the cliffs, as would be produced by marine erosion. The cliffs descend to a moderate depth before encountering the rock shelf off the coast to the south. This certainly suggests down-faulting, which is entirely likely in view of the location in line of continuation with a fault at the north base of Mount Soledad.
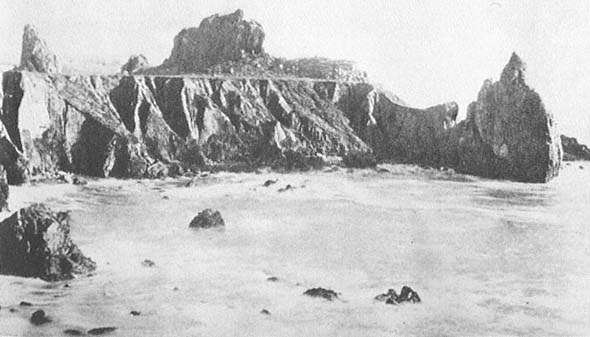
Figure 4a
Sea cliff north of Port San Luis prior to 1898.
Photo : George W. Stose.
2—
Methods of Study
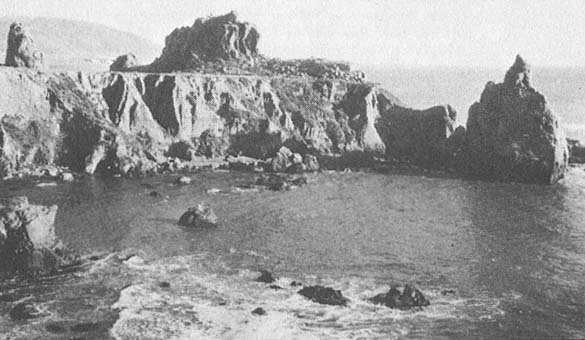
Figure 4b
View from the same spot, 1945. Note the almost complete absence of erosion in the interim. Numerous rocks
can be matched in the two photographs.
Photo : U. S. Grant IV.
A useful method for determining the nature and extent of coastal retreat is to examine old photographs of the coast and compare them with recent photographs taken of the same places. Identification of coastal shapes and sedimentary structures, buildings, or other landmarks is used. This method was employed extensively in Our Changing Coastlines (Shepard and Wanless 1971). It was especially appropriate where arch rocks had been photographed several score years before and could still be identified at the present (figs. 4a, 4b). Many old photographs, however, show nothing that can be recognized today, and often the position from which the old photo was taken seems to have disappeared so that a direct comparison is not possible. Emery and Kuhn (1980) obtained better results by examining photographs of low rock terraces in the La Jolla area taken by Emery around 1940, which show details of tidepools and concretions which could still be recognized. Some of these photos help present a clearer idea of small-scale erosional changes.
Kuhn has numerous photographs of cliff tops and adjacent buildings in the area extending from Del Mar north to Oceanside. Photographs of this area have been taken frequently enough to comprise a series that shows an amazing amount of change in an area previously thought by land developers to be stable. For example, a series of photographs shows dramatically that caves along the base of the cliffs in Solana Beach were subject to many changes, a fact that was previously unrecognized. The entrances to the caves are considerably enlarged after periods of storms. New caves can be created in days rather than centuries. This simply had not been documented before Kuhn's intensive studies were made.
Examination of old land surveys, county tax assessor records and coroner reports, as well as myriads of old charts (particularly those of the U. S. Coast and Geodetic Survey) and old railroad maps revealed a wealth of information scarcely touched upon previously. Also of prime importance are data collected by the U. S. Army Signal Corps (Monthly Weather Review ) between 1872 and
1892. These data include documentation of rainfall, floods, earthquakes, volcanic activity, windstorms, and descriptions of sea storms from vessels' logs. Also important is extensive study of the historical and scientific literature of the area.
Figure 5
Rainfall measurements and other climatic indicators for southern California: A .
Rainfall at Julian, 1880–1980. B . Combined-core varve thickness index for Santa
Barbara Basin expressed in standard unit form. Generally negative unit values
from 1824 to 1859 reflect bioturbation. From Soutar and Crill 1977. C . Standardized
tree-ring indices for Pseudotsuga macrocarpa big cone spruce trees along steep
slopes of Santa Ana Mountains (elevation 4000 ft.). From Douglas 1973, 1976. D .
Winter sea "surface" temperature 5 m below the surface at La Jolla, partly
reconstructed from tree-ring data.
From Douglas 1976. Complete figure taken from Emery and Kuhn, 1982.
3—
Climatic Changes in the Past Few Centuries
In making estimates of changes likely to occur in the coastal area of San Diego County, it is important to have information about the occurrence and types of changes in the past—for example, whether the changes occurred gradually or suddenly. If the latter is true, a recurrence of the same climatic conditions could certainly increase the rate of erosion compared with what it has been in recent decades.
We have some means of discovering what has happened in the past, particularly for the period since records of rainfall have been kept for San Diego and the adjacent mountain stations, beginning in about 1850 (fig. 5). Another source of information is tree-ring data, traceable back to about 1400; these provide good records of relative rainfall and temperature and allow comparisons with present conditions. Tree rings appear to be a fairly good index of rainfall, with years of abundant rainfall producing thick rings. The tree rings examined, however, were necessarily obtained from the mountain area east of San Diego because the only tree that grew consistently along the coast of San Diego County was the Torrey pine, which receives much of its moisture content
from the coastal fog and lives only a century or two. We must therefore assume that rainfall in the mountains was relatively comparable with that along the coast, which is only partly true, as can be seen in figure 5.
We also have records kept by early ranchers and by the Catholic fathers from the coastal missions; these provide general information about wet and dry periods. Ship captains kept logs which also give us an idea of the general weather conditions before rain gauge data became available. These information sources indicate the general character of the climate during centuries past.
Explosive Volcanic Eruptions and the Immense Alteration of Weather Associated with Them
Coastal erosion is greatly dependent on the weather, a fact that is easy to appreciate during storm conditions with strong onshore winds, when erosion occurs much faster than under ordinary conditions. It is important, therefore, to know if there are various background influences that affect the weather. It has long been felt that great explosive volcanic eruptions could have considerable effect on the climate of the earth (Abbot 1913; Abbot and Fowle 1913; Humphreys 1913, 1914, 1918; Huntington 1914, Wexler 1952; Rampino and Self 1982). It has only recently been recognized that it is not the quantity of ash and gas thrown into the atmosphere, but rather the quality of the gases (especially sulfur dioxide which produces aerosols when it condenses into small globules) that influences the arrival of heat from the sun to the earth and the reflective heat from the earth in such a way that the climate is affected. Several books have been written claiming the great eruptions of the past have caused a lowering of the earth's temperature, although by a very small amount: a percent of one degree centigrade to as much as one or two degrees centigrade (Griggs 1922; Humphreys 1929; Lamb 1972, 1977). Even this has been seriously challenged by the scientists of the U. S. Weather Bureau, who are inclined to believe
that volcanism is not an important factor in producing the great weather changes which one observes from time to time. However, while studying the history of weather during the last 200 years along the California coast to help predict what might be expected in the future, we discovered evidence that storm conditions and great floods had occurred in periods following several of the great eruptions. Scientists from Woods Hole Oceanographic Institution (Stommel and Stommel 1979, 1983), investigating weather conditions after the eruption of Tambora (generally considered to be the greatest explosive eruption of the past two centuries), discovered that about a year after this event, the northeastern United States had virtually no summer. Freezing conditions and snowstorms occurred during the normal summer months, and most agricultural products were ruined, causing great hardship. Northwest Europe seems to have experienced similarly anomalous conditions during that summer, although quite a different effect was reported in Siberia where the weather was much warmer than usual (Post 1976). This seems to indicate that the small globules that form in the upper atmosphere after the volcanic material is introduced do have a decided effect on the weather. Further, some months after the great Krakatoa eruption in 1883 on an island between Sumatra and Java—which produced, among other effects, huge tsunamis—there was a very curious change in the weather on the southern California coast, even more than that described in New England after the Tambora eruption. The most devastating flood to hit the San Diego coastal area in historical times occurred, and huge amounts of concentrated rain fell (Kuhn and Shepard 1981). Weather reports from around 1884 showed great windstorms including a huge number of tornadoes and hurricanes around the country (U. S. Army Signal Service 1884a ). This leads one to believe that general stormy conditions prevailed nationwide, which is quite unusual, according to weather records for years preceding and directly following the eruption.
We examined papers describing the stormy conditions that followed many major phreatic volcanic eruptions and began to wonder if perhaps these great
eruptions were not generally followed by a deterioration of the normal weather patterns. Although our initial findings were not taken seriously by most meteorologists or U. S. Weather Bureau scientists, we persisted in our investigation and found that weather scientists in general had overlooked what we considered to be the largest and best source of information on historical weather and possible effects of the explosive eruptions, namely, the weather reports kept in great detail beginning in about 1872. They were first collected by the U. S. Army Signal Service, then by the U. S. Department of Agriculture, and finally by the U. S. Weather Bureau. In all, we have about 110 years of detailed information regarding weather in the United States and neighboring areas during this period. At least five major explosive volcanic eruptions occurred during that time.
After studying these records, we realized that what we most needed next was another large explosive eruption which would allow us to evaluate these effects firsthand. Lo and behold, within two years, in March and early April 1982, there was a great eruption. El Chichon Volcano in the Yucatan Peninsula in Mexico, which had been dormant for over 1,000 years, erupted violently, throwing huge masses of material into the upper atmosphere which in turn formed a cloud that began to move around the earth, presenting us with a fine opportunity to observe weather effects.
At first, this Mexican eruption was thought to be minor in comparison with the great eruptions of Krakatoa and Tambora. However, through the use of weather balloons, high-flying planes and satellites, as well as by observations from the Mauna Loa Observatory, it was found that the aerosols produced by this eruption were of tremendous proportions and, in terms of producing weather changes, were at least as great as those of Krakatoa a hundred years earlier (Rose 1983). This was perhaps because the volcanic material, in rising to the surface of the earth, passed through a layer containing an abundance of sulfur. Furthermore, the aerosols were producing a decided decrease in sunlight recorded at the Mauna Loa station and elsewhere—as much as 25 to 33
percent (Rose 1983). Many observations supported the fact that this was a very important eruption as far as producing changes in the weather patterns. We were therefore encouraged to continue our investigation and kept day-to-day records of what happened to the weather after the eruption. We also reexamined in great detail the tremendous amount of material describing the weather following the great eruptions.
At about that time we also became interested in determining if changes in the weather precede an eruption. Reports by other scientists such as Mass and Schneider (1977) averaged temperatures over annual periods directly before the great eruptions. These studies revealed a lowering of temperatures by less than 1 degree centigrade worldwide, not enough to be very impressive, but enough to send us back to the best source we had: the weather records. We studied the weather conditions that preceded and followed the eruptions, since our earlier findings showed weather changes to be more pronounced a few months after the eruption as opposed to immediately following it. We continued the study as long as the weather following each eruption seemed abnormal. We then prepared a series of graphs showing the various weather conditions for a period of six months before and a variable number of months after each eruption (up to as much as three years). We next studied the weather during several low-volcanic periods to compare with that of postvolcanic periods, and graphed the information.
The best way to show our results is to compare the weather before and after each of the great eruptions that occurred during the last hundred years, about which we have excellent information for the United States and Canada and a small amount of information from the rest of the world. We begin with a description of the weather starting about six months before the eruption of El Chichon in Mexico and continuing for fourteen months following the eruption, which is as far as we can go as this is written. The results were almost immediately and startlingly close to our expectations.
The first indication that something unusual had happened after the erup-
tion was seen one month later, in May 1982. News came from China that the levees built by the Chinese Republic to give complete assurance against floods had broken because of the extremely heavy rains there (journalistic report). This resulted in massive flooding and great loss of life and property. A month later Japan reported the greatest flood in the history of their records on the island of Honshu, again due to heavy rains during the month of June (Le Comte 1983). It was a disaster in many areas of Japan.
Meantime in southern California, we noticed that our usual spring fogginess was absent. As the season advanced, the weather, rather than growing warmer in the summer months, was actually growing colder. Heating bills were higher during June than they had been in the middle of the preceding winter.
As the summer months continued, floods developed in many areas. The Plains states in the upper Mississippi Valley were flooded, putting much of the grain-growing area under water, and causing crop losses. During this period we found newspaper reports of new floods almost every day. Tennessee and Kentucky were especially hard hit. As the fall months arrived we had personal reports of windstorms and heavy rain along the west coast of the United States. Fortunately for southern California, a high pressure area in the atmosphere prevented many of these storms from reaching land as they moved down from the Aleutians, or east from the Hawaiian Islands, or north from Baja California. They were violent in the northern part of the state of California and caused considerable downpours as they moved through the Rocky Mountain system and farther east.
In November a great hurricane hit the island of Kauai in Hawaii, with wind velocities of over 130 miles per hour and waves along the southeast coast of up to thirty (possibly forty) feet high. Enormous damage resulted; buildings were destroyed and houses were completely wrecked, with nothing but the foundations remaining (TemBruggencate 1983). Part of one hotel was virtually washed out to sea.
Since that hurricane there have been five others of at least moderate size
that have hit French Polynesia in the south Pacific, showing a widespread effect of heavy winds and a rise in temperature affecting almost all of the equatorial Pacific. The trade winds mysteriously ceased and even reversed themselves (NMC, NWS, NOAA 1982).
Continuing into December, the storms on the west coast of the United States intensified and broke through the high pressure area that had been protecting southern California. The storms devastated coastal buildings with large waves and high winds, separately and occasionally at the same time. Later the rainfall increased, and in 1983 San Diego County had the second heaviest March rainfall in the records of the Weather Bureau (San Diego Evening Tribune , 24 March 1983). One storm in late January 1983 coincided with a very high tide, and particularly heavy erosion occurred. The coast retreated as much as fifteen feet in a number of places, and many stairways leading down the bluffs to the beaches north of San Diego were destroyed. Great caves formed along the coast. Farther north, the storm was much more intensive, and coastal retreats up to one hundred feet or more occurred in several places; as far as we know, this was one of the greatest storms since those that followed the eruption of Krakatoa. The storms continued east, causing further devastation, including a major flood in the Mississippi Valley. Snowstorms greater than any since 1885 (during the period following the Krakatoa eruption) hit the Colorado area, and record snowstorms were reported in many parts of the east. This period is now recognized by many Weather Bureau experts as one of very unusual weather (Wagner 1983), and there seems to be little doubt about the cause: the effect of the great mass of volcanic material which in turn formed into aerosols in the upper atmosphere.
One very interesting effect possibly connected to the recent volcanic activity of El Chichon is the sudden increase in water temperature off the coast of Chile and Peru which was measured a little over a month later, a phenomenon known as El Niño. This was followed by great floods along much of the west coast of South America. Great El Niños seem to be most common in periods
directly following volcanic eruptions. Whatever force causes the eruption may also be responsible for the warm-water trend characteristic of the great El Niños of the century. The rise in water temperature causes a general change of water circulation patterns, including movement of the warm water to more northern areas such as occurred during the fall of 1982 when abnormally warm water existed from the tip of Chile to the Gulf of Alaska and as far west as the International Dateline. We have seen it in San Diego, where water temperatures during the winter of 1982–83 rarely fell below 60 degrees, which is very unusual. The fish fauna in the area is changing because of the warm water, and many atmospheric conditions have been modified as a result. All these phenomena fit together in some way and should all be considered.
Going back in time to 1979, the present major volcanic episode was introduced by a moderate-size eruption, Soufriere in the West Indies in April (Simkin et al. 1981:155). During the six months that preceded the Soufriere and El Chichon eruptions, the weather became much colder than normal (Ludlum 1979–1980), and as the eruptions approached, a great Arctic outbreak swept over the United States (Phillips and Aston 1980; Wagner 1980; Ludlum 1982). The record cold preceding Soufriere was also reported in Great Britain and in Eastern Europe; and Siberia experienced the coldest temperatures in 100 years (Le Comte 1980). Thus there seems to have been a more or less worldwide temperature decline just before the beginning of our present volcanic era.
With the eruption of Soufriere, the weather became much milder in the United States, and within a month heavy rains became widespread both in the United States and in the eastern world, while at the same time terrible drought conditions were reported in South Africa, India, South America, and the Middle East. Shortly after the eruption of Soufriere, the intensive flood conditions that are so dominant after an eruption began without the usual delay. Record rains also occurred in France and England. In the United States, tornadoes were extremely abundant. These stormy conditions persisted for almost a full year after the eruption, although the tenth and eleventh month afterward had some
periods of unseasonably warm weather, followed again by a cold wave. At this point, it is inadvisable to follow this postvolcanic episode any further, as it runs into other eruptions which complicate the picture.
We will examine next the 1963 eruption of Agung Volcano, located on a little island just west of Bali (Simkin et al. 1981:150). The volcano erupted in the spring, which seems to be a marked tendency with the large phreatic eruptions that have occurred during this century. We know that a great deal of debris was thrown into the upper atmosphere. Very cold conditions preceded the eruption during the six months studied, especially during the month immediately before the eruption, though it was not as cold as before the eruption of El Chichon. After the eruption there was a decided change in weather conditions. Weather turned warmer than normal for a week, then became cooler, returning to the cool temperatures that had preceded the eruption.
About four or five months after the eruption, what appears to be the effect of the volcano is almost as evident as it was after the El Chichon eruption, with floods, tornadoes, and stormy conditions being very common. In fact, 1964 and 1965 were years of record numbers of tornadoes (Hardy 1966). This condition lasted for about three years before returning to more or less normal patterns. Our records and tables show a clear contrast to what would be considered normal weather. Cold weather preceded the eruption; a great deal of rainfall and stormy conditions were reported afterward, with rapid alternations of warm and cold temperatures. This also seems to be true of the period after the El Chichon eruption described previously. The Agung eruption has been studied in detail, and although the advanced methods used to measure the atmosphere after the El Chichon eruption were not yet developed, it seems fairly certain that this eruption was accompanied by the production of great quantities of aerosols.
Going further backward in time to June 1912, the next eruption of note was Katmai in Alaska. This eruption sent great clouds of ash, and presumably the usual gases, into the upper atmosphere, though little is known about the
measurement of the latter. It is known, however, that the eruption was preceded by record cold weather during most of the six months for which we have weather data. There was some heavy rain, indicating that it was not as dry as the periods that preceded some of the other major eruptions. It is also known that almost immediately after the eruption, within a few days, a haze or dry fog swept down from Alaska and was observed in Wisconsin (Kimball 1913). It was later seen in Virginia and in a widespread area farther south. Interestingly, this mist or dry fog seems to have accompanied various weather conditions. The weather had been quite mild just after the eruption, but within a day or two it turned cold all over the country (U. S. Dept. of Agriculture 1913), just at the beginning of what should have been the summer season. Indeed, there was practically no typical weather during the summer months of 1912. Rain increased and produced floods in many places, though these were not as pronounced as after some of the other eruptions. And unlike after other eruptions, the changes following Katmai were almost immediate. We can be reasonably certain that these changes were related to the volcano because of the mist or dry fog that was seen coming down from the volcano.
During the fall months of 1912, the weather turned warm and relatively dry. In other words, the weather was quite unlike that which followed many of the eruptions. The warmer-than-usual weather lasted through the winter months, so there was no typical summer or winter that year. The first winter storms began in March 1913, ten months after the eruption occurred. During 1913 there were alternating periods of warm and cold weather bearing little resemblance to normal seasons. Then about a year and a half after the eruption, flood conditions, which characterize most periods following volcanic activity, did occur, though not as predominantly as after El Chichon and Agung. Thus, a shifting of seasons followed this eruption, although as of yet there is no explanation for this curious condition.
A series of huge explosive eruptions began in 1886 and reached a maximum with Bandai San in 1888. According to our hypothesis, this period would
be expected to show considerable effects from volcanic activity. Following the last of the major eruptions, however, there was a considerable delay in any notable weather changes. The weather was warm and seasonable for a period of a year and a half after the eruption. Then the weather changed drastically for a period of at least one year. The volcanic eruptions actually continued until 1892, but curiously the period in which we have what might be called volcanic weather started in the midst of this volcanic outburst, approximately the first of January, 1890. At that time there was a sudden and remarkable change from the rather mild weather conditions that preceded the eruptions to a violent alternation of very stormy weather and relatively mild weather which lasted for virtually two years. This period included more violent windstorms, flood conditions, and tornadoes than any period during the 110 years for which we have records of weather data. The destruction of property was very extensive during this time. Yet, unlike in other postvolcanic periods, the weather was most often quite warm, although cold periods were interspersed with the unusual warmth.
Finally there is the case of Krakatoa, the great eruption which purportedly produced waves felt around the world. Tide gauges as far away as London recorded the effect of the tsunami it produced, and sunsets were noticeably affected worldwide. The weather preceding the eruption was similar to that during periods before other eruptions. It was mostly cold, but differed from other prevolcanic periods in being quite stormy, particularly just before the eruption. Heavy rain, floods, and tornadoes occurred, which was not the case in periods preceding other eruptions.
The big explosion on 27 August 1883 sent so much material into the atmosphere that the effects were observed worldwide during the months that followed. Strangely, the weather did not change immediately after the eruption; it continued cold, and only moderate stormy conditions were reported for about five months. Then a sudden, drastic change in weather conditions developed. Tremendous downpours produced flooding of monumental proportions. Never in the hundred years that followed has flooding in southern California been
greater. The river valleys were washed clean of almost everything; fortunately, the extensive constructions that now exist in the lower course of the great rivers were not present then. Another notable feature of this period is the concentration of tornadoes. On 19 February, 1884, between forty and sixty tornadoes killed hundreds of people in the southeastern United States (U. S. Signal Service 1884a ). Tornadoes continued throughout the month. At about this time unusually extensive flooding occurred in the lower Mississippi Valley, while killing frosts occurred as late as June over most of the northern part of the country (U. S. Signal Service 1884b ). Wild storms and great downpours continued through the end of the twenty-four months that we examined, and for some time after as well, eventually leading into the next volcanic episode.
Data Analysis
Perhaps one of our best pieces of evidence for the importance of volcanism in relation to weather changes comes from our analysis of the climatic data for the six months preceding and the ten to thirty-six months of unusual weather following each eruption, compared with data from a series of months during periods when little major phreatic volcanic activity was recorded. The latter series was determined by examining the most recent publication of the Smithsonian Institution (1981) which gives a chronology of volcanism. From this we chose periods for which the Smithsonian publication assigned a Volcanic Explosivity Index (VEI) that included no numbers above 2, indicating very light volcanism, though we excluded some periods in this category when additional sources of information suggested higher numbers should have been assigned. In general, we feel that the Smithsonian reference provides fairly accurate information, in addition to being the most updated for this century at the time of this writing.
Our analysis is by month, and each weather characteristic shown in figures 6a, b, c was given a value based on the following formula: If the
| |||||||||||||||||||||||||||||||||||||||||||||||||||||||||||||||||||||||||||||||||||||||||||||||||||||||||||||||||||||||
Figure 6
Compilation of volcanic data showing the relationship to historical weather conditions.
Figure 6a
Statistical comparison between the averaged lowest volcanic periods and each of the
significant posteruptive periods (which varied from 10–36 months in length).
characteristic seemed to be the dominant feature for the month, we gave it three points; if it was one of several weather characteristics noted during the month, it was assigned one point; and if it was not mentioned at all, it was worth zero points. We then added up the points assigned to the various characteristics for
|
Figure 6b
Statistical comparison of the six-month period preceding the major phreatic eruptions.
each month and determined the importance of each particular characteristic on a percentage basis for each of the ten to thirty-six months where it appeared unusual conditions existed following an eruption (fig. 6a ), as well as for the six months preceding (fig. 6b ); in addition, in figure 6c , we included each of
| |||||||||||||||||||||||||||||||||||||||||||||||||||||||||||||||||||||||||||||||||||||||||
Figure 6c
Statistical comparison of low-volcanic period.
several periods when the effects of volcanism were reportedly at a minimum. The results shown in these figures are preliminary, but they indicate a dramatic difference between the periods during which there was little appreciable volcanic influence and the periods following and preceding major volcanic episodes.
Conclusions
The six months that precede the great phreatic eruptions seem to have a consistent characteristic: not only are they colder than average, but each of them contains months during which there are some of the coldest temperatures in all of the 110 years of weather records. It seems impossible that this could be only a coincidence. Moreover, when we looked further back in the record, we discovered, in all cases, that the cold periods did not continue; apparently then, this is a phenomenon that develops shortly before the great eruptions take place. At present we have no explanation for this strange phenomenon, but it is hoped that further scientific inquiry will shed some light on it.
Regarding the weather that directly follows the great eruptions, the patterns are not the same in all cases, except that they all include periods of extremely changeable weather. That is, they all include features such as disastrous floods, an abundance of heavy windstorms coupled with extremely destructive tornadoes and hurricanes, record rains, snowstorms, an abundance of thunderstorms with unusually large hail pellets, and other indications of abnormal weather. Except during the periods following the great eruptions, such conditions are rare. It seems almost certain, therefore, that the cold summers and other abnormal temperatures discovered earlier are to be expected after the great phreatic eruptions, though they form just a portion of the unusual weather.
It would seem from our results that volcanic eruptions undoubtedly contribute to weather changes. We do not suggest, however, that the eruptions alone cause these weather changes. There seem to be other factors that develop before eruptions that are also of importance. In all, the problem still needs considerable investigation.
Great Windstorms of the Nineteenth Century
Going back to the early part of the nineteenth century, we find records of windstorms along the southern California coast that appear to have been more severe than any we have experienced in this century. We have excellent accounts of these storms in R. H. Dana's Two Years Before the Mast (reprinted 1966:56–57), which tells of the author's years as a seaman on a ship carrying cattle hides along the California coast during the 1830s. At the time, the ships were warned to anchor several miles offshore and to be ready at any moment to slip their cables and put to sea because of the sudden, awful southerly storms. The winds during these storms were described as worse than those encountered in rounding Cape Horn, and waves reached a height of fifty to sixty feet. The ships were in real trouble if they did not find shelter behind Catalina Island or elsewhere. Nothing of this sort has occurred, except on extremely rare occasions, since about 1891, and not with any regularity since 1856. We have no way of knowing whether or not these storms have ended forever; nevertheless, a recurrence could be disastrous to present-day shipping as well as to harbors with exposures to the south.
Storms of this magnitude during the last century would have been a tremendous factor in coastal erosion in the San Diego County area. One of the primary effects would have been to carry sediment up-coast in the surf zone, and erosion would have occurred mainly where the coast has an east-west trend, as on the south side of Point La Jolla. The storms described in the 1800s have equivalents today along the coast of Baja California, where Chubascos occur in late summer and early fall, often reaching hurricane velocity. On the very rare occasions when these storms come into California, they are largely spent but do affect east-west beaches such as Newport, where rapid undermining of coastal homes has taken place (fig. 7).
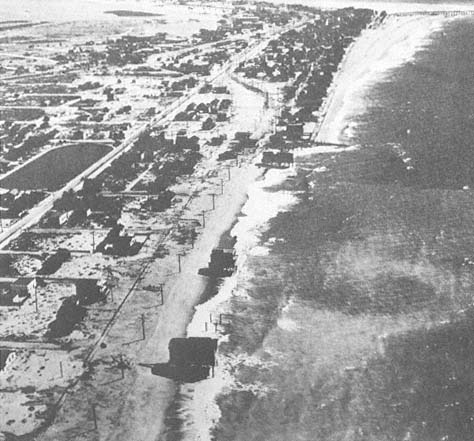
Figure 7
Oblique aerial view of Newport Beach in 1934 showing severe beach erosion and undermined
cottages about 1.5 miles northwest of the Newport Beach Pier. Note the accretion on each
side of the pier. This area was again severely eroded in the winter of 1968.
From: Fairchild Aerial Photos.
Great Floods of the Nineteenth Century
There is no doubt that floods of the past century were caused by rainfall much greater than any experienced more recently. A remarkable flood occurred in San Diego during September and October, 1821, causing extensive damage (J. C. Hayes 1874). The water rose in a single night, filling the San Diego River in Mission Valley from bank to bank, washing away most of the ranches, and changing the course of the river. Amazingly, no rain fell along the coast at the time of the flood, so its source had to be in the mountains to the east.
1862 Flood Period
During the early years of the Civil War, in the winter of 1861–62, southern California, and the entire west coast of the United States, appears to have had a rainy season completely out of line with anything experienced since the white man came into the area. The state was sufficiently populated at the time so that there is no doubt of the accuracy of the reports.
The rain began in December 1861 and continued until the summer of 1862. This period became known as the Noachian Deluge (Smythe 1908). The great Sacramento and San Joaquin valleys of California were turned into a lake about 300 miles long and 20 to 60 miles wide. Many towns were submerged, and the residents had to flee to the surrounding high ground or move to the coast. The state capital at Sacramento was temporarily moved to San Francisco when much of Sacramento was flooded. The governor, state legislature, and state employees were not paid for a year and a half, as the State of California went bankrupt. It was estimated that approximately one-quarter of the taxable real estate in the state was destroyed (Brewer 1966:243). To the south, the narrow coastal plains at Santa Barbara were flooded by the rivers coming out of the mountains, and the town of Ventura was abandoned.
The Los Angeles plains, at the time a marshy area with many small lakes and several meandering streams from the mountains, were extensively flooded, and much of the agricultural development was ruined; small settlements were
submerged in most of the lower areas. These flooded areas were formed into a large lake system with many small streams and a few more powerful currents cut channels across the plain and carried the runoff to the sea. In February 1862, the Los Angeles, San Gabriel, and Santa Ana rivers merged. Government surveys at the time indicate that a solid expanse of water covered the area from Signal Hill to Huntington Beach, a distance of approximately eighteen miles.
In San Diego the flooding coincided with a storm at sea, which backed up the water running into the bay from the San Diego River. As a result, the river cut a new channel into San Diego Harbor. The heavy downpour also changed the look of the land in another way. The previously rounded hills were extensively cut by gulleys and canyons (McGlashan and Ebert 1918:38). Interestingly, there seems to have been no warning to residents of San Diego that a flood was imminent. But then, even today, we are unable to predict the recurrence of such an event. Dry periods are irregular; some are quite long, as were the ones that preceded and followed the 1862 floods; and then again, others are quite short—their termination is likely to be as abrupt as their beginning.
Stormy Flood Period:
1884–1891
Unlike the floods of 1862, those beginning in 1884 could have been predicted in many areas, though with less certainty in California than in other parts of the world. It now seems clear, as previously indicated, that weather changes following the eruption of Krakatoa were the principal cause.
This second extremely wet period began in 1884 and lasted, with intermittent dry years, until 1891 (Kuhn and Shepard 1981). The events of the period are documented in memoirs, letters, and newspapers of the day. The weather was characterized by tremendous downpours; the highest daily, monthly, and annual rainfall levels of record in San Diego County were established during this period. The winters of 1884, 1886, 1889, 1890, and 1891 saw severe cyclonic sea storms, which are unusual for southern California. The intensive rainfall
caused sediment saturation of the bluffs along the coast, and large storm swells and high tides coincided with river basin flooding.
In 1884 there were two separate floods. The first was in February, when the railroad line to San Bernardino was washed out, and for nine months San Diego was cut off from San Bernardino. Several miles of track and all but one bridge between Encinitas and San Diego were washed out, and it was nearly two months before the rail connection between Encinitas and San Diego was reestablished.
Food supplies ran out in Encinitas so a ship was dispatched from San Diego with ten tons of provisions for the stranded settlers. But the heavy rain continued falling, and the waves were breaking far out in the kelp beds or even farther away, so the vessel stayed offshore for over a week, waiting for a chance to unload its supplies. A gale then approached from the southeast, and the ship ran for the lee of Santa Catalina Island. After remaining there for another week, the vessel returned to San Diego, its cargo still undelivered.
The California Southern Railroad station, located directly to the north of Oceanside, near the Santa Margarita Ranch house, reported on 14 February 1884, that in fourteen days rainfall totaling thirteen inches had fallen. This was more rain than had fallen at the same location during the entire previous year. Severe storms were reported throughout San Diego County. The mountainous region to the east was affected by the storms, as reported by the San Diego Union (26 February 1884) following one cloudburst on the southwest slope of Palomar Mountain:
Cloud Burst on Smith's Mountain—A private letter from Agua Tibia near Pala, dated on the 19th, says: "We had the most awful storm Sunday and Sunday night, I ever saw or heard. None of us slept that night. It was frightful. About half past four on Sunday afternoon a terrifying crashing and roaring was heard, and standing in the door we saw a wall of water, seventy feet high, coming down the creek, tearing trees, huge boulders, etc. to pieces, roaring and boiling in its course. It was a
frightful sight. Everything was swept before it. Enough wood was crushed up by this torrent to give us firewood for years. The once thickly wooded glen is swept bare as a sandy beach on the ocean shore. Every tree, shrub and branch is gone. It is absolutely desolate. Surely great destruction must have been wrought along all water courses in the county."
As of 1 April 1884, the California Southern Railroad, which had begun operations between San Diego and San Bernardino only a year earlier, declared bankruptcy on account of the storms and the flooding. By the second week of June, the city of San Diego had measured twenty-five inches of rain, and fifty to eighty inches had fallen in other parts of San Diego County, but the rains began to lessen. By July 1, the rainy season was over.
Between 1889 and 1891, southern California was again battered by violent subtropical storms and exceptionally heavy rainfall. During this period the U. S. Coast and Geodetic Survey (USCGS) was conducting topographic and bathymetric surveys along the coast of San Diego County. The USCGS (1889a ) topographic notes indicate that the bluffs show "new erosion during each winter storm as the characteristic feature of this coast." One thunderstorm hit Encinitas on the evening of 12 October 1889 (U. S. Signal Service 1889), and in eight hours 7.58 inches of rain fell there, while only 0.44 of an inch was measured at San Diego, and 0.04 of an inch at Los Angeles on the same date.
Examination of the 1889–90 San Diego County Tax Assessor records of land parcels located at the mouth of Cottonwood Creek, Encinitas, and south of there (fig. 8a ) indicate that seaward property was greatly devalued or stricken from the tax roles, and land parcels directly inland increased temporarily in value (fig. 8b ). The weather varied greatly from month to month throughout the world during the winter of 1889–90. A stormy condition seems to have prevailed generally throughout much of the United States. During February 1891, there were destructive floods in California, Arizona, and on all major rivers east of the Rockies. Extremely large snowpacks existed in southern California prior to the warm rain that fell from 17–27 February 1891. Pourade (1964:224) noted:
Figure 8a
The assessed value of the former oceanfront and
inland subdivided blocks of Encinitas in the 1880s.
As former seaward parcels of land were devalued,
the blocks directly inland temporarily increased in value.
From San Diego County Tax Assessor
Records, 1886–1892.
Figure 8b
Subdivision map of Encinitas, 1883. Seaward hachured data are from California Southern Railroad
Topographic Survey, 1880. The white dashed line is from the 1883 subdivision map and the California
Southern Railroad right-of-way location map (January 1, 1883). The 1888–1891 lines derive from the
U. S. Coast and Geodetic Survey, and solid black line farther inland represents the approximate 1980
bluff top. Note that more than 600 feet of retreat occurred between 1883 and 1891.
For its brief duration, scarcely more than a week, the storm that struck Southern California and Arizona in February of 1891 was probably the worst on record. . . .
The San Diego River quickly rose to flood level and hundreds of residents flocked to ride the cable cars to the pavilion park overlooking Mission Valley. A solid sheet of water spread across the valley floor and over the tide flat to False Bay [Mission Bay]. Every telephone and telegraph line was out, railroad connections were severed and a heavy storm at sea with gale winds interrupted shipping. Virtually everything that had been built in the riverbeds or on the alluvial plains between the great watersheds and the sea was gone or reduced to wreckage [presumably referring to much of the coast of southern California]. . . .
Bear Valley [south of Escondido near the present Wild Animal Park] reported thirty inches of rain in thirty-seven hours; Cuyamaca, eighteen inches in forty-eight hours, the City [of San Diego] recorded only 2.57 inches for the storm and 4.77 inches for the month.
As these storms moved east, Arizona was devastated. Flooding in Arizona reached a peak in the last week of February 1891, and the U. S. Army reported that the Colorado River was twenty miles wide at the former crossing at Yuma.
August 1891 was the warmest August recorded up until that time along the Pacific coast (U. S. Signal Service 1891:188, 191). Although no rainfall was reported over the greater part of California, a world record rainfall was verified at Campo (near the Mexican border) on 12 August 1891 when 11.5 inches fell in only eighty minutes!
Perhaps the significance of these floods, as far as coastal erosion is concerned, is that the rains that produced them were very concentrated. In more recent times such rains have caused immediate erosion of sea cliffs. One can imagine how this much more concentrated rainfall would have cut deeply into the cliffs and canyons and would have been responsible for landslides of far greater devastation than those we have experienced in recent years.
When stormy seas and heavy rain of this magnitude attack the sea cliffs, erosion can be so disastrous that any buildings on top of the bluffs, so common now, can be seriously damaged if not destroyed. The one foreseeable alternative to this scenario is that the rivers, swollen by the floods, might carry such a large quantity of sediment to the sea that wide beaches would be formed which would, for a time, protect the cliffs from the waves.
Infrequent Floods of the Early Twentieth Century
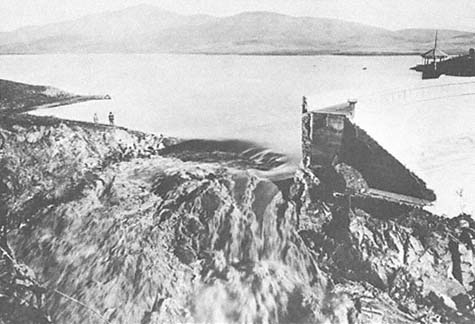
Figure 9
January 1916 view along the lateral margin of Sweetwater Dam showing the break.
Photo : Title & Trust Insurance Co.
The most significant flood of the present century in the San Diego area was in 1916 (McGlashan and Ebert 1918). This was a very localized flood with an interesting story behind it. In 1915 the weather was quite dry, and the reservoirs were receiving little water. There was at this time a renowned rainmaker, Charles Hatfield, who had been successful in Arizona and offered to fill the reservoirs around San Diego within a year for a fee of $10,000. He would ask no fee if he failed (Pourade 1965:204). There was also the condition that he had to prove that he had caused the rain that filled the reservoirs. He proceeded with his operation, and between January 15 and 30, 1916, over seven inches of rain fell in San Diego. Both the Sweetwater (fig. 9) and Lower Otay dams broke, fifty people were drowned, and the city decided to pay Mr. Hatfield only if he agreed to pay for all damages caused by the rain. He declined, and the residents ran him out of town.
Flooding occurred again in 1927, 1938 and 1941, but these more recent floods were not as severe as the 1916 flood, and not nearly as serious as those of the 1880s. In view of the present extensive real estate development in the valleys, lowlands, and along the shore, it is questionable whether any economical or environmentally acceptable technology could protect existing structures in the event of a recurrence of storms like those of the 1880s.