Visualization Requirements
As one solves large-scale problems on massively parallel machines, the data generated become very difficult to handle and to analyze. In order for the scientist to comprehend the large volume of data, the resulting complex data sets need to be explored interactively with intuitive tools that yield realistic displays of the information. The form of display usually involves polygons and lines, image processing, and volume rendering. The desired interface is a simple, flexible, visual programming environment for which one does not have to spend hours writing code. This might involve a dynamic linking environment much like that provided by the Advanced Visualization System (AVS) from Stardent Computer or apE from the Ohio State University Supercomputer Center in Columbus.
The output need not always be precisely of physical variables but should match what we expect from our physical intuition and our visual senses. It also should not be just a collection of pretty artwork but should have physical meaning to the researcher. In this sense, we don't try to precisely match a physical system but rather try to abstract the physical system in some cases.
To handle the enormous computational requirements involved in visualization, we must also be able to do distributed processing of the data and the graphics. Besides being useful in the interpretation of significant physical and computational results, this visualization environment should be usable both in algorithmic development and debugging of the code that generates the data. The viewing should be available in both "real time" and in a postprocessing fashion, depending on the requirements and network bandwidth. To optimize the traversal of complex data sets, advanced database techniques such as object-oriented databases need to be used.
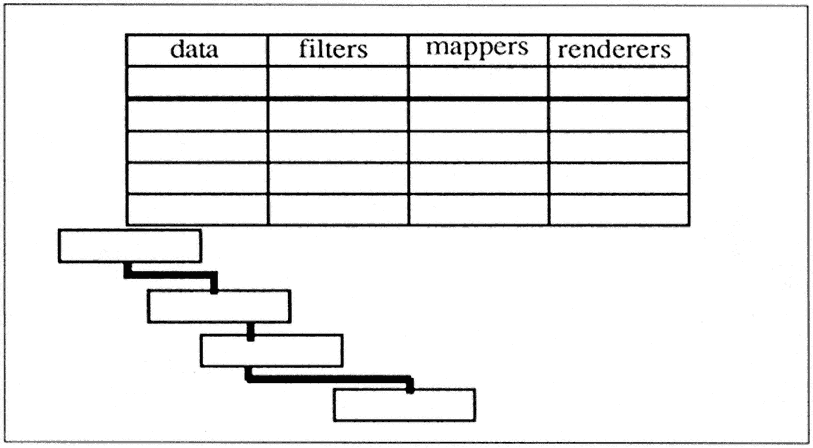
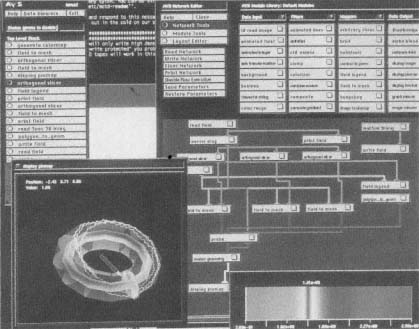
As mentioned above, there are two graphical environments available today (and possibly others) that attempt to provide the sort of capability described above. They are AVS and apE. The idea is to provide small, strongly typed, modular building blocks out of which one builds the graphical application. These are illustrated in Figure 1, which displays a schematic of the user's workspace with AVS. The data flows through the graphical "network" from the input side all the way through the graphical display. In AVS, there are four basic types of components out of which one builds the application: data that is input, filters that modify the data, mappers that change the data from one format to another, and renderers that display them on the screen. Figure 2 illustrates AVS's ability to interactively analyze data.
Figure 1.
A schematic of an AVS-network user's workspace.
Figure 2.
The AVS environment is used to display the complex magnetic field in a
numerical model of a Tokamak Fusion Reactor system. AVS provides a
simple visual environment, which is useful to interactively analyze the data.
Several different magnetic field surfacesare shown, as well as the trajectory
of a particle in the system.
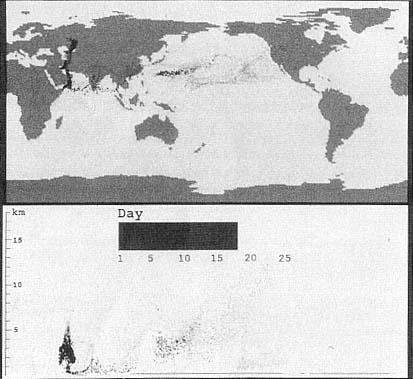
Figure 3.
This still from a computer animation illustrates the modeling of the
propagation of smoke in elevation, latitude, and longitude generated by
the oil fires in Kuwait. A full global climate model was used, including
rain washing out the smoke. The picture shows that the smoke does
not loft into the stratosphere to cause a global climate modification.
The limit to the network complexity is only the memory and display limits of the workstation. However, this limitation can frequently be a major problem, as the size of the data set produced on current supercomputers can far exceed the capabilities of this software, even on the most powerful graphics workstations.
Because this data-flow style is, in fact, object-oriented, this model can be readily distributed or parallelized, with each module being a thread or distributed process. By placing the nodes on different machines or processors, this data-flow model can, at least in principle, be distributed or parallelized. In fact, the apE environment provides for this kind of functionality. For high performance in a graphics environment, these nodes need to be connected with a very-high-speed (e.g., gigabit/second) network if they are not running out of shared
memory on the same machine. The next generation of graphics environments of this type will hopefully operate in this manner.
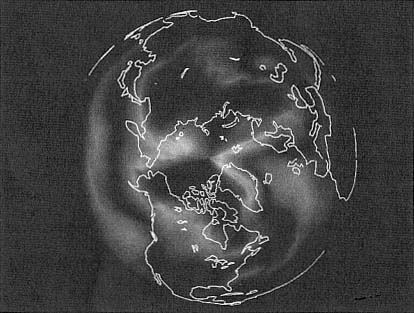
A number of real physical applications are using this graphics environment, including problems that run on a CRAY Y-MP and the CM-2. For example, at the Institute of Geophysics and Planetary Physics, Los Alamos National Laboratory, a three-dimensional climate model has been run on the Cray (see Figure 3). A layer of the resulting temperature data has been taken and mapped onto a globe and displayed in an animated manner as a function of time. Using AVS, one can rotate the spherical globe while the data is being displayed, allowing one to investigate the polar regions, for example, in more detail. This is one simple example of how the data can be explored in a manner that is hard to anticipate ahead of time.
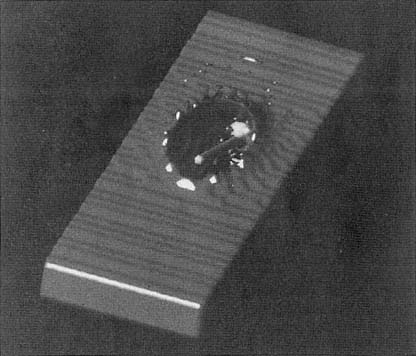
Figures 4 and 5 further illustrate the capability of high-performance graphics environments as applied to physical processes. Realistic displays like these, which can be explored interactively, are powerful tools for understanding complex data sets.
Figure 4.
Temperature distribution over the Arctic, generated by the global climate
simulation code developed at the Earth and Environmental Sciences
Division, Los Alamos National Laboratory.
Figure 5.
Model of the penetration of a high-speed projectile through a metal plate.
Note the deformation of the projectile and the splashing effect in the metal
plate. This calculation was done on a Thinking Machines Corporation CM-2.
