Duration of Life at Every Age and Age Composition Historically Considered: The Rectangular Survival Curve
The theme of the historical demography of aging has been treated so far as if it were concerned only with those who reach, who have reached, or who are likely to reach late life. This may seem appropriate because gerontology, the scientific study of aging, is itself pursued in this way and because the chapters that follow here deal with such topics, many of them belonging interestingly enough to the period of the secular shift when it occurred to the population of the United States.
But the elderly have only ever been the topmost of the age levels of any society, and aging at all the other, lower levels are alike of importance to the social scientist, the historical sociologist especially. The system of distributing individuals into age groups—childhood, youth, middle age, and so on—found, but in differing forms, in every, society and at all times together with the interrelationships between those groups and their members are all of significance. Generational relationships are rightly recognized as a subject for anthropological and sociological as well as for historical and gerontological research. Taken as a whole these studies go by the name of age structuring, until recently pursued mainly by anthropologists, though with some reference to historical instances.[17] Analyses of how age structuring differs from society to society and how far it has changed historically certainly belong with the historical demography of aging, since the relative size of age groups will change with demographic change. What is more, all members of all age groups above infancy bear the marks of their experiences as members of younger age groups. This highly significant fact is of greatest importance for those who have gone through the largest number of age divisions, or life course stages, that is to say, those who are old at any one time.[18]
Both expectation of life and the relative sizes of the membership of age groups are relevant here once again. For it must never be forgotten that everyone is always getting older at all points in the life course and that prospective length of life to spend in each life course division, or in divisions
to come, makes a considerable difference to individual attitudes and other features of age structuring. The question that presents itself is how far expectation of life at all ages, not simply at birth, is likely to change over time (or to differ between countries and cultures) and how far relative age group sizes do the same.
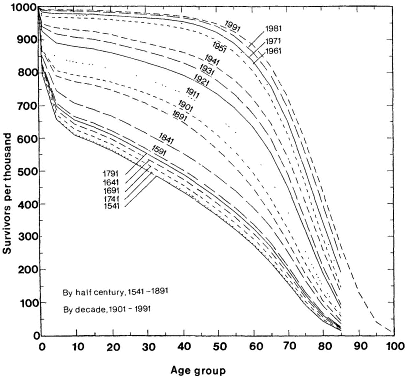
An interesting conspectus of capacity to go on living and its fluctuations over time is provided in figure 1.5, which traces not so much values of years still to live as they have changed over the centuries but survival itself. Survival curves plot for successive dates the numbers of an original 1,000 newborn babies still alive after 1 year, 5 years, 10 years, 20 years, and so on, up to 85, or to 100 for the most recent case. The record is again the English one, the first country for which such estimates have become available so far into the past. Up to that for 1691-1695, each curve is based on evidence from one five-year period; after that the curves relate to briefer periods or a single year.

Fig. 1.5.
Survival curves for cohorts of one thousand newborns, by age group:
England, 1541-1991. Data from Cambridge Group back projection files
and English Life tables up to no. 15. Work of James Oeppen.
The lower aging plateau is evident in the curves up to that for 1841-1845; here lines are separated by intervals of half a century each. These lines are not only very close together but they change positions with each other in an order that is certainly not chronological. The one for the five-year period 1691-1695, for example, traces a course only just above that for 1541-1545 and well below that for 1591-1595, which in its turn is closest to that for 1841-1845, nearly two hundred fifty years later. The run-up to the secular shift is visible in the wide gap between 1841-1845 and 1891, when mortality was evidently falling but at some ages may still not have been below the levels previously reached for an individual year or so on the lower aging plateau. The subsequent course of the secular shift itself shows up vividly in the more and more conspicuous spaces between successive curves, this time temporally successive curves and separated by ten-year and not by fifty-year intervals as is the case for the earlier lines. The approach to the higher aging plateau in our own day is strongly suggested by the marked narrowing of the spaces after 1951.
Students of aging will notice that the figure as a whole is reminiscent of the theory of what is called "The rectangularization of the survival curve," which is discussed in chapter 6 of A fresh map of life (Laslett 1989; see especially the revised version in press). This predictive theory, propounded by the American researcher James Fries and based on the very much more accurate survival curves now available, might provide a seductive concluding act to the historical drama we are commenting upon here. The finale would be a dramatic compression of mortality, showing itself in the survival curve pattern as a conspicuous narrowing of the gaps between the lines in figure 1.5, tending toward their elimination, particularly at the extreme right-hand side. Simultaneously these overlapping curves would change their shape even further in the direction shown forth in all their predecessors, tending more and more closely toward the rectangular. These shifts would indicate that survival will get better and better until finally virtually all persons born would be alive in their later 80s or their 90s. At some point during those years, it is further claimed, the end will come for a larger and larger number as time goes by, and after briefer and briefer final illness a "natural" death will supervene, a "natural" death at the completion of the "natural" span of human life.[19]
In Fries's model, then, morbidity, the tendency to fall ill, is to be compressed along with mortality. In favor of this dual hypothesis is that at all periods before the secular shift, on the lower aging plateau, that is to say, sickness and death were distributed over the whole life course: during and since the secular shift there has been an increasing tendency toward postponement to the later years. When the higher plateau succeeds after the secular shift is over, Fries's theory predicts that both sickness and death will be almost entirely concentrated within a very short period, most likely during the middle or late 80s of the life course. If the model were to be validated, its ef-
fect would indeed be that the survival curve will eventually become rectangular, fulfilling the tendency so conspicuous in our diagram of English development over half a millennium.
It is becoming evident, however, that survival curves in our own day are resistant to such an interpretation. Some of the number of competing theories of aging at the present time imply that they will finally approximate the rectangular shape. Otherwise the life span, known to be lengthening, will do so indefinitely. But the attractive thesis of a prospective compression of the incidence of final illness and death has to be regarded as not proven, a fact with evident implications for the uncertainties over the higher aging plateau. The issues it raises, however, decidedly intensify the interest of this topic in the historical demography of aging. For our present purposes, the significance of four and a half centuries of English survival curves, which as we have seen do not necessarily represent in detail what has gone on in other comparable populations, lies elsewhere. It is in the fact that their shape was indeed remarkably constant over time until the secular shift. Habits, attitudes, and institutional arrangements that were based on the assumption that most people would be alive in the same proportion of numbers at the same age as time went by and have roughly the same numbers of years to expect to live were apparently well founded.
It can be quite simply asserted, then, that over the three and a half centuries of English history before the secular shift for which the required knowledge has been established, age structuring was subject to very little change with respect to longevity. As has been hinted, the most interesting of the effects that finally supervened at the height of the shift itself is the emergence of the Third Age, which will be initially defined demographically in terms of survival by the establishment of a novel relationship between the number of those alive at age 25 and the number alive at age 70.
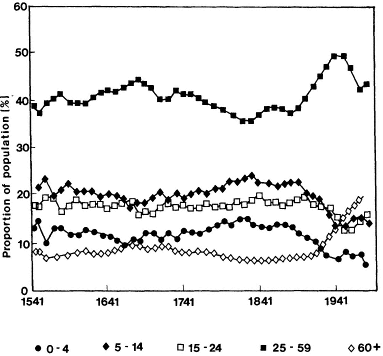
Exactly the same conclusion as to relative constancy during the Before can be drawn from figure 1.6, which traces the fluctuating boundaries between age groups composing the entire English population over the same long period. (Note that estimates before 1870 cover England and Wales; after 1870, the two entities can be distinguished in official figures.) All the age groups show continuity over time in their relative sizes until the secular shift sets in. It is true that the line bounding the elderly (those over 60, the lowest proportion of course until the end of the nineteenth century) is noticeably smoother than the lines bounding other age groups (0-4, 5-14, 15-24, 25-59). But all five boundaries are quite regular before the shift, regular, that is, within short-term fluctuation up and down. The only comparable reconstruction, that for Tuscany from 1810 to 1940, has a very similar pattern (Breschi 1990: 165). It seems to have been exceptional fertility falls in England during the 1550s and the 1640s to 1670s that led to the frontiers between shares of children (5-14) and adolescents (15-24) crossing each other for a little while. But otherwise age composition displays overall con-

Fig. 1.6.
Age composition of the population: England, 1540s-1990s.
stancy, and the statements made above about survival and life expectation apply here as well.
Stability in age composition did not survive the onset of the secular shift, and the area near the right margin of figure 1.6 demonstrates as much. Proportions over 60 rose abruptly until by the 1950s they became the second-largest age group and went on growing without interruption until the end. It is well known that this relative expansion was, is, and decidedly will be accompanied by a parallel change in composition within the open-ended group of those over 60. The very old—the 80s to 84s, 85s to 89s, the over 90s—will increase rapidly, along with their longevousness. This is a radical change from traditional age structure and one that creates an entirely novel and very formidable prospect for the present generation. Although we do not have the information to confirm the generalization in detail, it is very probable that at all earlier times the composition of the group of those very late in life tended to be constant in all larger populations.
Our ancestors, that is to say, those who were citizens of our countries before the secular shift in aging, could rely on a relatively stable age structure as well as a relatively static life expectation at every point in the age range.
All over their populations and at every period, the proportions of infants (0-4), children (5-14), adolescents (15-24), and those at working age stayed about the same, as did proportions of the elderly. The same statements could probably be made with some modification about the populations still on the lower aging plateau at the present time. The secular shift upsets this perennial pattern quite radically, and all age boundaries and traditional assumptions as to length of future life tend to lose their stability as the shift proceeds. The whole of the evidence we have so far sun, eyed suggests that this represents a unique occurrence in human history.