Distribution of Phosphate, Nitrogen Compounds, and Silicate in the Oceans
The distribution of phosphate in the three oceans may best be shown by means of longitudinal vertical sections whose locations are indicated in fig. 44. The representations are intended to bring out only the major features of the vertical distribution, and for this reason many of the minor irregularities have been omitted. The section in the Atlantic Ocean (fig. 45) is based on data obtained by the Discovery (Deacon, 1933) in the Southern Hemisphere, by the Atlantis (Seiwell, 1935) in the North Atlantic, and by the Meteor (Defant et al, 1936) in the area to the south of Greenland. The section in the Pacific Ocean (fig. 46) has been constructed from Discovery observations in the Antarctic (Clowes, 1938) and from those of the Carnegie (in press). The section in the Indian Ocean (fig. 47) is based on Discovery observations (Clowes, 1938). Examination of these sections and the vertical distribution curves in figs. 48 and 50 shows that in general the distribution of phosphate and nitrate is characterized by four different layers: (1) a surface layer in which the concentration is low and relatively uniform with depth, (2) a layer in which the concentration increases rather rapidly with depth, (3) a layer of maximum concentration that is usually located somewhere between 500 and 1500 m, and (4) a thick bottom layer in which there is relatively little change with depth. Examination of figs. 45, 46, and 47 shows that the surface layer is thickest in mid-latitudes

Phosphate distribution in a longitudinal section in the central Atlantic Ocean. Units: μg-atoms of phosphorus per 20° liter.

Phosphate distribution in a longitudinal section in the Pacific Ocean. Units: μg-atoms of phosphorus per 20° liter.

Phosphate distribution in a longitudinal section in the western Indian Ocean. Units: μg-atoms of phosphorus per 20° liter.
In the Atlantic Ocean the highest phosphate content (about 2 μg-atoms/L) is found in an intermediate layer extending northward from the Antarctic and centered at depths of about 1000 m. At all depths of about 1000 m or more there is a gradual decrease in phosphate concentration from south to north. A layer of minimum concentration containing less than 1.0 μg-atoms/L of phosphorus extends southward beneath the layer of maximum content. The phosphate concentration in the Antarctic is about twice that found in the northern part of the ocean. Regional differences in the phosphate distribution in the upper 50 m of the Atlantic Ocean are shown in fig. 217 (p. 787). Such differences are of importance in the distribution of plankton. The variations in a transverse section across the South Atlantic are illustrated in fig. 218 (p. 788), which shows the variable thickness of the surface layer of low phosphate content.
The distribution of phosphate in the Pacific Ocean (fig. 46) has many features that differ from those in the Atlantic Ocean. As might be expected, the conditions in the Antarctic are rather similar. However, the maximum amounts in the Pacific are found not in the Southern Hemisphere, as in the Atlantic, but north of the Equator, where the amounts present are about twice those found in the Antarctic (3.5 μg-atoms/L and about 2.0 μg-atoms/L, respectively). Furthermore, there is no clearly defined layer of minimum phosphate content beneath the maximum. The deeper waters of the Pacific are in general higher in phosphate than those of the Atlantic Ocean. The difference in the character of the distribution in the two oceans is related to the nature
The amounts of phosphate in the Indian Ocean (fig. 47) are greater than those in the Atlantic but somewhat less than those in the Pacific Ocean. The intermediate maximum in southern latitudes corresponds to that in the Atlantic, and the maximum in the equatorial region corresponds to that in the North Pacific, as it is related to the low oxygen content of the water. The minimum layer, at depths of about 3500 m, is clearly defined in all latitudes north of 40°S.
The differences between the phosphate concentrations in the three oceans are brought out in fig. 48, which is based on data collected by the Dana (Thomsen, 1931) on a voyage around the world and by the Atlantis in the western North Atlantic (Rakestraw and Smith, 1937). Observations from six stations (locations shown in fig. 44) in each ocean have been averaged and the values corrected for salt error (p. 182), so that they are somewhat higher than the values given in the sections. Too great emphasis should not be placed on the absolute values, as the purpose of the illustration is only to show the character of the vertical distribution in the three oceans, and to emphasize the higher phosphate content of the Pacific and the Indian Oceans in contrast to that of the Atlantic Ocean. Data from individual stations in moderate and low latitudes usually show a well-defined intermediate maximum.
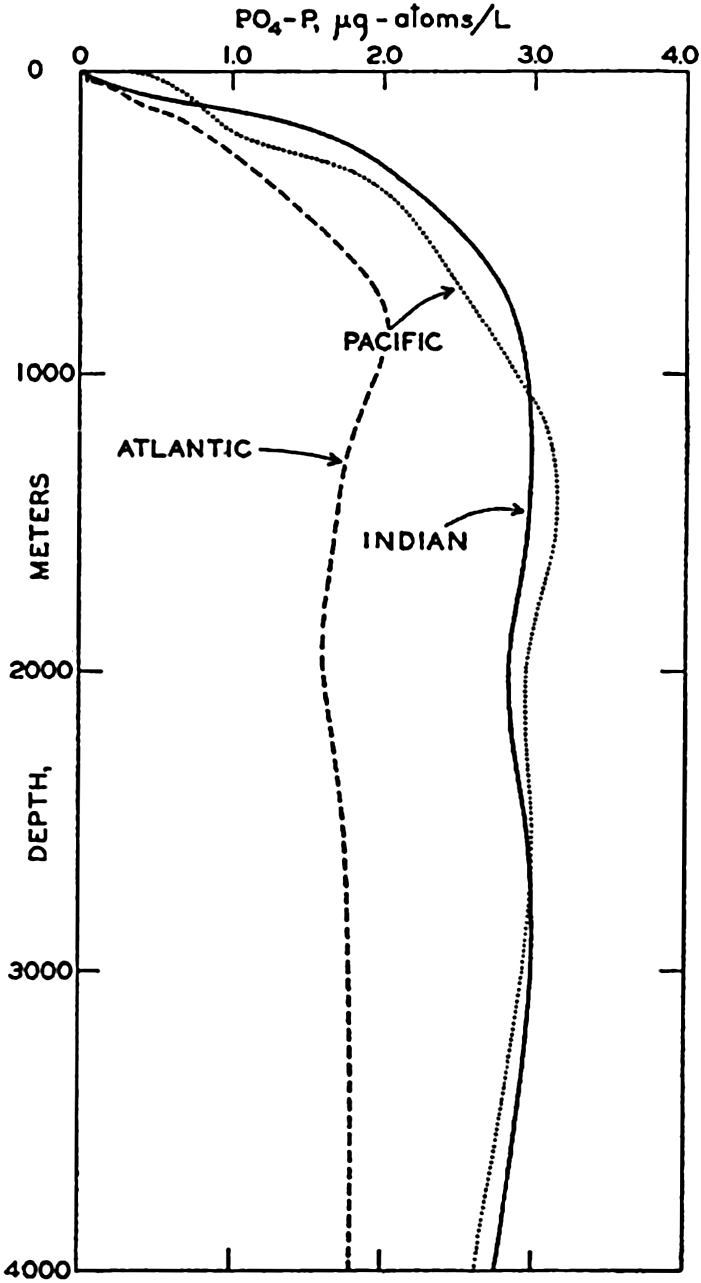
Vertical distribution of phosphate in the Atlantic, Pacific, and Indian Oceans based on data from the stations shown in fig. 44.
The lack of nitrate observations from many parts of the sea makes it impossible to prepare sections comparable to those for phosphate. Considerable data have been collected by the Dana (Thomsen, 1931, 1937), the Discovery (Discovery Reports, 1932; Deacon, 1933), the
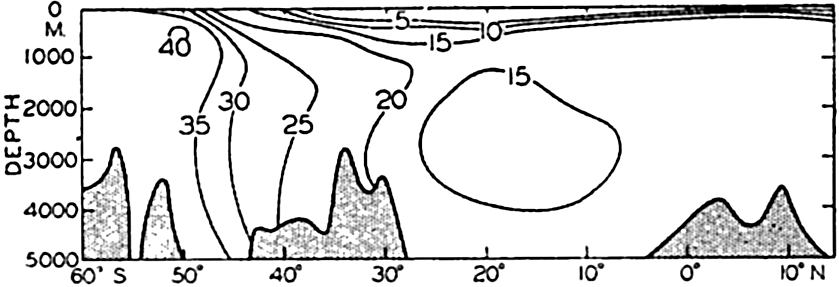
Distribution of nitrate in a longitudinal section in the central Atlantic Ocean. Units: μg-atoms of nitrogen per 20° liter.
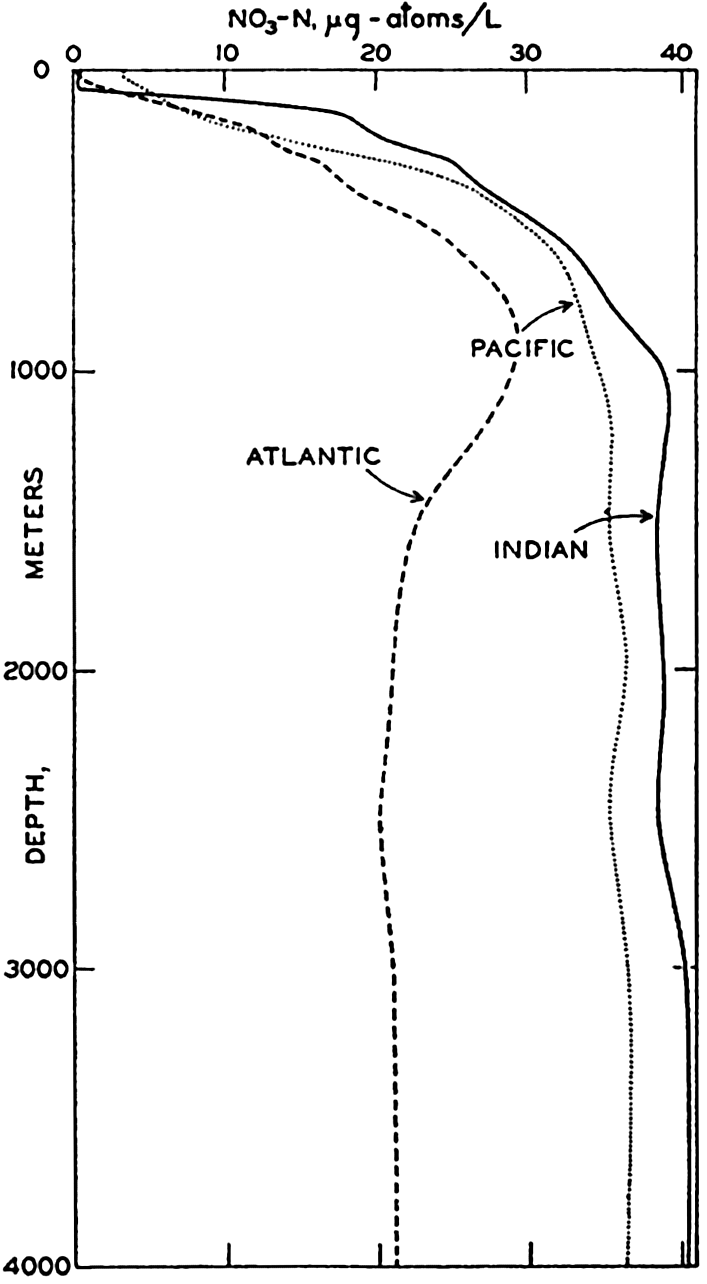
Vertical distribution of nitrate in the Atlantic, Pacific, and Indian Oceans based on data from the stations shown in fig. 44.
Curves for the nitrate distribution in the three oceans based on observations of the Dana and Atlantis and comparable to those shown for phosphate are given in fig. 50. Too much emphasis should not be placed upon the absolute values, but the curves clearly demonstrate the characteristic features of the vertical distribution
It has repeatedly been emphasized that there is a close parallelism between the concentrations of nitrate and phosphate. This relationship has been demonstrated by plotting against each other in fig. 51 the average data for phosphate and nitrate presented in figs. 48 and 50. It is immediately seen that there is a good linear relationship between the two substances. The straight line represents the “normal” ratio of nitrogen to phosphorus of 15:1 atoms proposed by Cooper (1938a). Because of this relationship, it is possible to predict with a fair degree of accuracy the concentration of either nitrate or phosphate when either one is known, and, as pointed out previously (p. 237), a relationship exists between the concentrations of these elements and the oxygen depletion.
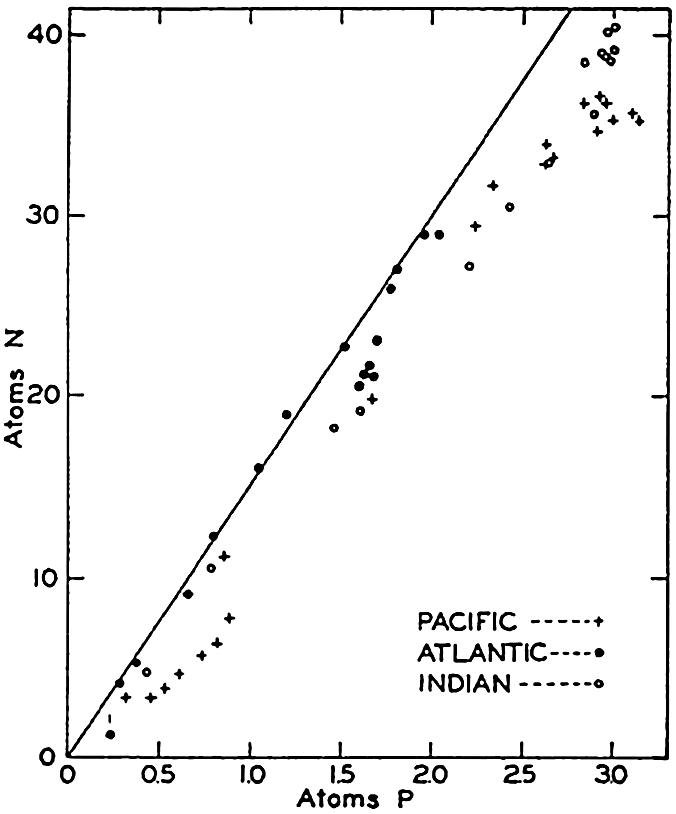
Relation between phosphate and nitrate in the three oceans. Points represent averages for individual depths used in constructing figs. 48 and 50. Straight line represents “normal” ratio proposed by Cooper.
The ranges in the various inorganic forms of nitrogen have been given (p. 181) as

The nitrate is the most abundant form of inorganic nitrogen, and, as shown in fig. 51, the low values occur at and near the surface, the high values in deeper water. The distribution of nitrite and ammonia, which are always in low concentrations, differs from that of nitrate in that the higher values occur in or above the thermocline. Nitrite may also be found near the bottom in shallow water, but it is generally absent from most of the water column. The ammonia content of the deeper waters is relatively uniform and low. Data given by Rakestraw (1936) and by Redfield and Keys (1938) indicate that in deep water, away from shore, the amounts of these substances are small. At one station, half way between Cape Cod and Bermuda, the nitrite was found only at about
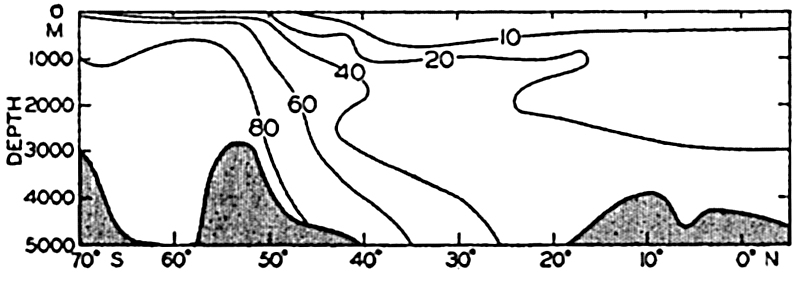
Distribution of silicate in a longitudinal section in the southeastern Atlantic Ocean. Units: μg-atoms of silicon per 20° liter.
The data available on the distribution of silicate in the oceans are even fewer than those for nitrate. The Discovery (Clowes, 1938) has made numerous observations in southern latitudes, and certain of these data have been used in preparing longitudinal sections in the South Atlantic (fig. 52) and in the Indian Ocean (fig. 54). The locations of these sections are shown in fig. 44. The Carnegie obtained numerous observations in the northeastern and central Pacific and there are scattered observations from other regions, but they are inadequate for the preparation of longitudinal sections. In order to bring out similarities and differences in distribution, the silicate sections should be compared with the corresponding phosphate sections (figs. 47 and 53). It is readily seen that the vertical distribution of silicate differs from that of phosphate and nitrate, as there is no marked intermediate maximum and the concentration increases all the way down to the bottom. The reasons for this difference in the pattern of distribution have already been set forth (p. 237). In the Atlantic Ocean (fig. 52) the silicate content of the deeper water is much less in low latitudes than it is in the
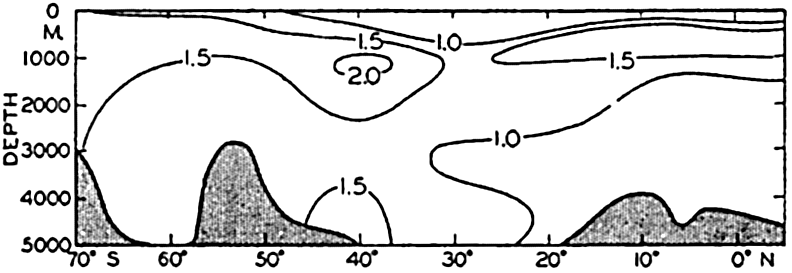
Distribution of phosphate in a longitudinal section in the southeastern Atlantic Ocean. Units: μg-atoms per 20° liter.

Distribution of silicate in a longitudinal section in the western Indian Ocean. Units: μg-atoms of silicon per 20° liter.
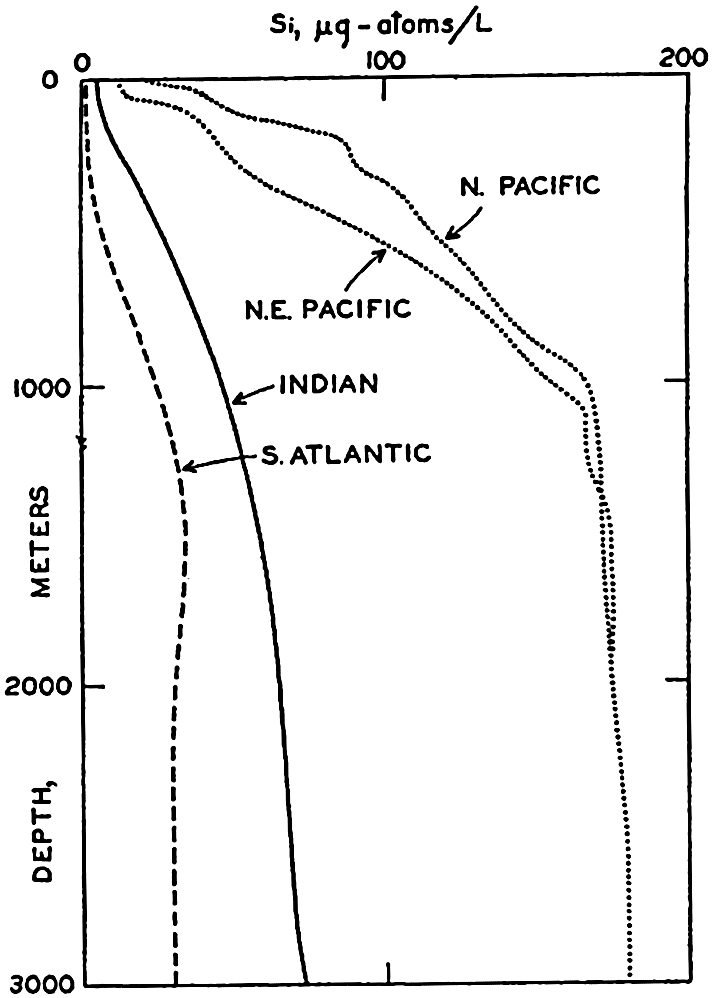
Vertical distribution of silicate at individual localities in the North Pacific, South Atlantic, and Indian Oceans.
In basins, the distributions of the elements discussed above may be quite different from those characteristic of the open sea. As shown in chapter IV, the conditions in basins depend upon the topography, the character of the renewal processes below sill depth, and the dissolved oxygen content (aeration) of the water. In well-aerated basins, where there is inflow at the surface, the nutrient content is usually low. For example, in the Mediterranean Sea the phosphate and nitrate below sill depth are small when compared with the concentrations in the waters of the Atlantic Ocean (Thomsen, 1931). In the western Mediterranean below about 1000 m the contents of phosphate and nitrate are constant in amounts of 0.6 μg-atoms/L and 11 μg-atoms/L, respectively, which are about one half or less of the amounts in the open Atlantic. The dense water that flows out of the Mediterranean over the sill and mixes with the intermediate waters of the North Atlantic is therefore relatively low in nutrient elements and tends to reduce the phosphate and nitrate contents of the waters at intermediate levels in the eastern North Atlantic.
In basins of low oxygen content, such as the Red Sea, the nitrate and phosphate are relatively high for reasons already stated (p. 237). In stagnant Norwegian fjords, where hydrogen sulphide is present in the water, Ström (1936) found the phosphate to be as high as 10 μg-atoms/L.