The Heat Budget of the Oceans
The above consideration applies to the entire system formed by the atmosphere and the oceans, but for the oceans alone we encounter an entirely different picture. On an average, the gain of heat must exactly balance the loss, but the processes involved are not limited to those of radiation, as is evident from the list at the bottom of page 101.
These processes will be discussed in detail, but it can already be stated that of the processes of heating only the first one is important, and the heat budget of the oceans as a whole can therefore be written


If a specific region is considered, it must be taken into account that heat may be brought into or out of that region by ocean currents or by processes of mixing, and that during short time intervals a certain amount of heat may be used for changing the temperature of the water. The complete equation for the heat balance of any part of the ocean in a given time interval is, therefore,

Radiation from the Sun and the Sky. The short-wave radiation that reaches the sea surface comes partly directly from the sun and partly from the sky as reflected or scattered radiation. The amount of radiation energy which is absorbed per unit volume in the sea depends upon the amount of energy that reaches the sea surface, the reflection from the sea surface, and the absorption coefficients for total energy. The incoming radiation depends mainly upon the altitude of the sun, the absorption in the atmosphere, and the cloudiness. With a clear sky and a high sun, about 85 per cent of the radiation comes directly from the sun and about 15 per cent from the sky, but with a low sun the proportion from the sky is greater, reaching about 40 per cent of the total with the sun 10 degrees above the horizon.
| Processes of Heating of the Ocean Water | Processes of Cooling of the Ocean Water |
|---|---|
|
|
The incoming energy from the sun is cut down when passing through the atmosphere, partly through absorption by water vapor and carbon dioxide in the air and partly through scattering against the air molecules or very fine dust. The total effect of absorption and scattering in the atmosphere depends upon the thickness of the air mass through which the sun's rays pass, as expressed by the equation

The sun's radiation on a horizontal surface is obtained by multiplication with sin h, where h is the sun's altitude. To this amount must be added the diffuse sky radiation in order to obtain the total radiation on a horizontal surface. Instruments are in use for recording the total radiation and for recording separately the radiation from the sun and from the sky.
When the sun is obscured by clouds, the radiation comes from the sky and the clouds and, on an average, can be represented by the formula Q = Q0(1 − 0.071 C), where the cloudiness C is given on the scale 0 to 10, and where Q0 represents the total incoming radiation with a clear sky. This formula is applicable, however, only to average conditions. If the sun shines through scattered clouds, the radiation may be greater than with a clear sky, owing to the reflection from the clouds, and on a completely overcast dark and rainy day the incoming radiation may be cut down to less than 10 per cent of that on a clear day. Table 25 contains the average monthly amounts of incoming radiation, expressed in g cal/cm2/min, which reach a horizontal surface in the indicated localities (computed from Kimball, 1928). The differences between the parts of the oceans in the same latitudes are mainly due to differences in cloudiness.
Few direct measurements of radiation are available from the oceans, and when dealing with the incoming radiation it is necessary to consider average values which can be computed from empirical formulae. Mosby (1936) has established such a formula by means of which monthly or annual mean values of the incoming radiation on a horizontal surface can be computed if the corresponding average altitude of the sun and the average cloudiness are known:

 is the average altitude of the sun. The factor k depends upon the transparency of the atmosphere and appears to vary somewhat with latitude, being 0.023 at the Equator, 0.024 in lat. 40°, and 0.027 in lat. 70°. Mosby's formula is not valid at h > 60°, but gives correct results if, at high altitudes of the sun, the true altitude is replaced by a reduced altitude as follows: The values computed by means of this formula agree within a few per cent with those derived by Kimball in an entirely different manner (table 25).
| Locality | Month | ||||||||||||
|---|---|---|---|---|---|---|---|---|---|---|---|---|---|
| Latitude | Longitude | Jan. | Feb. | Mar. | Apr. | May | June | July | Aug. | Sept. | Oct. | Nov. | Dec. |
| 60°N | 7°E- 56°W | .002 | .053 | .125 | .207 | .272 | .292 | .267 | .212 | .147 | .074 | .006 | 0 |
| 60 N | 135–170 W | .005 | .078 | .155 | .208 | .269 | .260 | .242 | .185 | .127 | .077 | .015 | 0 |
| 52 N | 10 W | .048 | .089 | .148 | .219 | .258 | .267 | .251 | .211 | .160 | .104 | .062 | .041 |
| 52 N | 129 W | .053 | .091 | .135 | .185 | .246 | .250 | .230 | .214 | .158 | .097 | .058 | .039 |
| 42 N | 66 -70W | .094 | .138 | .212 | .272 | .306 | .329 | .302 | .267 | .230 | .174 | .115 | .086 |
| 42 N | 124 W | .100 | .151 | .210 | .286 | .331 | .360 | .320 | .274 | .231 | .174 | .113 | .092 |
| 30 N | 65–77 W | .146 | .165 | .238 | .285 | .317 | .310 | .301 | .282 | .239 | .188 | .169 | .142 |
| 30 N | 128 -130 E | .141 | .153 | .199 | .241 | .258 | .238 | .256 | .260 | .219 | .178 | .153 | .135 |
| 10 N | 61–69 W | .254 | .276 | .299 | .305 | .272 | .276 | .285 | .292 | .287 | .269 | .248 | .239 |
| 10 N | 116 E- 80 W | .226 | .257 | .292 | .278 | .255 | .239 | .240 | .242 | .247 | .237 | .224 | .219 |
| 0 | 7–12 E | .239 | .248 | .244 | .230 | .210 | .196 | .188 | .194 | .220 | .240 | .239 | .235 |
| 0 | 48 W & 170 E | .261 | .265 | .282 | .297 | .309 | .300 | .300 | .340 | .366 | .362 | .339 | .278 |
| 10 S | 14 E; 36- 38 W | .329 | .328 | .301 | .254 | .219 | .206 | .232 | .278 | .312 | .324 | .317 | .320 |
| 10 S | 72 -171 E | .290 | .308 | .315 | .289 | .266 | .253 | .269 | .306 | .332 | .313 | .301 | .303 |
| 30 S | 17 and 116 E | .452 | .406 | .340 | .254 | .186 | .148 | .166 | .214 | .274 | .362 | .401 | .430 |
| 30 S | 110 W | .380 | .330 | .260 | .209 | .162 | .130 | .145 | .176 | .237 | .321 | .340 | .390 |
| 42 S | 73 W; 147 E | .343 | .297 | .223 | .154 | .104 | .085 | .092 | .135 | .187 | .264 | .310 | .348 |
| 52 S | 58 W | .289 | .237 | .167 | .112 | .062 | .039 | .049 | .097 | .150 | .222 | .273 | .302 |
| 60 S | 45 W | .213 | .171 | .105 | .056 | .011 | 0 | .003 | .054 | .111 | .156 | .204 | .221 |
| True altitude (°) | 60 | 65 | 70 | 75 | 80 | 85 | 90 |
| Reduced altitude (°) | 60 | 62 | 64 | 66 | 68 | 69 | 70 |
Part of the incoming radiation is lost by reflection from the sea surface, the loss depending upon the altitude of the sun. When computing the loss, the direct radiation from the sun and the scattered radiation from the sky must be considered separately. With the sun 90°, 60°, 30° and 10° above the horizon, the reflected amounts of the direct solar radiation are, according to Schmidt (1915), 2.0 per cent, 2.1 per cent, 6.0 per cent, and 34.8 per cent respectively. For diffuse radiation from the sky and from clouds Schmidt computes a reflection of 17 per cent. Measurements by Powell and Clarke (1936) gave values on clear days in agreement with the above, but on overcast days when all radiation reaching the sea surface was diffuse, the observed reflection was about 8 per cent. If the fractions of the total radiation from the sun and the sky on a clear day are designated p and q, respectively, and if the corresponding percentages reflected are designated m and n, the percentage of the total incoming radiation that is reflected on a clear day is r = mp + nq. Thus, on an overcast day, when all incoming radiation is diffuse, r = 8 per cent. Table 26 contains approximate values of r at different altitudes of the sun on a clear day.
| Altitude of the sun (°) | 5 | 10 | 20 | 30 | 40 | 50 | 60 | 70 | 80 | 90 |
| Percentage reflected | 40 | 25 | 12 | 6 | 4 | 3 | 3 | 3 | 3 | 3 |
The values in the table are applicable only if the sea surface is smooth. In the presence of waves the reflection loss at a low sun is somewhat increased and will be of particular importance in high latitudes. The amount of radiation which under stated conditions penetrates the sea surface is obtained by subtracting the reflection loss from the total incoming radiation.
Absorption of Radiation Energy in the Sea. The radiation that penetrates the surface is absorbed in the sea water. The amounts absorbed within given layers of water can be derived by measuring with
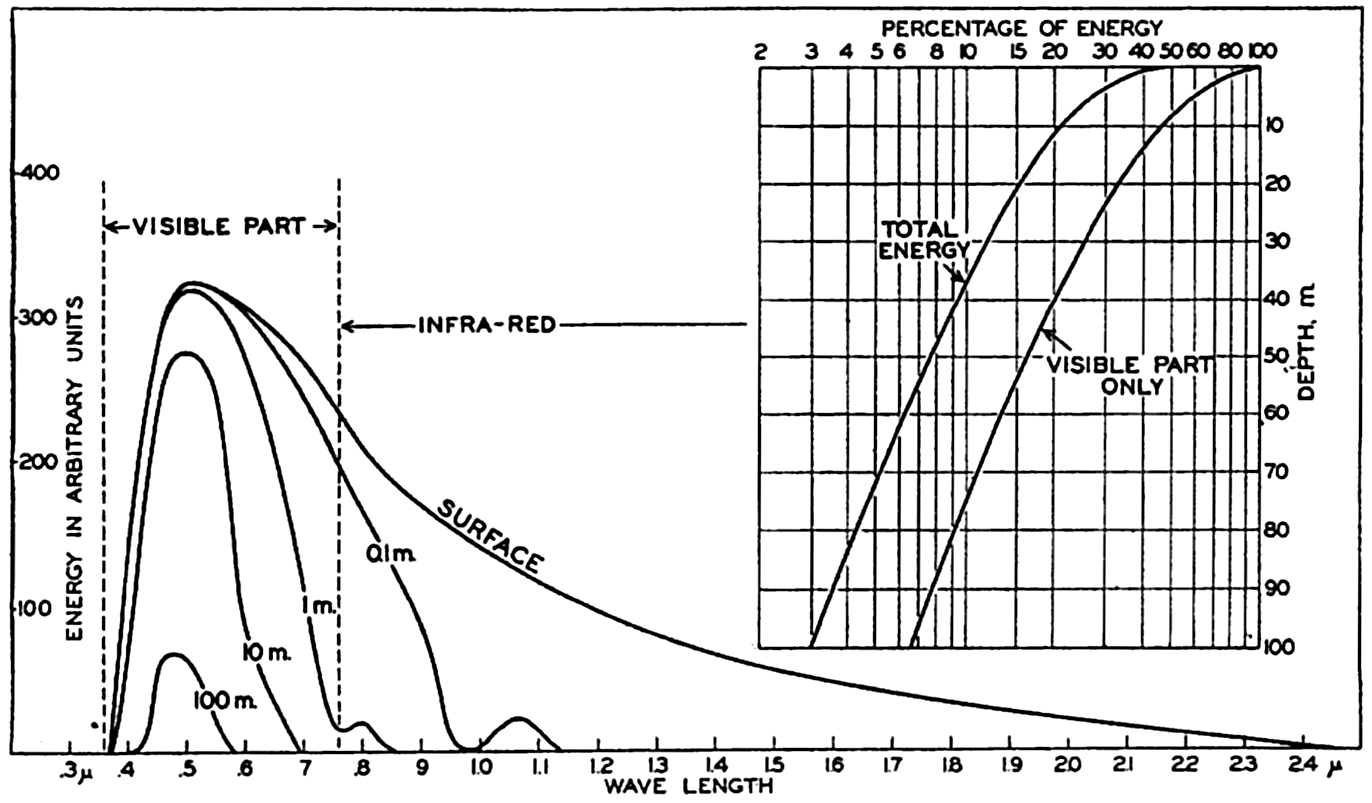
Schematic representation of the energy spectrum of the radiation from the sun and the sky which penetrates the sea surface, and of the energy spectra in pure water at depths of 0.1, 1, 10, and 100 m. Inset: Percentages of total energy and of energy in the visible part of the spectrum reaching different depths.
The spectrum of the energy that penetrates the sea surface is represented approximately by the upper curve in fig. 21, which also shows the energy spectra at different depths in pure water. The total energy at any given depth is proportional to the area enclosed between the base line and the curves showing the energy spectrum. In the inserted diagram the total energy, expressed as percentage of the energy penetrating the surface, as well as the corresponding percentages of the energy in the visible part of the spectrum, is plotted against depth. The figure shows that pure water is transparent for visible radiation only.
For sea water the percentage of the total energy reaching various depths has been computed for the clearest oceanic water, for average
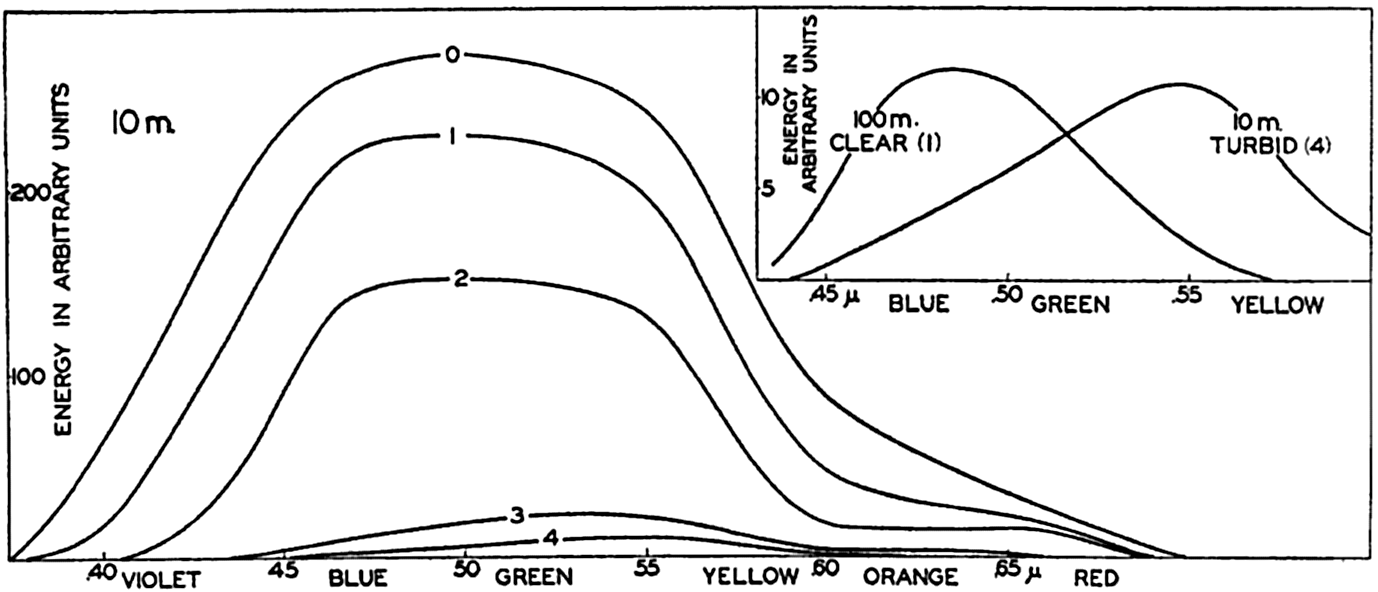
Energy spectra at a depth of 10 m in different types of water. Curves marked 0, 1, 2, 3, and 4 represent energy spectra in pure water, clear oceanic, average oceanic, average coastal, and turbid coastal sea water, respectively. Inset: Energy spectra at a depth of 100 m in clear oceanic water and at 10 m in turbid coastal water.
The absorption of energy is illustrated in fig. 22, which shows the energy spectra in different types of water at a depth of 10 m. At this depth the maximum energy in the clearest water is found in the blue-green portion of the spectrum, whereas in the turbid coastal water the maximum has been displaced toward the greenish-yellow part. This displacement is further illustrated by the inserted curve in the upper right-hand corner of the figure, which shows the energy spectra at 100 m in the clearest water and at 10 m in the most turbid water.
Extinction coefficients of total energy have been computed and are entered in table 27. These extinction coefficients are very high in the upper 1 m but decrease rapidly, at greater depth approaching the minimum extinction coefficients characteristic of the types of water dealt with. The smallest values given in the table can be considered valid at greater depths as well.
| Percentage amounts of incident energy | Extinction coefficients per meter | ||||||||||
|---|---|---|---|---|---|---|---|---|---|---|---|
| Depth | Pure sea water | Oceanic water | Coastal water | Interval of depth (m) | Pure sea water | Oceanic water | Coastal water | ||||
| Clearest | Average | Average | Turbid | Clearest | Average | Average | Turbid | ||||
| 0 | 100 | 100 | 100 | 100 | 100 | 0–1 | .944 | .975 | 1.080 | 1.318 | 1.385 |
| 1 | 38.9 | 37.7 | 35.2 | 26.7 | 22.8 | 1–2 | .143 | .176 | .230 | .450 | .547 |
| 2 | 33.7 | 31.6 | 28.0 | 17.0 | 13.2 | 2–5 | .062 | .095 | .159 | .351 | .452 |
| 5 | 28.0 | 23.7 | 17.3 | 5.95 | 3.41 | 5–10 | .048 | .076 | .120 | .318 | .405 |
| 10 | 22.0 | 16.1 | 9.50 | 1.21 | 0.449 | 10–20 | .033 | .054 | .094 | .292 | .368 |
| 20 | 15.8 | 9.35 | 3.72 | 0.064 | 0.012 | 20–50 | .024 | .042 | .083 | ||
| 50 | 7.64 | 2.69 | 0.311 | 50–100 | .018 | .036 | |||||
| 100 | 3.04 | 0.452 | 0.0057 | ||||||||
In fig. 23 the curves marked 0, 1, 2, 3, and 4 represent the percentage amounts of energy which reach different levels between the surface and 10 m, according to the data in table 27. The three curves marked Capri, Trieste, and Venice represent results of measurements in the Mediterranean according to Vercelli (1937), and four other curves represent observed values in lakes according to Birge and Juday (1929). The agreement of the character of the curves indicates that reliable values as to the absorption of energy in the sea can be obtained by means of computations based on observed extinction coefficients.
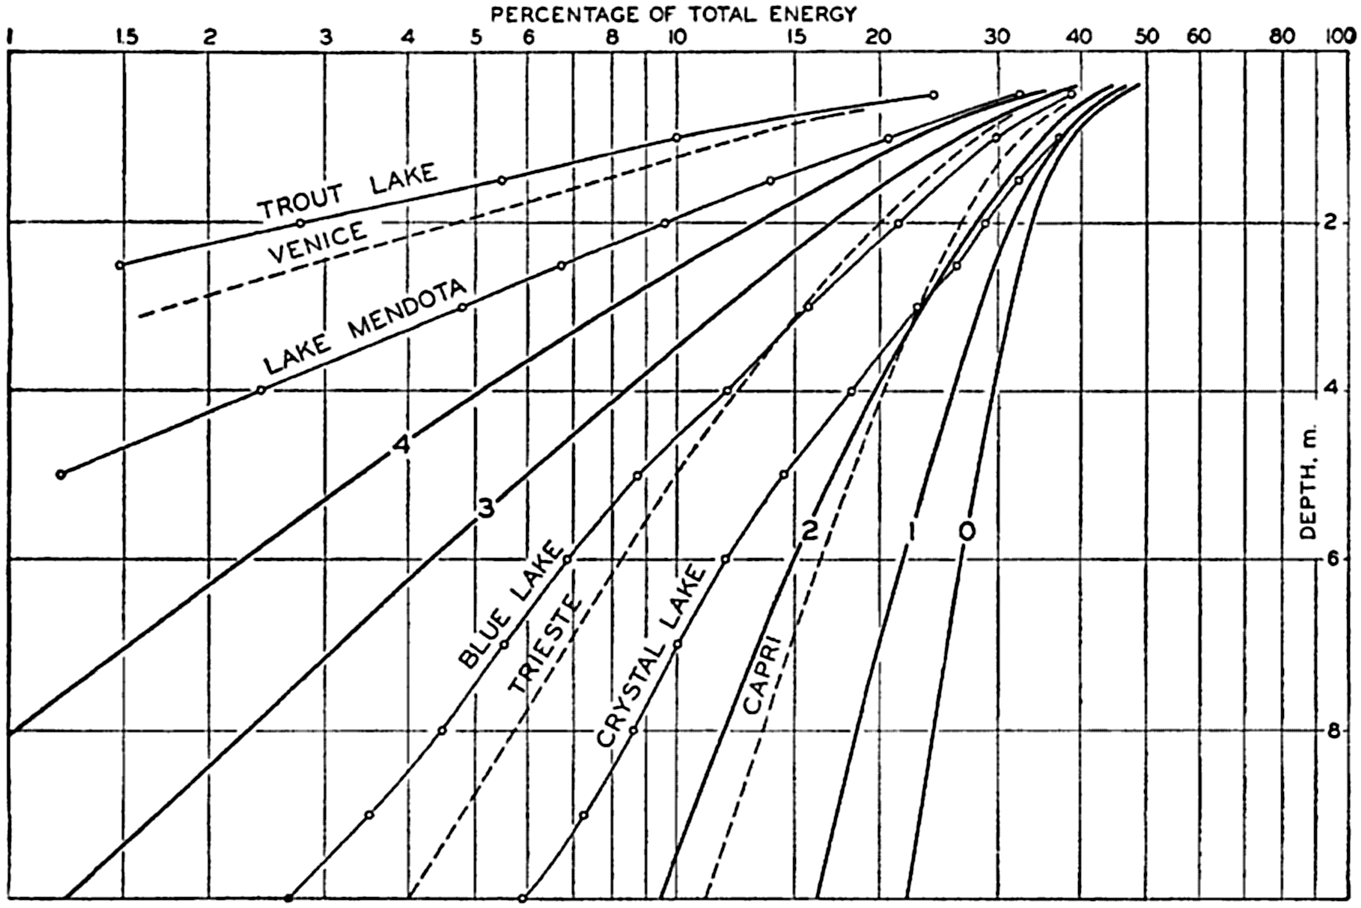
Percentages of total energy reaching different depths in pure water, clear oceanic, average oceanic, average coastal, and turbid coastal sea water (curves 0, 1, 2, 3, and 4), computed from extinction coefficients, and corresponding directly to observed values in four lakes and at three localities in the Mediterranean.
An idea of the heating due to absorption of radiation can be secured by computing the increase of temperature at different depths which results from a penetration of 1000 g cal/cm2 through the surface. The results are shown in table 28, which serves to emphasize that the greater part of the energy is absorbed near the surface, particularly in turbid water. If no other processes took place, the temperature between the surface and 1 m would increase in the clearest water by 6.24°, and in the most turbid water by 7.72°. Between 20 and 21 m the corresponding values would be 0.04° and 0.0003°.
The temperature changes recorded in table 28 show no similarity to those actually occurring in the open oceans, where processes of mixing entirely mask the direct effect of absorption, but in some small, landlocked
| Interval of depth (m) | Oceanic water | Coastal water | ||
|---|---|---|---|---|
| Clearest | Average | Average | Turbid | |
| 0–1 | 6.24 | 6.48 | 7.32 | 7.72 |
| 1–2 | 0.610 | 0.720 | 0.970 | 0.960 |
| 5–6 | .236 | .282 | .164 | .120 |
| 10–11 | .104 | .096 | .030 | .0140 |
| 20–21 | .040 | .030 | .0016 | .0003 |
| 50–51 | .0096 | .0024 | .0534 | .0715 |
| 100–101 | .0016 | .0411 | ||
Fig. 24 shows the vertical distribution of temperature on June 30 and July 15 in a basin that was examined by Gaarder and Spärck. The days in the period between the stated dates were clear and no rain fell. According to Kimball (1928) the diurnal amount of incoming short-wave radiation was about 740 g cal/cm2/day, or about 11,100 g cal/cm2 for
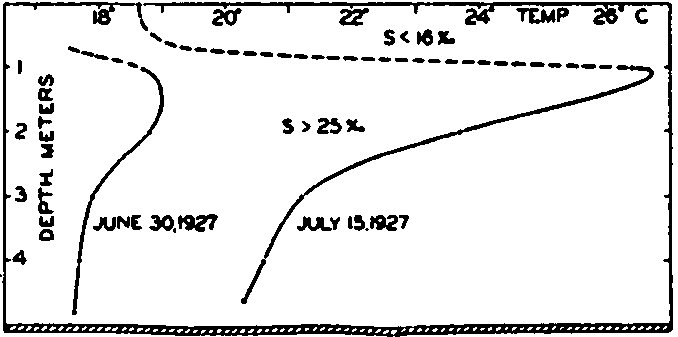
Vertical distribution of temperature in a Norwegian oyster basin on June 30 and July 15, 1927.
Conduction of Heat Through the Ocean Bottom. It has been estimated that the flow of heat through the bottom of the sea amounts to between 50 and 80 g cal/cm2/year (Helland-Hansen, 1930). This amount represents less than one ten-thousandth part of the radiation received at the surface and can generally be neglected when dealing with the heat budget of the oceans. In a few basins, where the deep water is nearly stagnant and where no conduction of heat takes place from above or from the sides, the amount of heat conducted through the bottom may conceivably play a part in determining the distribution of temperature, but so far no such case is known with certainty (p. 739).
Transformation of Kinetic Energy into Heat. The kinetic energy transmitted to the sea by the stress of the wind on the surface and by part of the tidal energy is dissipated by friction and transformed into heat. The energy transmitted by the wind can be estimated at about one ten-thousandth part of the radiation received at the surface and can be neglected. In shallow coastal waters with strong tidal currents the dissipation of tidal energy is so great, however, that it may become of some local importance. Thus, in the Irish Channel, according to Taylor (1919), the dissipation amounts to about 0.002 g cal/cm2/min, or 1050 g cal/cm2/year. The average depth can be taken as about 50 mn, or 5000 cm, and, if the same water remained in the Irish Channel a full year,
Heating due to chemical processes can be completely disregarded.
The convection of sensible heat and the condensation of water vapor will be dealt with in the discussion concerning the exchange of heat and water with the atmosphere.
Effective Back Radiation from the Sea Surface. The sea surface emits long-wave heat radiation, radiating nearly like a black body, the energy of the outgoing radiation being proportional to the fourth power of the absolute temperature of the surface. At the same time the sea surface receives long-wave radiation from the atmosphere, mainly from the water vapor. A small part of this incoming long-wave radiation is reflected from the sea surface, but the greater portion is absorbed in a small fraction of a centimeter of water, because the absorption coefficients are enormous at long wave lengths. The effective back radiation from the sea surface is represented by the difference between the “temperature radiation” of the surface and the long-wave radiation from the atmosphere, and this effective radiation depends mainly upon the temperature of the sea surface and the water-vapor content of the atmosphere. According to Ångström (1920), the latter is proportional to the local vapor pressure, which can be computed from the relative humidity if the air temperature is known. Over the oceans the air temperature deviates so little from the sea-surface temperature that the vapor pressure can be obtained with sufficient accuracy from the sea-surface temperature and the relative humidity of the air at a short distance above the surface.
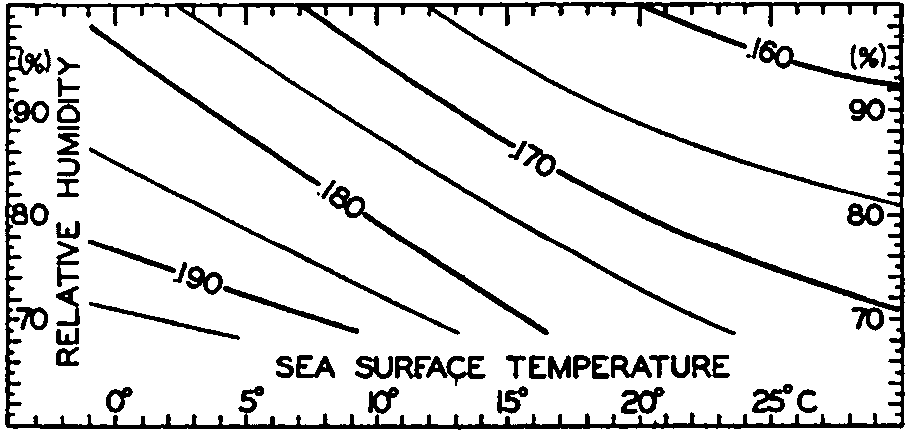
Effective back radiation in gm cal/cm2/min from the sea surface to a clear sky. Represented as a function of sea-surface temperature and relative humidity of the air at a height of a few meters.
Ångström (1920) has published a table that summarizes results of observations of effective radiation against a clear sky from a black body of different temperatures and at different vapor pressures. Fig. 25 has been prepared by means of this table, taking into account the small difference between the radiation of a black body and that of a water surface. The figure shows the effective radiation as a function of sea-surface temperature and of relative humidities between 100 per cent and 70 per cent, but the values that can be read off from the graph may be 10 per cent in error, owing to the scanty information upon which the curves are based. It brings out the interesting fact, however, that, owing to the increased radiation from the atmosphere at higher temperatures (higher vapor pressures), the effective back radiation decreases slowly with increasing temperature. At a temperature of 0°C and a relative humidity of 80 per cent, the effective back radiation is 0.188 g cal/cm2/min, and at a temperature of 25° and the same relative humidity it is 0.167 g cal/cm2/min. At a given temperature the effective radiation decreases with increasing humidity, owing to the increased back radiation from the atmosphere. Thus, at a surface temperature of 15° the effective radiation is about 0.180 g cal/cm2/min at a relative humidity of 70 percent, and about 0.163 g cal/cm2/min at a relative humidity of 100 percent.
The values of the effective back radiation at higher temperatures, as obtained by extrapolation of Ångström's data (fig. 25) are greater than those computed from Brunt#x0027;s empirical formula,

The diurnal and annual variations of the sea-surface temperatures and of the relative humidity of the air over the oceans are small, and the effective back radiation at a clear sky is therefore nearly independent of the time of the day and of the season of the year, in contrast to the incoming short-wave radiation from the sun and the sky, which is subjected to very large diurnal and seasonal variations.
In the presence of clouds the effective back radiation is cut down because the radiation from the atmosphere is increased. The empirical relation can be written

The annual incoming short-wave radiation from the sun and the sky is greater in all latitudes than the outgoing effective back radiation. According to Mosby (1936) the average annual surplus of incoming radiation between latitudes 0 and 10°N is about 0.170 g cal/cm2/min, and between 60° and 70°N about 0.040 g cal/cm2/min. The surplus of radiation must be given off to the atmosphere, and the exchange of heat and water vapor with the atmosphere is therefore equally as important as the processes of radiation in regulating the ocean temperatures and salinities.
The characteristics of the oceans in respect to radiation are very favorable to man. The water surface reflects only a small fraction of the incoming radiation, and the greater part of the radiation energy is absorbed in the water, distributed by processes of mixing over a layer of considerable thickness, and given off to the atmosphere during periods when the air is colder than the sea surface. The oceans therefore exercise a thermostatic control on climate. Conditions are completely changed, however, if the temperature of the sea surface decreases to the freezing point so that further loss of heat from the sea leads to formation of ice, because, when water passes this critical temperature, its thermostatic characteristics are altered in a very unfavorable direction. Sea ice, which soon attains a gray-white appearance owing to enclosed air bubbles, reflects 50 per cent or more of the incoming radiation, and if it is covered by rime or snow the reflection loss increases to 65 per cent, or even to 80 per cent from fresh, dry snow. The snow surface, on the other hand, radiates nearly like a black body, and consequently the heat budget related to processes of radiation, instead of rendering a surplus as it does over the open ocean, shows a deficit until the temperature of the ice surface has been lowered so much that the decreased loss by effective back radiation balances the small fraction of the incoming radiation that is absorbed. The immediate result of freezing is therefore a general lowering of the surface temperature of the ice and a rapid increase of the thickness of the ice. The air that comes in contact with the ice is cooled, and, as this cold air spreads, more ice is formed. Thus, a small lowering of the temperature of the water in high latitudes followed by freezing may lead to a rapid drop of the air temperature and
Exchange of Heat between the Atmosphere and the Sea. The amount of heat that in unit time is carried away from the sea surface through a unit area is equal to

Detailed and accurate temperature measurements in the lowest meters of air over the ocean have not yet been made, because the hull and masts of a vessel disturb the normal distribution of temperature to such an extent that values observed at different levels on board a vessel are not representative of the undisturbed conditions. The few measurements that have been attempted indicate, however, that the general distribution as outlined above is encountered.
The sea surface must be warmer than the air at a small distance above the surface if heat is to be conducted from the sea to the air. When such conditions prevail, the air is heated from below, the stratification of the air becomes unstable, and the turbulence of the air becomes intense (p. 92). If the sea surface is very much warmer than the air, as may be
It has been found (p. 128) that on an average the sea surface is slightly warmer than the overlying air and therefore loses heat by conduction. So far, no detailed studies have been made, but Ångström has estimated that only about 10 per cent of the total heat surplus is given off to the atmosphere by conduction and that 90 per cent is used for evaporation. Other estimates indicate that these figures are approximately correct (p. 117). Thus, evaporation is of much greater importance to the heat balance of the oceans than is the transfer of sensible heat. Evaporation will therefore be dealt with in greater detail.