The Antarctic Circumpolar Ocean
Boundaries and General Characteristics of Water Masses. It is difficult to assign a northern boundary to the Antarctic Ocean because it is in open communication with the three major oceans: the Atlantic, the Indian, and the Pacific Oceans. In some instances the antarctic waters are dealt with as parts of the adjacent oceans and are designated the Atlantic Antarctic Ocean, or the Indian or Pacific Antarctic Ocean, whereas in other instances the antarctic waters must be considered an integral part of all oceans. The latter case, for instance, applies when dealing with the deep-water circulation, which is of such a nature that the intercommunication between different regions must be taken into account. The antarctic waters, on the other hand, can be discussed without entering upon details of the conditions in neighboring oceans, in which case one has to establish oceanographic boundaries between the Antactic Ocean and the neighboring areas.
On the basis of observations of surface temperatures only, it is possible to divide the Antarctic Ocean into two separate regions and to establish its approximate northern boundary. Near the Antarctic Continent the surface temperature is low, but with increasing distance from the coasts it increases slowly until a region is reached within which an increase of two or three degrees takes place in a very short distance.
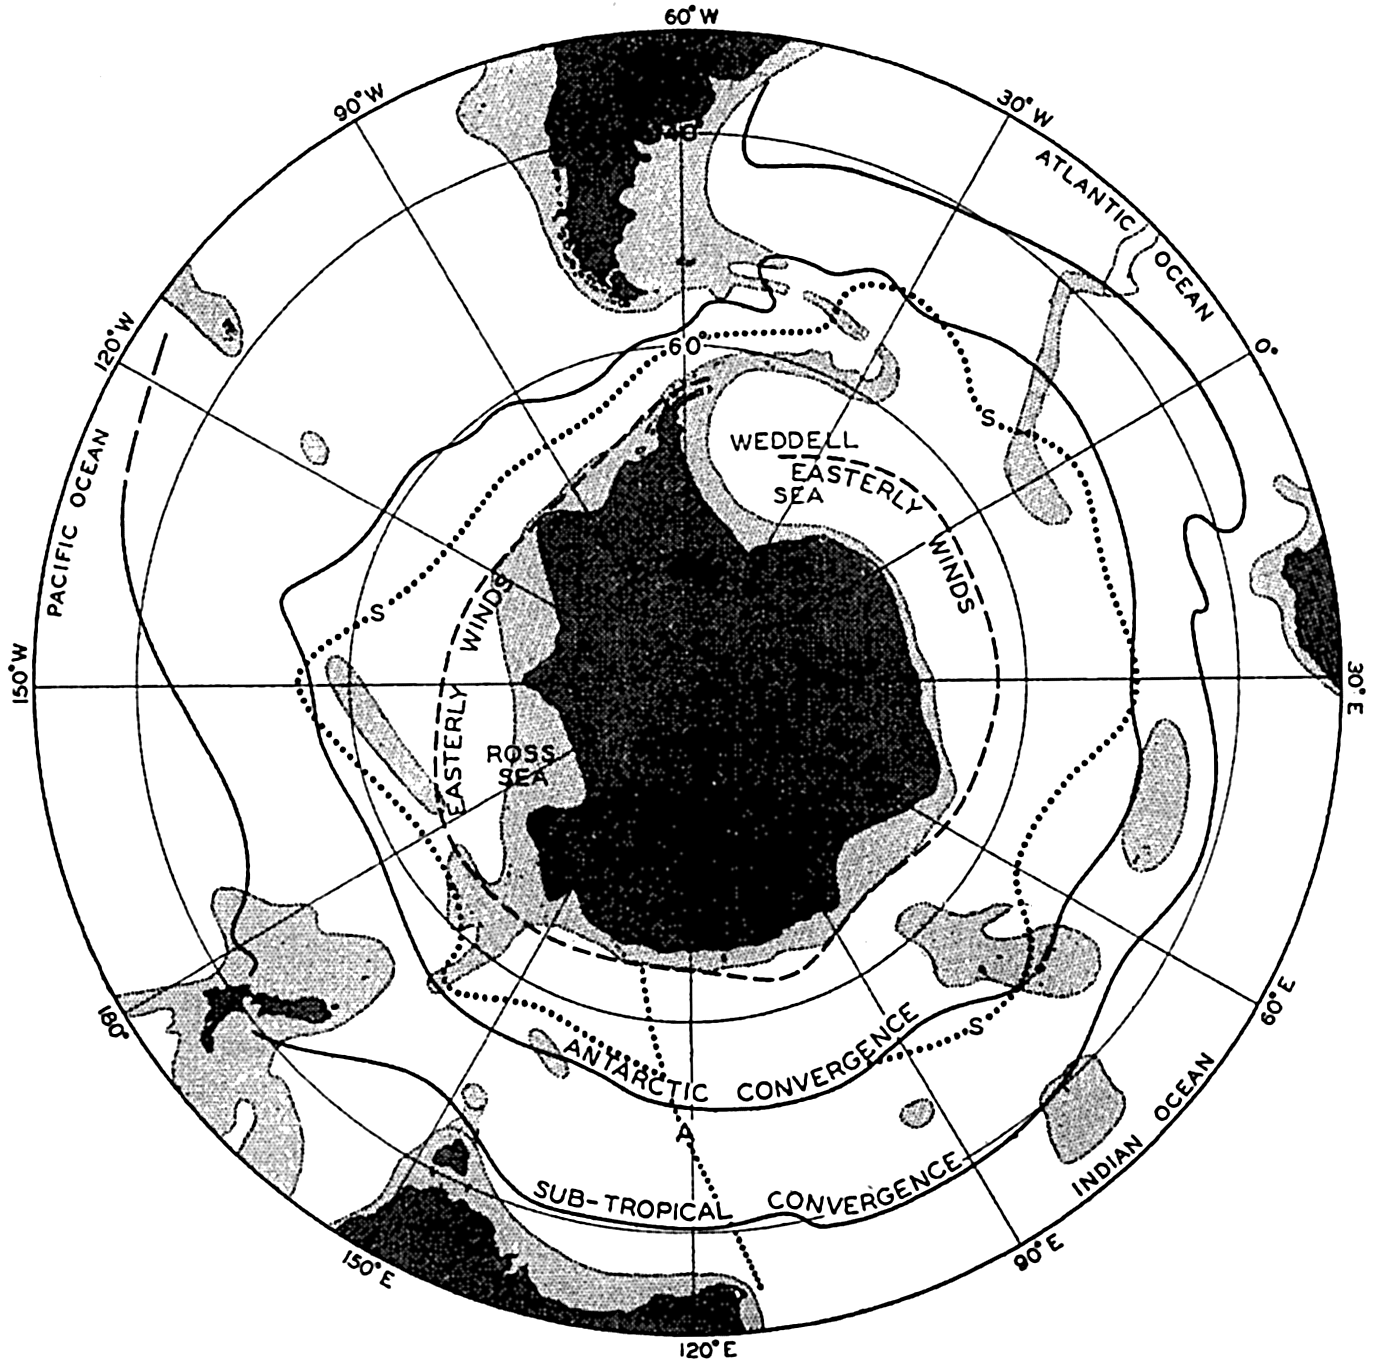
Locations of the Antarctic and Subtropical Convergences. Locations of the vertical sections shown in figures 159 and 160, and limit between westerly and easterly winds (dashed line). Light shading: depths less than 3000 m.
Figure 158 shows the location of the two convergences according to the results of the Discovery Expedition (Deacon, 1937a). The location of the Antarctic Convergence is, in part, dependent upon the distribution of land and sea and upon the bottom topography. The southward displacement of the Antarctic Convergence to the south of Australia and New Zealand can probably be ascribed to the relative narrowness of the passage between these regions and Antarctica, and the similar displacement off South America can be attributed to the southerly location of Drake's Passage separating South America from Graham Land. The bends of the Antarctic Convergence are to a great extent related to the bottom topography. On the western side of the submarine ridges, the more conspicuous of which are indicated in the figure by the 3000-m contour, the convergence is deflected to the north, and on the eastern side to the south. The reason for this relation to the bottom topography was explained when dealing with the currents (p. 466).
The location of the Subtropical Convergence is similarly related to the distribution of land and sea, but appears to be less dependent upon the bottom configuration. It is less well defined than the Antarctic Convergence, and instead of referring to a line of convergence it is, according to Defant (1938) more correct to refer to a region of convergence.
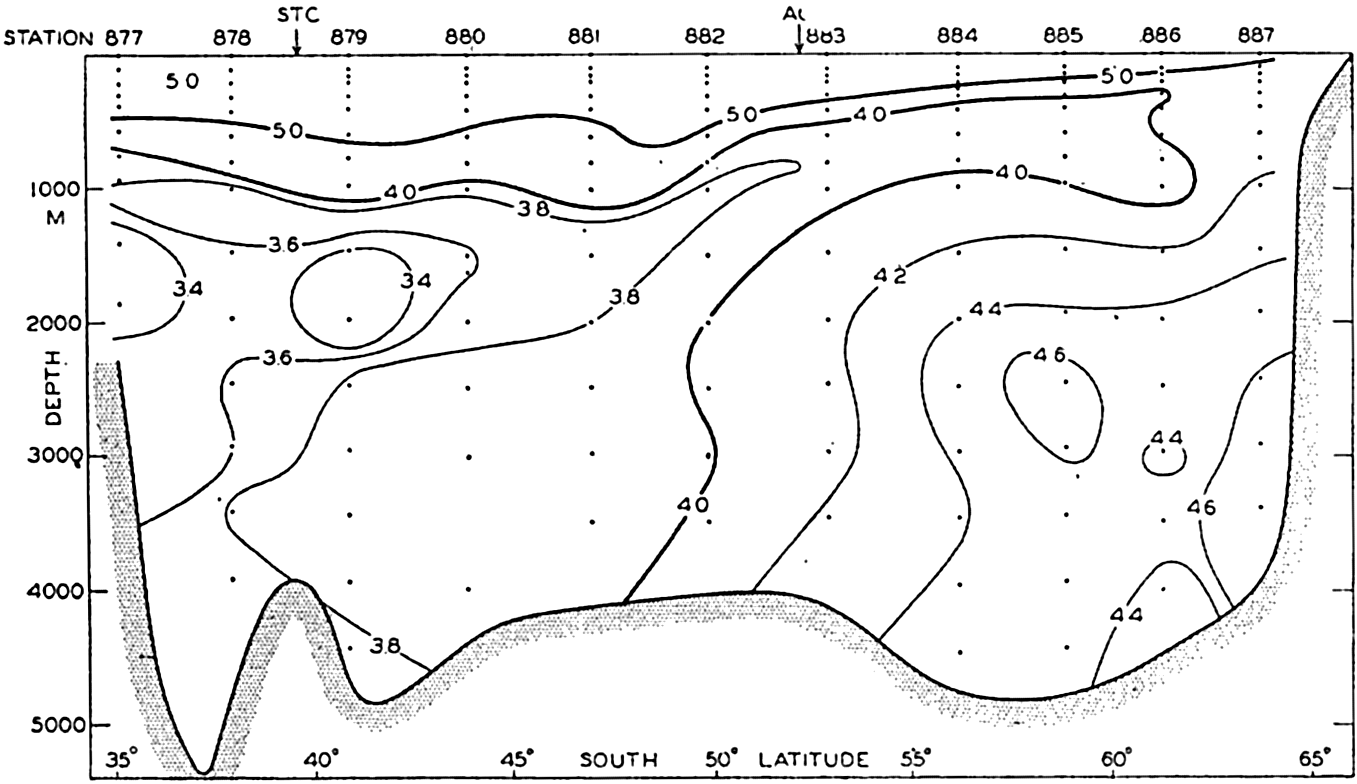
Within the antarctic and subantarctic regions the water masses can be classified according to their temperature-salinity characteristics (p. 141). Such a classification is here conveniently based on a study of the distribution of temperature and salinity in a vertical section running at right angles to the Antarctic Continent. Figure 159 is taken from Deacon's discussion (1937a) and shows the distribution of temperature and salinity along a section running south-southwest from Cape Leeuwin, Western Australia, to the ice edge south of Australia in 63°41'S. The two convergences are indicated which divide the area into the antarctic and subantarctic regions. Within the antarctic region a surface layer of low temperature and low salinity is present. Below this surface layer one recognizes a transition layer which increases in thickness towards the north and within which the temperature rapidly increases to values higher than 2°) and the salinity gradually increases to values higher than 34.5 ‰. Below the transition layer one encounters the Antarctic Circumpolar Wuter, the greater mass of which has a salinity a little above 34.70 ‰ and a temperature between 2° and 0°. Water of similar characteristics is found within the subantarctic region below a depth of about 2000 m. That is, the deep water within the subantarctic region has the same characteristics as the Antarctic Circumpolar Water which rises towards the surface near the Antarctic Continent. At station 887, close to the continent, a salinity of 34.67 ‰ is met with at a depth of 200 m, but at station 879 south of the Subtropical Convergence the
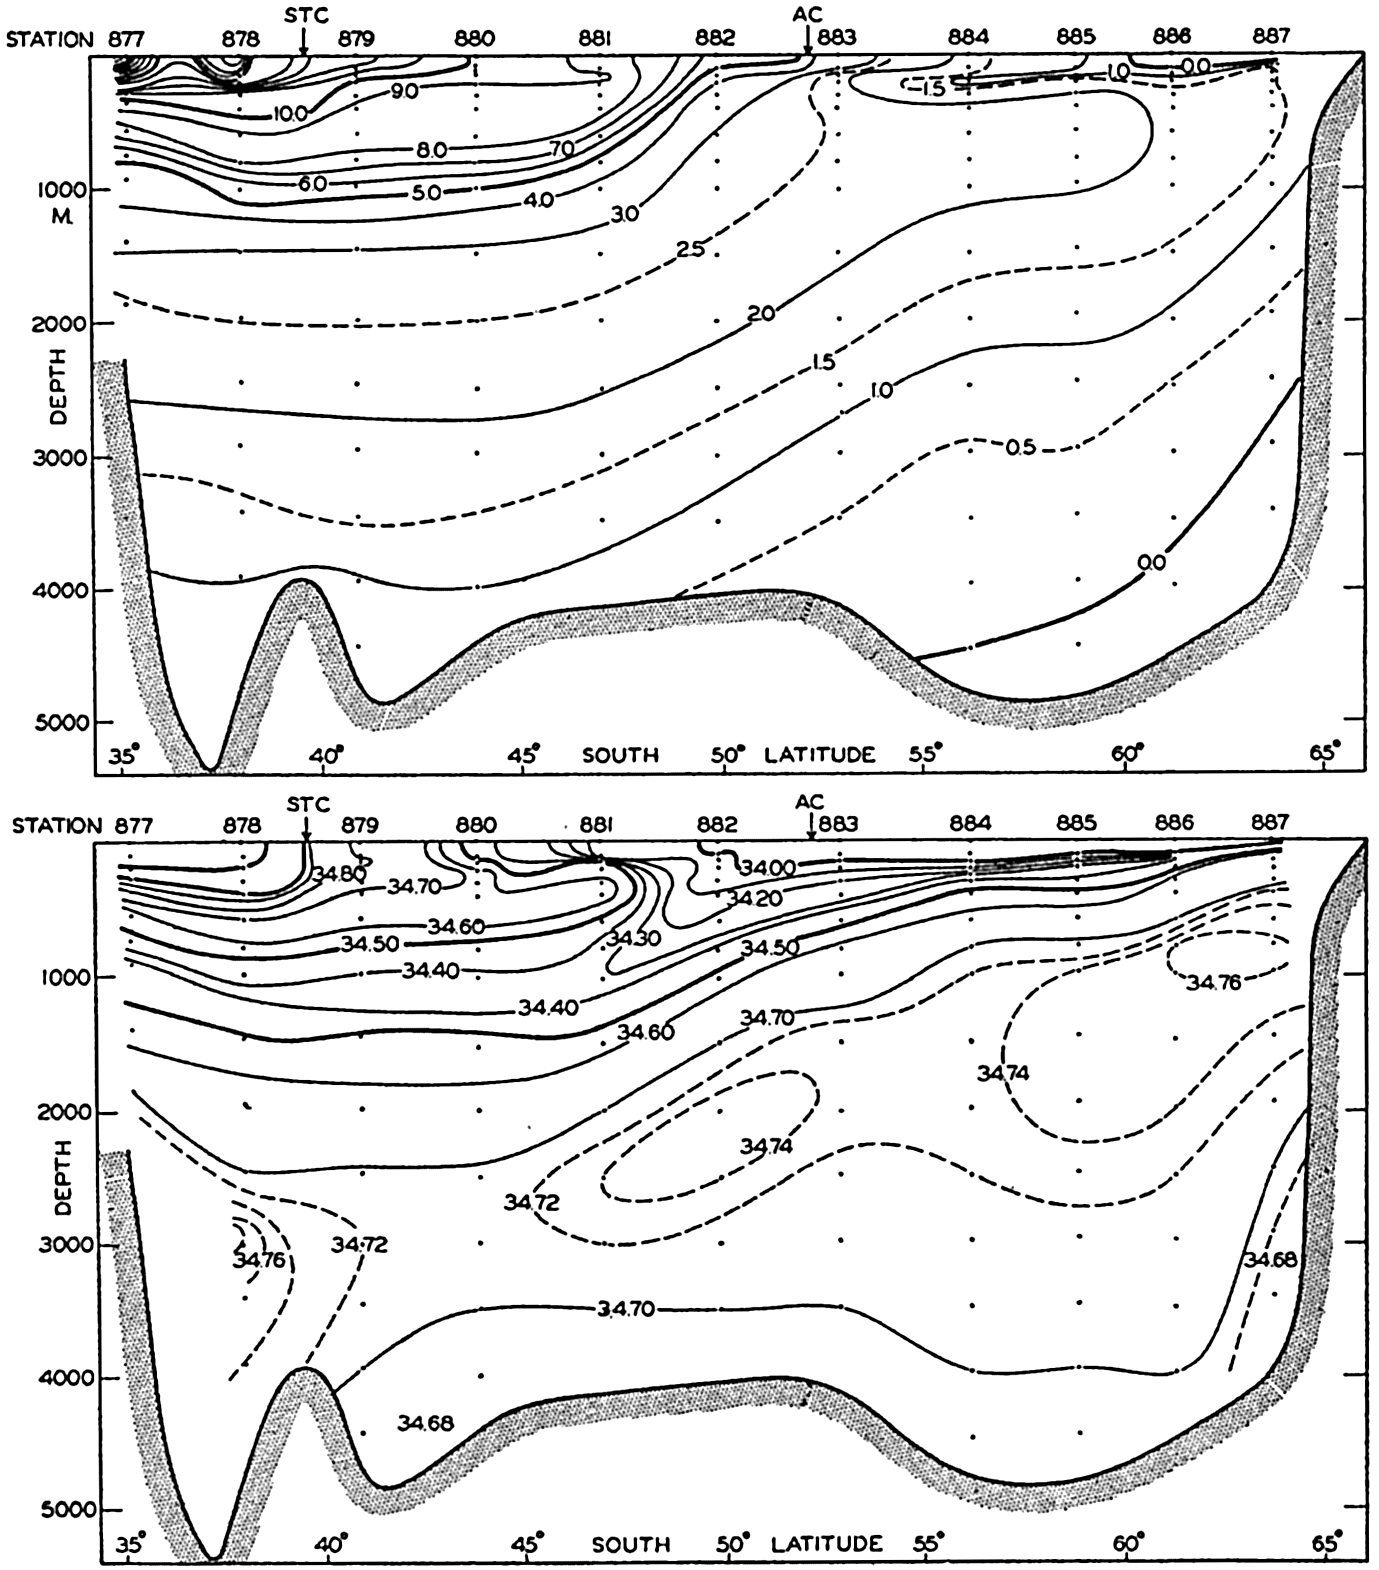
Distribution of temperature and salinity in a vertical section from Cape Leeuwin, Australia, to the Antarctic Continent (after Deacon). Location of section shown by line A in fig. 158.
Within the subantarctic region one can conveniently distinguish between two water masses above the deep water, the Subantarctic Upper Water of a uniform temperature between 8° and 9° and of a relatively high salinity, appearing in the salinity section as a tongue extending towards the south, and the Antarctic Intermediate Water of a temperature between
The Antarctic Surface Water. In winter the southern half of the antarctic region is covered by a thin layer of nearly homogeneous surface water of a thickness of 100 m or less which has a temperature about freezing point and a salinity that varies between 34.0 and 34.5 ‰, the highest value being found in the Weddell Sea. At a station occupied by the Deutschland in the Weddell Sea (lat. 65°32'S, long. 43°‰'W) on August 26, 1912 (Brennecke, 1921), a nearly homogeneous layer was found between the surface and a depth of 100 m having a temperature of −1.83° and a salinity of 34.47 ‰. With increasing distance from the Antarctic Continent the temperature rises to 0° where the Antarctic Convergence is far south, and to about 1° where this convergence is far north.
In summer the salinity at the surface is decreased owing to the melting of ice. By far the greater amount of the radiation surplus of the season is used for melting ice, but a small amount is used for raising the temperature of the water above freezing point. In the vicinity of the pack ice the surface temperature and salinity vary greatly from one locality to another, because the nearly fresh water produced by melting of ice is not immediately mixed with the surrounding or deeper water. In ice-free areas a more thorough mixing takes place, particularly where strong winds are frequent, and there a well-mixed layer may extend to depths of 55 to 85 m. The temperature of this water is a few degrees above freezing, owing to absorption of heat, but below this warmed layer colder water is found. This colder water may have been formed in situ during the preceding winter, but it is also possible that a northward flow of the colder stratum takes place (Mosby, 1934).
On the continental shelves, particularly in the Weddell Sea, the winter cooling and the increase in salinity associated with freezing of ice may extend to the bottom, leading to formation of homogeneous water which, from the surface to the bottom, may have a temperature as low as −1.95° and a salinity as high as 34.70 ‰. The importance of this cold and saline water to the formation of the bottom water will be discussed on page 611.
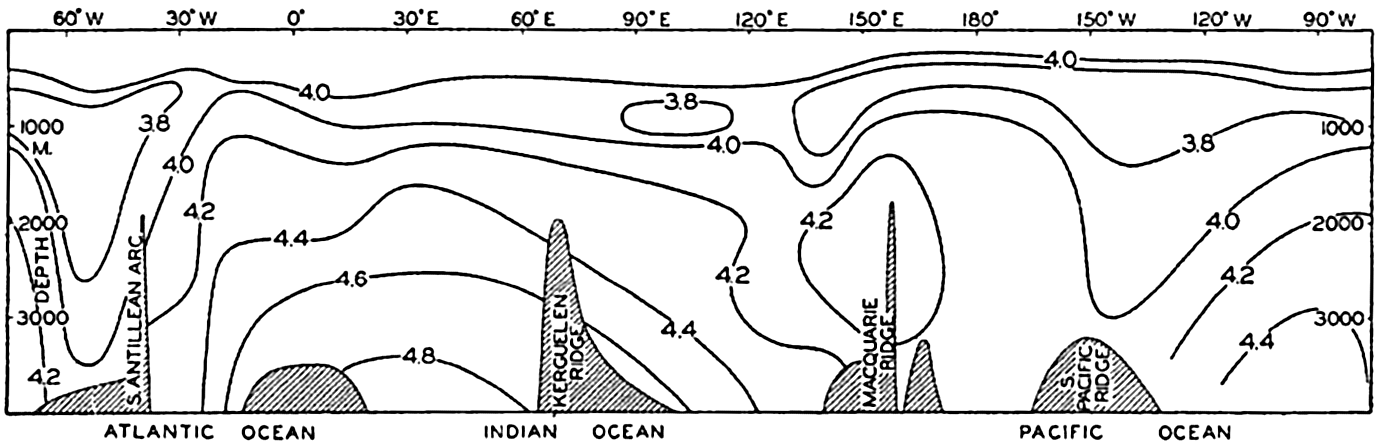
Antarctic Circumpolar Water. At a short distance below the surface water the Antarctic Circumpolar Water is encountered, which is characterized, in general, by a temperature higher than 0.5° and a salinity slightly above 34.7 ‰. Within this water the temperature generally is at a maximum at a depth of 500 to 600 m, below which it decreases slowly towards the bottom. The salinity is at a maximum at a somewhat greater depth that varies between 700 and 1300 m and below which it decreases towards the bottom. The great uniformity of this water which, all around Antarctica, has nearly the same temperature and the same salinity, is illustrated in fig. 160, which shows a vertical section around Antarctica. The section, the location of which is indicated by the line marked S in fig. 158, has been placed between two transport lines of the circumpolar current (fig. 163, p. 615) and follows therefore approximately the same water mass. Disregarding the surface water, one finds that within this enormous body of water the differences in temperature hardly exceed two degrees, and below a depth of about 800 m the differences in salinity do not exceed 0.1 ‰. It should be observed, however, that if the section had been placed closer to the Antarctic Continent the temperatures and salinities would have been lower, and if it had been placed at greater distances from the continent the temperatures and salinities would have been higher.
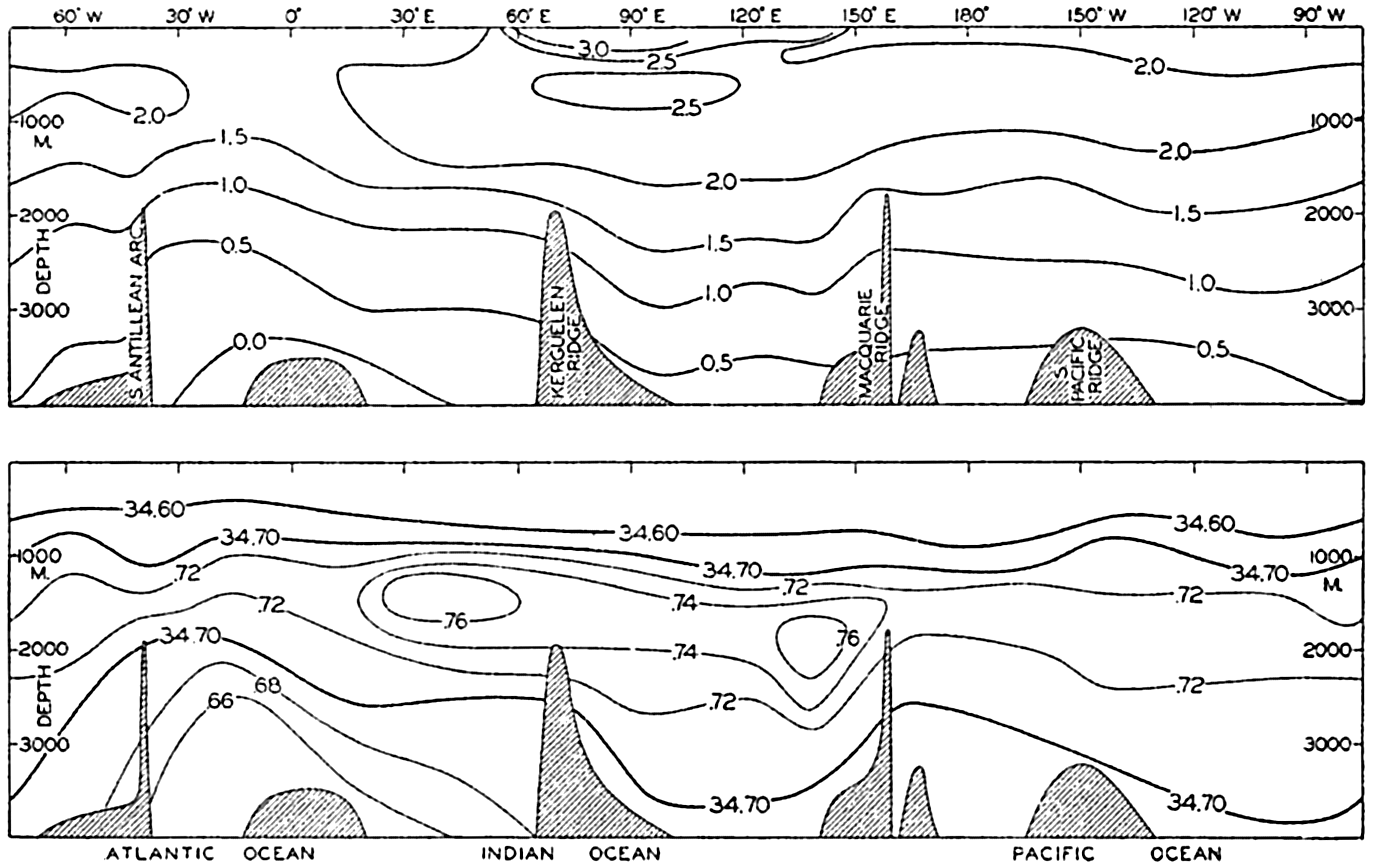
Distribution of temperature and salinity in a vertical section around the Antarctic Continent. Location of section is shown by line S in fig. 158.
The water which enters the Drake Passage from the west (left margin of section), between 1000 and 4000 m, has a salinity a little higher than
The temperature section shows that the water which enters Drake Passage from the west has maximum temperatures only slightly above 2°C and minimum temperatures near the bottom somewhat below 0.5°. Towards the east of the South Antilles Arc the cold bottom water of the Weddell Sea appears, and at higher levels the maximum temperature drops below 2°, probably owing to admixture of this cold water. In long. 10°E the maximum temperature increases and, between long. 60° and 120°E, lies above 2.5°. These high temperatures are due to admixture of relatively warm water from the Atlantic and Indian Oceans. When the water passes into the Pacific area, the maximum temperature again decreases owing to admixture of the colder Pacific Deep Water. The isotherms of 1° and 0.5° do not exactly follow the bottom topography as should be expected if the water crossed the different submarine ridges without mixing taking place, for which reason it appears necessary to assume that processes of mixing exercise some influence upon the distribution of temperature and therefore, also, upon the distribution of salinity.
The Antarctic Bottom Water. The most extreme type of bottom water is found in the Weddell Sea area, where below a depth of about 4000 m the temperature is about −0.4° and the salinity is about 34.66 ‰. This water is probably formed by the mixing in approximately equal parts of water flowing down from the continental shelf and of Antarctic Circumpolar Water (Mosby, 1934). The former has a temperature, on an average, of about −1.9° and a salinity of about 34.62 ‰, whereas the circumpolar water near the Antarctic Continent has a temperature of 0.5° and a salinity of 34.68 ‰. Expressed by means of σi, the densities of these two types of water are 27.89 and 27.84, respectively, and the density of the bottom water is 27.86. The water on the continental shelf, the salinity of which may be increased up to 34.62 ‰ or slightly
According to this explanation, first offered by Brennecke (1921) and later substantiated by Mosby (1934), the freezing of ice on the Antarctic continental shelves is of primary importance to the formation of the Antarctic Bottom Water. On a small scale, cooling of water of relatively high salinity may contribute to the formation of bottom water by a process similar to the one which takes place in the waters around Greenland (see p. 656), but this process appears to be limited to some areas in the Bransfield Strait (Clowes, 1934).
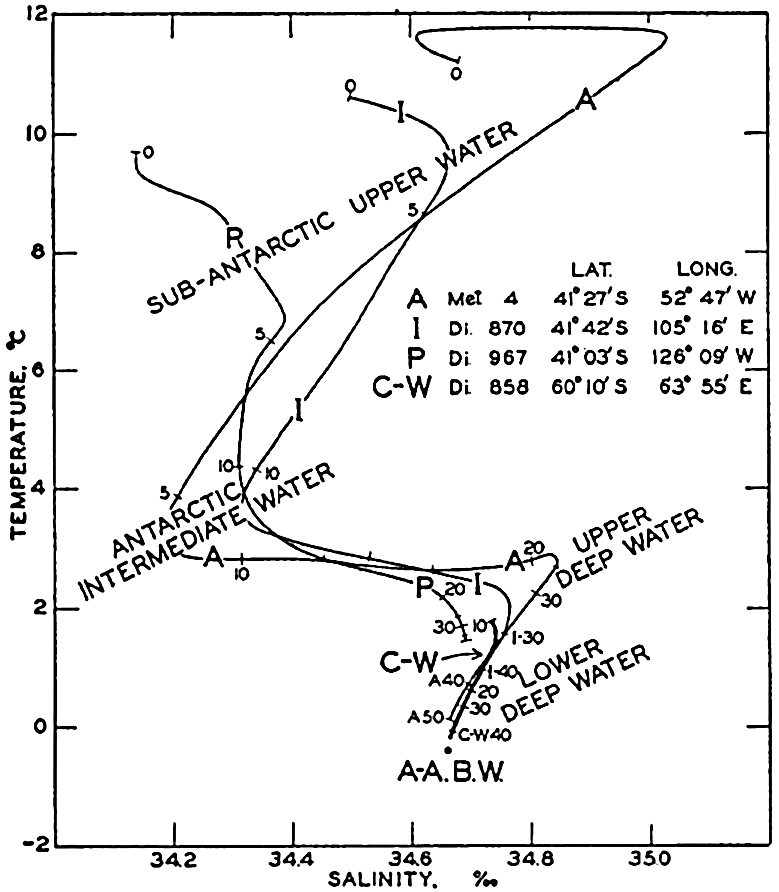
Temperature-salinity curves at three stations in the subantarctic regions in the Atlantic (A), the Indian (I), and the Pacific (P) sectors of the Antarctic Ocean, and at a station within the region of circumpolar water (C-W). Antarctic Bottom Water shown by A-A.B.W.
By far the major part of the Antarctic Bottom Water is formed in the Weddell Sea, as is evident from the section in fig. 160, according to which water of a salinity of 34.66 ‰ is present only between 30°W and 30°E. Intermittently, bottom water is also formed south of the Indian Ocean between long. 30°E and 140°E (Sverdrup, 1940), but no evidence exists for such formation to the south of the Pacific Ocean. These features have bearing on the deep-water circulation of the different oceans and we shall therefore return to them later (p. 745).
The Waters of the Subantarctic Region. These waters differ much more both regionally and in a vertical direction, for which reasons a well-defined classification cannot be undertaken. The curves in the T-S diagram in fig. 161 illustrate the waters present and show that generally one can distinguish between five different water masses, the Subantarctic Upper Water, the Antarctic Intermediate Water, the Upper Deep Water, the Lower Deep Water, and the Bottom Water.
The three curves representing conditions in the subantarctic region are based on observations in the Atlantic, Indian, and Pacific sectors,
Within all areas the upper water is characterized by relatively high temperatures and a salinity maximum at some distance below the surface, the highest salinities occurring in the Atlantic area. The Antarctic Intermediate Water is present in all areas. In the Atlantic it is of somewhat lower salinity and is found at a somewhat lesser depth below the surface, but these features are partly related to the distances of the stations from the Antarctic Convergence. At the stations in the Atlantic and Indian Ocean areas the Upper Deep Water shows a relatively high salinity and high temperature, whereas the Lower Deep Water is of the same character as the Antarctic Circumpolar Water, but is found at a greater depth. In the Pacific Ocean the Upper Deep Water is of lower temperature and lower salinity, but the Lower Deep Water approaches the character of the Antarctic Circumpolar Water.
The reason for these regional differences will be discussed when dealing with the deep-water circulation and it is sufficient here to emphasize that the subantarctic waters differ within the three oceans, whereas the antarctic waters are of similar character all around the Antarctic Continent.
The Currents of The Antarctic Ocean. The more or less permanent currents of the Antarctic Ocean consist principally of two types, the relative currents which are associated with the distribution of mass, and the wind drifts of the surface layers.
The character of the relative currents can be derived from fig. 162 showing the distribution of the specific volume anomalies in the section which was used for demonstrating the character of the water masses (see fig. 159). At any level the water of the smallest specific volume, that is, the greatest density, is found near the Antarctic Continent and, in general, the lines of equal anomaly slope downward from south to north. As a consequence of this distribution of mass, the isobaric surfaces all rise towards the north if the 4000-decibar surface is considered horizontal. This rise towards the north is evident from the upper part of fig. 162, in which are shown the profiles of a series of isobaric surfaces relative to the 4000-decibar surface. The current which is associated with the distribution of mass must be directed away from the reader, that is, from west to east, because in the Southern Hemisphere
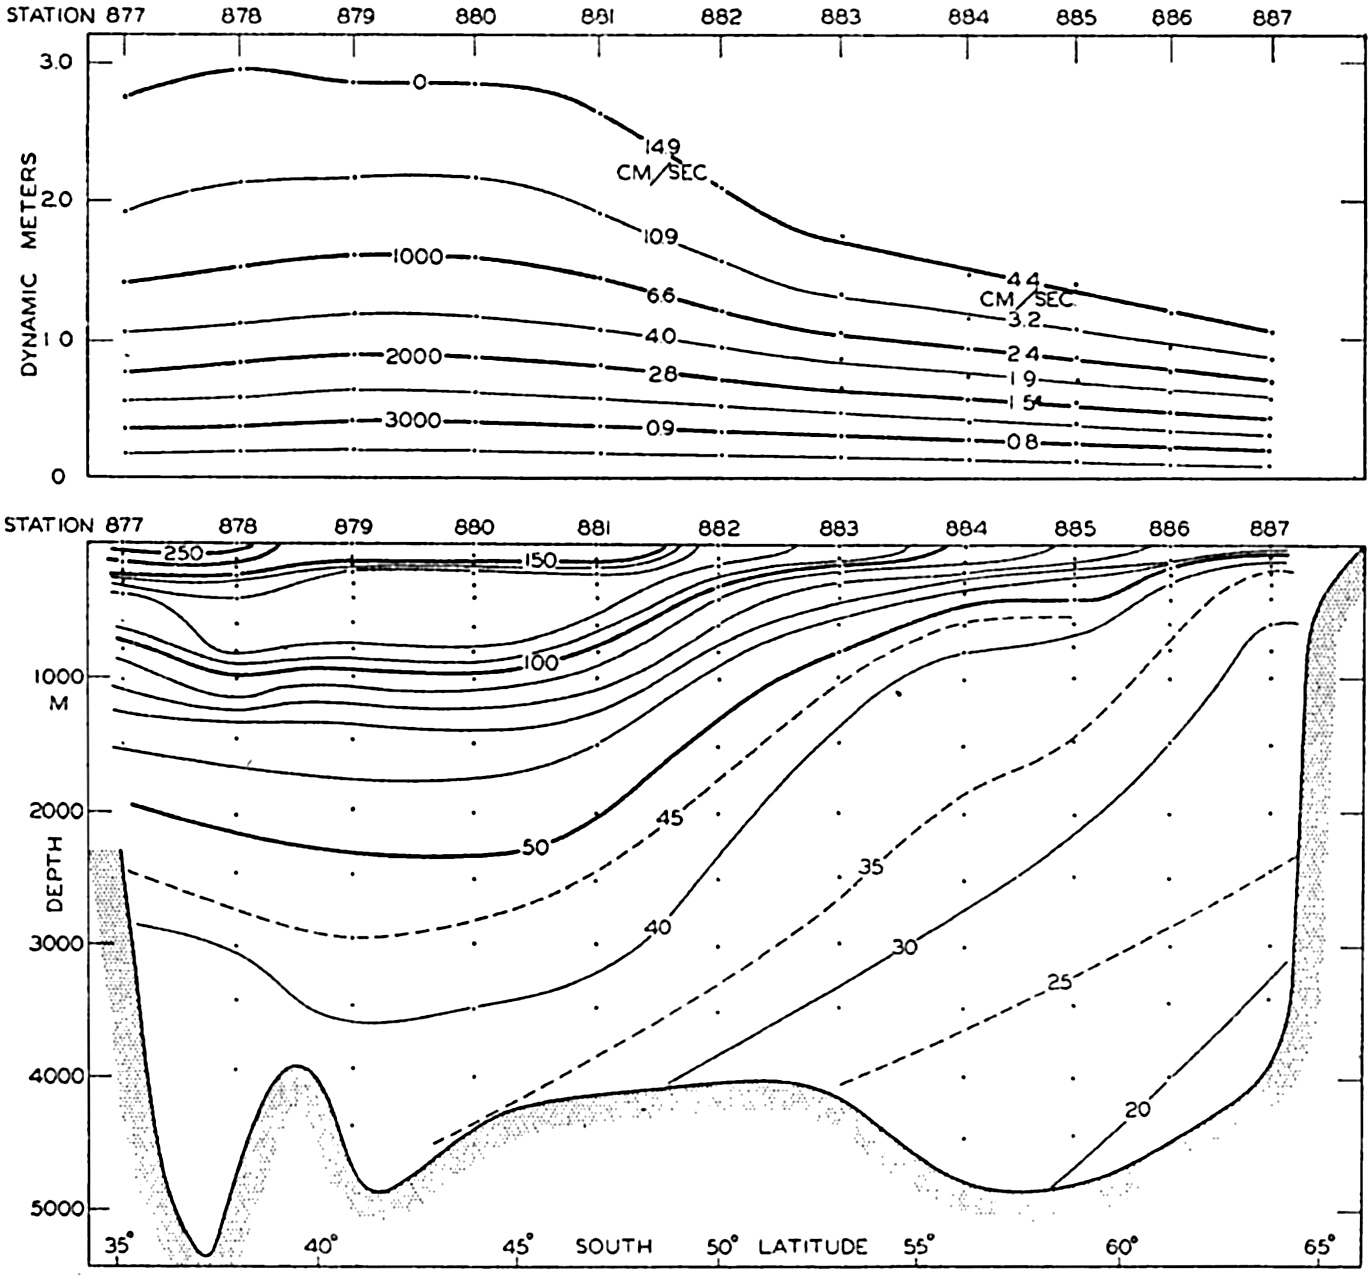
Lower: Distribution of the anomaly of specific volume, 105δ, in a vertical section from Cape Leeuwin, Australia, to the Antarctic Continent (see fig. 158). Upper: Profiles of the isobaric surfaces relative to the 4000-decibar surface.
In general, the current runs from west to east around the Antarctic Continent, but is locally deflected from its course, partly by the distribution of land and sea and partly by the submarine topography. The effect of the submarine topography is evident in Deacon's charts (1937b) of the dynamic topography of the surface or the 600-decibar surface relative to the 3000-decibar surface, and it is also seen from fig. 163, which shows the total volume transport relative to the 3000-decibar surface as computed by means of the data which Deacon has used for his presentation, adding the results from a number of Meteor stations in the South Atlantic. In the figure the volume transport is shown by lines which are approximately in the direction of transport and which have been drawn with such intervals that the transport between two lines equals 20 × 106 m3/sec.
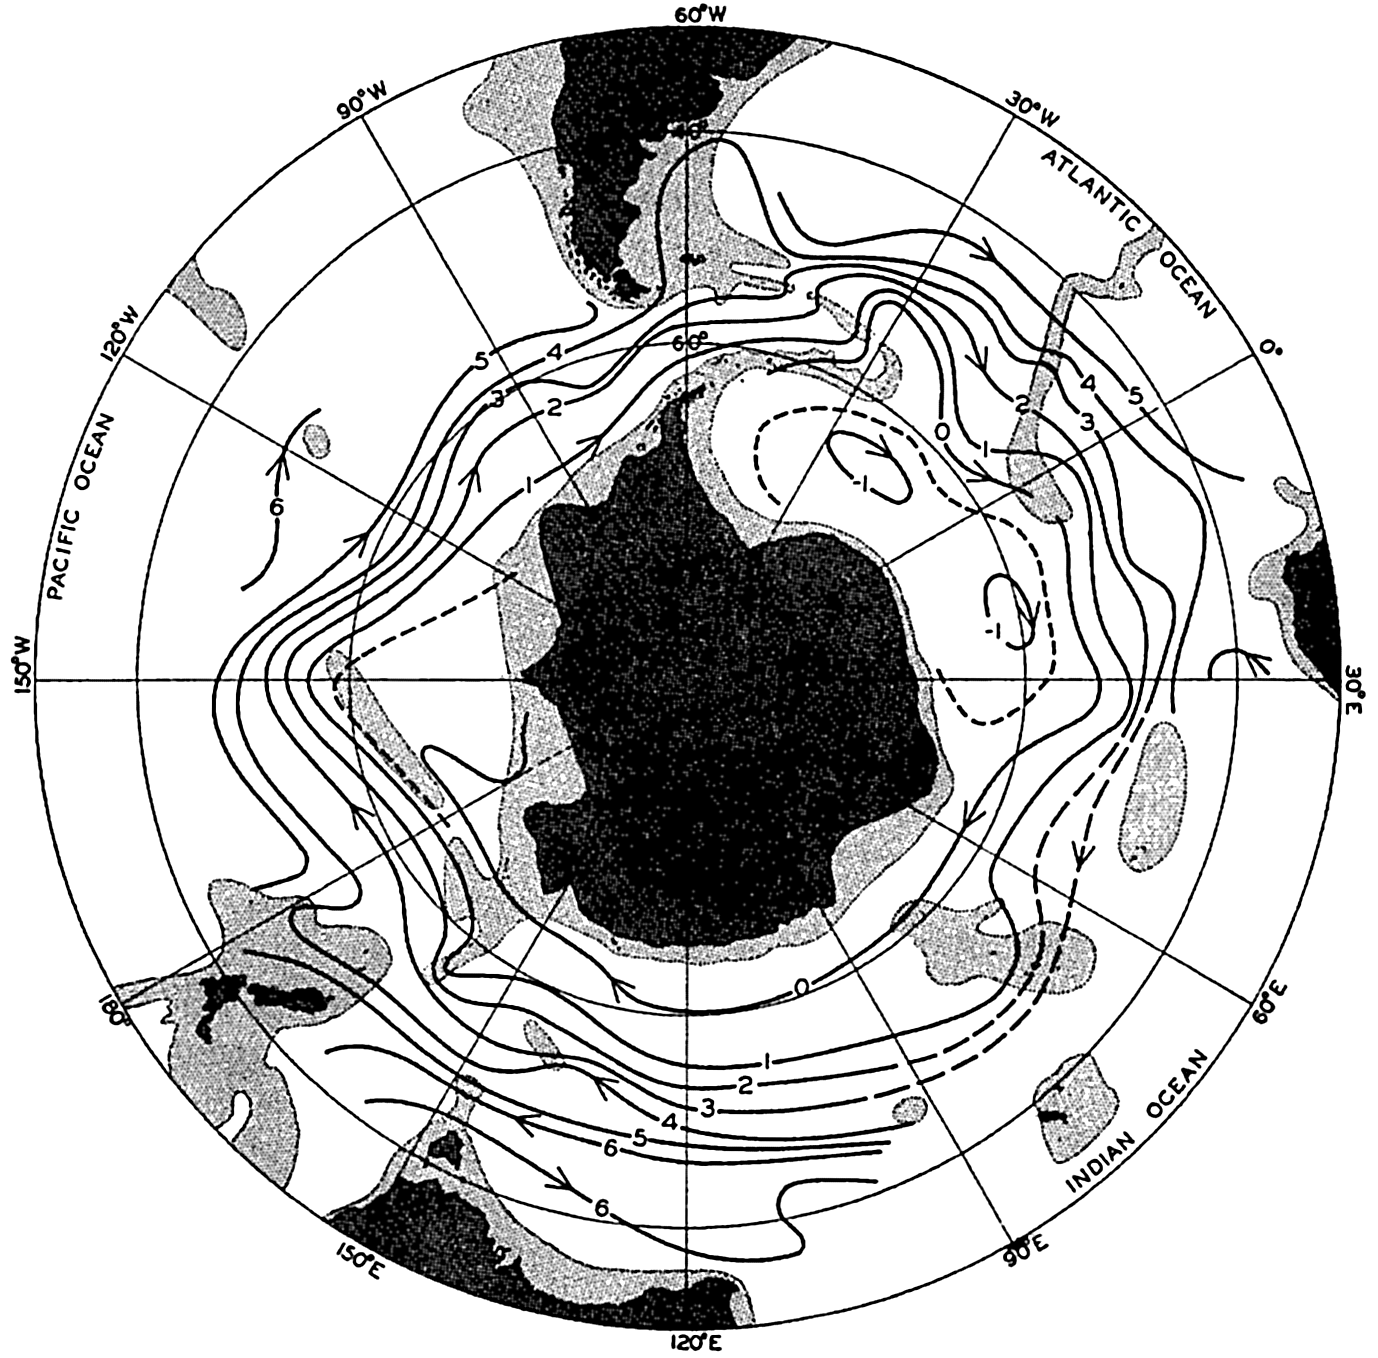
Transport lines around the Antarctic Continent. Between two lines the transport relative to the 3000-decibar surface is about 20 million cubic meters per second.
Following the current around the Antarctic Continent, it is seen that when approaching a submarine ridge the current bends to the left and after having passed the ridge it bends to the right, in accordance with our preceding discussion of the effect on a deep current (p. 466). Having passed through Drake Passage, the Circumpolar Current approaches the South Antilles Arc, where it first bends to the north and then to the south after having crossed the ridge. When the current passes the shallower areas near Bouvet Island between long. 0° and 10°E, the bends to the north and to the south are repeated; when passing the Kerguelen Ridge, similar bends occur but these are less well defined, perhaps owing to the lack of data. South-southwest of New Zealand the current crosses the Macquarie Ridge, bending sharply north and south, between long. 180° and 155°W, runs towards the east-northeast paralleling the South Pacific Ridge, and having passed the eastern extremity of the shallower portion it bends again towards the south. Thus, five distinct ridges or shallower areas are crossed and in each case the water masses are deflected to the left when approaching the ridges or the shallow areas and are deflected to the right after having passed them. These bends show up in part at the surface in the location of the Antarctic Convergence (see p. 607) and some of them appear on charts of the surface currents (see chart VII).
Besides the bends which are associated with the bottom topography, the effects of the distribution of land and sea and of the currents in the adjacent oceans are also seen. The location of the Drake Passage naturally forces the current further south than in any other region, but on the eastern side of South America a branch of the current, the Falkland Current, turns north. Along the east coast of South Africa the Agulhas Stream flows south, partly turning into the Atlantic Ocean but mainly bending around towards the east, and the narrowness of the Circumpolar Current in long. 30°E is probably related to the effect of the Agulhas Stream. When the Circumpolar Current has passed New Zealand, a bend towards the north is evident which corresponds on a small scale to the Falkland Current.
The transport line marked “zero” is not continuous around the Antarctic Continent, but begins in the Weddell Sea area and ends against the coast of the Antarctic Continent in the region of the Ross Sea. This feature indicates that our representation is not entirely correct and that the transport does not take place exactly along the lines which have been entered, because actual lines of equal transport must be closed lines and cannot end against the shores. Some transport must take place across the lines, and the fact that our line “zero” stops against the continent to the west of Drake Passage indicates that in this narrow passage a certain amount of piling up of water takes place and that transport occurs here across the contour lines. Referring the flow to
A flow to the west near the Antarctic Continent is evident only in the Weddell Sea area, where an extensive cyclonic motion occurs to the south of the Circumpolar Current. The water masses which take part in this cyclonic movement, however, are small compared to those of the Circumpolar Current, and their velocities are small.
Within the subantarctic region the current is also directed in general from west to east but only the southern portion of the waters close to the Antarctic Convergence circulates around the Antarctic Continent and forms part of the Circumpolar Current. In the Pacific Ocean the northern portion belongs to the current system of that ocean and must therefore be dealt with again when describing the conditions in the South Pacific. Thus, a strict northern limit of the Antarctic Ocean cannot be established on oceanographic principles, but a boundary region has to be considered which, depending upon the point of view, may be assigned either to the Antarctic Ocean or the adjacent oceans.
The total transport of the Antarctic Circumpolar Current must be greater than is apparent from fig. 163, which shows only the transport relative to the 3000-decibar surface. According to the figure, the transport through Drake Passage is about 90 million m3/sec, whereas Clowes’ computations (1933) gave 110 million above the 3500-decibar surface. It is therefore probable that the absolute transport between the lines in fig. 163 is not 20 million, but at least 25 million m3/sec.
This discussion of the Circumpolar Current is based entirely on the distribution of mass as derived from deep-sea oceanographic observations. The surface currents have been determined independently by means of ships’ records, and show that the flow of the surface water is governed partly by the distribution of mass and partly by the effect of the prevailing winds. Near the Antarctic Continent easterly and southeasterly winds blow away from the large land masses, but between lat. 60° and 40°5 strong westerly winds prevail. The dashed line in fig. 158, p. 606, shows (according to Deacon, 1937a) the approximate boundary between the regimes of the easterly and westerly winds. Correspondingly one finds, as seen on chart VII, westward surface currents prevailing near the border of the Antarctic Continent and eastward surface currents at some distance from the coast. In the Southern Hemisphere the wind drift deviates to the left of the direction of the wind and consequently the eastward surface current shows a
Deacon attributes the Antarctic Convergence to the character of the deep-water circulation. He points out that the convergence is found where the relatively warm but saline deep water rises, and he reasons that within the antarctic region the upper water, being heavier than the warm surface water further north, would sink if it were not prevented by the highly saline deep water. He writes (1937a, p. 23):
As soon, however, as the northward current has passed the point where the deep water climbs steeply towards the surface it is no longer prevented from sinking, and the sections suggest that the antarctic water flows over the steep ascent of the warm deep water like a stream over a waterfall.
Sverdrup (1934), on the other hand, suggests that the convergence is brought about because in the subantarctic region a thermohaline circulation dominates, which would carry the light surface waters to the south, whereas in the antarctic region a wind circulation dominates, which would carry the surface water to the north. It remains to be seen whether either of these explanations is acceptable or whether a combination of them, or perhaps an entirely new point of view, must be introduced.
As a consequence of the divergence and convergence at the surface, a transverse circulation must be present which is superimposed upon the general flow from west to east. Such a transverse circulation is evident from the vertical sections in fig. 159, p. 608, and fig. 210, p. 748. In these, between 45° and 63°5, the deep water seems to climb from a depth of about 3000 meters to within 200 meters of the surface. The deep water does not appear to reach the very surface, but within the entire antarctic region a considerable amount of deep water of high salinity must be added to the surface layer, because otherwise the salinity would be lowered owing to excess of precipitation and the addition of fresh water by the melting of antarctic icebergs. A southward flow of deep water is also required for balancing the transport of the surface water to the north by the prevailing winds. In the section shown in fig. 159, sinking of water near the Antarctic Continent probably does
At the Antarctic Convergence, water of relatively low salinity and low temperature sinks. A small portion of the sinking water appears in some areas to return towards the south at a depth of a few hundred meters, but the greater part continues towards the north, forming the tongues of Antarctic Intermediate Water which in all oceans can be traced to great distances from the antarctic region. It is probable that this water gradually mixes with the underlying deep water and returns to the Antarctic with the deep water (p. 750). Within the subantarctic regions the upper water appears to flow towards the south, but the nature of this flow is not fully understood.
The antarctic water which leaves the surface has a temperature of 2.2° and a salinity of 33.80 ‰ in the Atlantic area (Wüst, 1935). In the Indian Ocean area and to the south of Australia, similar values are found (Sverdrup, 1940) which appear applicable to the Pacific area as well, because the Antarctic Convergence follows the isotherms and isohalines of the sea surface (Deacon, 1937a). Thus, water of temperature 2.2°, salinity 33.80 ‰, and σt = 27.02, represents a water tgpe (p. 143) that is continuously or intermittently formed near the Convergence, where it sinks. When sinking, it is rapidly mixed with surrounding waters and a water mass, the Antarctic Intermediate Water, is formed which mainly spreads towards the north, being characterized at its core by a salinity minimum. Owing to continued mixing, the characteristic T-S relation of the intermediate water changes as the distance from the Convergence increases, and layers of gradual transition are found both above and below the water mass, for which reason no distinct boundaries can be introduced. The best method for following the spreading out of the intermediate water and the results of mixing is the “core method” which was introduced by Wüst (p. 146), who, in the Atlantic Ocean, examined the temperature and salinity at the core of the intermediate water and determined the depth of the core.
On the basis of these considerations one arrives at the schematic picture of the transverse circulation which is shown in the block diagram in fig. 164. In the diagram the formation of bottom water has been taken into account and, furthermore, it is indicated that the deep-water flow towards the Antarctic Continent is strengthened by addition of both intermediate and bottom water. The main features of the transverse circulation are represented by the sinking of cold water near the Antarctic Continent, the climb of the deep water towards the surface, the
The climb of the deep water towards the surface is of great biological importance, because through that process the amount of plant nutrients in the surface layer is being constantly renewed; the enormous numbers of organisms found in the antarctic water is therefore closely related to the type of transverse circulation which is present.
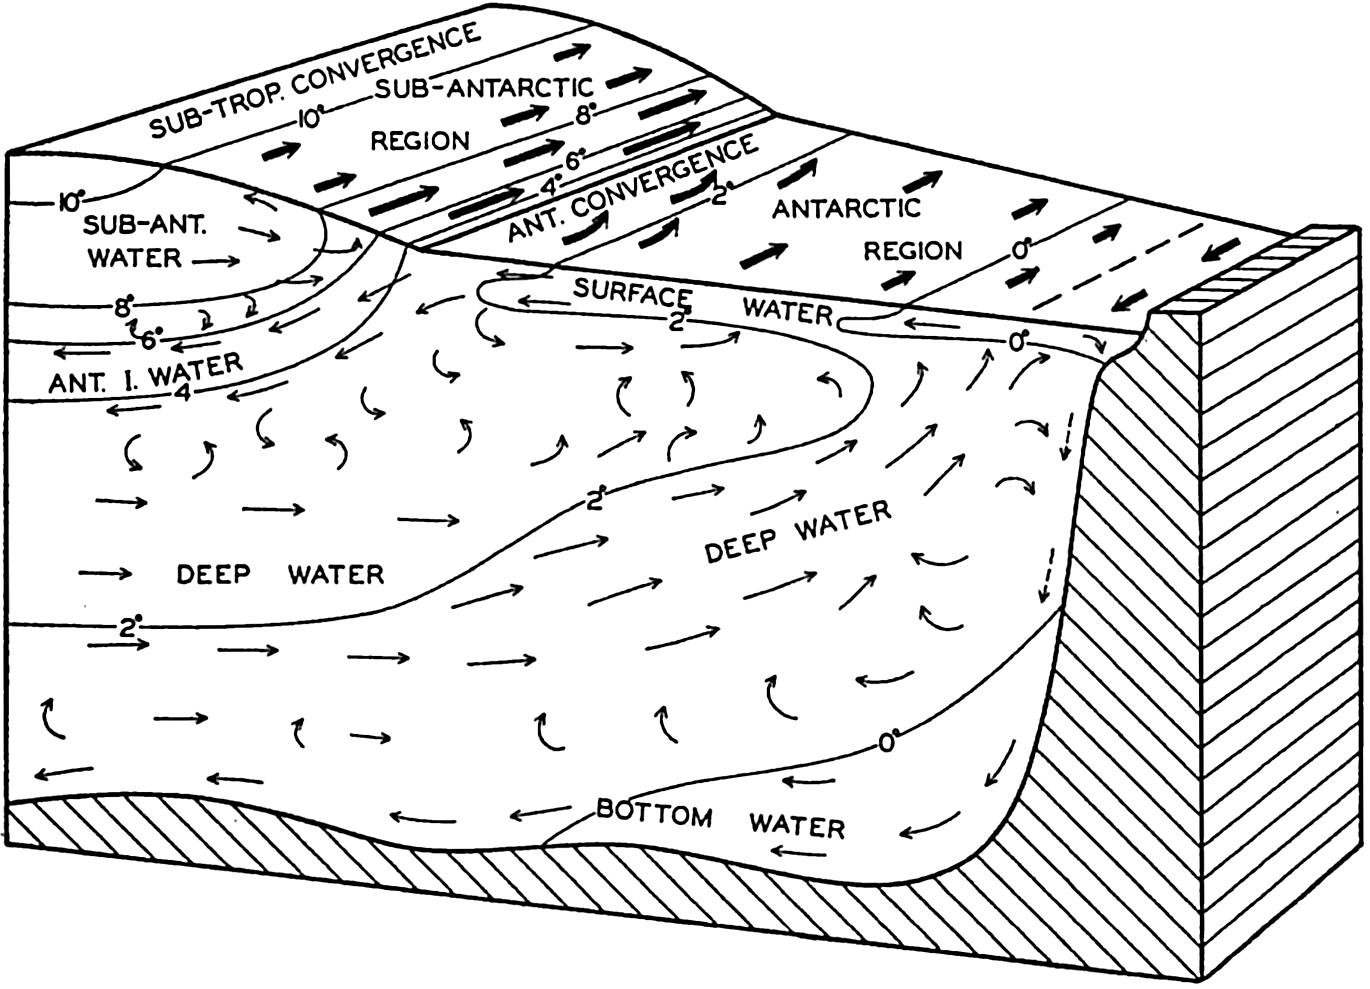
Schematic representation of the currents and water masses of the Antarctic regions and of the distribution of temperature.
From the foregoing it is evident that one cannot consider the Antarctic Circumpolar Water mass as a body of water which circulates around and around the Antarctic Continent without renewal. On the contrary, one has to bear in mind that water from the antarctic region is carried towards the north and out of the region both near the surface and near the bottom, and that deep water from lower latitudes is drawu into the system in order to replace the lost portions. Through external processes, cooling and heating, evaporation and precipitation, freezing and melting of ice, and through processes of mixing, the temperature and salinity in a given locality remains nearly unchanged over a long period, except for such changes as are associated with displacements of the currents. Thus, the stationary distribution of conditions which characterize the entire Antarctic Ocean represents a delicate balance between a number of factors which tend to alter the conditions. On the other hand, an
When one examines the dynamics of the Circumpolar Current, frictional forces have to be taken into consideration. The stress which the wind exerts at the sea surface cannot be balanced by a piling-up of water in the direction of flow (p. 488) because the current is continuous around the earth, and therefore it must be balanced by other frictional stresses. The velocities along the bottom are too small to give rise to bottom friction, and one is therefore led to the conclusion that great stresses exist at the boundaries of the current due to lateral mixing. According to Sverdrup (1939a) such lateral mixing takes place. The torque exerted by these stresses along the quasi-vertical boundary surfaces of the current must balance the torque exerted by the wind on the surface, but so far no attempt has been made at an analysis of the dynamics of the current, taking friction into account.
Distribution of oxygen (ml/L) in a vertical section around the Antarctic Continent. Location of section is shown by line S in fig. 158. See also fig. 160.
Oxygen Distribution. The distribution of oxygen around the Antarctic Continent is illustrated by the section in fig. 165, which corresponds to the sections in fig. 160. The water which enters the Drake Passage from the west has a low and uniform oxygen content below a depth of 600 m. A minimum oxygen content of about 3.7 ml/L is found at a depth of about 1200 m, and near the bottom the oxygen content is only slightly higher than 4.0 ml/L. To the east of the South Antilles Arc the oxygen content is considerably higher, evidently because the bottom water of the Weddell Sea contains a relatively large amount of oxygen. In the section, values higher than 4.8 ml/L are shown and the minimum value, which is here encountered above a depth of 1000 m, is only slightly less than 4.0 ml/L. As the water proceeds further towards the east, the oxygen content generally decreases both within the layer of minimum oxygen content and within the deep and bottom water. The decrease, however, is irregular, and more data are needed in order to
The variation of oxygen content in a north-south direction is illustrated in fig. 166, representing the Discovery section to the south of Western Australia, and in the southern parts of the sections in fig. 210, p. 748, and fig. 212, p. 753. In fig. 166 the high oxygen content of the surface waters decreases towards the north, owing to the increasing temperature. The water which sinks at the Antarctic Convergence has a relatively high oxygen content, but the content decreases so rapidly towards the north that no intermediate maximum develops. A layer of minimum oxygen content, within the subantarctic zone, is found at a depth of nearly 2000 m and this layer rises to the south. In the antarctic region, the layer of minimum oxygen content is encountered at a depth of about 600 m. The Antarctic Circumpolar Water has a higher oxygen content than the deep water further north, and the Antarctic Bottom Water which is found near the Antarctic Continent shows the highest oxygen content with values above 4.6 ml/L.
Distribution of oxygen in a vertical section from Cape Leeuwin, Australia, to the Antarctic Continent (after Deacon). Location of section shown by line A in fig. 158. See also figs. 159 and 162.
In the Weddell Sea area which is shown in fig. 210, p. 748, the bottom water has an oxygen content higher than 5.5 ml/L, and close to the continental slope values up to 6.5 are encountered. These high values confirm the conclusion that the greater amount of the Antarctic Bottom Water is formed in the Weddell Sea region. Mosby (1934) points out that the shelf water which contributes to the formation of the bottom water has an oxygen content of about 7 ml/L, whereas the deep water
To the north of the Weddell Sea the Antarctic Intermediate Water is characterized by a maximum of oxygen below which is present a layer of minimum oxygen content which rises towards the south. The deep water shows a higher oxygen content than that in the same latitude to the west of Australia. Within the subantarctic waters, then, regional differences are present not only in temperature and salinity (p. 612) but in oxygen content as well.
Ice and Icebergs. Two forms of ice are encountered in the Antarctic Ocean, sea ice which is formed by freezing of sea water and icebergs which represent broken-off pieces of glaciers. The appearance of both sea ice and icebergs varies widely. Several classifications have been proposed (Transehe, 1928, Smith, 1932, Maurstad, 1935, Zukriegel, 1935) and several codes for reporting ice have been introduced, one of which (Maurstad, 1935) has been adopted by the International Meteorological Organisation. The classification of sea ice deals with forms produced under different conditions of freesing, forms which are due to the tearing apart and packing together of the ice under the action of winds and tides, and forms which result from disintegration and melting of the ice. The classification of icebergs is based on the shape of the bergs, which depends partly upon the type of glacier from which they originate and partly upon the processes of melting and destruction to which they have been subjected.
The great mass of sea ice around the Antarctic Continent is in general described by the somewhat loose term “pack ice,” by which is meant drifting fields of close ice, mainly consisting of relatively flat ice floes, the edges of which are broken and hummocked. The pack ice is kept in motion by winds and currents. The effect of the wind is conspicuous when observations are made from a vessel drifting with the ice, because every change in wind direction and velocity brings about a corresponding change in the drift of the ice. Careful observations of the ice drift were conducted by Brennecke (1921) during the drift of the Deutschland in the Weddell Sea in 1911–1912. He found that the direction of the ice drift deviated on an average 34° from the wind direction and not 45° as required by the Ekman theory of wind currents (p. 493). The discrepancy was explained by Rossby and Montgomery (1935) as due to a layer of shearing motion in the water directly below the ice; but it may be due in part to the resistance offered by the ice, because the wind does not blow uniformly over large areas, wherefore the ice is packed together in some areas and torn asunder in others. The ice resistance
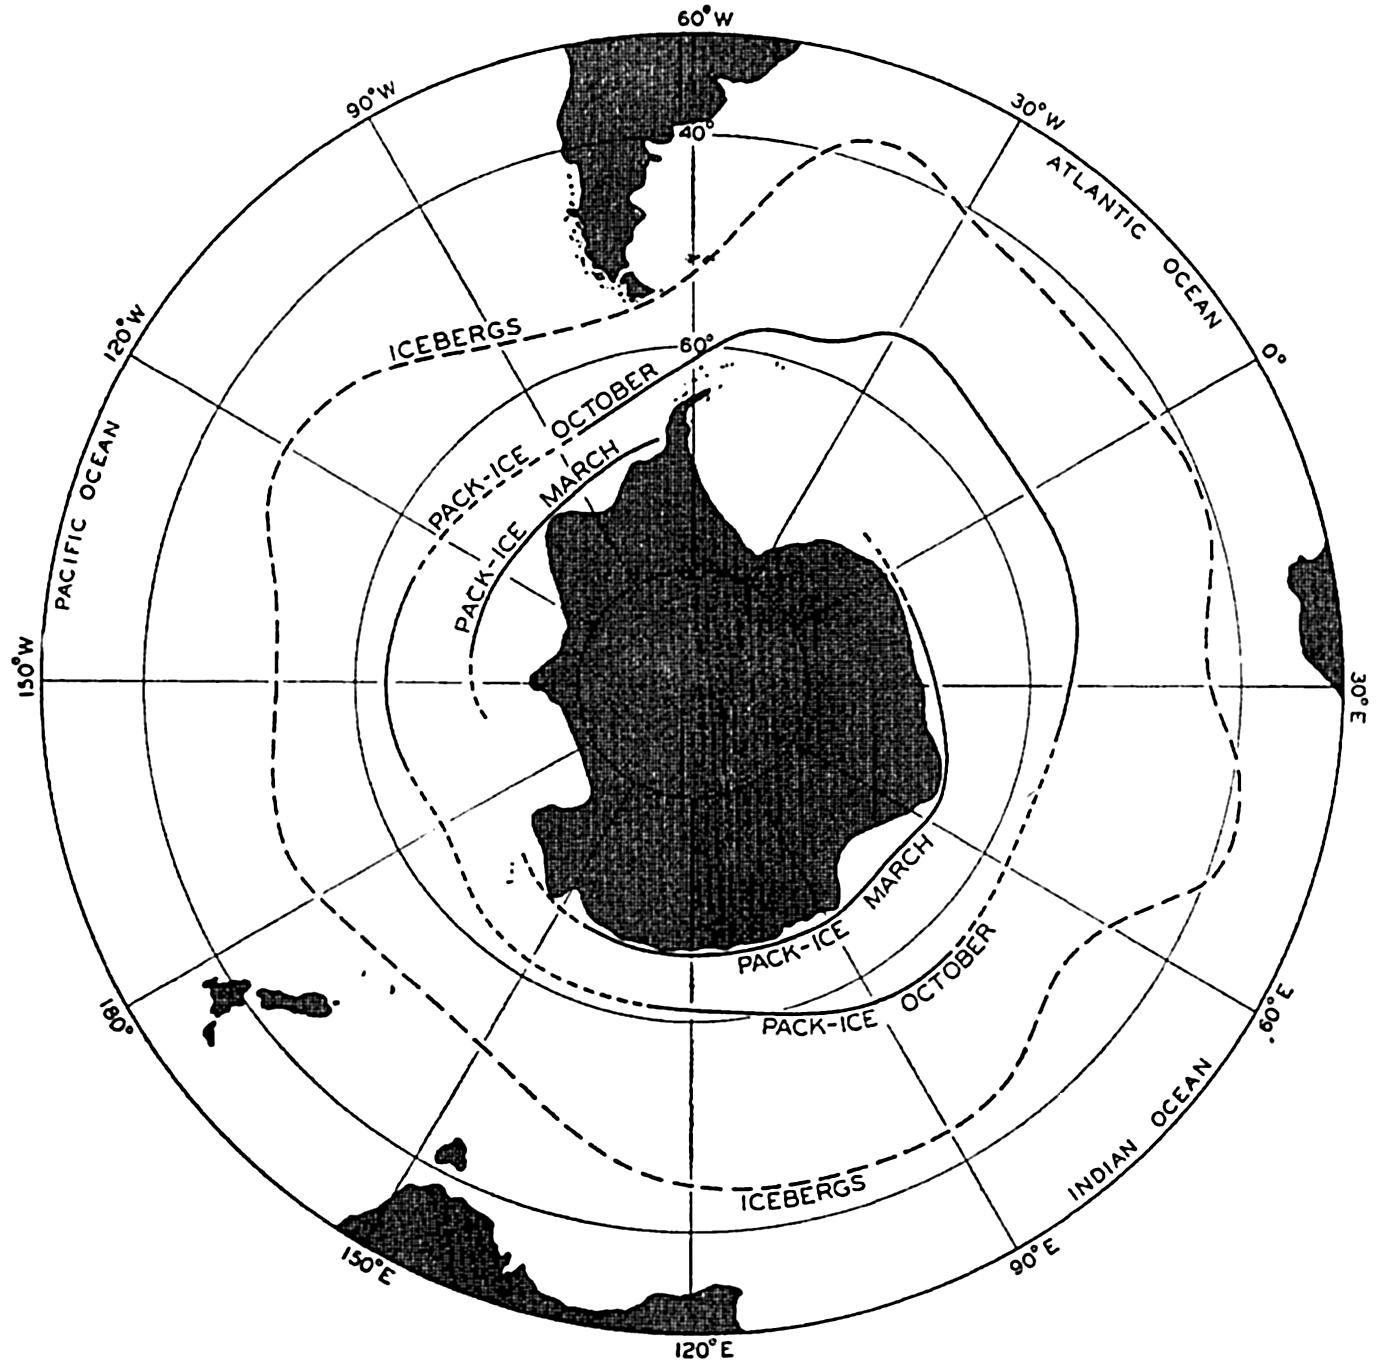
Average northern limits of pack-ice around the Antarctic Continent in March and October (after Mackintosh and Herdman), and average northern limit of icebergs according to British Admiralty Chart No. 1241.
The antarctic pack ice has in all months of the year a well-defined northern boundary beyond which no great amounts of scattered ice are encountered. The northern limits of the ice at the end of the winter (October) and the end of the summer (March) are shown in fig. 167 (Mackintosh and Herdman, 1940). Parts of the antarctic coast are always ice-free in summer, such as the Pacific side of Graham Land, and other parts are often ice-free, such as the coasts to the south of Australia and Africa. The eastern areas of the Weddell Sea and the
The great icebergs of the Antarctic originate mainly from the shelf ice, which represents the direct continuation of the antarctic ice cap where it extends into the shallow waters surrounding the continent. The shelf ice is partly afloat, and when it is pushed far out it breaks off in enormous pieces which may be tens of kilometers wide and up to 100 km long, and may rise 90 m out of the water, which corresponds to a thickness of about 800 m. These giant bergs, which have occasionally been mistaken for islands, drift through the pack ice and often move in an opposite direction to the pack because they are carried by currents and are less influenced by wind. The melting of these bergs takes a long time, for which reason they drift to greater distances from the continent than the sea ice. Figure 167 also shows the average northern boundary of icebergs according to British Admiralty chart No. 1241, but icebergs or remains of icebergs have been reported much further north than is indicated by this average limit. On April 30, 1894, a small piece of floating ice was sighted in lat. 26°30'S, long. 25°40'W, but otherwise remains of icebergs are rarely reported from localities north of 35°s in the Atlantic Ocean, north of 45°5 in the Indian Ocean, and north of 50°5 in the Pacific Ocean.