PART FOUR—
ANALYSIS AND INTERPRETATION OF OBSERVATORY DATA
Fifteen—
Development of Fault-Plane Studies for the Mechanism of Earthquakes
Agustín Udías
Observations of the Signs of P-Wave First Motions
The first methods to study the source mechanism of earthquakes were based on observations of the compressional or dilatational nature of the first impulse of the P-waves. Because of the simplicity of this type of data, these methods are still widely used. Provided instrumental polarities are not reversed, the methods do not require homogeneous or well-calibrated seismographs. Basically, these methods compare the observed distribution of signs of the P-wave first impulses with those expected from some theoretical model of the earthquake source.
Interest in the compressional or dilatational character of the first motion of P-waves arose from the early analysis of seismograms. Among the first authors to discuss this character were Omori (1905) and Galitzin (1909). One of the first indications that there may be a connection between this type of observations and the mechanism of the earthquakes was made by Walker (1913). The first studies used observations at a single station of the signs of the first motions from many earthquakes. Somville (1925) carried out a global study using observations at the Uccle station from earthquakes in the period 1910 to 1924. The results were plotted on a world map with a polarity assigned to each epicenter. The same type of analysis was done by Rothé and Peterschmitt (1938) using observations at Strasbourg for the period 1924 to 1931, and by Di Filippo and Marcelli (1949) using observations at Rome from 1938 to 1943. In all cases observations were represented on a map, and regularity patterns were sought for the different seismic regions.
In North America, similar work was performed by Gutenberg (1941), who used 4,207 observations at nine stations from 1960 local earthquakes in southern California. For each station he plotted on a map the distribution of
compressions and dilatations. Gutenberg took Reid's elastic rebound theory for the mechanism of earthquakes and assumed two simple models of vertical faults with either purely horizontal or purely vertical motion. Under these conditions the pattern of the compressions and dilatations at a near station on the surface of the earth is relatively simple. He observed a quadrant distribution compatible with a strike-slip mechanism on a vertical fault of similar trend for all shocks in the region. He also plotted, on the same map, data from all the stations in the form of small arrows at each epicenter in the direction of the stations. This analysis can be considered as the first precursor of the method of joint fault-plane solutions. Byerly and Evernden (1950) used observations from the Berkeley station of earthquakes in the circum-Pacific belt, separating them according to depth. Their conclusion was that the distribution of compressions and dilatations depends on the orientation of the faults and the direction of movement along them; one can expect a consistent pattern over a wide zone only when the tectonics are fairly simple and the direction to the observing station bears a consistent relation to all faulting in the area.
It was soon realized that this type of analysis was not very successful, and it was replaced by the study of observations by many stations for one earthquake.
Byerly's Method
Studies using many observations of the polarities of P-wave first motion from one earthquake encounter serious difficulties at first. In some cases, as in Japan due to the dense network of stations, it was possible to study the distribution on the surface of the Earth of the directions of first motions from local earthquakes. For some simple mechanisms, the patterns can be easily identified. After some attempts by Gutenberg in 1915 and Labozzeta in 1916, it was Shida, in 1917, who first identified the quadrant distribution of compressions and dilatations (Kawasumi, 1937). However, this is not possible for teleseismic distances, and a method must be found to compensate for the effects on ray propagation of the variation of the velocity with depth in the Earth. Byerly was the first to solve this problem, introducing, in 1928, the concept of extended positions in his study of the mechanism of the Chile earthquake of November 11, 1922.
For the mechanism of earthquakes, Byerly accepted Reid's elastic rebound theory. The motion of the two sides of the fault was identified with the mathematical model of a couple of forces in the direction of the motion. According to the theoretical work of Nakano (1923), this type of source for a homogeneous medium gives rise to P-waves with a quadrant distribution of compressions and dilatations separated by two orthogonal nodal planes. If the observations in the Earth are reduced to an equivalent homogeneous
medium, the problem can be solved by separating them by two orthogonal planes, one of which will be the fault plane. Byerly's identification of the fling motion of the two sides of a fault with a single force couple was not correct, because the appropiate equivalent force model for a shear dislocation is a double couple with no net moment, but both force models give the same quadrant distribution of signs of P-wave first motions. The single- versus double-couple controversy for the mechanism of earthquakes was debated well into the 1960s.
Byerly succeeded in reducing the observations to a homogeneous medium by substituting an "extended" position for the actual position of the stations on the surface of the Earth. These extended positions are those that correspond to each observation, assuming that the ray path is a straight line, that is, if the Earth is a homogeneous medium. After replacing the actual observation points by their extended positions, the results from theory can be applied.
The extended positions are plotted on a stereographic projection, with the anticenter as the pole (fig. 1a ). On this projection the nodal planes passing through the focus project as circles. The method consists of plotting the observations (compressions and dilatations) on the projected extended positions of the stations and separating them into four alternating regions by means of two circles passing through the center of the projection. From this representation, the strikes and dips of the two nodal planes are determined. One of the first published solutions by Byerly (1938) is for the earthquake of July 6, 1934, off the coast of northern California (fig. 2). From the solution, he concluded that the distribution of compressions and dilatations was consistent with motion along a N40.5°W plane, with the Pacific side moving northwesterly and the continental side southeasterly, in agreement with the observed displacement in 1906 on the San Andreas fault.
Byerly's method was rapidly adopted as a standard method for the study of earthquake mechanisms. He and his coworkers at the University of California, Berkeley, developed the method further, introducing other types of projections and observations of the polarization of S-waves (Byerly and Stauder, 1958; Stauder, 1962). An ambitious program, the "Fault-Plane Project," was started in 1951 in the Dominion Observatory (Canada) by Hodgson, who published tables of extended distances for P-waves and different focal depths based on the Jeffreys-Bullen travel-time tables (Hodgson and Storey, 1953).
The Focal Sphere
Independent of Byerly's work, studies of the mechanisms of earthquakes using first-motion data were pursued in Japan and Europe. In Japan, after the seminal work of Shida, a method was used that was based on the separa-
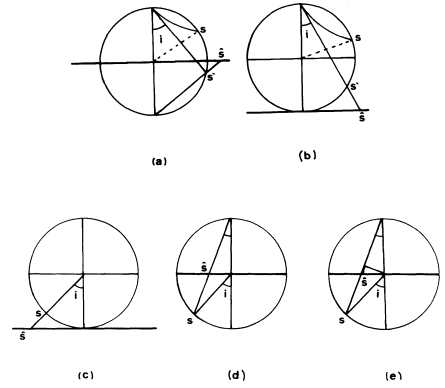
Figure 1
Projections of the Earth and the focal sphere: a) Extended positions and
Byerly's projection. b) Extended positions and central projection used by
Knopoff (1961a ). c) Central projection. d) Wulff-net stereographic
projection. e) Equal-area (Schmidt) stereographic projection.
tion of compressions and dilatations plotted on a geographical map and that took advantage of the dense network of seismographic stations. For simple source models, such as strike-slip faults, the pattern for near stations is four quadrants separated by straight lines, independent of the velocity distribution. Early Japanese work already used a variety of source models, in general, combinations of forces and couples with and without moments (Honda, 1962). The limitations of using the distribution of data on a geographical map, even for local earthquakes, was soon evident, and the method was not applicable to teleseismic distances. To obviate this problem, the concept of the focal sphere was developed, that is, a small sphere of homogeneous material and unit radius around the focus. Rays leaving the focus and arriving at a particular station intersect the surface of the sphere at points located by their azimuth and take-off angles i. Stations at any dis-
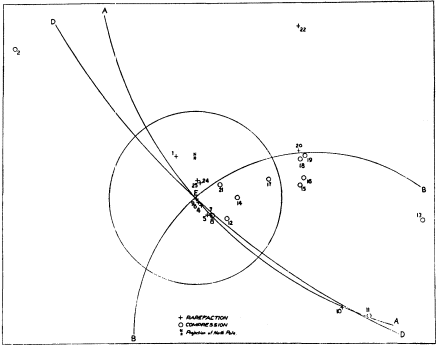
Figure 2
Fault-plane solution of the earthquake of July 6, 1934, off the
coast of northern California using Byerly's method (Byerly, 1938).
tance, D , can then be projected back, along the ray, to the surface of the focal sphere. The take-off angles for either local or teleseismic distances can be calculated if the distribution of velocity in the Earth is known.
Early work in Europe, such as that of Hiller in 1934, followed the same method as in Japan, using local stations. Koning (1942), in Holland, called attention to the use of the focal sphere; he was the first to use the Wulff stereographic projection, to project not the focal sphere but rather the surface of the Earth. This approach was fully developed by Ritsema (1952), who was the first to carry out the complete determination of the fault-plane solution using the Wulff-net projection of the focal sphere. The use of the Wulff net permits an easy separation of compressions and dilatations by two orthogonal planes (Ritsema, 1955). Ritsema (1958) calculated a useful set of (i , D ) curves for foci of different depth and applied this method to a number of earthquakes, mainly in southeast Asia and in Europe.
In Japan the focal sphere, called by Honda the "model sphere," was initially used to represent the results of the mechanism performed on geographical maps, in what was called the "mechanism diagram," by means of
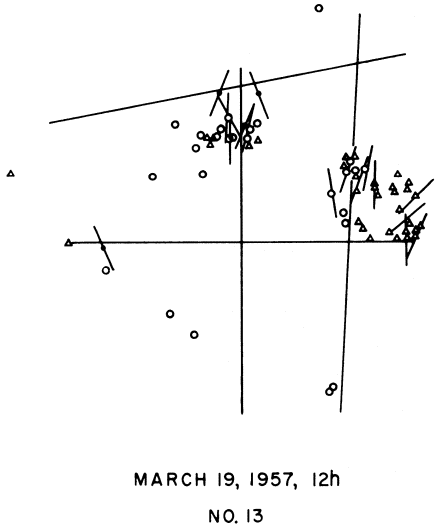
Figure 3
Fault-plane solution of the earthquake of March 11, 1957, in the
Aleutian islands based on the first motion polarities of P-waves
and S-wave polarization directions (Stauder and Udías, 1963).
an equal-area or Schmidt stereographic projection (fig.1e ). Honda's early work since 1931 followed this procedure. In 1958, Honda and Emura made the first use of this type of projection of the focal sphere to plot the data and separate compressions and dilatations by two orthogonal planes (Honda, 1962).
Focal-mechanism studies have been carried out in the Soviet Union since 1948. Russian seismologists used observations of first motions of P-, SV-, and SH-waves, plotting them on a Wulff-net projection of the focal sphere, which also represented the nodal lines for these waves (Keilis-Borok, 1956).
Another representation of the focal sphere on a plane is achieved by means of the central projection on which the nodal planes project as straight lines, but which inconveniently projects near stations at large distances from the center of the projection (fig. 1c ). This projection was used by Stauder to represent (fig. 3) P-wave first motions and S-wave polarization data (Stauder and Udías, 1963). The equivalence of the different representations and projections of the focal sphere was shown by Scheidegger (1957). The different projections of the focal sphere are shown in figure 1. Today, the equal-area projection is more generally used since it has a better definition near the center of the projection (fig. 4). For local earthquakes, ray-tracing techniques are applied with layered or variable velocity models of the Earth crust to project the observation points onto the focal sphere. In these cases values of the take-off angles depend strongly on the models used and the focal depth. For teleseismic distances the angles are derived from travel-time curves and depend on the assumed value of velocity at the focal depth.
Numerical Methods and Computer Programs
With the advent of computers, the question soon arose of applying numerical methods to the fault-plane problem. The earliest attempt seems to be that of Homma (1941) who tried unsuccessfully to apply the method of least squares. Knopoff (1961a,b ) presented the first workable formulation of the problem. He considered that the probability that a station reading is correct depends on the signal-to-noise ratio (Si /N i ). If Ri are the observed readings, the probability is given by
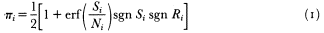
Substituting a constant a for the noise and putting the theoretical expressions for the normalized amplitudes in terms of the orientation of the source, the problem is to find the orientation that corresponds to a maximum probability of correct readings. The function to be maximized is given by
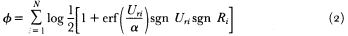
Figure 4
Fault-plane solution of the earthquake of January 1, 1980, in the Azores
islands using the equal-area projection. Numerical values and errors have
been obtained by means of the algorithm of Brillinger et al. (1980).
where sgn Ri and sgn Uri are the observed and calculated signs of P-wave motion. The problem was solved using a projection of the observations into an antipodal plane of the epicenter (fig. 1b ). On this projection the nodal planes project as straight lines. The problem was expressed and solved in Cartesian coordinates for the three parameters that defined the two nodal lines and the noise parameter a . The maximization of ø was done by an iterative procedure, starting with some initial values, until convergence was achieved. Assuming the function ø to be approximately Gaussian in the vicinity of its maximum, standard errors of the solution could be determined.
The main drawback of this method was the projection adopted, which exaggerates the weight of near stations.
The problem was reformulated by Kasahara (1963) using spherical coordinates in the focal sphere. He used the above expression for the function ø but rewrote the expressions for the theoretical amplitudes of P-waves in terms of the strikes and dips of the two planes. (Because of the orthogonality condition only three angles are independent). Maximization of the function ø was achieved, after approximating it in the vicinity of its maximum, by a quadratic and the use of successive approximations from an initial solution. Kasahara also considered the use of weights for the stations based on their past performance.
The basic ideas of Knopoff and Kasahara were used in the computer program developed by Wickens and Hodgson (1967) in which the function to be maximized was the "score," defined as
where sgn øpi are the signs of the theoretical amplitudes, and sgn Ri the signs of the observed polarities. Wpi are weighting functions that depend on the expected amplitudes (modified from Knopoff's)

D is a parameter based on the sign changes between successive trials. The maximization process was performed by a systematic rotation of the two orthogonal nodal planes through all their possible values in a search for the orientation that maximized the score. The procedure was carried out first with a coarse grid and then with a finer subgrid around the best twenty trials. A variability measurement, first proposed by Ritsema (1964), is given by the angular rotation of the planes around the solution allowing two additional observations to be inconsistent. The program could also use weights of the stations based on their past performance. It plotted the solutions using Byerly's projection. This program was used extensively in the Dominion Observatory (Canada) in a reevaluation of the fault-plane solutions for the period 1922 to 1962.
Udias and Baumann (1969) developed a mixed method that combined signs of first motions of P- and S-wave polarization angles. The source used was a double couple, and the program searched for a minimum combined error of the two types of data
where Îi and Îci are the observed and calculated polarization angles of the S-wave, and sgn Upi and sgn Upci are the observed and calculated signs of first motion of the P-wave. In this expression E is a sum of the standard error of the residuals of the polarization angles of S-waves plus the number of inconsistencies of P-wave data multiplied by 100. This scheme is equivalent to using the P-wave data as a constraint. The program searched for the orientation of the source that best satisfied the S-wave data, only within the region of those solutions with a minimum error in P-wave data. The problem was expressed in spherical coordinates on the focal sphere, representing the source by the X and Y axes defining the orientation of the two couples of forces. The solution was obtained by a systematic change of these two axes in small increments of the polar angles. Solutions depend greatly on having a sufficient number of good S-wave polarization measurements. This method was improved by Chandra (1971), who introduced a weighting procedure to give P- and S-wave data similar weight. A minimum of the combined P- and S-wave errors was again found by a systematic search that varied the orientation of the X and Y axes. Chandra gives error contours for P- and S-wave data that are smoother than those presented by Udías and Baumann.
The problem of combining signs of P-wave first motion and S-wave polarization angles in a fault-plane solution was considered again by Pope (1972) and Dillinger et al. (1972) with a more rigorous statistical approach. A likelihood function for the combined solution was proposed as the product of the P and S likelihood functions so that,
where p is the probability of agreement for a P-wave observation,

A probabilistic formulation of the problem was proposed by Keilis-Borok et al. (1972) using a maximum likelihood method. They proposed three problems: to check the hypothesis that the observations agree with a given type of model; given two types of models, to select the one that better agrees with the observations; and to find a confidence region for the axes of the focal model. In the first case, if ak are the observed signs of P-wave motion and ak the theoretical signs, the maximum likelihood function is given by
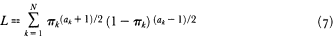
where pk , the probability of a correct reading with respect to the model at station k , is given by
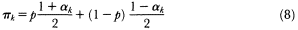
p is the probability of reading a compression and a k is a function of I x , Qx , Iy , the angles (trend and plunge) of the X and Y axes that define the model. Maximum likelihood estimates of these parameters are found as usual by maximization of the function L by means of a search process. In a similar way the appropriate confidence regions for these parameters can be obtained.
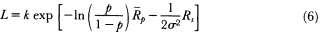
An extension of the problem to consider fault-plane solutions for groups of earthquakes in the same region was presented by Brillinger et al. (1980). This joint treatment endeavors to answer a wider series of question, such as whether for a given region the principal axes of stress have the same orientation for all earthquakes, and whether earthquakes are separable into clusters of different predominant mechanisms. The method simultaneously handles data from many earthquakes, with individual solutions treated as particular cases of the general problem. The probability of reading a compression at station j from shock i is written as

where g is a small constant that accounts for reading errors, ø is the normal cumulative distribution function, A ij (

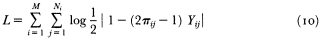
where Yij are the P-wave observations, M is the number of earthquakes, and Ni is the number of observations for each of them. Because L is a differentiable function of the parameters of the problem (ø x , qx , øy , ri ), available efficient routines can be used for its maximization. The program uses an iterative process from a given initial solution. Standard errors of the estimates are determined, and methods for testing the hypothesis concerning the parameter values are applied. In joint solutions the values of ri versus pi (the
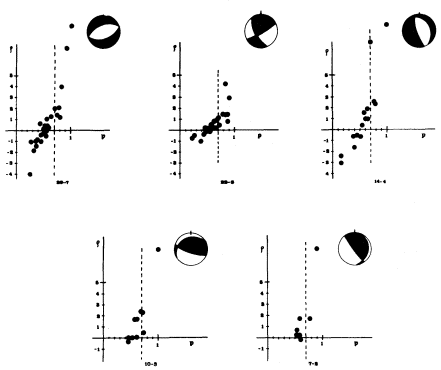
Figure 5
Example of separation of joint solutions into groups according to Udías et al. (1982).
Plots are of pi (scores) versus r i (event parameters) for twenty-nine Pyrenean
microearthquakes. Joint solutions and separations into groups are shown.
Numbers refer to the events in each run and those separated to form each group.
scores) are used as discriminants to divide the shocks into groups, each with the same regional mechanism (fig. 5). This method has been extended by Buforn and Udías (1984) to handle also signs of SH- and SV-wave first motions.
Although many other methods have been developed for the study of source mechanisms, such as waveform analysis and moment-tensor inversion, the fault-plane method is still widely used due to its simplicity. Since late 1950, fault-plane solutions have been used in the tectonic interpretation of seismically active regions, and their study later had an important role in the establishment of the global theory of plate tectonics. A series of studies in the later 1960s and early 1970s has shown the agreement between the results of fault-plane solutions and plate motions predicted from theory along the different plate boundaries. Fault-plane solutions are used today as standard information in seismotectonic studies, and many agencies calculate and publish them on a routine basis.
Acknowledgment
The author wishes to thank Prof. B. A. Bolt of the University of California, Berkeley, for critically reading the manuscript, and Dr. A. R. Ritsema of the Royal Netherlands Observatory, De Bilt, for his comments. Research was partially supported by the Direccion General de Investigacion Científica y Tècnica, project PB 86-0431-C0501 and by the United States-Spain Joint Committee for Scientific and Technological Cooperation, project CCA-83009.
References
Brillinger, D. R., A. Udías, and B. A. Bolt (1980). A probability model for regional focal mechanism solutions. Bull. Seism. Soc. Am., 70: 149–170.
Buforn, E., and A. Udías (1984). An algorithm for focal mechanism determination using signs of first motion of P, SV, and SH waves. Rev. de Geofisica, 40: 11–26.
Byerly, P. (1928). The nature of the first motion in the Chilean earthquake of November 11, 1922. Am. J. Sci. (Series 5 ), 1 6: 232–236.
——— (1938). The earthquake of July 6, 1934: Amplitudes and first motion. Bull. Seism. Soc. Am., 28: 1–13.
Byerly, P., and J. F. Evernden (1950). First motion in earthquakes recorded at Berkeley. Bull. Seism. Soc. Am., 40: 291–298.
Byerly, P., and W. Stauder (1958). Mechanism at the focus of an earthquake. Earthquake Notes, 24: 17–23.
Chandra, U. (1971). Combination of P and S data for the determination of earthquake focal mechanisms. Bull. Seism. Soc. Am., 61: 1655–1673.
Di Filippo, D., and L. Marcelli (1949). Sul movimento iniziale delle onde sismiche registrate a Roma durante il periodo 1939– 943. Ann. Geofisica, 2: 589–606.
Dillinger, W. H., S. T. Harding, and A. J. Pope (1972). Determining maximum likelihood body wave focal plane solutions. Geophys. J. R. Astr. Soc., 30: 315–329.
Galitzin, B. (1909). Zur frage der bestimmung des azimuts der epizentrums eines beben. C. R. des Seances de l'Assoc. Int. Seism. Zermatt, 132–141.
Gutenberg, B. (1941). Mechanism of faulting in southern California indicated by seismograms. Bull. Seism. Soc. Am., 31: 263–302.
Hodgson, J. H., and R. S. Storey (1953). Tables extending Byerly's fault-plane techniques to earthquakes of any focal depth. Bull. Seism. Soc. Am., 43: 49–61.
——— (1954). Direction of faulting in some larger earthquakes of 1949. Bull. Seism. Soc. Am., 44: 57–83.
Homma, S. (1941). Calculation of the focal mechanism of deep-focus earthquakes by the least square method. Kenshin-Ziho, 11: 365–378.
Honda, H. (1962). Earthquake mechanism and seismic waves. J . Phys. of the Earth, 10: 1–97.
Kasahara, K. (1963). Computer program for a fault-plane solution. Bull. Seism. Soc. Am., 53: 1–13.
Kawasumi, H. (1937) . An historical sketch of the development of knowledge concerning the initial motion of an earthquake. Bureau Central Séismologique International, Ser. A, Travaux Scientifiques, Strasbourg, 15: 1–76.
Keilis-Borok, V. I. (1956). Methods and results of the investigations of earthquake mechanism. Bureau Central Séismologique International, Ser. A, Travaux Scientifiques, Strasbourg, 19: 383–394.
Keilis-Borok, V. I., V. F. Pisarenko, J. I. Pyatetskii-Shapiro, and T. S. Zhelankina (1972). Computer determination of earthquake mechanism. In V. I. Keilis-Borok, ed., Computational Seismology. Plenum, New York, 32–45.
Knopoff, L. (1961a). Analytical calculation of the fault-plane problem. Publ. Dominion Obs., 24: 309–315.
——— (1961b ). Statistical accuracy of the fault-plane problem. Publ. Dominion Obs., 24: 317–319.
Koning, L. P. G. (1942). On the mechanism of deep-focus earthquakes. Gerl. Beitr. Geophys., 58: 159–197.
Nakano, H. (1923). Notes on the nature of the forces which give rise to the earthquake motions. Seism. Bull. Centr. Met. Obs. Japan , 1: 92–120.
Omori, F. (1905). Similarity of seismic motions originating at neighboring centers. Earthquake Invest. Com. Publ. (Tokyo), 21: 9–52.
Pope, A. J. (1972). Fiducial regions for body wave focal plane solutions. Geophys. J. R. Astr. Soc., 30: 331–342.
Ritsema, A. R. (1952). Over diepe aardbevingen in de Indische Archipel. Doctoral thesis, Rijks, Universiteit Utrecht, Utrecht, 1–132.
——— (1955). The fault-plane technique and the mechanism in the focus of the Hindu-Kush earthquakes. Indian J. Meteorol. Geophys., 6: 41–50.
——— (1958). (i , D )-curves for bodily seismic waves of any focal depth. Verhandl. 54, Inst. Meteor. Geofis., Djakarta.
——— (1964). Some reliable fault-plane solutions. Pure and Appl. Geophys., 59: 58–74.
Rothé, E., and E. Peterschmitt (1938). Nature des sécusses séismiques: Compressions et dilations. 71 Congrès des Soc. Savantes, 113–117.
Scheidegger, A. E. (1957). The geometrical representation of fault-plane solutions of earthquakes. Bull. Seism. Soc. Am., 47: 89–110.
Somville, O. (1925). Sur la natur de l'onde initiale des téléséismes en registrés a Uccle de 1910 à 1924. Bureau Central Séismologique International, Ser. A, Travaux Scientifiques, Strasbourg, 2: 65–76.
Stauder, W. (1962). The focal mechanism of earthquakes. Advances in Geophysics, 9: 1–76.
Stauder, W., and A. Udías (1963). S-wave studies of earthquakes of the north Pacific, Part II: Aleutian Islands. Bull. Seism. Soc. Am., 53: 59–77.
Udías, A., and D. Baumann (1969). A computer program for focal mechanism determination combining P and S wave data. Bull. Seism. Soc. Am., 59: 503–519.
Udías, A., E. Buforn, D. R. Brillinger, and B. A. Bolt (1982). Joint statistical determination of fault plane parameters. Phys. Earth Planet. Inter., 30: 178–84.
Walker, G. W. (1913). Modern Seismology. Longmans, Green, London.
Wickens, A. J., and J. H. Hodgson (1967). Computer re-evaluation of earthquake mechanism solutions (1922–1962). Publ. Dominion Obs., 33: 1–560.
Sixteen—
Deterministic and Stochastic Approaches in Seismogram Analysis
Keiiti Aki
Introduction
Looking back on the last 100 years of modern seismology, one is most impressed by the great contrast between the complexity of the first observed seismogram, obtained in 1881 (fig. 1), and the simplicity of the first synthetic seismogram, calculated by Lamb in 1904 for a point source in a homogeneous half space (fig. 2). The observed seismogram is much richer in complexity, and therefore in information, than the calculated one. This complexity has made seismology a vital branch of the earth sciences. If Lamb's synthetic seismogram had well explained the observed seismogram, we would probably not be celebrating the centennial anniversary of the University of California, Berkeley, Seismographic Stations.
There have been two successful approaches in investigating observed complex seismograms. One is based on a deterministic model and the other on a stochastic model. Let us first briefly review some successful applications of both approaches.
Successful Deterministic Approaches
An example of a successful deterministic approach in seismology is long-period seismology, in which the complex effect of small-scale heterogeneity is smoothed out by low-pass filtering in the time domain.
Another example is CDP (or CMP) stacking combined with wave-equation migration used in analyzing reflection seismograms obtained by a dense array of sensors placed on the surface of the Earth. The migration procedure is based on the wave equation for a smooth Earth model, usually a homogeneous medium, and its success is due to the elimination of complex
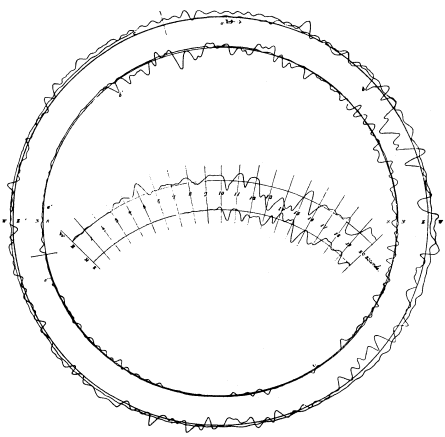
Figure 1
A record, obtained with Ewing's horizontal pendulum seismograph, of a strong
local earthquake on March 8, 1881 (reproduced from 1884 issue of Nature, 30:
174). Two of the pendulums write on the same surface. The recording plate
revolves continuously and is stopped after an earthquake. The beginning of the
earthquake is marked as a , á (about 90° apart), respectively, on the EW and
NS traces. In the center, the traces have been aligned on a common time scale.
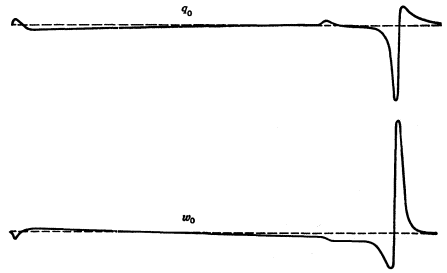
Figure 2.
The first synthetic seismogram due to Lamb (1904) for a point force in a
homogeneous half-space. Upper and lower curves are horizontal and
vertical displacements, respectively.
effects of small-scale heterogeneities by suppressing high-slowness waves using low-pass filtering in the space domain.
A dangerous consequence of successes in long-period seismology and reflection seismology is that they tend to makes us believe that the Earth is smooth, when actually we are smoothing the observed data. The stochastic modeling approach, on the other hand, tries to accept the Earth as rough.
Successful Stochastic Approaches
A successful example of the stochastic approach is the Wiener-Robinson deconvolution used in the processing of reflection seismograms for many years.
Another example is the w -square scaling law used for predicting strong ground motion for a wide range of magnitude.
The backscattering model of local earthquake coda waves is yet another example of the stochastic modeling approach recently gaining wide acceptance in the seismological community.
A problem with these stochastic modeling approaches is the extremely simple assumptions underlying them. For Wiener-Robinson deconvolution, the reflection seismogram is assumed to be the convolution of white noise and minimum-phase (or minimum-delay) wavelets. For w -square scaling, the
strong-motion accelerogram is assumed to be band-limited white noise, and large and small earthquakes are self-similar. For coda waves, the coda is assumed to be due to S-wave to S-wave backscattering from randomly distributed weak scatterers throughout the local lithosphere.
Need for Both Approaches
Thus, in both the deterministic and stochastic approaches, we simplify nature. In the former, we smooth out the complexity in observed data by low-pass filtering in time and/or space, and in the latter, we make simplified assumptions about the nature of small-scale heterogeneities in our Earth model.
I have been involved with many students and colleagues in studies using both approaches and feel strongly that both are needed for a healthy future development of seismology. The deterministic approach gives more definitive results when applied to properly filtered data but tends to give unreliable and unstable results when applied to data containing the effects of factors not included in the model. The stochastic approach is more robust, and can always give some useful results, but leaves us with the feeling that the results are not final, but temporary, awaiting the ultimate deterministic analysis.
Interestingly, text books on seismology, including my own with Paul Richards (Aki and Richards, 1980), are mostly concerned with the deterministic approach and very little with the stochastic approach. I feel that there is a general belief in the seismological community that the deterministic approach is superior to the stochastic approach.
My main proposition in the present paper is that both deterministic and stochastic approaches equally represent respectable efforts by seismologists to understand complex natural phenomena. I believe the stochastic approach should receive more attention from seismologists, especially young and bright ones (who tend to dislike this approach perhaps because the community as a whole tends to place it below the deterministic approach).
In order to illustrate the points made so far, I shall use the example of coda waves.
Some Recent Results from Coda Wave Analysis
The coda waves of local earthquakes have been studied extensively by a stochastic modeling approach, as summarized in a recent review by Herraiz and Espinosa (1986). The most remarkable feature of coda waves is their independence of the source-receiver path, as demonstrated by Aki (1969), Aki and Chouet (1975), Rautian and Khalturin (1978), and Tsujiura (1978), among others, for various parts of the Earth. To illustrate this independence, figure 3 shows the records of a local earthquake recorded by the NORSAR
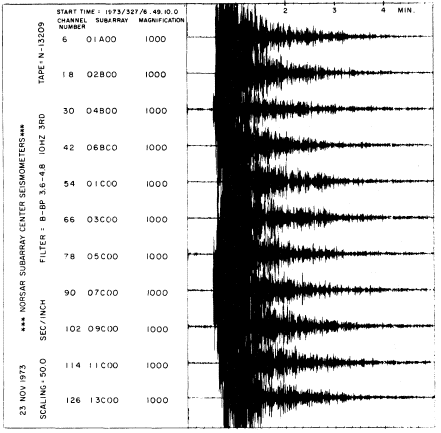
Figure 3
Short-period (band pass from 3.6 to 4.8 Hz) records of a local earthquake at
various subarray centers of the NORSAR array. The epicentral distance is a
few kilometers to the closest subarray and more than 100 km to the farthest.
The decay of coda amplitude shows no dependence on the distance between
the earthquake source and seismograph station.
array with an aperture of about 100 km. The epicentral distance is a few kilometers from the closest subarray and more than 100 km from the farthest. The direct P- and S-waves (not recognizable in fig. 3) do, of course, vary strongly among the subarrays, but the amplitudes of the coda waves and the manner of their decay are roughly the same for all subarrays, despite the great differences in source-receiver distance.
The above simple and clear observation demands explanations. A deterministic modeling of coda waves, however, is impossible because we don't know the details of small-scale heterogeneity in the Earth that may be affecting observed coda waves.
The above observation can be explained if coda waves are backscattered waves from heterogeneities distributed randomly throughout the lithosphere. Assuming further that they are due to single S-to-S backscattering, Aki and Chouet (1975) obtained the power spectrum of coda waves at a lapse time t (measured from the origin time) for the case of coincident source and receiver
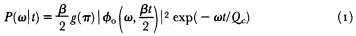
where ß is the S-wave velocity, g (p ) is the backscattering coefficient, ø0 (w , r ) is the Fourier transform of primary S-waves observed at a distance r from the source location, and Qc is the apparent quality factor obtained by fitting equation (1) to the observed envelope of coda waves. If the assumption of S-to-S single scattering is correct, Qc should be equal to Qß of direct shear waves, which was confirmed, at least for Japan, by Aki (1980).
Singh and Herrmann (1983) estimated Qc at 1 Hz in the continental United States and found a very strong positive correlation between Qc –1 and regional tectonic activity. Their spatial resolution for the Qc–1 measurement, however, was limited to about 1,000 km because they used the time window from about 100s to 1,000 s due to the great distance between the epicenter and the station. Because of this poor spatial resolution, areas, such as New Madrid and Charleston, with historic seismicity could not be identified as low-Q areas.
To study the relationship between Q–1 and historic seismicity, we need higher spatial resolution than 1,000 km for the Q–1 measurement, as well as better seismicity records. China has one of the most complete catalogs of historic earthquakes and relatively uniform and dense distribution of local seismic stations.
Jin and Aki (1987) applied Herrmann's (1980) method of determining Qc to more than 1,000 seismograms from local earthquakes near eighty-two stations distributed throughout China. The resultant Qc value at 1 Hz is plotted at each station in figure 4, where contours of constant Qc are drawn for Qc = 100, 200, 400, 600, and 1,000. The resultant contour map of Qc divides the mainland of China into several high-Q and low-Q regions. This map shows much more detailed variation of Qc than that obtained by Singh and Herrmann (1983) for the United States, because the latter is based on the coda data for the lapse-time window from 100 s to 1,000 s, while the map for China is based on the coda data for the lapse-time window up to about 100 s.
The contour map of Qc is compared with epicenters of major earthquakes (M > 7 ) in figure 5. We find a very strong correlation between them: seismically active regions such as Tibet, western Yunnan, and northern North China correspond to low-Q regions, and stable regions such as the Ordos plateau, middle-east China, and the desert in southern Xinjiang have very high Q.
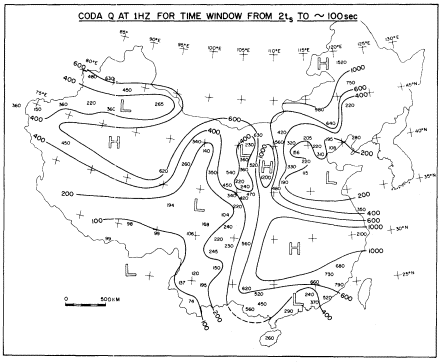
Figure 4
The values of Q c in mainland China at 1 Hz from the time window from
twice the S travel time to about 100 s, and the contours of constant Qc
for Qc = 100, 200, 400, 600, and 1,000.
Two different symbols are used to distinguish earthquakes that occurred before 1700 from those that occurred after 1700. As is well known among Chinese seismologists, there has been a migration of epicenters from west to east during the last 300 years in North China. It is interesting to note that current Q values for the region active before 1700 are about twice as high as those for the region currently active. This result suggests that the low-Q region might have migrated together with the high seismicity. This suggestion has been confirmed by the Q value estimated by Chen and Nuttli (1984) using the map of intensity decay. Jin and Aki (1987) found that the Q value measured from the intensity decay for an earthquake that occurred before 1700 in the northern North China area was indeed about half the current Q value measured by the coda method.
Thus, the analysis of coda waves by a stochastic modeling approach leads to an extraordinary finding that the Q value changed by a factor of two in about three hundred years.
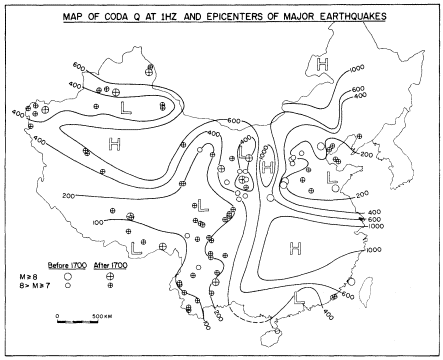
Figure 5
Map of Qc at 1 Hz and epicenters of major earthquakes with M > 7. Different
symbols are used for earthquakes that occurred before and after 1700.
Discussion and Conclusions
The above example of coda wave analysis illustrates both strong and weak points of the stochastic modeling approach. First, these results, which are of tremendous importance for long-term earthquake hazard mitigation planning, could not be obtained by a deterministic approach without a major experimental and analysis program requiring great time and manpower. With stochastic modeling, the map of Q values was obtained by one person (Anshu Jin) in a year or so using existing data. This quickness and relative ease (by no means easy for Anshu Jin who had to analyze records at each of the eighty-two stations), make people suspicious of the results. If the same map was constructed by a ten-year effort of 100 scientists using a deterministic approach, more people would believe the result. This is the frustration with the stochastic modeling approach. It must await the broad acceptance of its results until the deterministic approach proves them.
In the meantime, however, this quick and easy approach may find solutions for difficult problems, such as earthquake prediction, much sooner than
a deterministic approach alone. Life is short, and when you get older you tend to become more appreciative of the stochastic modeling approach.
Acknowledgment
This work was supported in part by the U.S. Geological Survey under grant 14-08-0001-G1381.
References
Aki, K. (1969). Analysis of the seismic coda of local earthquakes as scattered waves. J. Geophys. Res., 74: 615–631.
——— (1980). Attenuation of shear waves in the lithosphere for frequencies from 0.05 to 25 Hz. Phys. Earth Plan. Inter., 21: 50–60.
Aki, K., and B. Chouet (1975). Origin of coda waves: Source, attenuation and scattering effects. J. Geophys. Res., 80: 3322–3342.
Aki, K., and P. G. Richards (1980). Quantitative Seismology, Theory and Methods. W. H. Freeman, San Francisco.
Chen, P., and O. W. Nuttli (1984). Estimates of magnitudes and short-period wave attenuation of Chinese earthquakes from modified Mercalli Intensity data. Bull. Seism. Soc. Am., 74: 957–968.
Herraiz, M., and A. F. Espinosa (1986). Scattering and attenuation of high-frequency seismic waves: Development of the theory of coda waves. U.S. Geol. Surv. Open-file Report 86–455, 1–92.
Herrmann, R. E. (1980). Q estimates using the coda of local earthquakes. Bull. Seism. Soc. Am., 70: 447–468.
Jin, A., and K. Aki (1987). Spatial correlation of coda Q with the long-term seismicity in China: Implication to the eastern and central U.S. long-term seismicity. Presented at the annual meeting of the Seismological Society of America, Santa Barbara, California, March 24–27, 1987.
Lamb, H. (1904). On the propagation of tremors over the surface of an elastic solid. Phil. Trans. R. Soc. London, A203: 1–42.
Rautian, T. G., and V. I. Khalturin (1978). The use of coda for determination of the earthquake source spectrum. Bull. Seism. Soc. Am., 68: 923–948.
Singh, S. K., and R. B. Herrmann (1983). Regionalization of crustal coda Q in the continental United States. J.Geophys. Res., 88: 527–538.
Tsujiura, M. (1978). Spectral analysis of the coda waves from local earthquakes. Bull. Earth. Res. Inst., Tokyo University, 53: 1–48.
Seventeen—
Some Examples of the Statistical Analysis of Seismological Data
David R. Brillinger
"Data! data! data!" he cried impatiently, "I can't make bricks without clay."
Sherlock Holmes
—A. Conan Doyle, The Adventure of the Copper Beeches (1892)
"Mr. . . . has joined the society, and, like many engineers, is interested in the possible effects of earthquakes. . . . These men want to know the seismicity of given places. The Lord help them!"
If the engineers of the county will cooperate with the Seismological Society of America in the effort to gather and publish data regarding earthquakes, the Seismological Society of America will gladly undertake to get them some help here on this earth.
—Seismological Notes (1911, p. 185)
Introduction
A subject that has been called statistical seismology has too few researchers but a number of success stories to its credit. Vere-Jones and Smith (1981) reviewed much of the work in the subject up to 1980. This presentation concentrates on some themes of contemporary statistics that seem of some relevance to the seismological circumstance. The examples of their use are based principally on the work of my students and myself.
That statistics is important in seismology seems self-evident. This was recognized very early on. Rothé (1981) recorded that part of the program of the 1891 Tokyo Earthquake Investigation Committee was
To draw up a list of shocks with dates and times for each phase; to study the distribution of earthquakes in space and time; to study possible relations with the seasons, the phases of the moon, meteorological conditions, etc.
These are all data sets ripe for statistical analysis. It may be mentioned generally that there are massive seismological data sets, that uncertainty abounds, and that there are floods of hypotheses and inferences. Earthquake prediction is in the public mind. Seismology is also important to statistics. This results in part from the field's remarkable generosity in making data sets available and from the intriguing formal problems it raises.
The foremost researcher in statistical seismology has to be Harold Jeffreys. His research altered the field of both seismology and statistics in major
fashions. His working attitude is illustrated by the remarks: ". . . I have been insisting for about twenty years that the claim of finality for any scientific inference is absurd" (Jeffreys, 1939) and "The uncertainty is as important a part of the result as the estimate itself. . . . An estimate without a standard error is practically meaningless" (Jeffreys, 1967).
Of Jeffreys's work, Hudson (1981) has written: "The success of the Jeffreys-Bullen travel time tables was due in large part to Jeffreys's consistent use of sound statistical methods."
The part of Jeffreys's work that has perhaps affected statistics the most is his development of robust/resistant techniques for handling nonnormal and bad data. Other scientists whose work has had major impact on seismological statistics include: Keiiti Aki, Bruce Bolt, Allin Cornell, Yan Kagan, Vladimir Keilis-Borok, Leon Knopoff, Bob Shumway, John Tukey, and David Vere-Jones. More recent contributors include Daniele Veneziano and Yosihiko Ogata.
Likelihood-Based Procedures
In the statistical approach to data analysis it is usual to view observations as realizations of random variables. Important to that approach is the notion of likelihood. If the (multivariate) observation (Y1 , . . ., Yn ) is assumed to come from a random variable with probability function p (y1 , . . . ,yn | q ), depending on the unknown parameter q , then the likelihood function of q given the observation is defined to be
Employing likelihood-based inference procedures handles and unifies a variety of problems. The procedures are often highly efficient. There are corresponding estimation, testing, and confidence procedures, (referring back to the second Jeffreys's quote). Results derived from different data sets may be combined routinely
In applications, the approach is to set down a likelihood based on a conceptual model of the situation at hand. As an example of employing a likelihood procedure, consider the problem of estimating the seismic moment and stress drop of a particular event given a particular seismogram. For a variety of source models, researchers have related the seismic moment and stress drop to characteristics of the amplitude spectrum, |W (w )|, (that is, the modulus of the Fourier transform of the signal). Suppose that the seismogram is written

where u is the signal, q is an unknown parameter and Î is the "noise." If W (w ;q ) denotes the Fourier transform of u (t ;q ), then what is given, from the
source model, is the functional form of |W (w;q) |. Following Brune (1970), common forms (for displacement measurements) include

where q = {a, b,wo }, are the parameters to be estimated. Estimates of the seismic moment and stress drop may be determined once estimates of a and w0 are available. The practice has been to estimate the unknowns graphically from a plot of the modulus of the empirical Fourier transform, |dTY (w )|, where
0 £ w£p . The following likelihood-based procedure was suggested in Brillinger and Ihaka (1982) and developed in detail in Ihaka (1985).
When the asymptotic distribution of |dTY (w )| is evaluated for the case of stationary mixing Î (t ), it is found to depend on |W (w;q )| and fÎÎ (w ) alone, where fÎÎ (w ) is the power spectrum of the noise. Hence, given an expression only for the modulus of W , one can proceed to estimate q . For the model (1), and small noise, one has

showing variation around |W | independent of |W |. However, when deviations of |dTY | from a fitted version of itself are plotted versus the fitted values, dependence of the error on |W | is apparent. An example is provided in figure 1. This is the result of computations for an earthquake of magnitude 6.7 that occurred in Taiwan on 29 January 1981. The data were recorded by one of the instruments of the SMART 1 array (Bolt et al., 1982). The top graph of the figure provides the transverse S-wave portion of the recorded accelerations. The lower graph provides the deviations plot just referred to. This plot suggests that the noise is in part "signal generated."
Various physical phenomena can lead to signal-generated noise. These include multipath transmission, reflection, and scattering. The following is an example of a model that includes signal-generated noise.
where t k are time delays, u H is the Hilbert transform of u , g k , dk like a and b above, are parameters to be estimated reflecting the vagaries of the transmission process, and Î (t ) is unrelated noise. The inclusion of the Hilbert transform allows the possibility of phase shifts. Assuming g k , dktk are random, and evaluating the large sample variance, one is led to approximate the distribution of the discrete Fourier transform values, Yj = dTY (w j ) by a complex normal with mean W (wj ;q ) and variance

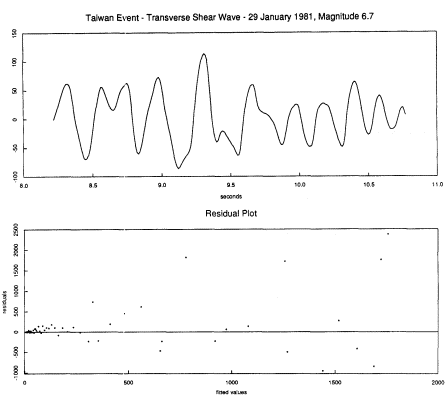
Figure 1
The top graph provides the computed transverse shear wave component derived
from data recorded by the SMART 1 array. The bottom graph provides residuals,
that is, the difference between the absolute values of the empirical Fourier transform
values and their mean values determined from the final fitted values. These
are plotted against the fitted values. Wedging is apparent.
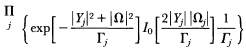
that the expectations of gk and dk are zero, and that the process tk is Poisson. The ratio r2 /s 2 measures the relative importance of signal-generated noise. In the likelihood approach one proceeds to estimate q by deriving the marginal distribution of the |Yj | and then setting down the likelihood. This likelihood when evaluated is found to be approximately
where I0 denotes a modified Bessel function. Figure 2 shows a fit of the model
Once estimates of a , w0 are at hand, they may be converted to estimates of
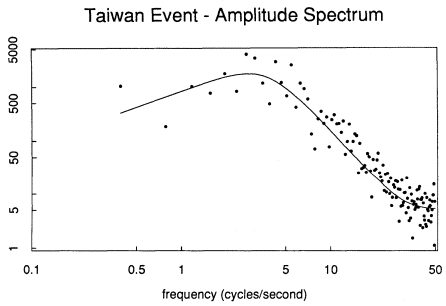
Figure 2
The plotted points are the absolute values of the discrete Fourier
transform of the data of figure 1. The smooth curve is the result of
fitting the Brune-type model |w | / [1 + (w /w 0 )4 ]
the seismic moment and stress drop via the theoretical relationships that have been developed. Uncertainty measures are directly available for the estimates. Details of this technique and a study of its theoretical properties may be found in the thesis of Ihaka (1985).
Borrowing Strength
"Borrowing strength" is the colorful term John Tukey has introduced for the class of statistical procedures that seek to improve on naive estimates by incorporating data from parallel but formally distinct circumstances. These procedures also go under other names, such as pooling, random effects, James-Stein, shrinkage, empirical Bayes, and Bayes. The technique of damped regression provides an example most known to seismologists. Of the notion generally, Mallows and Tukey (1982) have remarked: "Knowing when to borrow and when not to borrow is one of the key aspects of statistical practice." A popular account of "improved" estimates is given in Efron and Morris (1977). The case of the linear model is developed, with examples, in Dempster et al. (1981).
To begin with a simple example, suppose that one wishes to estimate the mean µi of a population i , and one has available the mean

values from that population. Then the naive estimate of µi is


for some q lying between 0 and 1. One would like to choose q to be near 1 if

with the Îi , say, independent variates with mean 1 and variance t2 , and the Îij independent variates with means o and variance s2 . Then, for the case of samples all the same size, J , the "best" linear unbiased estimate of µi = µ + Î i is given by expression (2) with
In the case that t is zero, q is 0, and the estimate is
As an example of what is involved here, consider the problem of developing attenuation relationships. Quite a variety of specific functional forms, involving a finite number of real-valued parameters, have been set down. For example, Joyner and Boore (1981) develop the relationship

for (mainly) western United States earthquakes with A peak horizontal acceleration, with M moment magnitude, and with d closest distance to the surface fault rupture in kilometers. To prevent earthquakes with many recordings from dominating the estimates, Joyner and Boore carried out the fitting in two stages. First magnitude was not included in the model, but an event constant was. Then the event constant estimates were regressed on magnitude to obtain the term – 1.02 + 0.249M. There were 23 events and 182 records in all.
One may obtain "improved" estimates as follows. The Joyner-Boore functional form will be retained. Let the subscript i index the event, and j index the record within the event. Consider the (random effects) model

where ai , bigidiI = 1, . . . , , are independent realizations of random variables with means ma,m bmgmd and variance

| |||||||||||||||||||||||||||||||||
The Îij are independent noises with mean 0 and variance s2 . This model ties together the events, but each event has its own a , b , g , d . (The usual nonlinear regression model corresponds to sa , sb , sg , sd. identically 0.) Implications of this model are that records for the same event are correlated and that the disparate numbers of records for the events are handled automatically. Assuming that the random variables involved are normal, the model can be fit by maximum likelihood (employing numerical quadrature as needed). The results are provided in table 1. In some cases, for example sa, sd there is a clear suggestion that the corresponding population parameter may be 0.
Once fit, model (3B) may be used, for example, for obtaining "improved" estimates of the attenuation behavior of the individual events. Consider for example the 1979 Imperial Valley aftershock. The data for this event are the points plotted in figure 3. Also plotted, as the curve of short dashes, is the result of fitting the Joyner-Boore functional form to the data for this event alone. Clearly, this curve is not too useful away from the cluster of observations. It has high uncertainty as well.
The solid curve graphed is the estimate of

with subscript 0 referring to this particular event. One has obtained a much more reasonable curve. This curve would be of use if one wished to estimate, a posteriori, an acceleration experienced in the Imperial Valley aftershock at a specified distance from the epicenter, for example to relate it to damage experienced at that distance.
The curve of long dashes in figure 3 is the Joyner-Boore curve, equation
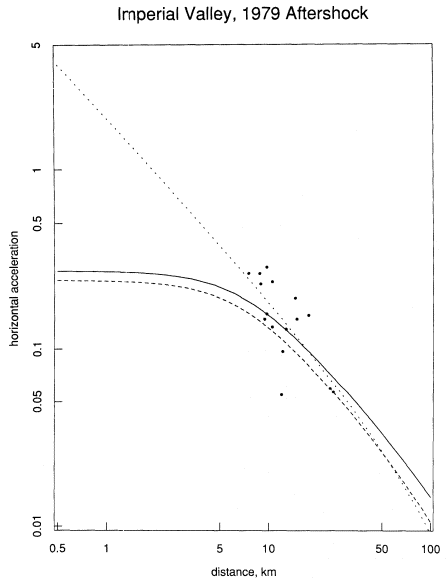
Figure 3
Points plotted are observed accelerations at the indicated distances. The curve
of short dashes is the result of fitting the Joyner-Boore functional form to
these data points only. The curve of long dashes is the curve developed by
Joyner and Boore using the data set of twenty-three events. The solid curve
is the "improved" estimate developed from expression (4) and the model (3B).
(3A). It is not inappropriate. A thing to note however is that the Joyner-Boore curve is the same for all events of the same magnitude, here M0 = 5.0. It does not take special note of the actual data for the event.
Figure 4 provides "improved" estimates for three other events. In each case, the improved estimates (solid curves) are plotted, as well as the Joyner-Boore (dashed) curves given by equation (3A). The general effect of borrowing strength here, and typically, has been to provide a curve lying nearer to the mass center of the points observed in the particular event of concern. Of particular note is the case of the 1957 Daly City event where but one observation was available. One could not sensibly fit a curve to that data point alone. The Joyner-Boore curve has some validity. The "improved" curve pulls the Joyner-Boore shape nearer to the available observation. In the case of the 1979 Imperial Valley event the two curves are very close to each other. This is the case with the most observations (38).
Nonparametric and Semiparametric Estimation
Traditionally, the formal theories of statistical estimation were directed at cases involving a finite dimensional parameter. Exceptions consisted mainly of the cases of histograms and power spectral density estimates. Another exception was provided by the various curve estimates developed by seismologists, particularly Jeffreys, to deal with travel-time data (which correspond to a problem of infinite dimensional regression analysis, albeit one with a multivalued regression function). Recently, statisticians have turned to the problem of curve estimation in broad general situations. Problems studied include: estimation of a nonparametric transformation of the dependent variable, transformations of variates involved in quantal models, and (semiparametric) situations involving both finite and infinite dimensional parameters. In some cases the estimates are based on likelihoods, are adaptive, and may be anticipated to be highly efficient. References, with discussion, to statistical aspects of this work, are Breiman and Friedman (1985) and Hastie and Tibshirani (1986). Wegman (1984) is a survey article on some aspects.
As an example of what is involved here, return to the problem of developing attenuation relationships. Above, the Joyner-Boore functional form

was employed. Some theory suggests the use of the log and square root transformations in such a relationship; however, the theory is not definitive, and variants of equation (5) have been proposed.
These days one can often turn to a nonparametric analysis, estimating general transformations from the data. In Brillinger and Preisler (1984), monotonic functions q , ø , and y were estimated for a relationship
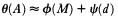
Figure 4
Observed accelerations are plotted for the four indicated events. The solid curve
is the "improved" estimate, while the dashed curve is that of Joyner and Boore.
In determining such functions, critical assumptions were that the functions were smooth and the relationship additive. The formal model fit was
with i indexing an event and j a record within an event. The model was fit by a variant of the ACE procedure of Breiman and Friedman (1985). Figure 5 presents the results, namely the estimated functional transformations, q,ø , y , for the Joyner-Boore data. The transformation of magnitude is essentially linear. The general transformation of amplitude found is nearer to a cube root than a logarithm. The transformation of distance decays in a steady manner, as might have been anticipated.
From these curves one can obtain broadly applicable, predicted values of acceleration corresponding to specified magnitudes and distances.
Other Topics
Had time and space allowed, other topics that would have been reviewed include: general procedures for uncertainty estimation (such as the jackknife and the bootstrap), dimensionality estimation procedures (such as Akaike's information criterion), adaptive techniques, modeling incomplete data (or biased sampling), regression diagnostics, influence measures, and techniques for analyzing quantal data.
A Concluding Remark
I end with a personal comment, based on a "noncollaboration" with a seismic researcher. A year or so ago, a young geologist came to see me because he had been advised that I might be able to help in computing uncertainties attached to some risk figures he had prepared. Happy to oblige was my feeling; however, as we talked, it became a highly frustrating business for both of us. As we tried to establish a common language it turned out that we really did not have an operational one. He had never taken any sort of statistics course. His problem was a hard one, so subtle techniques were called for. Sadly that is where the matter ended. Had he been at Berkeley, steady contact would have allowed a continuation, but he was not. There is no denying that there is much material that earth scientists have to be expert in. However, I would hope that statistics could be more routinely included in the list.
Acknowledgments
This research was carried out with the partial support of NSF Grant MCS-8316634. It has benefited substantially from many discussions on the statis-
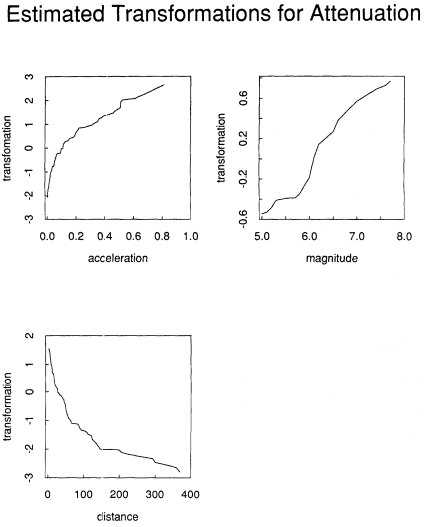
Figure 5
Estimated monotonic transformations of acceleration, magnitude, and
distance providing the "best" additive relationship of acceleration in terms
of magnitude and distance for the Joyner-Boore data set.
tical analysis of seismological data with Bruce Bolt and David Vere-Jones through the years. I thank them for all the help and encouragement they have provided.
I thank Bob Darragh for preparing the Smart 1 data record for analysis.
References
Bolt, B. A., Y. B. Tsai, K. Yeh, and M. K. Hsu (1982). Earthquake strong motions recorded by a large near-source array of digital seismographs. Earthquake Engin. Structural Dynamics, 10: 561–573.
Breiman, L., and J. H. Friedman (1985). Estimating optimal transformations for multiple regression and correlation. J.Am. Statist. Assoc., 80: 580–597.
Brillinger, D. R., and G. R. Ihaka (1982). Maximum likelihood estimation of source parameters. Earthquake Notes, 53: 39–40.
Brillinger, D. R., and H. K. Preisler (1984). An exploratory analysis of the Joyner-Boore attenuation data. Bull. Seism. Soc. Amer., 74: 1441–1450.
Brune, J. N. (1970). Tectonic stress and the spectra of seismic shear waves from earthquakes. J . Geophys. Res., 75: 4997–5009.
Dempster, A. P., D. B. Rubin, and R. K. Tsutakawa ( 1981). Estimation in covariance components models. J. Am. Statist. Assoc. 76: 341–353.
Efron, B., and C. Morris (1977). Stein's paradox in statistics. Scientific American, 236: 119–127.
Hastie, T., and R. Tibshirani (1986). Generalized additive models. Statistical Sci., 3: 297–309.
Hudson, J. A. (1981). Mathematics for seismology. J . Inst. Math. Appl., 17: 34–39.
Ihaka, G. R. (1985). Ruaumoko. Ph.D. Diss., Statistics Dept., University of California, Berkeley.
Jeffreys, H. (1939). The times of P, S and SKS, and the velocities of P and S. Mon. Not. R. Astr. Soc. Geophys., Suppl. 4: 498–547.
——— (1967). Statistical methods in seismology. In K. Runcorn, ed., International Dictionary of Geophysics. Pergamon, London, 1398–1401.
Joyner, W. B., and D. M. Boore (1981). Peak horizontal acceleration and velocity from strong-motion records including records from the 1979 Imperial Valley, California, earthquake. Bull. Seism. Soc. Am., 71: 2011–2038.
Mallows, C. M., and J. W. Tukey (1982). An overview of techniques of data analysis emphasizing its exploratory aspects. pp. 111–172 In J. Tiago de Oliveira and B. Epstein, eds., Some Recent Advances in Statistics. Publicacoes do II Centenario da Academia das Ciencias de Lisboa, Portugal.
Rothé, J-P. (1981). Fifty years of history of the International Association of Seismology (1901–1951). Bull. Seism. Soc. Am., 71: 905–923.
Vere-Jones, D., and E. G. C. Smith (1981). Statistics in seismology. Commun. Statist. Theor. Meth., A10(15): 1559–1585.
Wegman, E. J. (1984). Optimal nonparametric function estimation. J.Statistical Planning and Inference, 9: 375–387.
Eighteen—
Seismic Energy, Spectrum, and the Savage and Wood Inequality for Complex Earthquakes
Kenneth D. Smith, James N. Brune, and Keith F. Priestley
Introduction
As a result of calculations of energy radiation from a deterministic fault model, Haskell (1966), introduced a statistical model of fault rupture to better represent the irregular motions observed on strong-motion records (Housner, 1947, 1955; Thompson, 1959) and the observed generation of high-frequency energy from earthquakes with large source dimensions. An extension of this model was introduced by Aki (1967). In his model, Haskell (1966) visualized the actual faulting process as a swarm of acceleration and deceleration pulses arising from the variations in the elastic properties along the fault. These pulses propagate along the fault with some mean velocity but are highly chaotic in detail. Depending on the spatial and temporal correlation length of these pulses, this model can have a far-field displacement amplitude spectral falloff, beyond the corner frequency, proportional to w –1 (spatial correlation length much larger than time correlation wavelength) or to w–3 (spatial correlation length comparable to time correlation wavelength).
Approaching the problem from a different point of view, Brune (1970) introduced a fractional-stress-drop model to represent abrupt fault locking or healing, or nonuniform stress drop like a series of multiple events with parts of the fault remaining locked, in either case causing the fault to have less slip than if a uniform static stress drop over the whole fault equaled the dynamic stress drop. Aki (1972) characterized this process as a series of "rapid slips and sudden stops." In the Brune model the fractional stress drop introduces an w–1 slope in the displacement amplitude spectrum beyond the corner frequency, and thus leads to considerably more high-frequency energy than for an w–2 falloff model with the same seismic moment and source dimension. This effect is of great importance in determining the level of strong
ground motion during large earthquakes. Some more recent models of earthquakes have incorporated similar features, for example, the asperity models of Hartzell and Brune (1977) and McGarr (1981), the barrier model of Papageorgiou and Aki (1983), and the complex multiple-event models of Joyner and Boore (1986) and Boatwright (1988).
The shape of the spectrum beyond the corner frequency is obviously important to calculations of the total radiated energy. The total radiated energy is given by an integral of the square of the far-field velocity spectrum over frequency. On the one hand, if the displacement amplitude spectrum falls off as w –2 , the velocity spectrum falls off as w –1 , and the velocity-squared spectrum (proportional to energy) falls off as w–2 , so that there is relatively little contribution to the total energy beyond the corner frequency. On the other hand, if the displacement amplitude spectrum falls off as w–1 , the velocity spectrum (and velocity-squared spectrum) is constant, and the contribution to the total radiated energy is proportional to the bandwidth of that portion of the spectrum.
The shape of the spectrum beyond the corner frequency is of crucial importance to the Savage and Wood (1971) hypothesis, or inequality, in which the apparent stress is always less than half the stress drop. Since the apparent stress is proportional to the total radiated energy, it is obviously directly related to the existence of an w–1 band in the displacement amplitude spectrum. In fact, we show in the next section that the Savage and Wood (1971) hypothesis is violated directly in proportion to the width of the w–1 section of the amplitude spectrum for equidimensional faults.
The empirical evidence for an w–1 band in far-field earthquake displacement spectra remains subjective, but more data from high dynamic range, broadband digital seismographs may soon provide more objective evidence. In a recent article, Brune et al. (1986) gave some preliminary evidence from the Anza, California, seismic array (Berger et al., 1984) that displacement spectra from small, low-stress-drop earthquakes behave in this way, thus offering some support for the partial-stress-drop model for small-stress-drop events. However, the critical frequencies involved were so high that uncertainties in attenuation leave the results in question (Anderson, 1986). Similar weak support for an w –1 band is reported by Anderson and Reichle (1987) in a study of small aftershocks of the Coalinga earthquake recorded on the Parkfield strong-motion array. One study (Tucker and Brune, 1974) of the displacement of larger earthquakes (ML equal 4 to 5) provides evidence for a band of w–1 spectral falloff that does not suffer from the uncertainties that affect studies of smaller earthquakes. Unfortunately Tucker and Brune had only two observing stations so that their results are not as reliable as, for example, would be the case for similar larger events recorded on the Anza array, with ten high-quality digital stations.
Vassiliou and Kanamori (1982) have published results from a study of
energy estimates based primarily on teleseismic body-wave pulse shapes recorded on long-period WWSSN instruments, which could not give reliable estimates of high-frequency radiated energy. However, on the basis of strongmotion records from four earthquakes they argued that most of the radiated energy in the near field was adequately represented in the far-field longperiod pulse shapes. In this paper we reconsider two of these earthquakes from a different point of view and conclude that significant energy is radiated at frequencies higher than the Haskell corner frequency for the overall dimensions.
In a recent study of the 1978 Tabas, Iran, earthquake, Shoja-Taheri and Anderson (1988) estimated the radiated energy on the basis of near-field strong-motion records. They obtained results one to two orders of magnitude higher than corresponding teleseismic energy estimates based on a procedure developed by Boatwright and Choy (1986). This dramatically illustrates the importance of reconciling near-field and far-field energy estimates. Boatwright (personal communication) has questioned the Shoja-Taheri and Anderson results, in part because of this large discrepancy.
Most recently Priestley and Brune (1987) and Priestley et al. (1988) found strong evidence for the existence of w–1 spectral falloffs for the Mammoth Lakes and Round Valley, California, earthquakes. It was this new evidence from the Mammoth Lakes earthquakes, and the results of a class exercise in estimating the radiated energy for various spectral shapes, that stimulated the present study.
Seismic Energy
Gutenberg and Richter (1942, 1956) proposed the first dynamic measure of the energy radiated by fault rupture. They related the radiated energy to the earthquake magnitude. Magnitude measures are usually based on information from a limited frequency band and do not adequately represent the contributions of all frequencies to the radiated energy. However, integration of the velocity-squared seismogram, in the determination of the radiated seismic energy, does incorporate the entire frequency band.
Wu (1966) derived a simple expression for determining the radiated S-wave energy, which incorporated the S-wave radiation pattern
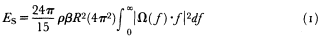
where r is density, ß is the shear wave velocity, R is the hypocentral distance, and W ( f ) is the spectral displacement amplitude according to Brune (1970). Hanks and Thatcher (1972) obtained an analytic solution to the integration of the velocity-squared spectrum in equation (1) for a simple displacement spectrum in which the asymptotes of the constant-amplitude, long-period
level and an w–2 (or f–2 ) high-frequency falloff meet at some (sharp) corner frequency, f0 . The analytic solution of equation (1) for this approximate model is
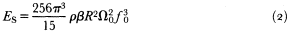
where W 0 is the zero frequency displacement spectral amplitude. Hanks and Thatcher decreased E s by a factor of two in order to be consistent with the energy of the Brune (1970) model. The actual difference is a factor of 1.67, resulting from the fact that the Brune displacement spectrum is rounded at the corner frequency. This illustrates the dependence of the calculation of the seismic energy on the shape of the spectrum near the corner frequency.
Using the following definition of seismic moment M0 (Keilis-Borok, 1957)

and an apparent stress (Wyss, 1970) equal to µEs/M 0 , where µ is the rigidity of the faulted crust, an expression for apparent stress for the Hanks and Thatcher (1972) asymptotic approximation to the Brune (1970) model displacement amplitude spectrum can be developed from equation (2). This expression is
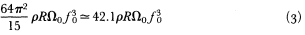
Similarly, the Hanks and Thatcher energy approximation can be recast in terms of seismic moment as
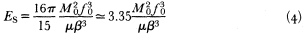
These expressions are of interest because there is some evidence that actual earthquake spectra have a sharper corner than for the Brune (1970) model (Brune et al., 1979). We will discuss the relationship between spectral shape and radiated energy and the reason for selecting a sharp corner model in a later section.
Note that equation (4) was arrived at making no assumptions concerning the relationship of the corner frequency to the source geometry, and the R dependence is now only in the definition of the seismic moment. Equation (4) is similar in form to derivations of Randall (1973) and Vassiliou and Kanamori (1982).
Energy Results for the Savage and Wood, Orowan, and Brune Models
Savage and Wood (1971) propose a faulting model in which the final stress level (S0 in their terminology) is lower than the dynamic frictional stress,
Sf . This results in a static stress drop, S – S0 (where S is the initial stress), greater than the dynamic stress drop, S – Sf . They suggest this "overshoot" results from the momentum of the moving fault block. Savage and Wood (1971) express their model in terms of energy and stress drop, specifically in the ratio of twice the apparent stress to the stress drop. In other words, if
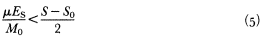
holds, then the final stress, S 0 , is less than the frictional stress, and there is, through their argument, "overshoot" (Savage and Wood, 1971 provide a complete derivation). The apparent stress and the static stress drop are measured quantities. Evaluation of (5) depends on reliable measures of stress drop and radiated energy.
Relationship (5) is the Savage and Wood inequality. Savage and Wood determined ES primarily using the Gutenberg-Richter magnitude-energy (ML – ES ) relationship (with few exceptions) and static stress drops reported in the literature. They concluded that in most cases the apparent stress was significantly less than half the stress drop, in support of an "overshoot" model. We believe that recent, more accurate measures of energy and stress drop, as described later, do not support this conclusion.
Orowan (1960) proposed a faulting model in which the final stress, S0 , is equal to the frictional stress, Sf . In this case, the effective stress is equal to the stress drop, and the radiated seismic energy reduces to
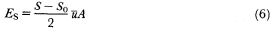
where

In the Brune (1970) model the far-field shear-wave pulse shape is determined by the effective stress, but the spectrum for the far-field pulse accounts for only forty-four percent of the Orowan energy. Most of this difference can be accounted for by the shape of the Brune spectra at the corner frequency, and this leads to a discussion of energy as a function of spectral shapes.
Energy and Spectral Shape
The radiated energy is a function of spectral shape. In particular, the shape of the spectra near the corner frequency and the high frequency spectral falloff control the measure of the radiated energy, since the displacement amplitude spectrum is multiplied by w and then squared. As discussed earlier, Hanks and Thatcher (1972) integrated the w–2 spectral shape, with a sharp corner frequency, to calculate the radiated energy. If we assume a Brune (1970, 1971) relationship between corner frequency and source dimension, do not decrease the integral by a factor of two (that is, depart
from Hanks and Thatcher, 1972, in this respect), and include P-wave energy (one-eighteenth that in the S-wave; Wu, 1966), then eighty-three percent of the Orowan dislocation energy of equation (6) is accounted for. Thus, the w–2 spectral shape, with a sharp corner and a Brune (1970, 1971) relationship between the corner frequency and the source dimension, accounts for nearly all of the dislocation energy.
It is clear that if the spectral falloff at high frequency is steeper than w–2 there will be less radiated energy. For example, average high-frequency spectral falloffs of w –3 account for only forty-eight percent of the Orowan energy, if the corner frequency and source dimension are given by the Brune (1970, 1971) model.
For circular fault rupture and a Brune (1970, 1971) relationship between corner frequency and source dimension, intermediate spectral slopes, w–1 (or w–1.5 ), beyond the inital corner frequency result in higher radiated energies than would be the case for the Orowan model, the amount depending on the bandwidth of this portion of the spectrum. Of course, high-frequency spectral falloffs of w–1 cannot extend to infinite frequencies, since this would imply infinite energies.
In the Brune (1970) model, the bandwidth of the w –1 portion of the spectrum is proportional to the fractional-stress-drop parameter Î, and thus for Î = 0.1 the total radiated energy is about ten times as great as for Î = 1. Similarly, if the parameter

For large strike-slip earthquakes, a rectangular source model is usually more appropriate, since rupture is constrained at depth and extends only in length. The spectrum for a Haskell-type rectangular rupture theoretically results in two corner frequencies (Haskell, 1966; Savage and Wood, 1971), one associated with the length and another with the width of the rupture surface, with the spectrum falling off as w–1 in between. For a constant-stress-drop model, the width controls the amount of slip for a given stress drop. Energies determined by integrating the spectral shape resulting from the rectangular source geometry of the Haskell model are consistent with radiated energies that would result from the Orowan assumption. Thus, if the second (higher) corner frequency is higher than expected for the width of the fault in the Haskell (1966) spectrum, that is, the intermediate slope is longer, then the radiated energy is clearly higher than for the Orowan case, and again the Savage and Wood inequality is violated. Thus, for rectangular sources we will test whether the second corner frequency is higher than predicted for the Haskell model, and for equidimensional sources we will test whether there is any w –1 section in the spectrum.
Data
We have attempted to construct the attenuation-corrected far-field radiated energy spectrum for a number of moderate to large earthquakes. At high frequencies, we have used near-source recordings to minimize the effects of uncertainty in attenuation. At low frequencies, we have used moment constraints based on long-period seismic waves.
Although there have been great improvements in understanding the various factors that affect high-frequency near-source recordings, large uncertainties remain. Recent advances in observing high-frequency weak and strong motions, including down-hole recordings, have opened the possibility of resolving many of these questions. Although vigorous debate continues about the effects of, for example, near-site attenuation and surface-layer amplification, we attempt in this study to present preliminary evidence relating to the question of total radiated energy.
Composite acceleration spectra have been constructed for the following earthquakes: 1940 Imperial Valley (fig. 1a), 1971 San Fernando, California (fig. 1b), 1978 Tabas, Iran (fig. 2a), 1979 Coyote Lake(fig. 2b), 1979 Imperial Valley, California (fig. 3a), 1980 Mexicali Valley (fig. 3b), 1984 Morgan Hill, California (fig. 4a), 1984 Round Valley, California (fig. 4b), and 1985 Michoacan, Mexico (fig. 5). The figure captions include references to the specific acceleration records used in constructing the spectra. Although the discussion of the calculation of radiated energy has been in terms of velocity spectra, acceleration spectra are plotted in figures 1–5. This helps to emphasize the high-frequency component.
These acceleration spectra have been corrected for free-surface effects (a factor of 2), and, for the Imperial Valley events, an additional correction factor of 3.4 has been applied to account for amplification within the thick sedimentary layer (Mungia and Brune, 1984a ). For the acceleration records from other sedimentary sites, a correction factor of 2 has been applied along with the free-surface correction.
For recordings very near to the source, the scaling of the energy with distance, equation (1), has to be modified. The nearest part of the ruptured area may be only several kilometers from the recording site, and the station can be considered to be in the near field. For the Michoacan event we are faced with such a source-receiver geometry and have attempted to account for it by scaling the high-frequency energy contribution appropriately. We have multiplied the integration of the velocity-squared spectrum of the near-field acceleration record by the ratio of twice the rupture area (to account for both sides of the fault) to that of a sphere of radius 10 km, and then assumed that this was the true amount of energy radiated from a point source. We then applied the R2 distance scaling in equation (1) with respect to the distance between the recording site and the fault. The long-period level is not
Figure 1
(a) 1940 Imperial Valley, California. High-frequency level is determined from
the corrected El Centro acceleration spectra; N-S component (Mungia
and Brune, 1984b ). (b) 1971 San Fernando, California. High-frequency level is
determined by the corrected spectra of the transverse component of the Pacoima
Dam accelerogram (Trifunac, 1972). The dashed line represents the high-frequency
level that would result from a corner frequency determined from the fault width
(table 1) for a Haskell (1966) model (Savage and Wood, 1971).
| ||||||||||||||||||||||||||||||||||||||||||||||||||||||||||||||||||||||||||||||||||||||||||||||||||||
Figure 2
(a) 1978 Tabas, Iran. High-frequency level is determined from the corrected
Tabas acceleration spectra; transverse component (Shoja-Taheri and Anderson,
1987). (b) 1979 Coyote Lake, California. High-frequency level is determined from
the corrected spectra of the Gilroy Array No. 1 accelerogram; N40°W horizontal
component (Brady et al., 1980a ). The dashed line represents the high-frequency
level that would result from a corner frequency determined from the fault width
(table 2) for a Haskell (1966) model (Savage and Wood, 1971).
| ||||||||||||||||||||||||||||||||||||||||||||||||||||||||||||||||||||||||||||||||||||||||||||||||||||
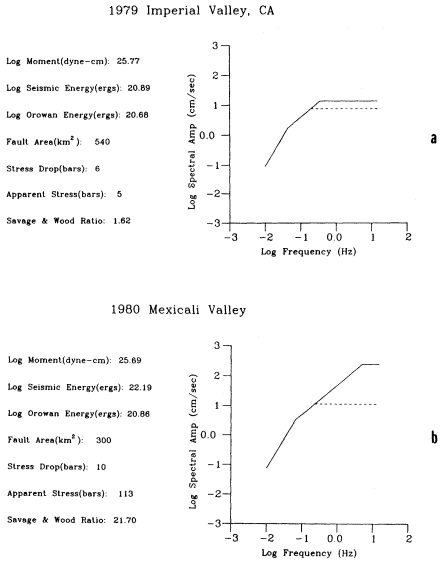
Figure 3
(a) 1979 Imperial Valley, California. The high-frequency level is determined
from the corrected spectra of the Keystone Road El Centro Array accelerogram;
N140°E horizontal component (Brady et al., 1980 b ). (b) 1980 Mexicali Valley,
Mexico. The high-frequency level is determined from the corrected spectra
of the Victoria, Mexico accelerogram; N40°W horizontal component (Mungia
and Brune, 1984a ). The dashed line represents the high-frequency level that
would result from a corner frequency determined from the fault width
(table 3) for a Haskell (1966) model (Savage and Wood, 1971).
| ||||||||||||||||||||||||||||||||||||||||||||||||||||||||||||||||||||||||||||||||||||||||||||||||||||
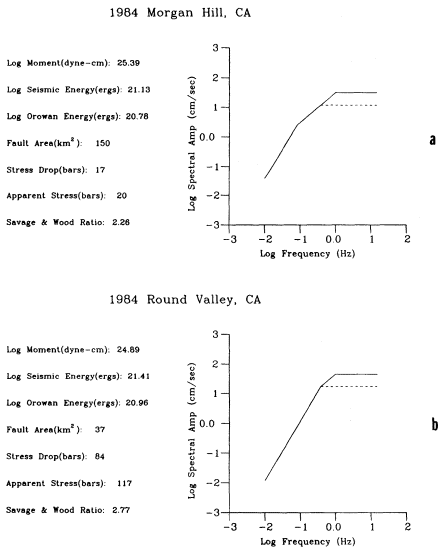
Figure 4
(a) 1984 Morgan Hill, California. The high-frequency level is determined from the
corrected spectra of the Anderson Dam–Downstream accelerogram; N40°W
component (Brady et al., 1984). (b) 1984 Round Valley, California. The high-frequency
level is controlled by the corrected spectra of the Paradise Lodge acceleration record,
and the intermediate slope is determined from long-period body waves; transverse
component of the acceleration record (Priestley et al., 1988). The dashed line represents
the high-frequency level that would result from a corner frequency determined
from the fault width (table 4) for a Haskell (1966) model (Savage and Wood, 1971).
| ||||||||||||||||||||||||||||||||||||||||||||||||||||||||||||||||||||||||||||||||||||||||||||||||||||
Figure 5
1985 Michoacan, Mexico. High-frequency level controlled by the average
spectra (corrected for surface amplification) of the Michoacan acceleration
array; transverse components (Anderson et al., 1986). The dashed line
represents the high-frequency level that would result from a corner
frequency determined from the fault width (table 5) for a Haskell (1966)
model (Savage and Wood, 1971).
affected, since it is determined from the seismic moment, but the high-frequency level is increased.
For all but the 1984 Round Valley, California, earthquake, a rectangular source geometry is a good approximation to the fault geometry suggested by aftershock patterns. The Coyote Lake and Morgan Hill, California, earthquakes have particularly well-recorded aftershock sequences, which allow a good constraint on the rupture extent. Tables 1–5 include references for source dimensions for all events. Note that table numbers correspond to figure numbers. In constructing the spectra, the intersection of the long-period level as determined from the seismic moment and the trend of the acceleration spectra was in all cases approximately equal to or consistent with the lowest corner frequency (representing fault length) expected for a Haskell rectangular model (Savage 1974a). Plotted in figures 1–5 is the second (higher) corner frequency for the theoretical Haskell model, which is fixed by the depth extent (width) of rupture (dashed line). This corner is fixed by the depth of fault rupture for each event as referenced in corresponding tables 1–5. The composite spectrum of the Coyote Lake earthquake indicates a second corner frequency very nearly equal to that expected for a Haskell-type rupture and is the only event in our study where this is true.
| ||||||||||||||||||||||||||||||||||||||||||||||||||||
The 1984 ML = 5.8 Round Valley, California, earthquake is the only event for which we have created a composite spectrum that shows a circular or equidimensional rupture area. The Round Valley spectrum also has the additional constraint, at intermediate frequencies, of teleseismic body-wave amplitudes recorded at GDSN (Global Digital Seismic Network) stations, as well as long-period surface-wave information (20 s) and a near-source (<5 km epicentral distance) acceleration recording (Priestley et. al., 1988).
Also provided in figures 1-5 are the calculations of the radiated energy from equation (1), the energy from equation (6) that would result for an Orowan-type event, the stress drop as determined from the spectra, seismic moment, apparent stress, and fault area. The "Savage and Wood ratio" (that is, the ratio of twice the apparent stress to the stress drop, as shown below) is also included:
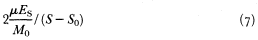
If this number is less than 1, then by the Savage and Wood argument there would be "overshoot," the final stress level being less than the frictional stress. This number is greater than or equal to 1 for all events studied.
Large Earthquakes as Composites of Smaller Events and Energy Implications
A Savage and Wood ratio greater than 1 (violating the Savage and Wood inequality) implies that the static stress drop, S – S0 , is relatively low, or that a significant amount of extra energy is being radiated at intermediate and high frequencies. Individual subevents, small with respect to the total fault dimensions but with high dynamic stress drops, would contribute more to the high-frequency energy (Boatwright, 1982). For the acceleration spectra of the Michoacan earthquake, Anderson et al. (1986) termed this the "roughness" portion of the spectra, after Gusev (1983), and clearly this "roughness," or high-frequency detail, can be seen on their near-field displacement pulses (figure 6 of Anderson et al., 1986). The high velocity pulse observed on the Pacoima Dam record for the 1971 San Fernando, California, earthqauke was interpreted by Hanks (1974) as being due to an initial high-stress-drop subevent with a much higher stress drop than determined for the entire faulting event. This in part contributed to the extended intermediate slope in the spectrum of the Pacoima Dam accelerogram, but most of the energy in this range comes from later high-frequency complexities in the record.
Hartzell (1982), Papageorgiou and Aki (1983), Mungia and Brune (1984b ), Joyner and Boore (1986), and Boatwright (1988), among others, have simulated the ground motion of large earthquakes using a summation of small events. Spectral shapes generated by these models relate directly to the calculation of radiated energy and apparent stress, and therefore evaluation of the Savage and Wood inequality (5). For instance, the asperity model of Boatwright (1988) incorporates an intermediate slope of w–1 to w–1.5 and is similar in principle, as stated by Boatwright, to the "partial stress drop model" of Brune (1970). In this model a high-stress-drop event occurs within a larger source area of lower stress drop and gives rise to a relative increase in high-frequency energy. For this case the Savage and Wood inequality is violated.
Frequency-Band Limitations and the Calculation of Radiated Energy
Vassiliou and Kanamori (1982) calculated the seismic energy radiated by large earthquakes using teleseismic body waves. They determined that most of the energy radiated by large earthquakes is below 1 to 2 Hz, therefore within the bandwidth of GDSN stations, and that this frequency band was sufficent for energy calculations. This method can be applied if the displacement spectrum falls off as w –2 at frequencies higher than 1 to 2 Hz. However, for several of the events we have studied there are important energy contributions at frequencies greater than 1 Hz (spectra with extended intermediate
slopes). This can be seen especially in the spectra of the 1971 San Fernando (fig. 1) and 1980 Mexicali Valley (fig. 3) earthquakes where the second (higher) corner frequencies are greater than 1 Hz.
Band limitations can also be a problem at long periods. The integration of velocity-squared time series from the acceleration record would return less reliable estimates of radiated energy if the bandwidth of the instrument is at a higher frequency than the lowest corner frequency of the far-field spectra. Therefore, composite spectra or wideband instrumentation would be required to incorporate all the details of the spectral shape, particularly for larger events with significant intermediate slopes.
Discussion
We have constructed estimates of the spectra of several large to moderate size earthquakes and integrated the velocity-squared spectra to determine the radiated seismic energy. Seismic moments have been used to constrain the long-period level (flat portion of the far-field displacement spectrum), and near-source acceleration spectra have been used to constrain the high-frequency amplitudes. Approximate corrections for free-surface and sediment amplification have been made. Significant intermediate slopes of w –1 apparently exist in the spectra, with consequent increases in the calculated radiated energy. These intermediate slopes extend to higher frequencies than those predicted for the Haskell (1966) model (Savage, 1974a , b ). Interpreted in terms of apparent stress and static stress drop, these earthquakes violate the Savage and Wood inequality (5) and provide evidence against "overshoot" as a source model in these cases. The ML = 5.8 1984 Round Valley, California, earthquake, the only event considered here that has a more or less equidimensional rupture surface (Priestley et al., 1988), has a composite spectrum with an intermediate slope of w–1 The initial corner frequency in the Round Valley spectrum is a good approximation to the source dimension, as determined from the aftershock pattern, for a Brune (1970) type source model. This event is a good example of the calculated energy being greater than that predicted for an Orowan rupture in equation (6).
On the basis of their data, Savage and Wood (1971) suggested a ratio of twice the apparent stress to static stress drop of 0.3 as a typical value (that is, accounting for only thirty percent of the Orowan energy), and they used this result as evidence for the "overshoot" model of equation (7). Assuming a Brune (1970, 1971) model and a sharp corner frequency, we have shown that such a ratio would require steeper (»w –2 ) high-frequency spectral falloffs, beginning at the corner frequency, than are generally accepted. Hanks (1979) argued against w–3 high-frequency spectral falloffs. In terms of rupture models, focusing due to rupture velocity and the angle with respect to the fault normal affect the shape of the spectra over the focal sphere. However, aver-
age high-frequency spectral falloffs of w–3 do not exist in the spectra of far-field S-waves for these models (Joyner and Boore, 1986; Joyner, 1984; Boatwright, 1980; Madariaga, 1973; Sato and Hirasawa, 1973).
Our spectra have typically been constructed from one acceleration record, and we have necessarily made some assumptions about the location of the station with respect to the fault, radiation pattern effects, average spectral shape, and site effects; thus, there remains considerable uncertainty in our results. The ideal situation would be to have many stations surrounding the source and be able to account for focusing, site effects, and radiation pattern to a much greater degrees.
Our purpose in this study has been to show how spectral shape relates to estimates of apparent stress, to further pursue the idea of integration of the entire spectral shape as a method of determining radiated energy, to document cases of intermediate slopes in the spectra of moderate to large earthquakes, and to use energy considerations to show that for many earthquakes the Savage and Wood (1971) inequality is violated. There is no strong evidence that the overshoot mechanism is ever operative.
Acknowledgments
This research was partially funded by U.S. Geological Survey research grant 14–0007–G1326.
References
Aki, K. (1967). Scaling law of seismic spectrums. J . Geophys. Res., 72: 1217–1231.
——— (1972). Scaling law of earthquake source time function. Geophys. J. R. Astr. Soc., 31: 3–25.
Allen, C. R., G. R. Engen, T. C. Hanks, J. M. Nordquist, and W. R. Thatcher (1971). Main shock and larger aftershocks of the San Fernando earthquake, February 9, through March 1971. U.S. Geol. Surv. Professional Paper 733, 17–20.
Anderson, J. G. (1986). Implication of attenuation for studies of the earthquake source. In Earthquake Source Mechanics, Geophysics Monograph 37, Maurice Ewing vol. 6. American Geophysical Union, 311–318.
Anderson, J. G., P. Bodin, J. N. Brune, J. Prince, S. K. Singh, R. Quaas, and M. Onate (1986). Strong ground motion from the Michoacan, Mexico, earthquake. Science, 233: 1043–1049.
Anderson, J. G., J . N. Brune, and R. S. Simons (1987). The Victoria accelerogram from the June 9, 1980 Mexicali Valley, Mexico earthquake (Submitted to Bull. Seism. Soc. Am. ).
Anderson, J. G., and M. S. Reichle (1987). Study of spectra and site effects from Coalinga aftershocks recorded near Parkfield, California (Submitted to Bull. Seism. Soc. Am. ).
Berberian, M. (1982). Aftershock tectonics of the 1978 Tabas-e-Golshan (Iran) earth-
quake sequence: A documented active thin and thick skinned tectonic case. Geophys. J. R. Astr. Soc., 68: 499–530.
Berberian, M., I. Asudeh, R. G. Bilham, C. H. Scholz, and C. Soufleris (1979). Mechanism of the main shock and the aftershock study of the Tabas-e-Golsham (Iran) earthquake of September 16, 1978: A preliminary report. Bull. Seism. Soc. Am., 69: 1851–1859.
Berger, J., L. M. Baker, J. N. Brune, J. B. Fletcher, T. C. Hanks, and F. L. Vernon (1984). The Anza array: A high dynamic-range, broadband, digitally radiotelemetered seismic array. Bull. Seism. Soc. Am., 74: 1469–1481.
Boatwright, J. (1980). A spectral theory for circular seismic sources: Simple estimates of source dimension, dynamic stress drop, and radiated energy. Bull. Seism. Soc. Am., 70: 1–26.
——— (1982). A dynamic model for far field acceleration. Bull. Seism. Soc. Am., 72: 1049–1068.
——— (1988). The seismic radiation from composite models of faulting. Bull. Seism. Soc. Am., 78: 489–508.
Boatwright, J., and B. Choy (1986). The acceleration spectra of subduction zone earthquakes. EOS, 76: 310.
Brady, A. G., P. N. Mork, V. Perez, and L. D. Porter (1980a). Processed data from the Gilroy array and Coyote Creek records, Coyote Lake, California earthquake 6 August 1979. U.S. Geol. Survey Open-file Report 81–42.
Brady, A. G., V. Perez, and P. N. Mork (1980b ). The Imperial Valley earthquake, October 15, 1979. Digitization and processing of accelerograph records. U.S. Geol. Surv. Open-file Report 80–703, 197–209.
Brady, A. G., R. L. Porcella, G. N. Bycroft, E. C. Etheredge, P. N. Mork, B. Silverstein, and A. F. Shakal (1984). Strong-motion results from the main shock (Morgan Hill, California) of April 24, 1984. U.S. Geol. Surv. Open-file Report 84–498, 18–26.
Brune, J. N. (1970). Tectonic stress and spectra of seismic shear waves from earthquakes. J . Geophys. Res., 75: 4997–5009.
——— (1971). Correction. J . Geophy. Res.,76: 5002.
——— (1976). The physics of strong ground motion. In C. Lomnitz and E. Rosenblueth, eds., Seismic Risk and Engineering Decisions. 141–177, Elsevier Sci. Publ. Co., New York.
Bruen, J. N., R. J. Archuleta, and S. Hartzell (1979). Far-field S-wave spectra, corner frequencies, and pulse shapes. J . Geophys. Res. 84: 2262–2272.
Bruen, J. N., J. Fletcher, F. L. Vernon, L. Harr, T. Hanks, and J. Berger (1986). Low stress-drop earthquakes in light of new data from the Anza, California telemetered digital array. In Earthquake Source Mechanics, Geophysics Monograph 37, Maurice Ewing vol. 6. American Geophysical Union, 269–274.
Cockerham, R. S. and J. P. Eaton (1984). The April 24, 1984 Morgan Hill earthquake and its aftershocks, California Division of Mines and Geology Special Publication 68, 215–236.
Doser, D. I., and H. Kanamori (1987). Long-period surface waves of four western United States earthquakes recorded by the Pasadena strain meter. Bull. Seism. Soc. Am., 77: 236–244.
Ekstrom, G. (1985). Centroid-moment tensor solution for the April 24, 1984, Morgan Hill, California, earthquake. California Division of Mines and Geology Special Publication 68, 209–214.
Gross, W. K., and J. C. Savage (1985). Deformation near the vicinity of the 1984 Round Valley, California, earthquake. Bull. Seism. Soc. Am., 75: 1339–1347.
Gusev, A. A. (1983). Descriptive statistical model of earthquake source radiation and its application to an estimation of short-period strong ground motion. Geophys. J. R. Astr. Soc. 74: 787–808.
Gutenberg, B., and C. F. Richter (1942). Earthquake magnitude, intensity, energy, and acceleration. Bull. Seism. Soc. Am., 32: 163–191.
——— (1956). Earthquake magnitude, intensity, energy, and acceleration (second paper). Bull. Seism. Soc. Am., 46: 105–145.
Hanks, T. (1974). The faulting mechanism of the San Fernando earthquake. J. Geophys. Res. 79: 1215–1229.
——— (1979). b values and w –g seismic source models: Implications for tectonic stress variations along active crustal fault zones and the estimation of high-frequency ground motion. J . Geophs. Res., 84: 2235–2242.
Hanks, T., and W. Thatcher (1972). A graphical representation of seismic source parameters. J . Geophys. Res., 77: 4393–4405.
Hartzell, S. H. (1982). Simulation of ground accelerations for the May 1980 Mammoth Lakes, California, earthquakes. Bull. Seism. Soc. Am., 72: 2381–2387.
Hartzell, S. H., and J. N. Brune (1977). The Horse Canyon earthquake of August 2, 1975: Two-stage stress-release process in a strike-slip earthquake. Bull. Seism. Soc. Am., 69: 1161–1173.
Haskell, N. A. (1966). Total energy spectral density of elastic wave radiation from propagating faults: Part II. A statistical source model. Bull. Seism. Soc. Am., 56: 125–140.
Housner, G. W. (1947). Ground displacement computed from strong-motion accelerograms. Bull. Seism. Soc. Am., 37: 299–305.
——— (1955). Properties of strong ground motion earthquakes. Bull. Seism. Soc. Am., 45: 197–218.
Johnson, C. E., and L. K. Hutton (1982). Aftershocks and preearthquake seismicity: In The Imperial Valley California, earthquake of October 15, 1979. U.S. Geol. Survey Professional Paper 1254, 51–54.
Joyner, W. B. (1984). A scaling law for the spectra of large earthquakes. Bull. Seism. Soc. Am., 74: 1167–1188.
Joyner, W., and D. M. Boore (1986). On simulating large earthquakes by Green's function addition of smaller earthquakes. In Earthquake Source Mechanics, Geophysics Monograph 37, Maurice Ewing vol. 6. American Geophysical Union, 269–274.
Kanamori, H., and J. Regan (1982). Long-period surface waves: In The Imperial Valley California, earthquake of October 15, 1979. U.S. Geol. Surv. Professional Paper 1254, 55–58.
King, N. E., J. C. Savage, M. Lisowski, and W. H. Prescott (1981). Preseismic and coseismic deformation associated with the Coyote Lake, California, earthquake. J . Geophys. Res., 86: 892–898.
Keilis-Borok, V. I. (1957). Investigation of the mechanism of earthquakes. Tr. Inst.
Geofis. Akad. Nauk, SSSR, 40 (in Russian). (Engl. transl., Sov. Res. Geophys. Ser., 4, 1960).
Madariaga, R. (1976). Dynamics of an expanding circular fault. Bull. Seism. Soc. Am., 66: 639–666.
McGarr, A. (1981). Analysis of peak ground motion in terms of a model of inhomogeneous faulting. J . Geophys. Res., 86: 3901–3912.
Mungia, L., and J. N. Brune (1984a ). High stress drop events in the Victoria, Baja California, earthquake swarm of March 1978. Geophys. J. R. Astr. Soc. 79: 725–752. 752.
———. (1984b ). Simulations of strong ground motion for earthquakes in the Mexicali-Imperial Valley region. Geophys. J. R. Astr. Soc., 79: 747–771.
Niazi, M., and H. Kanamori (1981). Source parameters of the 1978 Tabas and 1979 Qainat, Iran, earthquakes from long-period surface waves. Bull. Seism. Soc. Am., 71: 1201–1213.
Orowan, E. (1960). Mechanism of seismic faulting. Geol. Soc. Am. Memoir, 79: 323–345.
Papageorgiou, A. S., and Aki (1983). A specific barrier model for the quantitative description of inhomogeneous faulting and the prediction of strong ground motion. Part. I. Description of the model. Part II. Applications of the model. Bull. Seism. Soc. Am., 73: 693– 722, 953–978.
Priestley, K. F., and J. N. Brune (1987). Spectral scaling for the Mammoth Lakes, California, earthquakes (submitted to Bull. Seism. Soc. Am. ).
Priestley, K. F., and T. G. Masters (1986). Source mechanism of the September 19, 1985, Michoacan earthquake and its implications. Geophysical Research Letters, 13: 601–604.
Priestley, K. F., K. D. Smith, and R. S. Cockerham (1988). The 1984 Round Valley, California earthquake sequence (accepted by Geophys. J. R. Astro. Soc.).
Randall, M. J. (1973). The spectral theory of seismic sources. Bull. Seism. Soc. Am., 63: 1133–1144.
Reasenberg, P., and W. L. Ellsworth (1982). Aftershocks of the Coyote Lake, California, earthquake of August 6, 1979: A detailed study. J . Geophys. Res., 87: 10, 637–10, 655·
Reilinger, R. (1984). Coseismic and post seismic vertical movements associated with the 1940 M 7.1 Imperial Valley, California, earthquake. J . Geophys. Res., 89: 4531–4538.
Richter, C. H. (1958). Elementary Seismology. W. H. Freeman, San Francisco, California.
Sato, T., and T. Hirasawa (1973). Body wave spectra from propagating shear cracks. J. Physics Earth, 21: 415–431.
Savage, J. C. (1974a ). Relation of corner frequency to fault dimensions. J.Geophys. Res. 77: 3788–3795.
———. (1974b). Relation between P- and S-wave corner frequencies in the seismic spectrum. Bull. Seism. Soc. Am., 64: 1621–1627.
Savage, J. C., and M. D. Wood (1971). The relation between apparent stress and stress drop. Bull. Seism. Soc. Am., 6 : 1381–1386.
Shoja-Taheri, J., and J. G. Anderson (1988). The 1978 Tabas, Iran, earthquake: An interpretation of strong motion records. Bull. Seism. Soc. Am., 78: 142–171.
Thompson, W. T. (1959). Spectral aspects of earthquakes. Bull. Seism. Soc. Am., 49: 91–98.
Trifunac, M. D. (1972). Stress estimates for the San Fernando, California, earthquake of February 9, 1971: Main event and thirteen aftershocks. Bull. Seism. Soc. Am., 62: 721–749.
Trifunac, M. D., and J. N. Brune (1970). Complexity of energy release during the Imperial Valley, California earthquake of 1940. Bull. Seism. Soc. Am., 60: 137–160.
Tucker, B. E., and J. N. Brune (1974). Source mechanisms and mb –MS of aftershocks of the San Fernando earthquake. Geophys. J. R. Astro. Soc., 49: 371–426.
Vassiliou, M. S., and H. Kanamori (1982). The energy released in earthquakes. Bull. Seism. Soc. Am., 72: 371–387.
Wu, F. T. (1966). Lower limit of the total energy of earthquakes and partitioning of energy among seismic waves. Ph.D. Diss., California Institute of Technology.
Wyss, M. (1970). Stress estimates of South American shallow and deep earthquakes. J. Geophys. Res., 75: 1529–1544.
Nineteen—
Constraints from Seismograms on the Physical Characteristics of Explosions
Brian W. Stump
Introduction
The waveforms generated by explosions contain information about both the physical properties of the explosion and the surrounding geologic material (Minster, 1985; Bache, 1982; Massé, 1981; Rodean, 1981). This paper presents a short review of these waveforms and some of their implications. The particular subjects discussed are: (1) the physical characterization of contained explosions; (2) the effect of source depth on characterization, in particular relating the motion from a near-surface burst to a fully contained explosion; (3) the relative importance and separation of stochastic and deterministic wave propagation effects; and (4) some simple experiments to check linear superposition.
Ground motions from explosions have been recorded from the very near nonlinear regime out to teleseismic distances (figure 1). At the closest ranges the material surrounding the explosion responds nonlinearly, with accelerations of hundreds or thousands of gs and rise times on the order of milliseconds (Rodean, 1981). In the near-field linear region one observes fairly simple seismograms, with durations on the order of seconds and accelerations generally less than 1 g (Stump and Johnson, 1984; Stump and Reinke, 1987; Vidale and Helmberger, 1987). Typical ranges for the near-field linear region of small chemical explosions (tens of pounds) are tens of meters, while for large nuclear explosions they are on the order of several kilometers. At regional distances the seismogram duration is tens to hundreds of seconds and characterized by Pn , Pg , S, Rg , and Lg phases (Pomeroy et al., 1982). Finally, at teleseismic distances the body waves have frequencies under 1 Hz, while long-period surface waves are also observed (Massé, 1981, Bache, 1982).
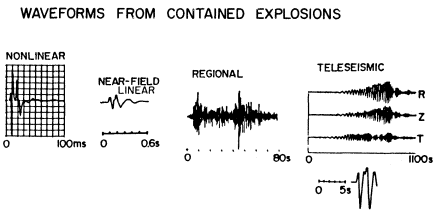
Figure 1
Schematic representation of explosion waveforms ranging from
the close-in nonlinear regime out to teleseismic distances.
The work discussed in this paper focuses upon the near-field linear region. There are three reasons for this emphasis: (1) propagation path effects can be minimized; (2) a broadband characterization of the source can be attempted; and (3) the length scale of the problem allows the formulation and implementation of carefully designed experiments.
Contained Explosions
Two sets of data from contained explosions are investigated. The first is from a small-scale chemical explosion (256 lb) detonated at a depth of 11.5 m in alluvium (acronym CHEAT). The second is from a nuclear explosion with an announced yield of less than 20 kton, also detonated in alluvium, at a depth of 273 m (acronym COALORA). The physical processes that accompany these events include: (1) initial cavity formation and subsequent simple Sharpe (1942) pressure-pulse generation dependent on material type; (2) tensile failure of near-surface layers (spallation), which repartitions the initial spherical energy radiation from the source (Viecelli, 1973; Day et al., 1983); (3) tectonic strain release or motion driven along planes of weakness, which leads to complex radiation and transverse motions (Massé, 1981); and (4) cavity collapse (McEvilly and Peppin, 1972).
The vertical and radial accelerograms recorded at 50 m from the chemical explosion are shown in figure 2. The amplitudes and waveshapes as a function of azimuth around the source support a fair amount of azimuthal symmetry. Such data are replicated by simple isotropic cavity models. In contrast, transverse motions from the same source are as displayed in figure 3. Although these waveforms have peak amplitudes on the order of only four-
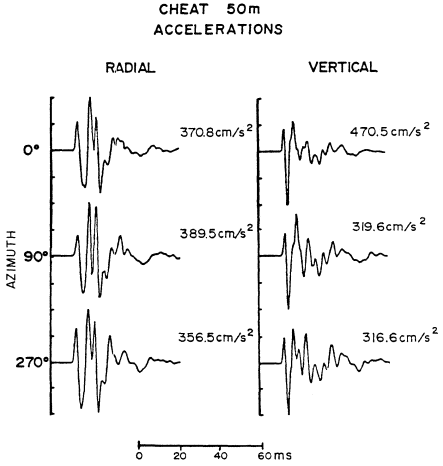
Figure 2
Vertical and radial accelerations from the chemical
explosion CHEAT at azimuths ranging from 0 to 270°.
teen to forty-seven percent of the radial acceleration at 50 m, they indicate a source or propagation effect that leads to azimuthally variable radiation.
Similar observations are made for the nuclear explosion as indicated in figure 4 where the vertical, radial, and transverse displacements from COALORA are displayed. Even though the observation range is an order of magnitude greater than that from the chemical explosion (549 m compared to 50 m), the radial and vertical motions are similar in shape and amplitude. The transverse motions are generally smaller in amplitude, have higher frequency, and exhibit considerable azimuthal variation. Spectral estimates of these same data illustrate further azmuthal differences in the motions (fig. 5).
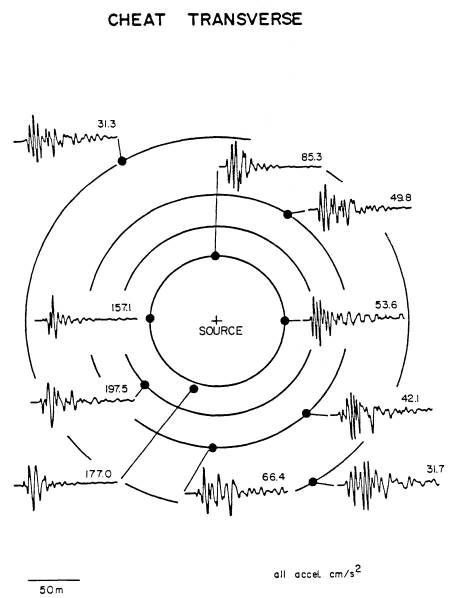
Figure 3
Transverse accelerations from the chemical explosion CHEAT.
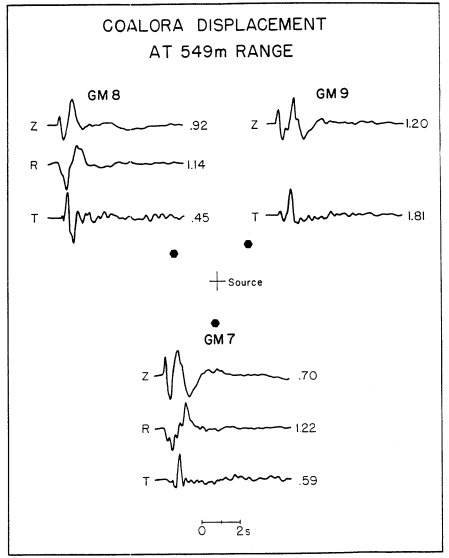
Figure 4
Vertical, radial, and transverse displacements from
the nuclear explosion COALORA.
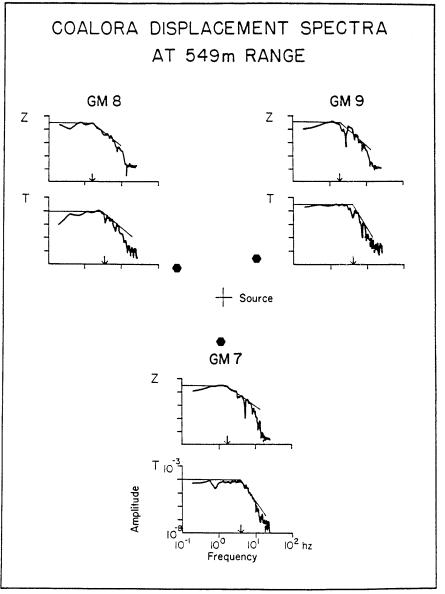
Figure 5
Displacement spectra from COALORA. Arrows
indicate approximate spectral corner frequency.
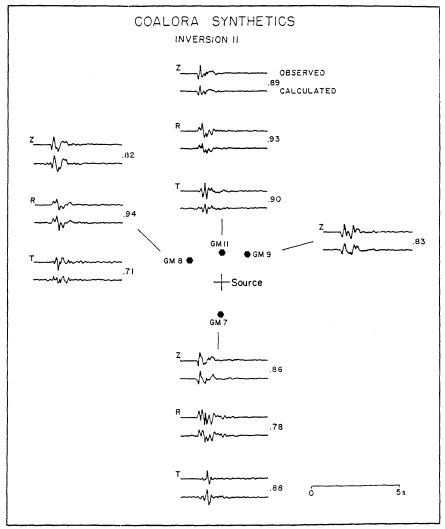
Figure 6
Observed and modeled velocity waveforms from COALORA. The
correlation coefficents are given to the right of each waveform pair.
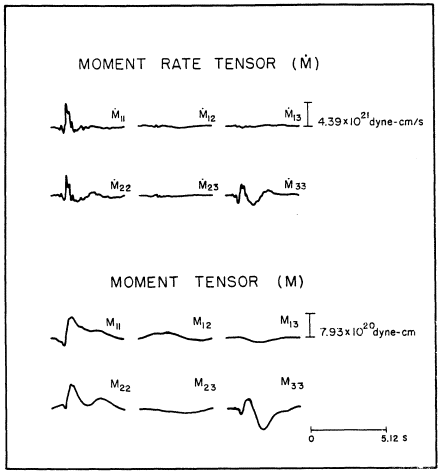
Figure 7
The moment and moment rate tensors for COALORA. Only six elements
of the moment tensor are given since the second rank tensor is symmetric.
The vertical spectra are characterized by a 1.5-Hz corner frequency, f–2 high-frequency decay, and a long-period level at least three times greater than the transverse long-period level. The transverse motions also have a considerably higher-corner frequency (4 Hz) and f–3 high-frequency decay.
In order to separate the source and propagation effects, an inverse modeling exercise was undertaken in which the source is represented as a set of force-moments, Mij , while the propagation effects are accounted for by a set of Green's functions appropriate to the medium, Gni,j . Then,

an equation that holds in the frequency domain. The modeling exercise consists of computing a set of Green's functions and then solving for the source, given an observational data set. In matrix form this result becomes

The ability of this procedure to model the observations from the nuclear explosion COALORA is summarized in figure 6. Both peak amplitudes and waveshapes are well replicated as indicated by the average radial correlation coefficent of 0.88, vertical correlation coefficent of 0.85, and transverse correlation coefficent of 0.83.
The force-moment and force-moment rate tensor from this modeling exercise are summarized in figure 7 (COALORA), in which the 1 and 2 indices represent the horizontal coordinates, and the 3 index represents the vertical coordinate. Three attributes are noted: (1) the diagonal elements of the forcemoment tensor, the isotropic source, dominate; (2) the deviatoric components are an order of magnitude smaller than the diagonal elements; and (3) the M33 component, which represents the force couple in the vertical direction, has a secondary long-period component attributable to spallation, the tensile failure of near-surface layers.
A similar result came from the inverse modeling of CHEAT (figure 8). The source is primarily isotropic, followed by the longer-period spallation contribution as indicated on the M33 component. The source time functions for the COALORA and CHEAT explosions are remarkably similar except for the order of magnitude change in time scale.
The resulting source of the radiated near-field waveforms is dominated by the isotropic component followed by spallation that repartitions the energy. The relative importance of spallation on the M33 component is further supported by studies of synthetic data that include spallation contributions (Stump, 1987). The deviatoric moments are a factor of ten smaller, with indication of a higher-frequency content.
Source Depth Effects and Energy Coupling
Taking advantage of the small-scale characteristic of the near-field experiments, a set of chemical explosion tests were designed to quantify the effect of source depth on radiated seismic energy. Sources (256-lb TNT spheres) were placed at depths varying from 1.84 to 11.5 m in alluvium. Waveforms were recorded in the 17–228-m range.
Radial and vertical velocity records for all source depths at the 228-m range are shown in figure 9. The initial body waves are identified by the rectilinear motion. Surface waves yield clear retrograde elliptical motion, with the vertical (dashed line) following the radial (solid line) motion. Qual-
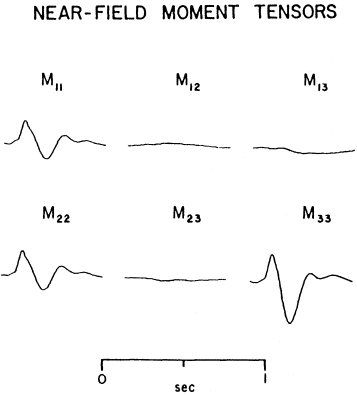
Figure 8
The moment tensor for CHEAT. All moments are relative to
the M33 component, which has a peak of 5.10 × 10¹⁶ dyne-cm.
itatively, one can observe the rise in body-wave amplitudes relative to the surface waves with increasing source depth.
The particle motions are used to separate the body and surface waves, as discussed above. Once this separation is completed, the data are used to quantify the relative and absolute coupling of seismic energy into body and surface waves (Flynn and Stump, 1987). The body and surface waves are corrected for geometrical spreading and attenuation. Once this process is completed, the energy flux is calculated in the time or frequency domain
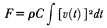
where F is the energy flux (ergs/cm2 ), r is density (g/cm3 ), C is the propagation velocity (cm/s), and v(t) is the recorded particle velocity (cm/s). The total energy in the body waves observed at the range, R, becomes

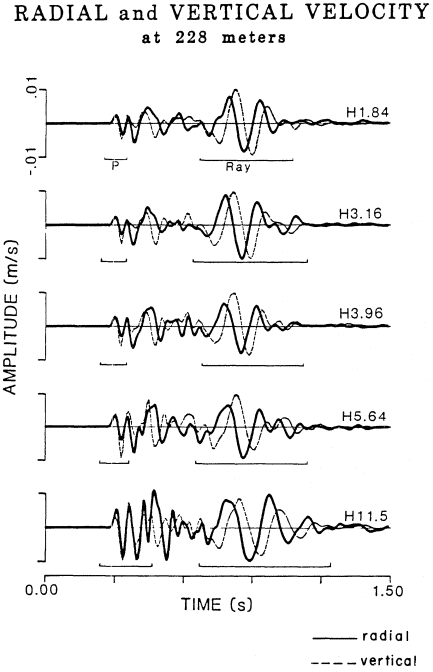
Figure 9
Velocity waveforms observed at 228 m from 256-lb explosions at 1.84 to 11.5 m
depth. Solid lines are the radial motion, dashed lines the vertical. H is the source depth.
Similarly, the total energy in the surface wave becomes

where h is the effective depth of penetration for the surface wave.
These procedures are used to develop the percent total energy in body and surface waves for all source depths (fig. 10). These estimates were made for observation ranges of 17, 37, 73, and 228 m, yielding consistent results. For the shallowest source, 1.84 m, sixty percent of the energy is in the Rayleigh wave, while forty percent is in the P-wave. The percentage of energy in the P-wave increases with increasing source depth until, at 11.5 m, eighty percent of the seismic energy is in the body (P-)waves and twenty percent in the
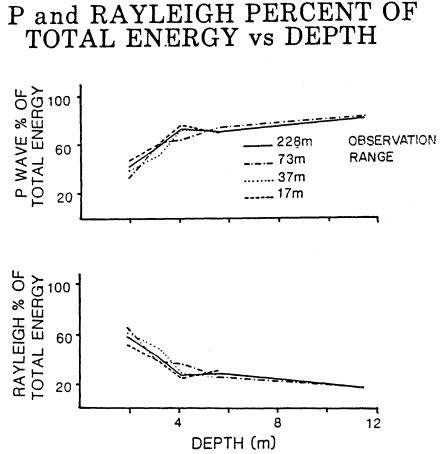
Figure 10
Percent P- and Rayleigh energy as a function of source depth at
four ranges. All charges are 256 lb.
Figure 11
The experimental layout for a series of 5-lb sources designed to quantify
stochastic and deterministic propagation effects and check superposition
between sources (acronym ARTS). Solid lines represent the edges of the
crater following the explosion.
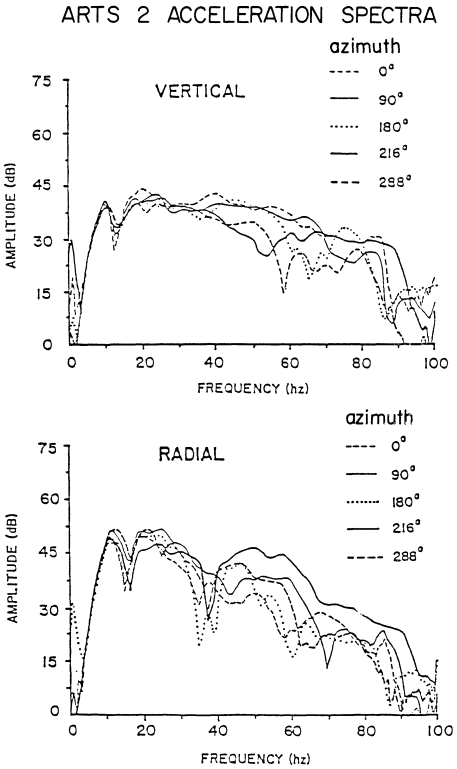
Figure 12
Acceleration spectra from ARTS 2.
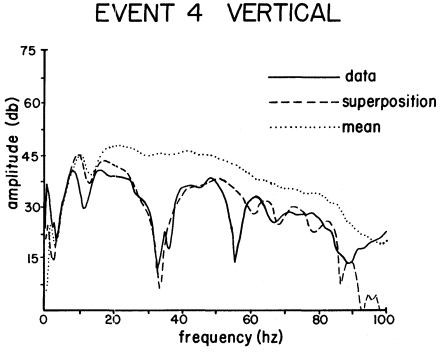
Figure 13
Data and single-burst predictions from the two-burst ARTS 4. The two 5-lb
charges were 4 m apart. The superposition waveform represents the results for
two single-burst waveforms delayed in time to simulate the 4-m separation
between charges. The mean estimate is for two charges no time delay.
surface (Rayleigh) waves. Since the chemical energy in the explosion is known, absolute estimates of seismic energy are obtainable. The efficiency of energy coupling varies from 0.7 percent for the 1.84-m source to three percent for the 11.5-m source.
Stochastic and Deterministic Propagation
All propagation-path effects cannot be modeled deterministically. The random nature of geological media makes a statistical characterization more appropriate for some studies. A final set of experiments was designed to separate deterministic and stochastic propagation effects and to test for linear superposition of motions from multiple sources.
Figure 11 gives the experimental layout for a series of 5-lb sources designed to characterized the single-burst environment (event 2) and check for superposition in the plane of symmetry between the two charges and in the plane of the two charges (events 3, 4, 7). The radial and vertical acceleration
spectra from event 2 (all gauges at 20 m) are given in figure 12. The waveforms themselves, their spectra, and coherence estimates all indicate little variation in waveforms for frequences between 3 and 35 Hz. Above 35 Hz as much as a 15-dB variation in spectral levels is observed. The alluvial test site where these experiments were conducted has intermittent caliche beds. These caliche lenses are 0.5 to 1.5 m in length and have twice the P-wave velocity of the surrounding alluvium. Simple single-scattering calculations indicate that the large variation in amplitude above 35 Hz can be explained by wave-field interactions with the caliche beds.
Taking the 3–35-Hz band as deterministic, one can use the ensemble single-source estimate to check superposition in the two-burst data. Figure 13 gives the observed and predicted spectra from event 4 (4-m source separation) in the plane of the two sources. The observations and predictions support linear superposition to about 40 Hz, including the interference hole at 32 Hz.
Conclusions
A number of physical models of explosive sources have been shown, along with the supporting observational data. These representations include partially and fully contained explosions. Both chemical and nuclear sources are shown to generate waveforms by similar mechanisms, including spallation. Energy partitioning between body and surface waves is found to be strongly influenced by source depth. Absolute coupling values for a suite of chemical explosions in alluvium range from 0.7 to 3.0 percent. Finally, it is found that the deterministic and stochastic wave-propagation effects must be quantified prior to in-situ experimental superposition checks.
References
Bache, T. C. (1982). Estimating the yield of underground nuclear explosion. Bull. Seism. Soc. Am., 72: S131–S168.
Day, S. M., N. Rimer, and J. T. Cherry (1983). Surface waves from underground explosions with spall: Analysis of elastic and nonlinear source models. Bull. Seism. Soc. Am., 73: 247–264.
Flynn, E. C., and B. W. Stump (1987). Effects of source depth on near source seismograms. J . Geophys. Res. (to appear).
Massé, R. P. (1981). Review of seismic source models for underground nuclear explosions. Bull. Seism. Soc. Am., 71: 1249–1268.
McEvilly, T. V., and W. A. Peppin (1972). Source characteristics of earthquakes, explosions, and afterevents. Geophys. J. R. Astr. Soc., 31: 67–82.
Minster, B. J. (1985). Twenty-five years of source theory. In Ann U. Kerr, ed., The Vela Program—A Twenty-five Year Review of Basic Research. Executive Graphic Services, Defense Advanced Research Projects Agency, Rosslyn, Virginia, 67–116.
Pomeroy, P. W., W. J. Best, and T. V. McEvilly (1982). Test ban treaty verification with regional data—A review. Bull. Seism. Soc. Am., 72: S829–S129.
Rodean, H. C. (1981). Inelastic processes in seismic wave generation by underground explosions. In E. S. Husebye and S. Mykkeltveit, eds., Identification of Seismic Sources—Earthquake or Underground Explosion. D. Reidel, Dordrecht, The Netherlands, 97–190.
Sharpe, J. A. (1942). The production of elastic waves by explosive pressures. 1. Theory and empirical field observations. Geophysics, 7: 144–154.
Stump. B. W. (1987). Resolution of complex explosive source functions in the frequency domain. Geophys. J. R. Astr. Soc. (to appear).
Stump, B. W., and L. R. Johnson (1984). Near-field source characterization of contained nuclear explosion in tuff. Bull. Seism. Soc. Am., 74: 1–26.
Stump, B. W., and R. E. Reinke (1987). Experimental seismology: In situ source experiments. Bull. Seism. Soc. Am., 77: 1295–1311.
Vidale, J. E., and D. V. Helmberger (1987). Path effects in strong motion seismology. In Bruce A. Bolt, ed., Seismic Strong Motion Synthesis. Academic Press, Orlando, Florida.
Viecelli, J. A. (1973). Spallation and the generation of surface waves by an underground explosion. J . Geophys. Res., 78: 2475–2487.
Twenty—
Studies Using Global Seismological Networks
Lane R. Johnson
Introduction
The primary purpose of this paper is to show how data collected by a network of seismographic stations can be used to make inferences about the velocity structure of the Earth. The structure of the entire Earth is considered, requiring the use of a global network of seismographic stations. Seismic travel times provide the basic observational data for the study. The reasons for this choice include the fact that large amounts of such data are readily available, so that a reasonably complete sampling of the Earth can be achieved, and the fact that short-period body waves sample the Earth in a localized manner and have relatively high resolution compared to other types of seismic waves.
Global Networks
Almost from the beginning of seismology as a science, seismologists have been aware of the advantages of using networks of stations to acquire information about the Earth. The basic concept is that when ground-motion data acquired from a number of different sampling points on the surface of the Earth are processed collectively, a variety of analysis procedures can be used, which is not possible when the data from the different sampling points are processed individually. In general, the dimensions of the network should span the region of study, and the resolution that can be achieved is directly related to the spacing between individual stations of the network. Thus, a study of the velocity structure of the entire Earth requires a global network of seismological stations. Fortunately, such a network is available. Over 1,000 seismographic stations scattered over the surface of the Earth are in continuous operation.
A number of organization, such as the National Earthquake Information Center (NEIC) of the U.S. Geological Survey and the International Seismological Centre (ISC) in Newbury, England, provide the very important services of collecting, organizing, and distributing the information recorded by individual seismographic stations around the globe. These organizations perform a variety of functions, including the collection of basic readings taken from seismograms at most of the world's seismographic stations, the association of these data with individual earthquakes, the location of the earthquakes, the determination of magnitudes, and the publication of the raw data and the results of the analysis. Because of the data management services provided by these organizations it is possible to treat all the seismographic stations on the Earth as a single network.
The Tau Method of Analysis
The objective of tau analysis is to extract information about the velocity structure of the Earth from travel-time data gathered by a global network. For an Earth in which the velocity v (r ) depends only upon the radial coordinate r , the time and distance along a ray path from source to receiver are given by the parametric equations
where p is the horizontal slowness of the ray, R is the radius of the Earth, and r p is the radius of the deepest point of the ray. Equations (1) and (2) can be combined through a Legendre transformation to obtain the quantity known as tau in seismology:
A simple geometrical interpretation of t (p ) is that it represents the zero-distance intercept time of the tangent to the travel-time curve having slope p . The function t (p ) has some special properties that have always been useful in the forward problem of seismic travel times (see for example Rudzki, 1898), but these special properties took on added importance when the uniqueness of the inverse problem was analyzed in detail (Gerver and Markushevitch, 1966, 1967; Johnson and Gilbert, 1972; McMechan and Wiggins, 1972; Bessonova et al., 1974, 1976).
The pair of variables T (p ) and D ( p ) are the ones most commonly used in seismology to characterize travel-time data because this information can be
extracted directly from seismograms at a single station, although the information is available in the form T (D ), which leaves the slowness p unspecified. The single variable t (p ) contains all the information of T ( p ) and D ( p ) but cannot be estimated directly from seismograms at a single station. However, given data from a network of stations, the situation is quite different. It can be shown directly from equation (3) that
This leads to a Clairaut-type differential equation for t

whose solutions have been thoroughly studied (Courant and Hilbert, 1962). Bessonova et al. (1974, 1976) show how the singular solution of this equation can be obtained by graphical means and also point out that, even when observational errors are present in both T and D , the uncertaintly in t has a simple statistical interpretation. Thus, given T (D ) observations from a network of stations, there exists a stable and simple process for obtaining direct estimates of t ( p ) and its statistical uncertainty. The quatity t ( p ) has several other advantages that are useful in the analysis of travel-time data. For instance, it is a monotonic function of p , which is not true of either T ( p ) or D ( p ), and is continous except at values of p corresponding to low-velocity zones. In addition, the inverse problem of converting t ( p ) into v (r ) has been solved by Bessonova et al. (1976) in such a way that uncertainties in t ( p ) can be mapped directly into uncertainties in v (r ).
Data
The travel times for this study were obtained from the ISC Bulletins. This is a large and homogeneous catalog that has been used in a wide variety of different seismological studies. In their raw form these data can contain a variety of errors, including errors in source location, errors in association, errors in phase identification, errors in clocks, errors in reading times, and errors in recording times. While the existence of these errors does complicate the analysis procedure, it does not preclude the extraction of valuable information about the Earth from these catalogs. In a series of studies (Lee and Johnson, 1984a , 1984b ; Johnson and Lee, 1985; Tralli and Johnson, 1986a , b , c ) a fairly comprehensive set of techniques has been developed for dealing with the problems associated with this type of bulletin data. An important part of the analysis is the application of the uniform reduction method (Jeffreys, 1961; Buland, 1986) to separate a primary central distribution of the data from a background of anomalous outliers. The primary distribution is then checked for normality with both the chi-squared and Kolmogorov-
Figure 1
ISC travel-time data for earthquakes with focal depths in the interval 500 to
550 km. An approximate depth correction has been applied to place all of the
focal depths at 525 km. About 38,000 data points are contained in this plot.
Smirnoff tests. With the careful application of such procedures, it is possible to routinely obtain sample standard errors for a single observation of less than 1 s for P-waves and 3 s for S-waves. Given the large amount of data available in these catalogs, this degree of scatter is definitely small enough to allow meaningful inferences about Earth structure. So far, the ISC Bulletin data for the time interval 1971–1981 have been analyzed, and both quantity and quality of the data have been found to improve with time.
In a typical year close to a million different phases are reported to the ISC, so several million travel-time observations are available for the 1971–1981 period. An indication of the quality of these data can be found in figure 1, a plot of travel times from sources in a 50-km depth interval centered at a depth of 525 km. The scale of this plot does not do justice to the details contained in these data, but a large number of body-wave phases are well defined and have been labeled. There is no difficulty in constructing tau functions for most of the phases shown on this plot.
Another example of the raw travel-time data is shown in figure 2. This shows travel times of P-waves that have sampled the Earth's core. The conversion of these travel times to tau estimates using the method of Bessonova et al. (1976) is shown in figure 3. Values of tau and its uncertainty are
Figure 2
Travel times of approximately 60,000 P-waves from shallow sources that have
penetrated the Earth's core. Letters denote the end points of the various
branches of the travel-time curve according to conventional notation.
obtained simply by estimating the mean value of the reduced travel times and its standard error at the extremums. In this example, the extremums are maximums for the prograde BC and EF branches of the core travel-time curve and a minimum for the AB retrograde branch. The 99.9-percent confidence intervals for these tau estimates were about 0.1 s, which represents a precision approaching 1 part in 104 .
Average Structure
The travel-time data for direct P- and S-waves in the mantle and PKP- and SKS-waves in the core were analyzed according to the method described in the previous two sections. The resulting tau estimates were then inverted using the method of Bessonova et al. (1976) to obtain velocity models for P-and S-waves in the mantle and P-waves in the core. Details of the analysis procedures can be found in Lee and Johnson (1984b ), Tralli and Johnson (1986a ), and Johnson and Lee (1985). In this part of the study, travel times from the entire Earth were lumped together and treated as one homogeneous data set, so the velocity models are a function only of the radial dimension and represent lateral averages of the Earth at any given radius. A more expli-
Figure 3
Reduced travel times obtained from the data
of figure 2. Three different values of slowness
are shown for three different branches of the
travel-time curve in the core. The time scale
is relative, and the error bars represent
95-percent confidence intervals.
cit type of lateral averaging is described in Tralli and Johnson (1986a ) where a weighting function proportional to the fractional surface area was used in computing the average.
Figure 4 shows the laterally averaged P- and S-wave velocities for the mantle. As can be seen in the figure, the results agree very well with the PREM model (Dziewonski and Anderson, 1981). The primary difference involves the low-velocity zone, which cannot be resolved by the travel-time data used in this type of study. Figure 5 shows similar results for the Earth's core, and the agreement with the PREM model is again quite good. These results seem to justify the conclusion that meaningful information about laterally averaged velocities within the Earth can be extracted from Bulletin travel-time data collected from a global network.
Although not shown in figures 4 and 5, confidence intervals for the velocities were also estimated. At the 95-percent confidence level the widths of these confidence intervals are about 0.5 km/s in the upper mantle, 0.2 km/s in the
Figure 4
Global averages of the P- and S-wave velocities in the mantle
derived from the tau analysis. The PREM model (Dziewonski
and Anderson, 1981) is shown for comparison.
lower mantle, and 0.5 km/s in the core. The resolution in depth is about 75 km in both the mantle and core.
Lateral Variations
In the last few years the study of the three-dimensional properties of the Earth's internal structure has become an area of intense interest. Network travel times can provide an effective means of investigating these more complicated variations within the Earth, provided that the ray paths define a reasonably complete sampling of the Earth's interior. This last point requires careful consideration in a global study because of the nonuniform sampling inherent in natural seismicity patterns and the distribution of seismographic
Figure 5
Global averages of P-wave velocities in the
core derived from the tau analysis. The
PREM model (Dziewonski and Anderson,
1981) is shown for comparsion.
stations. In the initial part of the study it was decided to avoid some of the problems of this nonuniform sampling by taking advantage of the lateral variations known to exist in the crust and shallow mantle and by determining how deeply these could be traced into the mantle. This was achieved by analyzing the data in terms of a tectonic regionalization. The ray paths were characterized in terms of the type of tectonic region present at the source, midpoint, and receiver. Initially, the global tectonic regionalization of Jordan (1981) was used, which consists of three oceanic regions and three continental regions divided primarily according to geologic age. However, in analyzing the statistics of the travel times it was apparent that a seventh region containing the oceanic trenches was needed, so the regionalization of Jordan was modified accordingly.
Once the travel-time data had been characterized by tectonic regions, they were converted to estimates of t ( p ) according to the method outlined above in the section on tau method. Then, following a fairly straightforward method developed in Tralli and Johnson (1986a ), it was possible to obtain equivalent "single-region" tau functions for each of the tectonic regions. In
addition, end-point correction functions were obtained for both sources and receivers in each of the tectonic regions. The statistics of all these estimates were carried through the entire analysis procedure so the significance of differences in tau estimates for different regions could be tested. Furthermore, the methods of Bessonova et al. (1976) allows one to convert confidence intervals in tau to confidence intervals in velocity, which is a further aid in assessing the validity of suggested lateral variations.
The single-region tau functions and their uncertainties were converted directly to velocity models with confidence intervals for each of the tectonic regions. The significant differences between the various regions are confined primarily to the upper 1,000 km of the mantle, which is what one would expect from a method designed to extract that part of the lateral variations correlated with surface tectonics. The lateral variations in the upper 1,000 km of the mantle for the P-wave velocity are shown in figure 6 and those for the S-wave velocity are shown in figure 7. Anomalies in velocity are typically less than 1 percent. In both oceans and continents the velocities at the top of the mantle correlate well with geologic age, with velocities increasing from young to old oceans and similarly from young active continental regions to old shields. In general, the lateral variations in P- and S-wave velocities in the upper 200 km of the mantle are consistent with each other and also consistent with modern models of plate tectonics. There are also interesting lateral variations at greater depths, but the reliability of these features is more questionable. For instance, there is a definite suggestion in the S-wave velocities that the 400- and 650-km discontinuities are deeper under continents than under oceans, which would be an important result if it could be firmly established. However, this pattern is not duplicated in the P-wave velocities, an inconsistency that must be explained before one is willing to place much confidence in velocity anomalies of this type.
End-point corrections for both source and receiver were analyzed separately to learn more about laterally varying velocity anomalies in the crust and shallow mantle, and the details of this analysis are presented in Tralli and Johnson (1986b ). These end-point corrections are similar to the time terms of refraction seismology but are estimated as a function of slowness, which makes it possible to make inferences about the causative velocity anomalies. Furthermore, they are estimated separately for sources and receivers in the same region, so information about systematic errors in hypocentral parameters can be extracted from the data. A very systematic picture emerged from this type of analysis for P-waves that is generally consistent with modern concepts of plate tectonics and crustal evolution. The corrections are all less than 1 s. Oceanic regions have negative velocity anomalies in the shallow mantle, while continental regions have positive anomalies, with the size of the anomaly correlating with increasing crustal age in both cases. Furthermore, interpretations in terms of variations in crustal thickness
Figure 6
Differences between the P-wave velocities for each tectonic region and
the reference velocity model obtained by averaging all the regions with a
weighting proportional to surface area. The regions are: (1) young oceans,
(2) intermediate-age oceans, (3) old oceans, (4) active continents,
(5) continental platforms, (6) continental shields, and (7) oceanic trenches.
Figure 7
Similar to figure 6 for S-wave velocities.
also indicate a thickening of the crust with age in both oceans and continents. Evidence for systematic regional biases in hypocentral parameters were also extracted from these data and indicate that oceanic sources are systematically mislocated, with origin times that are too late and/or focal depths that are too shallow, while continental sources have origin times that are too early and/or focal depths that are too deep.
In order to determine what fraction of lateral variations in mantle velocities is actually being explained by results such as those shown in figures 6 and 7, a technique was developed for locating seismic events in a laterally heterogeneous Earth (Tralli and Johnson, 1986c ). This technique makes use of the regionalized tau curves for P-waves in the distance range of 10 to 100 degrees. Using equation (4), these tau curves are easily converted to travel-
time curves for a laterally heterogeneous Earth (Buland and Chapman, 1983). Thus, it is possible to locate seismic sources, taking into account the information on lateral variations contained in the empirical tau curves without explicitly defining a laterally varying Earth model, and an efficient procedure was developed for doing this. This procedure was tested by locating about 100 events, including nuclear explosions in Nevada, Russia, and the south Pacific and earthquakes in California. The locations were obtained using routine arrival times of P-waves in the distance range of 15 to 95 degrees as reported by the ISC. The tests were most meaningful for the Nevada explosions because actual locations are known. Mean epicentral mislocations for twenty-eight Nevada explosions were about 3 km for this method incorporating lateral variations, whereas they were about 7 km for laterally homogeneous methods employing the Jeffreys-Bullen or PREM travel-time curves.
Conclusions
The Earth is a large and complex body, and the seismological study of its internal structure requires a large amount of data. The travel-time data collected by a global network of seismographic stations are sufficient for such a study, as long as the problem of nonuniform sampling of the Earth is explicitly considered and careful attention given to the statistical treatment of errors in the observational data. The tau method is an excellent way of analyzing data of this type.
While these initial results indicate that the travel-time data available in standard seismological bulletins have the potential to affect quantitative estimates of the three-dimensional structure of the Earth's interior, several obvious extensions and refinements of the method will be required to complete the analysis. The dimensions and dipping nature of the subduction zones have not been adequately represented by the 5 × 5-degree gridding of the tectonic regionalization scheme, and special studies of these regions will be required. The division of the upper mantle into seven types of tectonic regions is rather coarse, and more regions and a finer gridding may be needed. Finally, while the method of tectonic regionalization helps solve some of the problems of uneven sampling in the upper mantle, its validity decreases with depth in the mantle, and it is obvious that a more complete tomographic technique will be required in the lower mantle and core to study lateral variations in these parts of the Earth.
References
Bessonova, E. N., V. M. Fishman, V. Z. Ryaboyi, and G. A. Sitnikova (1974). The tau method for inversion of travel times. 1. Deep seismic sounding data. Geophys. J. R. Astr. Soc., 36: 377–398.
Bessonova, E. N., V. M. Fishman, M. G. Shnirman, G. A. Sitnikova, and L. R. Johnson (1976). The tau method for inversion of travel times. II. Earthquake data. Geophys. J. R. Astr. Soc., 46: 87–108.
Buland, R. (1986). Uniform reduction error analysis. Bull. Seism. Soc. Am., 76: 217–230.
Buland, R., and C. H. Chapman (1983). The computation of seismic travel times. Bull. Seism. Soc. Am., 73: 1271–1302.
Courant, R., and D. Hilbert (1962). Methods of Mathematical Physics. Interscience, New York.
Dziewonski, A. M., and D. L. Anderson (1981). Preliminary reference Earth model. Physics of the Earth and Planetary Interiors, 25: 297–356.
Gerver, M., and V. Markushevitch (1966). Determination of seismic wave velocity from the travel time curve. Geophys. J. R. Astr. Soc., 11: 165–173.
——— (1967). On the characteristic properties of travel time curves. Geophys. J. R. Astr. Soc., 13: 241–246.
Jeffreys, H. (1961). Theory of Probability, 3d edition. Oxford University Press, Oxford.
Johnson, L. E., and F. Gilbert (1972). A new datum for use in the body wave travel time inverse problem. Geophys. J. R. Astr. Soc., 30: 373–380.
Johnson, L. R., and R. C. Lee (1985). External bounds on the P velocity in the Earth's core. Bull. Seism. Soc. Am., 75: 115– 130.
Jordan, T. H. (1981). Global tectonic regionalization for seismological data analysis. Bull. Seism. Soc. Am., 71: 1131–1141.
Lee, R. C., and L. R. Johnson (1984a ). Tau estimates for mantle P and S waves from global travel-time observations. Geophys. J. R. Astr. Soc., 77: 655–666.
——— (1984b ). Extremal bounds on the seismic velocities in the Earth's mantle. Geophys. J. R. Astr. Soc., 77: 667–681.
McMechan, G. A., and R. A. Wiggins (1972). Depth limits in body wave inversion. Geophys. J. R. Astr. Soc., 28: 459–473.
Rudzki, M. P. (1898). Uber die scheinbare geschwindigkeit der verbreitung der erdbeben. Beitrage zur Geoph., 3: 495–519.
Tralli, D. M., and L. R. Johnson (1986a ). Lateral variations in mantle P velocity from tectonically regionalized tau estimates. Geophys. J. R. Astr. Soc., 86: 475–489.
——— (1986b ). Estimation of slowness-dependent source and receiver corrections for P wave travel times. Bull. Seism. Soc. Am., 76: 1718–1783.
——— (1986c ). Estimation of travel times for source location in a laterally heterogeneous Earth. Physics of the Earth and Planetary Interiors, 44: 242–256.
Twenty One—
Love and Rayleigh Waves in Irregular Structures
Lawrence A. Drake
Introduction
Now that ocean-bottom seismometers are being operated at continental boundaries and in subduction zone regions, and Love and Rayleigh wave phase and amplitude measurements are becoming widely available (Bolt, 1977; see Nagumo et al., 1986), there is a need for computation of phase velocity dispersion and energy scattering in realistic models of these regions. Also, on a much smaller model scale in the underground coal mining industry, longwall mining is being extensively used, and knowledge of the presence of interruptions in or damage to a coal seam ahead of the mining face is of the very greatest importance in mine planning (Ziolkowski, 1979; Buchanan, 1983)
A method for finding phase velocities and energy scattering of Love and Rayleigh waves across irregular two-dimensional structures was given by Lysmer and Drake (1972). A more complete analysis of the viscoelastic quarter-spaces at the ends of the finite-element model was given by Waas (1972, pp. 30–51). This method has been applied to the analysis of the propagation of Love and Rayleigh waves across continental boundaries (Drake, 1972a , 1972b ; Drake and Bolt, 1980; Seron, 1985) and to the analysis of the propagation of Love waves across subduction zones (Bolt and Drake, 1986). It has also been extensively applied to the study of SH and P-SV waves in coal seams (Drake and Asten, 1982; Asten et al., 1984; Edwards et al., 1985). The analysis of Rayleigh waves at a continental boundary by Drake (1972b ) was approximate and incomplete because computational difficulty in the oceanic quarter-space at one end of the finite-element model prevented using a negligible rigidity for the ocean layers. In 1985 Waas advised that numerical overflow in the analysis of the propagation of Rayleigh waves in a quarter-
space could be avoided by normalizing the eigenvalues in the eigenvalue problem (to avoid division by a very small eigenvalue) and that he had analyzed quarter-spaces of up to 100 layers (see Waas et al., 1985).
Normalization of eigenvectors in the Rayleigh wave quarter-space problem has been simply achieved by expressing dimensions of and velocities within the quarter-space section of the finite-element model that includes water in units like megameters and megameters/s (to scale up the wave number eigenvalues). Now stable, convenient, and comparatively fast computer programs have been written for a VAX 11/780 computer to calculate the phase velocity dispersion and the energy scattering of Love and Rayleigh waves in two-dimensional irregular viscoelastic structures (Drake, 1986). For a finite-element model of forty layers and eighty columns between two horizontally layered quarter-spaces, each of forty layers, the running time for the Love wave program (per frequency) is 13 minutes, with 3.0 megabytes of memory, and the running time for the Rayleigh wave program (per frequency) is 47 minutes, with 4.6 megabytes of memory.
Because water has a viscosity of 1.14 millipascal-second (1.14 × 10⁻² poise), and viscosity is tangential stress per unit velocity gradient, for finite tangential stress there can be no discontinuity in horizontal displacement at the base of an ocean layer. On account of the size of finite elements and the convenience of fixing the base of the finite-element model, finite-element modeling of the propagation of Love or Rayleigh waves across irregular structures introduces errors of a few parts per thousand into computed phase velocities and amplitudes of transmitted Love or Rayleigh waves. Hence, for Rayleigh-wave propagation, the most convenient way to allow for the viscosity of water-finite elements and, at the same time, to secure approximate balance between the energy of the incident Rayleigh waves and the combined energy of the reflected and transmitted Rayleigh waves, is to give the liquid elements of the finite element model a very small rigidity (for example, 1 or 0.01 bar). It does not appear to be necessary at the possibly sliding boundary to make use of a slideline option (with penalty formulation); this option is required rather for very high energy shock discontinuities (Hallquist, 1983, p. 25; 1984, p. 6).
Continental Boundary at Berkeley
An ocean-bottom seismometer, 235 km WNW of Berkeley and beneath 3.9 km of water, was operated from 1966 to 1972 by the Lamont-Doherty Geological Observatory (McGarr, 1969; Bolt, 1977). Because the present finite-element study is two dimensional, Love and Rayleigh waves normally incident on the continental boundary are considered, and the profile AA' in figure 1 is studied. This profile is 240 km long, extending 160 km WSW of the continental shelf near Berkeley to a region in which the ocean depth is 4.5
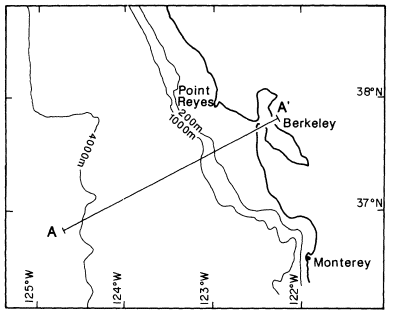
Figure 1
Section AA' of length 240 km normal to the
coastline at the Berkeley seismographic station.
km. The uppermost central portion of the finite-element model for Rayleigh waves with periods between 20 and 34 s is shown in figure 2. The depth to the fixed base of this model was 450 km. A similar model with two water layers (instead of five) and a depth of 1,470 km was used for Rayleigh waves with periods between 35 and 60 s. A third model with ten water layers and a depth of 160 km was used for Rayleigh waves with periods between 10 and 19 s. Lysmer and Drake (1972) and Waas et al. (1985) recommended about eight finite elements per shortest wavelength of shear waves in any region. Hence, as periods and wavelengths decrease, smaller finite elements are used.
The thicknesses of the layers, compressional (P-wave) velocities, shear (S-wave) velocities, and densities of the region at the WSW end of profile AA' (position of a possible ocean-bottom seismometer) down to a depth of 220 km are listed in table 1. They are in general based on the oceanic model of Dziewonski et al. (1975; also see Drake and Bolt, 1980). A value of 0.01 km/s, corresponding to a rigidity of approximately 1 bar, was taken as the shear velocity in the water layer for Rayleigh wave propagation; a value of 0.001 km/s, corresponding to a rigidity of approximately 0.01 bar, gave similar results. The properties of the region below a depth of 220 km, based on the global model of Dziewonski and Anderson (1981), are given in table 2.
The thicknesses of the layers, compressional velocities, shear velocities,
| ||||||||||||||||||||||||||||||||||||||||||||||||||||||||||||||||||||||||||||||||||||||||||||||||
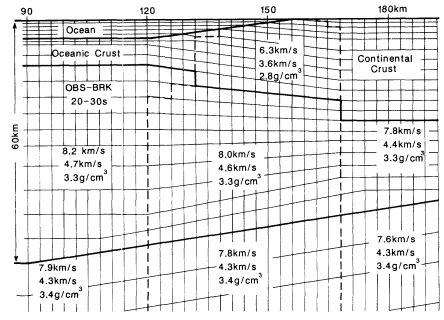
Figure 2
Central portion of the section analyzed by the finite-element
method for periods from 20 s to 34 s.
| ||||||||||||||||||||||||||||||||||||||||
| ||||||||||||||||||||||||||||||||||||||||||||||||||||||||||||||||||||||||||||||||||||||||||||||||||||||||
and densities in the region of the Berkeley seismographic station down to a depth of 220 km are shown on the right-hand side of table 1 (Drake and Bolt, 1980). Intermediate physical properties have been chosen for the region between the oceanic and continental structures (figure 2).
Phase Velocities and Energy Scattering
Numerical analysis of the finite-element models (see fig. 2) gives the complex displacement of all the nodal points and the amplitudes and phases of all the reflected and transmitted Love or Rayleigh modes for a given incident Love or Rayleigh mode at a particular frequency. The mode shapes of the reflected and transmitted Love or Rayleigh waves are normalized so that the energy carried by each of them is proportional to the product of the mode frequency and wave number (Lysmer and Drake, 1972; Waas, 1972).
Phase velocities of the fundamental Rayleigh mode at periods from 60 s down to 10 s across the finite-element models of the section AA' in figure 1 are tabulated in table 3 and shown in figure 3. They are compared with the phase velocities in the regions at the ends of the models. The phase velocities in these regions were calculated by both the method of Haskell (1953) and Dunkin (1965; shear velocity in the ocean water = 0) and the finite-element method. For both the Berkeley and oceanic regions, at periods down to 20 s,
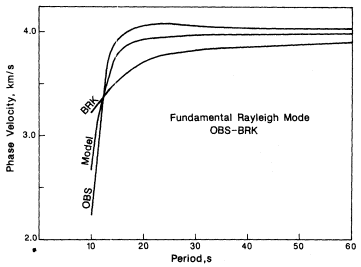
Figure 3
Phase velocity of the fundamental Rayleigh mode across
the continental boundary compared with the phase velocities
of the fundamental Rayleigh mode at the ocean site A in
figure 1 and at Berkeley.
| ||||||||||||||||||||||||||||||||||||||||||||||||||||||||||||||||||||||||||||||||||||||||||||||||||||||||
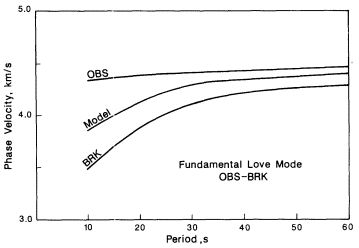
Figure 4
Phase velocity of the fundamental Love mode across the continental
boundary compared with the phase velocities of the fundamental
Love mode at the ocean site A in figure 1 and at Berkeley.
the difference is less than or equal to approximately one part in a thousand. For the ocean region, at a period of 15 s, the difference is approximately one part in 350; at a period of 10 s, the difference is approximately one part in eighty (later reduced by reducing the rigidity of the water in the finite-element calculation) . The mean phase velocities tabulated toward the right of table 3 are the means of the phase velocities of the fundamental Rayleigh mode in the oceanic and Berkeley regions, found by the method of Haskell and Dunkin. The finite-element model phase velocities, tabulated further to the right of table 3, are slightly greater than the mean phase velocities, except at a period of 10s. Mean slowness corresponds to a lower velocity than mean velocity. The high finite-element model velocities almost certainly arise because most of the finite-element model is of oceanic structure and, except at a period of 10 s, the oceanic phase velocity of the fundamental Rayleigh mode is higher than the phase velocity in the region of Berkeley.
Similar values for the propagation of the fundamental Love mode from the oceanic region to Berkeley are recalled from Drake and Bolt (1980; for that paper the width of the finite element model was 200 km). These values are tabulated in table 4 and shown in figure 4. Again, at the shorter periods the finite-element model phase velocity is lower than the mean of the phase velocities found for the regions at the ends of the model by the method of Haskell. This time, however, the phase velocity of the fundamental Love mode in the oceanic region exceeds the corresponding phase velocity at Berkeley. At a period of 10 s, for a path two-thirds oceanic, the travel time for the finite-
| ||||||||||||||||||||||||||||||||||||||||||||||||||||||||||||||||||||||||||||||||||||||||||||||||||
element model for the fundamental Love mode exceeds the expected travel time by one part in twenty-five. Hence, at periods of approximately 10 s, structure appears to cause a slight phase delay for the fundamental Love mode (little energy is transmitted; see table 5).
The normalized amplitudes of the horizontal and vertical displacements of the fundamental Rayleigh mode at a period of 15 s for the oceanic region at the WSW end of section AA' of figure 1 are shown in figure 5. A rigidity of 1 bar was assumed for the ocean layer. The potential for the horizontal and vertical displacements of a single propagating Rayleigh mode in a perfectly elastic fluid at the surface of a half-space can be written as
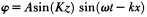
where A is a source term, K is

Figure 5
Normalized amplitudes of horizontal and vertical
displacement of the fundamental Rayleigh mode
at the ocean site in figure 1 for a period of 15 s,
with and without a horizontal displacement
discontinuity at the ocean bottom.
the short dashed line in figure 5. The normalized amplitude of the horizontal component near the surface and below the base of the fluid layer, and the normalized amplitude of the vertical component are shown by the continuous lines for the very slightly rigid model in figure 5.
The percentages of energy reflected and transmitted for incident motion from the ocean side of the fundamental Love and Rayleigh modes at the continental boundary near Berkeley at periods from 60 s down to 10 s are tabulated in table 5. The transmitted energy percentages are subdivided into that for the fundamental mode and the total for the remaining higher modes. The values for Love waves are recalled from Drake and Bolt (1980). The percentages of energy in the transmitted fundamental Love and Rayleigh modes are shown in figure 6. The comparatively unhindered passage of the fundamental Rayleigh mode at periods of approximately 20 s across the continental boundary, compared with the almost total absorption of the fundamental Love mode at the same periods, suggests why it is preferable to use Rayleigh rather than Love waves for the measurement of the magnitudes of
Figure 6
Energy transmitted (percent) for the fundamental Love and Rayleigh
modes from the ocean site A in figure 1 to Berkeley (A').
shallow teleseisms. Also, at periods of approximately 10 s, most of the Love wave energy is scattered forward, while most of the Rayleigh wave energy is scattered back.
Conclusions
Stable, convenient, and comparatively fast computer programs have been written for a VAX 11/780 to calculate the phase velocity dispersion and the energy scattering of Love and Rayleigh waves in arbitrary two-dimensional irregular viscoelastic structures. These programs are based on the finite-element method and analyze forty rows and eighty columns of trapezoidal finite elements, as well as two layered quarter-spaces at the ends of the model. They have been applied to problems as diverse in scale as the study of continental boundaries and subduction zones down to the study of interrupted and damaged coal seams. In the study of the propagation of Rayleigh waves across regions including volumes of water, the water, because it is very
slightly viscous, is assumed to have a very small rigidity (1 or 0.01 bar). If the water is taken to be, at the same time, perfectly elastic, the energy balance between incident Rayleigh waves and reflected and transmitted Rayleigh waves serves as a very useful check on the model study.
In this paper, results of a study of the propagation of Love and Rayleigh waves from the ocean side across the continental boundary near Berkeley show that, at periods from 60 s down to 20 s, the phase velocities of both Love and Rayleigh waves across the finite-element model of the continental boundary are slightly greater than the means of the phase velocities of these waves in the quarter-spaces at the ends of the model. These effects almost certainly arise because, in this period range, the oceanic phase velocities are higher than the continental phase velocities, and the finite-element model is of predominantly oceanic structure. At periods of approximately 10 s, the fundamental Love mode appears to experience a slight phase delay.
At periods from 60 s down to 10 s, the energy of the fundamental Love mode is scattered increasingly forward. At periods from 60 s down to 20 s, 95 percent of the energy of the fundamental Rayleigh mode is transmitted. Hence, Rayleigh waves with periods of approximately 20 s are useful for measuring magnitudes of shallow teleseisms. At periods of approximately 10 s, most of the energy of the fundamental Rayleigh mode is scattered back.
Acknowledgments
Prof. Bruce Bolt originally suggested this problem of the propagation of Love and Rayleigh waves in irregular viscoelastic two-dimensional structures. Prof. John Lysmer (Division of Transportation Engineering, University of California, Berkeley) and Dr. Günter Waas (Hochtief AG, Frankfurt/Main, West Germany) in large measure solved it. Prof. Robert Herrmann at St. Louis University provided a computer program incorporating Dunkin's formulation for Rayleigh waves in horizontally layered structures. Finally, the staff at the Computer Centre at Macquarie University generously made computing facilities available.
References
Asten, M. W., L. A. Drake, and S. A. Edwards (1984). In-seam seismic Love wave scattering modeled by the finite element method. Geophys. Prospecting, 32: 649–661.
Bolt, B. A. (1977). Ocean bottom seismometry. A new dimension to seismology. Boll. di Geofisica, 19: 107– 116.
Bolt, B. A., and L. A. Drake (1986). Love mode dispersion across subduction zones by finite element modeling. Geophys. J. R. Astr. Soc., 84: 515–528.
Buchanan, D. J. (1983). In-seam seismology: A method for detecting faults in coal seams. In A. A. Fitch, ed., Developments in Geophysical Exploration Methods— 5 Applied Science Publishers, London, 1–34.
Drake, L. A. (1972a). Love and Rayleigh waves in nonhorizontally layered media. Bull. Seism. Soc. Am., 62: 1241–1258.
——— (1972b). Rayleigh waves at a continental boundary by the finite element method. Bull. Seism. Soc. Am. 62: 1259–1268.
——— (1986). Computer aided detection of faults in coal seams. In Australian Coal Science 2 Proceedings, Australian Institute of Energy, Newcastle, N.S.W., 192–197.
Drake, L. A., and M. W. Asten (1982). Wave propagation in irregular coal seams. In P. J. Hoadley and L. K. Stevens, eds., Finite Element Methods in Engineering. University of Melbourne, Victoria, 119–123.
Drake, L. A., and B. A. Bolt (1980). Love waves normally incident at a continental boundary. Bull. Seism. Soc. Am., 70: 1103–1123.
Dunkin, J. W. (1965). Computation of model solution in layered, elastic media at high frequencies. Bull. Seism. Soc. Am., 55: 335–358.
Dziewonski, A. M., and D. L. Anderson (1981). Preliminary reference Earth model. Phys. Earth Planet. Inter., 25: 297–356.
Dziewonski, A. M., A. L. Hales, and E. R. Lapwood (1975). Parametrically simple earth models consistent with geophysical data. Phys. Earth Planet. Inter., 10 : 12–48.
Edwards, S. A., M. W. Asten, and L. A. Drake (1985). P-SV wave scattering by coal-seam inhomogeneities. Geophysics, 50: 214–223.
Ewing, W. M., W. S. Jardetzky, and F. Press (1957). Elastic Waves in Layered Media. McGraw-Hill, New York, 1–380.
Hallquist, J. O. (1983). Theoretical Manual for DYNA3D. Lawrence Livermore National Laboratory, California, 1–82.
——— (1984). User's Manual for DYNA2D—Explicit Two-Dimensional Hydrodynamic Finite Element Code with Interactive Rezoning, Revision 2. Lawrence Livermore National Laboratory, California, UCID- 18756, 1–115.
Haskell, N. A. (1953). The dispersion of surface waves on multilayered media. Bull. Seism. Soc. Am., 43: 17–34.
Lysmer, J., and L. A. Drake (1972). A finite element method for seismology. In B. A. Bolt, ed., Methods of Computational Physics 11. Academic Press, New York, 181–216.
McGarr, A. (1969). Amplitude variations of Rayleigh waves—Propagation across a continental margin. Bull. Seism. Soc. Am., 59: 1281–1306.
Nagumo, S., T. Ouchi,J. Kasahara, and S. Koresawa (1986). P-wave velocity in the lower lithosphere in the western Northwest Pacific Basin observed by an ocean-bottom seismometer long range array. Bull. Earthq. Res. Instit., 61: 403–414.
Seron, F. J. (1985). Love waves across the Atlantic continental margin of the Iberian Peninsula (Spanish with English abstract). Rev. Geofisica, 41: 219–236.
Waas, G. (1972). Earth Vibration Effects and Abatement for Military Facilities. U.S. Army Engineer Waterways Experiment Station, Vicksburg, Mississippi, 1–182.
Waas, G., H. R. Riggs, and H. Werkle (1985). Displacement solutions for dynamic loads in transversely-isotropic stratified media. Earthquake Eng. Struct. Dyn. 12: 173–193.
Ziolkowski, A. M. (1979). Seismic profiling for coal on land. In A. A. Fitch, ed., Developments in Geophysical Exploration Methods— 1. Applied Science Publishers, London, 271–306.
Twenty Two—
The Transient Regime of the Free Oscillation Spectrum:
The View from the South Pole
L. Knopoff, P. A. Rydelek, and W. Zurn
Introduction
In these days of large networks and arrays, of global and especially tomographic studies, it might seem presumptuous to try to discuss single-station seismological observations. However, in the case of the seismic station at the South Pole, the geometrical symmetries are so remarkable that several useful conclusions of a pedagogic nature can be drawn that will allow us to develop a strategy for performing meaningful if not accurate observations of the free-oscillation spectrum anywhere on Earth.
All points on a conservative oscillator vibrate with the same set of eigenfrequencies. This being the case, how can we justify the use of spatial fluctuations in local measurements of the periods of the free oscillations to determine the location of lateral inhomogeneities in the Earth's interior? Why should there be fluctuations in the spatial distribution of the observed periods of free oscillations? The answers to these questions depend on the answers to other questions that test two assumptions that appear in these opening remarks: (1) Is the earth conservative; that is, is it nonattenuating? Since the answer to this question is obviously no, we ask whether the violation of the assumption of conservation is sufficient to allow us to proceed with the identification of the locations and magnitudes of the inhomogeneities in the Earth's interior. (2) How is the Fourier spectrum of a real seismogram related to the free oscillations of a conservative, or nonattenuating, Earth? The answers to these two questions are the subject of this paper.
Lateral variations in the frequencies of spectral peaks have been reported widely by many authors, for example, Silver and Jordan (1981). Our own illustrations show spectral amplitudes in the neighborhood of mode 0 S22 , namely at periods near 300 s, of an earthquake in the New Ireland region,
observed with sibling ultralong-period instruments (Nakanishi et al., 1976) located at UCLA and the South Pole (fig. 1a ), and similar observations made at one station, the South Pole, of two earthquakes on widely differing azimuths (fig. 1b ). Similar period differences are found in the first instance even if the two stations and the earthquake source are located on a common great circle and in the second if the two earthquakes and the station are on a common great circle. The differences in the peak frequencies lead us to the conclusion that the peak spectral response depends on the location of both the earthquake and the seismograph. It is customary to identify the frequency of the spectral line with the peak of the response spectrum (Dahlen, 1981), and we adopt this procedure here as well. There is a reciprocity between the free-mode and the traveling-wave descriptions that is given by Jeans's formula, ka = l + 1/2, where l is the mode number, k =w/c , w = 2p/ T , T is the period of free oscillations, a is the radius of the Earth, and c is the phase velocity of the corresponding traveling waves. Since the free oscillations are the standing wave system formed out of the appropriate traveling surface waves of the same period, we can use either point of view, as convenience dictates.
In this paper, we discuss exclusively observations of the spectra for modes 0 S20 to 0 S25 , which have periods of roughly 300 s. These modes are usually well recorded with large amplitudes on ultralong-period instruments, and several of them are relatively free of coupling to nearby toroidal modes. Because of nonsphericity, lateral inhomogeneities, and rotation, each spectral line is composed of 2l + 1 singlets associated with the azimuthal order number m. Each of the singlet lines in the fine structure is broadened because of attenuation. Since the attenuation-induced broadening of each line in the fine structure is considerably greater than the spacing between neighbors, and since the amplitudes of each singlet vary from place to place over the Earth, the phased sum of all the 2l + 1 attenuation-broadened singlets will yield what appears to be a single broadened line, but one whose peak frequency varies from place to place because of the variations in amplitudes of the individual components in the sum. According to Dahlen (1981), the period and width of this peak describe the average elastic and anelastic properties of the Earth along a great circle connecting the earthquake and the seismograph, in a zeroth order approximation. Thus, although a complex peak like those shown in figure 1 contains 2l + 1 pieces of amplitude information plus some frequency information, compaction of the more than 2l + 1 pieces of information into one piece of frequency information and not much amplitude information causes a drastic loss of information. We must ask whether the acquisition of many pieces of this type of compacted information is sufficient to compensate for the loss of direct information about the singlets and, if so, how these data are to be interpreted to yield information about the structure of laterally inhomogeneous earth models.
Lateral Inhomogeneities in Structure
Suppose that it is not possible to determine the laterally inhomogeneous structure of a nonatten-uating Earth model from the distribution of the peaks in the summed fine-structure spectrum. Can we determine the structure in some other way? Students of introductory geophysics will reply that we can always do travel-time seismology on a nonattenuating Earth to study its laterally inhomogeneous structure. In other words, if we study the earliest parts of a seismogram, we can determine the lateral structure of a nonattenuating Earth, but if we study the complete seismogram, according to our supposition, we cannot. How do the properties of the early part of the record approach the steady-state or free-oscillation signal as we move to later times along the seismogram? As we shall see below, whether or not the nonattenuating Earth model seismogram equilibrates, that is, approaches some steady-state properties after a long elapsed time, depends on the way in which it is analyzed. Under some methods of data analysis, it may be that the seismogram seemingly never settles into a stationary state even after a very long time. If the long-term seismic signal is not stationary, harmonic analysis of any two finite samples of the seismogram will yield two different eigenfrequency estimates. Hence, in some quite realistic cases, we will find that we cannot determine the eigenspectrum of a nonattenuating earth from long but finite samples of seismograms, at least by conventional methods.
Is the fact that the Earth is not conservative the way out of the above dilemma? We may suppose that because of line broadening of the fine structure of any given mode, mode coupling will take place, thereby leading to an equilibration even of the apparently nonstationary properties taken in the nonattenuating limit. Hence we presume that a stationary spectrum should always appear in the later parts of the seismogram. If this presumption should turn out to be correct, and if one can obtain only the global average properties of the Earth from the stationary spectrum, then the location and size of the lateral inhomogeneities within it cannot be identified from these data alone. As it will turn out, if attenuation in the Earth is distributed inhomogeneously, then the very-long-term spectrum will be stationary; however, the relationship between these spectral determinations and the identification of the part of the Earth that is being sampled is not immediately obvious. In this case, the diagonal sum rule will not apply. Fortunately, for our purposes, we will see that this is a part of most seismograms that is not analyzed in most cases, even for large earthquakes, because of insufficient record length, and hence the solution to the complete problem of the interpretation of the stationary, spatially attenuating Earth is mainly of academic interest at the present time.
From the point of view of traveling surface waves, some of the same difficulties can be identified. In the early stages of a seismogram on a nonatte-
nuating Earth, waves of a given period travel on a geodesic, which is nearly a great circle for small lateral inhomogeneities. Since the local seismic properties of different geodesics on an inhomogeneous Earth are different, the globe-circling travel times tgc (and hence the equivalent periods of free oscillations) will be different from path to path. The relation between the two is tgc= (l + 1/2)T . As the signal is scattered from the inhomogeneities, the surface wave number vector no longer points along the geodesic that includes the source and, in the later parts of the seismogram, may point in varying directions. For a nonattenuating Earth, the estimates of the eigenfrequencies in a one-dimensional case will be shown to be stationary, even though the signal continues to reverberate forever among the inhomogeneities in a nonrepetitive way, except for certain special geometries not likely to arise for a real Earth. In the language of statistical mechanics, we state that the seismic waves are fully mixed, even though the signal is not repetitive. But in the presence of lateral variations in attenuation, the wave trains that pass through or near those parts of the Earth with higher attenuation are attenuated more rapidly than those passing through less absorptive parts. We can then expect some frequency shifts to take place relative to the nonattenuating case, at least in the extremely long-term limit.
Spheroidal Modes [sub(0)]S[sub(20) to [sub(0)]S[sub(25)]Spheroidal Modes 0 S20 to 0 S25
In principle, the fundamental spheroidal modes near a period of 300 s are in a truly complex part of the seismic spectrum. There are five perturbing influences on the estimates of the spectrum of free oscillations of the Earth, other than radial structure and source mechanism, that we must take into account in constructing a theory of the seismogram. Since four of these are small, we can assume that some sort of perturbation expansion in dimensionless parameters describing these four quantities is possible. These four properties, and their dimensionless estimates for periods near 300 s are
|
All of these quantities are multiplied by additional dimensionless functions of the radial properties of a spherical Earth, but let us assume that these latter are of the order of unity. This argument suggests that, unless we are very lucky, we cannot neglect any of these four influences in a perturbation expansion to determine small frequency shifts from the global averages. In the above, the Earth's rotation rate is W . We estimate h directly from observations described below.
The fifth parameter is the length of record, which is some function of the magnitude of the earthquake in units of the noise level of the detection, and it
is our hope that the noise-to-signal ratio is also small. Usually, efforts have been made to make these records as long as possible. These enthusiasms may be misplaced if, as we believe, the most effective and available observations needed to determine the distribution of lateral inhomogeneities in the Earth are those made in the early part rather than the later, hopefully spectrally steady regime of a seismogram. As we shall show, the duration of the early phase may be of the order of 200 hours; we call this the mixing time. Since most of the efforts at identifying the Earth's spectra, by ourselves as well as others, have been made on the early part of the seismograms, we suspect that the long-time-scale spectra, which yield global average estimates, are those that have not been well determined. Since we cannot expect to obtain global average spectra from long-period records that are of short duration in comparison with the mixing time—and attenuation does not permit us to resolve the spectra of the fine structure directly (see fig. 1)—an auxiliary question we must ask is: What information concerning global average spectra is in fact to be derived from knowledge of the spatial distributions of the peak frequencies such as those in figure 1?
Despite these pessimistic comments regarding the potential equivalence of most of the perturbing influences in the period band of fundamental mode Rayleigh waves near 300 s, we can minimize the influences of two of these effects in at least one case. Because of obvious symmetries, vertical component observations made at the geographic South Pole are free of the influences of flattening and of rotation—though not of Coriolis-induced coupling to the torsional modes (Park, 1986)—at least in the early parts of the seismogram. At some late time on a seismogram at the South Pole, the signal may have become fully mixed by scattering from lateral inhomogeneities, taking into account the influence of coupling through the attenuation. At this later stage, the effects of rotation and flattening are also observed at the South Pole, by virtue of the scattering of seismic signals from nonpolar paths from these distant inhomogeneities. But since our seismograms at the South Pole are short in duration compared with the mixing time, these latter considerations do not concern us here, except in an academic sense.
Observations of Periods of Free Oscillations at the South Pole
The unusually simple and attractive structural model derived by Masters et al. (1982) provides a convenient and useful check on observations made at the South Pole. Although their interpretation of observations of anomalous free-oscillation periods has been heavily smoothed, it nevertheless represents an excellent target for validating our own observations. Modes 0 S20 to 0 S25 are in one of the four period bands used in the analysis of Masters et al. As we have remarked, we expect that any fluctuations in period of the modes at the
Figure la
Spectral response at UCLA (dots) and the South Pole for modes 0 S22
and 0 S23 for the New Ireland earthquake (18 March 1983, Ms = 7.6).
Seismograms are 40 hours in length; Hanning window. l b Spectral
response at the South Pole for modes 0 S22 and 0 S23 for the New
Ireland and Colombia (12 December 1979, Ms = 7.7) earthquakes.
South Pole in the transient or early part of the seismogram would seem to be due almost exclusively to the influence of inhomogeneities along the great circle paths. It is later in the seismogram that the signal becomes coupled to all the perturbing influences. Harmonic analysis of the records of nine large earthquakes on essentially seven different azimuths yields the plot of the frequency shift as a function of azimuth of the source for mode 0 S23 , shown in figure 2a . The length of record of each seismogram is 40 hours, which matches that of the shortest usable recording; the records were identically tapered with a Hanning window. The phase of the roughly sinusoidal graph is in good agreement with the prediction given by the model of Masters et al., and we are encouraged by the smoothness of the relative values. However, the latter property is not a prerequisite for a match in our case, since the target results were smoothed to yield an approximately sinusoidal curve of anomaly. We also note that the two pairs of events on almost the same azimuths are in excellent agreement, although this is not too unexpected, since the sources of the pairs were almost at the same location in each case; the agreement is testimony to the fidelity of recording and the large signal-to-noise ratio in both cases.
Our expectation is that the anomaly-versus-azimuth graph for mode 0 S22 should be strongly similar to the curve for neighboring mode 0 S23 , since the eigenfunctions for the two cases are very close to one another. The graph (fig. 2b ) shows large inconsistencies, with both our results for mode 0 S23 as well as the expectation that the general outline should be smooth and sinuous. The values of the nine points in the two cases differ by far more than the mutual standard deviations at the 2s level. Nevertheless, the consistency of the results for the pairs of events on common azimuths in both cases points to a nonstatistical origin for the discrepancy between the two sets of data.
Inspection of similar results for modes 0 S20 and 0 S25 show that the distribution of the nine estimates of period in the former case are relatively smooth and in agreement with expectations from the distribution for mode 0 S23 , while the result in the latter case is once again significantly irregular and discordant with expectations. If we average the anomalies across all four modes (Masters et al. averaged across modes 21, 22, and 23), we get a pattern that is arguably sinusoidal and whose peak-to-peak amplitude as a function of azimuth is about 1/300, while the result for mode 0 S23 , our least disturbed case, is about 1/200, a 50-percent difference. We add a further question to our list: What is the cause of the rather obvious, large, and significant period shifts away from the sinuous pattern for some modes?
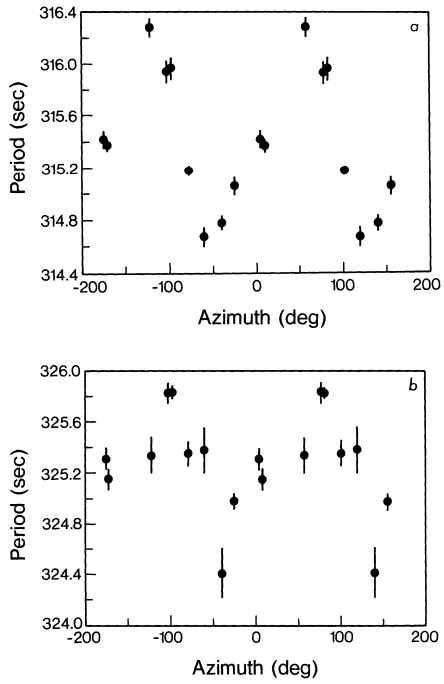
Figure 2a
Period of mode 0 S23 at the South Pole as function of azimuth for
nine earthquakes. 2b Same as in figure 2a except for mode 0 S22 .
A One-Dimensional Pedagogic Model
In the theory of the full problem of the evaluation of the normal modes of an almost spherical Earth with all four perturbing influences, the usual solution is derived from the application of perturbation theory to a spherical, radially inhomogeneous, nonrotating, isotropic Earth model. As we have seen, none of the four perturbing influences can be neglected in the construction of the theoretical model in this period range. The theory that takes all four influences into account is extraordinarily messy algebraically. To try to gain physical insights into the nature of the behavior of seismic wave propagation in the full problem, we have had recourse to a pedagogic model, in which we have benefited from the example of Geller and Stein (1978).
Consider a twofold degenerate skeletal Earth model consisting of only two dependent homogeneous vibrating strings along which waves can propagate from the source. This is in contrast to the more appropriate condition of (2l + 1)-fold degeneracy in which we can imagine that 2l+ 1 strings radiate from a given source in mode l , all 2l + 1 singlets being, in general, excited. We remove the degeneracy, that is, induce binary line splitting, by letting the velocity on one string be slightly different from that on its twin. We can imagine that this models the effect of ellipticity perturbations on a spherical Earth, since the round-trip travel time on a polar path will be less than on any other. To model scattering by lateral inhomogeneities, we let part of the signal on one string be transferred to the other string through an isotropic coupling device; for computational reasons, we transfer the simulated scattering instantly, with zero time delay between the two strings.
Given the constraints of the above model, we imagine that we have an inhomogeneous string composed of two separately homogeneous halfsegments, each 20,000 km in length. The wave velocities on each half-string were taken to be roughly 5.5 km/s in the numerical simulations, with velocity differences on the two strings that ranged from about one part in 50 to one part in 180. The outer edges of the string segments are fixed; the strings are decoupled if the impedance contrast at the midpoint junction is infinite. In the decoupled case, the period of the 22d mode is about 330 s on each half-string. To introduce a weak coupling at the midpoint, we let the impedance contrast between the two strings be very large. The acoustic impedance of a string is the product of the density and the wave velocity. Since the wave velocities on the two strings are almost the same, we are obliged to introduce a large density contrast between the two strings to generate the large impedance contrast; this requirement is, of course, a nongeophysical assumption but one that will not alter any of the relevant conclusions we draw from this model. In our numerical experiments, we used values of the impedance ratio Z that varied from 10 to 50, which are essentially the density ratios. The weak coupling is intended to simulate weak scattering from seismic waves from one great circle path to the other.
The signal source on the model is chosen to be a delta function of time, for ease in numerical computation of a "theoretical seismogram." Attenuation, when present, is also chosen to have a nongeophysical property for computational purposes: we let 1/Q be proportional to frequency, and hence the attenuation factor independent of frequency. Under these conditions, a (delta function) signal on the string propagates without change of waveshape. A detector located along the string will record a series of delta functions that arrive at times corresponding to the multiple reflection times (n/c 1 + m/c2 )L, with n and m integers; the amplitudes of the pulses will vary with the values of 1/Q on each string and the transmission and reflection coefficients at the midpoint.
Although a simulation of earthquake motions would demand that we excite both strings with separate sources, we place the source on only one string to expose the physical relationships. Suppose that we place the detector on the same string segment as the source. In this case, we find that the detector records seismic signals in the early part of the time history that resemble a simple reverberation of a delta function on "its own" string, albeit with decreasing amplitudes. Analysis of a finite segment of this part of the time history gives a spectrum dominated by the properties of the source string as though it were homogeneous but with damping due to the energy loss by scattering; little or no evidence of binary line splitting is present, at least if the time segment is sufficiently short. Much later in the time history, we observe the effects of transfer of energy between the two strings; we expect to see a spectrum of a finite part of this portion of the time history that has a significantly different character from that of the first part of the time history. If stationarity is achieved in the later part of the time series, we expect to see binary spectral line splitting, in contrast to the spectrum of the earlier part of the record. The student should not expect that the spectrum of the stationary case will be the same as that of an interleaved pair of combs of delta functions of equal amplitudes; in the latter case the spectral peaks should occur at frequencies nc1 /2L and mc2 /2L. The eigenvalue problem for the inhomogeneous string is the solution to
which is a transcendental equation that yields the characteristic complexity expected, including the binary line splitting. For large Z, the solution to the above eigenvalue equation yields a frequency interval of splitting between the pairs of
For 1/Z of the order of D c/c (as we have suggested, these numbers are all about 1/300) the line splitting for modes near 22 or so is dominated by the
Figure 3
Forty-hour synthetic "seismogram" for an inhomogeneous string
with delta function source. Impedance ratio Z = 10, Q = ¥ .
velocity differences between the two segments of the string. If we extend this observation to the Earth, the fine structure in this frequency range in the stationary regime is dominated by ellipticity, rotation, and path-propagation effects; those of multiple scattering by inhomogeneities are much smaller still. At the South Pole, however, the perturbation of the frequencies of the lines in the spheroidal spectrum due to ellipticity and rotation is of course zero. The differences between the frequencies of the spectra for the comb of uniform amplitude delta functions and the comb of pulses on the inhomogeneous string are due to amplitude modulation of the comb by the multiple scattering from the inhomogeneity.
An example of a synthetic seismogram on the inhomogeneous string is shown in figure 3 in the case in which the attenuation factor for wave propagation on the string is zero. The mixing time of these seismograms is approximately ZlT / 4, approximately five hours. As noted, a more appropriate value of Z for the earth is about 300; we have lowered it dramatically in this example for purposes of display, as well as to be able to describe the postmixing-time behavior of the spectrum. In this case, we find that the signal is indeed mixed. That is, harmonic analysis of finite segments of the record of fixed length yields the same frequency estimates for arbitrary start-
ing times of the segments; the frequency estimates of a record segment sufficiently long to resolve the doublet are the solutions to the eigenvalue problem but not the set for the uniform double comb in a simple way. The presence of a starting "transient" dominated by the properties of the "source string" is clearly visible on seismograms with much larger Z for which the mixing time is longer.
If we use a record segment of length too short to resolve the doublet, the shape of the spectrum appears to be that of a broadened singlet. If we fit this apparent spectral singlet with a line whose shape is that appropriate to a Q -broadened singlet, we find that the frequency of the peak is not constant with starting time for the time segment, but is nonstationary and in fact oscillates between the appropriate overtone frequencies of the two strings separately. In other words, frequency analysis of this early, premixing-time part of the record yields spectra that correspond, almost precisely, to our expectations for the homogeneous source string.
Influence of Attenuation
If we add the effects of attenuation to the synthetic procedure, we identify three discernible effects:
1. There is a second time scale that defines an early, transient regime on the seismogram that may be either longer or shorter than the mixing time associated with multiple scattering. We can estimate the attenuation time scale as follows: Consider for the purposes of pedagogy (again) a coupled oscillator system with two degrees of freedom. Imagine that we have masses and springs as indicated in figure 4. Without the central coupling spring, the two oscillators are decoupled. We set the frequencies of each to be close to one another, with a notation that is purposely intended to remind the reader of the four perturbing influences on the spectrum of free oscillations of the Earth. If we couple the pair with a weak spring intended to simulate scattering by lateral inhomogeneities, we get a frequency doublet for the spectrum
Figure 4
Slightly nondegenerate coupled oscillators with attenuation.
with individual singlet frequencies that are perturbed from the decoupled case. If there is no attenuation in the system, and we give the coupled system an initial impulse, we find that the system continues to oscillate stably for all time. If we now introduce attenuation into the model, we find that the two modes decay, as expected, and the decay rates will differ if the damping of the two masses is different. After a sufficiently long time, one mode has much larger amplitude than the other, and spectral analysis of this part of the time series for the motion of either mass will show a singlet spectral line that is attenuation broadened. The 1/e time for disappearance of the mode with the lower Q is of the order of rQT/p , where r is a number about 3.2 in the case of equal values of e and h and almost equal values of Q . Thus, we may expect the attenuation transition time to be roughly QT , which is about 25 hours for Q = T (s) = 300. This is rather shorter than the mixing time due to scattering, which we have estimated to be lT/ 4h , or roughly 150 hours for Z ~ 300.
Thus, for real seismograms with lengths of the order of 25 hours, the spectral structure should resemble that of a singlet with Q and peak frequency appropriate to the great circle path that includes both the stations and the seismograph, excepting effects of rotation and possibly the location of the source, neither of which has been taken into account in the modeling thus far. If longer seismograms were available, Fourier analysis of short segments would show a shift in frequency if the great circle through the station is not a path of greatest Q .
To test the above, we performed Fourier analysis of overlapping 20-hour segments, with starting times ranging from 0 to 40 hours in 4-hour steps, of the seismogram for the Sumbawa earthquake of August 1977, which was our record of greatest useful length. Under these conditions, estimates one and six, for example, are independent. In the case of mode 0 S23 , we see that the estimate of the period from these short records changes significantly over the 40-hour interval and reaches a maximum at about 30 hours after the start of the record (fig. 5), a time that is in good agreement with the estimate QT. We are not able to explore this record to observe the spectral behavior for times longer than QT.
Mode 0 S23 was one of the modes that fit the smooth expectation model well. From the display of figure 5, we may take it that significant fluctuations in the estimates of even the "good" modes may occur if we use the early parts of the seismogram. Since the 1/e decay time of signal amplitude is QT/p , most of the energy in the original estimate of the periods is taken from an effective record length much shorter than the first 40 hours. We can assume that measurements reported in the literature of free-oscillation periods obtained from very long seismograms may show frequency fluctuations with record length similarly.
2. The spectral properties of longer, real seismograms are probably only of academic interest since records of length greater than QT are not normally
Figure 5
Period of the spectral peak for mode 0 S23 from the seismogram of the Sumbawa
earthquake (19 August 1977, Ms = 7.9) at the South Pole. Spectra are obtained
from a sequence of 20-hour long segments, each Hanning tapered. The
window start time is shifted by four hours at each data point.
available. A moving-window analysis for a string seismogram similar to that for figure 5, but in this case with attenuation and in the regime t > QT , shows that the period of the estimate is relatively stable with time on the seismogram (fig. 6), with only a small "wow" or ripple. We infer as before that the ripple is due to the interpretation of the spectral doublet as a singlet and the fitting of this with a singlet line-shape fitting operator in a regime where the seismogram sample is of relatively short duration.
3. If we repeat the analysis of the string seismogram in the regime t > QT as above, but shift the location of the source by 200 km, a small fraction of a wavelength in this mode, we find that the average value of the period estimate, except for one anomalously low value, is more than one second lower than in the first case (fig. 6). We observe that in one of the two cases, the receiver is close to a display point of resonance on "its own" string. In this case, the receiver detects only the signal scattered from the coupling (designed to simulate scattering from lateral inhomogeneities) that has the characteristic properties of resonance on the adjoining string. Thus, in this case, the signal is dominated by the properties of resonance of waves on a string segment on which it is not located.
Figure 6
Period of the spectral peak for mode 23 for a string seismogram taken
through a sequence of 20-hour Hanning windows shifted as in figure 5.
The upper curve is for a source at coordinate 6,000 km, while the lower
is for a source at coordinate 5,800 km. In each case, Z = 50, Q = 200.
We can suppose therefore that the modal periods measured in the early parts of the seismogram at the South Pole, for example, will be dominated by the properties of the great circle through the South Pole and the epicenter, unless the South Pole is at a nodal point for the radiation pattern of the mode. If the South Pole is near or at a nodal point for the standing wave pattern for the mode under consideration, then the signal at the South Pole, although weak, will yield a period for the mode that is strongly influenced by scattering from lateral inhomogeneities, and may be dominated by signals with periods characteristic of other great circle paths through the epicenter, as well as the effects of rotation and of torsional-spheroidal mode coupling.
Although the long-term properties of the seismogram in which multiple scattering dominates the properties of the signal do not concern us here, we can guess that this part of the record will be nonstationary for sample lengths that are too short to permit the multiplets to be resolved. Were this part of the record observable, the frequency of this mode would not be given by the diagonal sum rule, but would probably correspond to the singlet with the highest Q .
Conclusions
1. Most present-day measurements of periods of free oscillations are made in a transient rather than steady-state regime of the seismogram. Under these circumstances, the periods of the peak of the resonance response curves for unresolved multiplets generally characterize the properties of the geodesic (which is usually a great circle) through the station and the epicenter. It is this property that allows tomographic analysis to be performed on the data. This procedure fails when the station is at a nodal point for the mode; the nodal pattern is simply calculated as though the epicenter is at the pole of a spherical coordinate system, the focal mechanism being taken into account. If we make observations at locations remote from a nodal point, the perturbing effects of rotation, flattening, and scattering can be neglected in the zeroth order.
2. If the station is at a nodal point of the radiation pattern, significant period shifts may be observed, since the signal received at the station is derived mainly by scattering from lateral inhomogeneities, rather than by sampling the great circle path through the source.
Is there any way out of the difficulty in the use of seismograms that yield erratic period measurements, that would permit us to make use of these data without summarily discarding them? Indeed, is there some way to treat all data in the same way without having to identify which points are "good" and which "bad"?
One solution to this problem would seem to be to get rid of the standing wave pattern that produced the nodal points. Since the standing wave pattern is the result of the juxtaposition of oppositely traveling wave trains, we may delete either wave trains R2n or R2n +1 from the time series and perform harmonic analysis on the windowed semi-seismograms. Since all the wave trains now travel in the same direction, no complexities due to standing wave patterns arise. Since the primary signal is now strong and no longer nearly zero, all perturbing effects due to scattering or mode coupling are of higher order, unless we happen to be located at a nodal point in the radiation pattern of the source. In the latter event, we can offer no solution to the problem. Barring this last eventuality, we expect that the large fluctuations observed in figure 2 should be removable. (We are aware that under some circumstances, wave train R4 , for example, may have a larger amplitude than R 3 , a fact that cannot be explained without invoking the focusing effects of lateral inhomogeneities.) We pay a penalty, in the form of larger error bars, for dividing the record into two parts because of the poorer signal-to-noise ratio; the actual size of the error bars depends on the method used in the data analysis and the windowing of the seismograms.
The results of the phase-velocity or, equivalently, the free-mode-period analysis for thirteen seismograms recorded at the South Pole, including the
original nine studied by windowing out alternating wave trains, are shown in figure 7 for modes 0 S22 and 0 S23 . The inconsistencies for mode 0 S23 are now removed and, within the error bars, the results for both modes are consistent with each other. The results for modes 0 S20 and 0 S25 are similarly consistent with the first two. We do not discuss the method of data analysis of the traveling waves here; that is reserved for a subsequent publication (Gruenewald et al., in preparation).
The unsmoothed results of figure 7 show sets of long periods or low phase velocities on a narrow band of azimuths that would seem to correspond to the location of the East Pacific Rise and its antimeridian. A short modal-period anomaly is found over a broad range of azimuths with an azimuthal extremum that is asymmetric to the long-period maximum and corresponds roughly to the azimuths of the subduction zones in the Western Pacific and their antimeridian. We refrain from drawing any more detailed structural associations, since we do not know from this analysis where the anomalies are located on the great circles through the South Pole. Smoothing of the curves of figure 7 by a harmonic of the second degree gives good agreement with the target results of Masters et al. (1982).
Although we indicated that measurements made at the South Pole may have advantages due to symmetry over similar measurements made at nonPolar latitudes, this has not turned out to be literally true. However, the South Pole measurements have allowed us to lay bare a strategy for data analysis at almost any station on the surface of the Earth. By windowing any seismogram to delete alternating wave packets R 2n+ 1 or Rn , we minimize the incidence of erratic period measurements at the expense of a poorer signal-tonoise ratio. Since the measurements are in the transient part of the signal, the phase velocity or period results can be corrected for ellipticity simply by taking into account the circumference of the great circle path through the station and corrected for rotation by taking into account the length of path in an inertial frame; we recall that the meridional component of the wave number vector for R2n or R2n+ l is either parallel or antiparallel to the rotation of the Earth.
To respond to an earlier question, it is the fact that relatively short seismograms are used in the analysis that allows measurements to be made that permit localization of the lateral inhomogeneities through measurements of global phase travel times. How these data are correlated with the periods of the free oscillations is a matter of some complexity. Attenuation is a complicating feature for the understanding of the multiplet structure of the Earth but only on a part of the seismographic record that is not observable with contemporary instruments.
Figure 7a
Period of mode 0 S23 at the South Pole as a function of azimuth for thirteen
earthquakes. Period is determined by comparing Rn with Rn+2 . Compare with
figure 2a. 7b Same as figure 7a for mode 0 S22 . Compare with figure 2b.
Acknowledgments
The data gathering aspects of this research were supported by grant DPP-83-14945 of the Division of Polar Programs of the National Science Foundation. The paper is publication number 3200 of the Institute of Geophysics and Planetary Physics, University of California, Los Angeles. L. Knopoffis in the Physics Department and Institute of Geophysics and Planetary Physics, University of California, Los Angeles. P. A. Rydelek is now at the Department of Terrestrial Magnetism, Carnegie Institution of Washington, Washington, D.C. W. Zurn is at the Geosciences Observatory of the Universities of Karlsruhe and Stuttgart, Schiltach, F. R. Germany.
References
Dahlen, F. A. (1981). The free oscillations of an anelastic, aspherical earth. Geophys. J. R. Astr. Soc., 66: 1–22.
Geller, R. J., and S. Stein (1978). Normal modes of a laterally heterogeneous body: A one-dimensional example. Bull. Seism. Soc. Am., 68: 103–116.
Masters, G., T. H. Jordan, P. G. Silver, and F. Gilbert (1982). Aspherical Earth structure from fundamental spheroidal mode data. Nature, 298: 609–613.
Nakanishi, K. K., L. Knopoff, and L. B. Slichter (1976). Observations of Rayleigh wave dispersion at very long periods. J. Geophys. Res., 81: 4417–4421.
Park, J. (1986). Synthetic seismograms from coupled free oscillations: Effects of lateral structure and rotation. J . Geophys. Res., 91: 6441–6464.
Silver, P. G., and T. H. Jordan (1981). Fundamental spheroidal mode observations of aspherical heterogeneity. Geophys. J. R. Astr. Soc., 64: 605–634.