Mendocino Seismic Zone
An expanded map of the Mendocino seismic zone is shown in figure 6, which also outlines the subregions for which cross sections are presented below. The Gorda/Juan de Fuca, Pacific, and North American plates meet at a common point, the Mendocino Triple Junction, where the Mendocino fracture zone meets the coastline. Global analysis of relative plate motions (Atwater, 1970) suggests that the relative motion between the Gorda/Juan de Fuca plate and the Pacific plate can be resolved into about 5.1 cm/year right-lateral displacement along the Mendocino fracture zone and about 2.7 cm/ year convergence across it (fig. 7). The same analysis suggests that the Gorda/Juan de Fuca plate is subducting obliquely (in about a N52°E direction) beneath the North American plate at about 2.5 cm/year if the motion between the Pacific and North American plates is 5.8 cm/year right-lateral strike-slip along the San Andreas. For somewhat smaller San Andreas slip rates, the direction of subduction is more easterly, but the rate of subduction is almost unchanged.
Just how the San Andreas ties into the triple junction is not clear. The trace of the San Andreas is very poorly defined between Cape Mendocino and Point Arena, a distance of about 150 km. Moreover, the region between the end of the Coast Ranges seismic zone and the Mendocino seismic zone appears to be almost aseismic. These problems, as well as the basic framework of plate motions (fig. 7), should be kept in mind as we examine the pattern of seismicity around Cape Mendocino in more detail.
The highest concentration of epicenters in the Mendocino seismic zone (fig. 6) is in a 50-km-long band extending about N75°W from the shoreline at Punta Gorda, just south Cape Mendocino, to about longitude 125°W. This zone lies beneath the north-facing Gorda escarpment at the eastern end of the Mendocino fracture zone (Bolt et al., 1968). A more diffuse zone of epicenters extends this band 80 km farther west to about 126°W longitude. The overall trend of this zone is 10º to 15° more northerly than the near-west trend of the Mendocino fracture zone west of 126°W longitude.
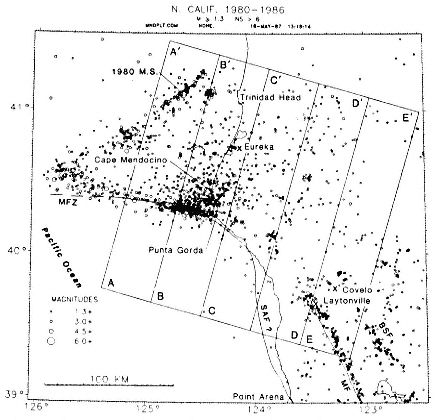
Figure 6
Map of the Mendocino seismic zone showing regions (A–Á through E–É) for
which cross sections were prepared. Abbreviations: SAF = San Andreas fault,
MF = Maacama fault, BSF = Bartlett Springs fault, MFZ = Mendocino fracture
zone, 1980 M. S. = epicenter of the November 8, 1980, Eureka earthquake.
The second prominent linear zone of epicenters was entirely defined by aftershocks within the first month after the November 8, 1980, Eureka earthquake. This zone extends from about 40.5°N, 126°W, where it joins the west end of the zone of epicenters described above, for a distance of about 140 km along a N53°E trend to a point about 30 km northwest of Trinidad Head. The trend of this zone agrees with the strike of the fault deduced from the fault-plane solution of the November 8 earthquake. It appears to mark the principal zone of faulting (left-lateral strike-slip) associated with that earthquake (Eaton, 1981).
A third group of earthquakes in the Mendocino region shows little tendency to concentrate in linear zones. Events of this group spread over a sub-
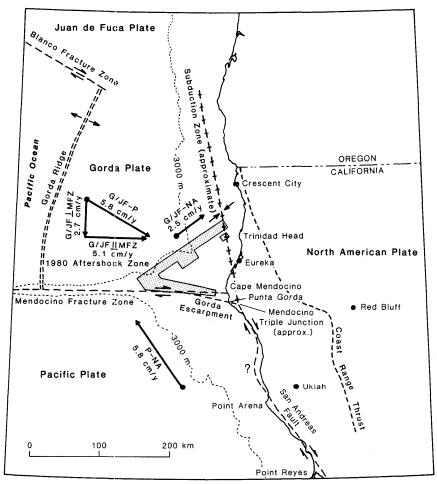
Figure 7
Plate tectonic setting of the Mendocino seismic zone. Relative plate motions
are from Atwater (1970). G/JF = Gorda/Juan de Fuca, P= Pacific, and
NA = North American plates. The G/JF-P motion is resolved into its components
parallel to (G/JF


fracture zone. The location (if not the definition) of the Mendocino triple
junction, the subduction zone north of Cape Mendocino, and the San Andreas
fault north of Point Arena are uncertain.
rectangular zone defined by the shoreward projection, parallel to a line trending S75°E, of the 1980 aftershock zone. These events are most concentrated near Cape Mendocino and die off gradually with increasing distance from that point. Their concentration also diminishes abruptly about 100 km inland from the coastline.
To explore the three-dimensional aspects of the distribution of Mendocino earthquakes we have plotted a sequence of five cross sections in which vertical projection planes are perpendicular to the N75°W trend of earthquakes associated with the Mendocino fracture zone and approximately parallel to the trend of the coastline between Cape Mendocino and Trinidad Head. The sections A–Á through E–É depict earthquakes in five contiguous 40 by 200-km rectangles that span the range from 60 km offshore to 140 km onshore. Vertical lines on the sections at 75 km show the position of the southern edge of the band of earthquakes west of Cape Mendocino or its landward projection. Just offshore, this line (fig. 6) coincides with the inferred fault that Jennings (1975) shows branching southeastward from the Mendocino fault zone. Horizontal lines at 20- and 30-km depths are shown to ease comparison of the sections. Sections west of A–Á were not included because focal depths are unreliable. All five sections are shown in figure 8, with A–Á (westernmost) at the top and E–É (easternmost) at the bottom. This sequence of sections should be viewed like sequential transverse sections of a biological specimen, which can be used to trace longitudinal variations in complex structures. The principal mapped features on figure 6 that we wish to trace and compare are: (1) events on the Mendocino fracture zone, (2) aftershocks of the 1980 Eureka earthquake, (3) events in the diffuse swarm centered on the triple junction and lying north of the fracture zone and its landward projection, and (4) events in the linear zones of epicenters in the northern Coast Ranges that terminate south of the Mendocino seismic zone.
Events along the Mendocino fracture zone are very prominent in sections A–Á and B–B́, where they are concentrated in a dense, vertically elongated zone of hypocenters at depths of 10 to 35 km that dips 70° to 75° toward the north (that is, to the right in fig. 8). Seismicity appears to terminate abruptly south of the fracture zone. The concentration of hypocenters at depths of 10 to 25 km and at distances of 80 to 85 km on section B–B́ corresponds to the cluster of events on figure 6 where the Mendocino fault zone (Jennings, 1975) approaches the shoreline at Cape Mendocino. On section C–Ć, 20 to 60 km inland from the shoreline, the trend of the fracture zone is represented
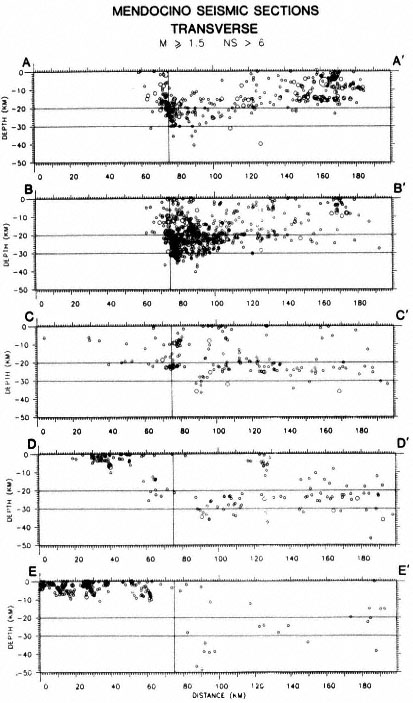
Figure 8
Transverse cross sections of the Mendocino seismic zone. Regions
corresponding to sections A–Á through E–É are outlined in figure 6. Only
earthquakes with magnitudes greater than or equal to 1.5 ( M ³ 1.5) and with
seven or more stations in the hypocentral solution ( NS > 6) were included.
only by modest clusters of events at 10- and 25-km depths, and farther east is unmarked by earthquakes.
The aftershocks of the 1980 Eureka earthquake are prominent on section A–Á at depths from the surface to about 20 km and at distances of 120 km to 180 km on the profile. The 1980 aftershock zone runs diagonally across region A–Á and passes out of it to the west at about 120 km on the profile. On section B–B́ the 1980 aftershocks are represented by the shallow cluster at 170 km. This cluster occurred about 20 km southeast of the eastern end of the principal 1980 fault break during the 1980 aftershock sequence (fig. 6).
The character of the scattered events north of the fracture zone and east of the 1980 aftershock zone appears simplest in sections C–Ć and D–D́, from 20 to 100 km east of the shoreline. On C–Ć these earthquakes appear to occur largely in a 100-km-thick zone between 20 and 30 km deep. This zone is horizontal between about 130 and 190 km on the profile. It appears to bow upward between 95 and 130 km and to bend downward sharply south of 95 km just before an abrupt cutoff at 85 km. In section D–D́ the zone is slightly thicker and more uniform in depth, although it does bend downward at its south end between 90 and 100 km on the profile. In section E–É events of this group are sparser than farther west and appear primarily in three patches: 80 to 100 km, 120 to 150 km, and 170 to 190 km. The patch on the south, at about 90 km, descends to a depth of about 50 km. A west-northwest to east-southeast profile through the zone of scattered earthquakes suggests that the zone dips very gently eastward for about 70 km from the coastline and then more steeply farther east. However, the number of events defining the steeply dipping part of the zone is very small (Cockerham, 1984).
The group of earthquakes discussed above is more difficult to isolate on sections A–Á and B–B́ because it merges with events along the fracture zone on the south and along the 1980 aftershocks zone on the north. On section A–Á these events appear in a horizontal band 10 to 20 km deep between 110 and 180 km on the profile. This band appears to thicken south of 110 km and to merge with events along the fracture zone at depths of 15 km to at least 30 km. On section B–B́ these events define a band 15–25 km deep between 110 and about 180 km. South of 110 km the zone thickens and appears to blend into the concentrated zone of hypocenters just north of the fracture zone. Heavier concentrations of events just north of the fracture zone suggest that the earthquakes may be related to disrupted seismogenic slab fragments. The scattered events on C–Ć at distances less than about 75 km mostly lie offshore, west of the inferred trace of the San Andreas fault. They suggest that earthquakes occur as deep as 20 km, but the network coverage is poor, and hypocentral locations are uncertain in this region.
The northern ends of the Maacama and Bartlett Springs faults appear as the shallow zones of earthquakes (0–10 km deep) between 20 and 50 km on section D–D́ and o and 65 km on section E–É. The sharp change in max-
imum depth of earthquakes marks the boundary between the Mendocino and Coast Ranges seismic zones.