Thirteen—
Dense Microearthquake Network Study of Northern California Earthquakes
J. P. Eaton
Introduction
Over the last twenty years, large-scale networks of telemetered short-period seismographs have emerged as an important new tool in seismology. Much of the development and testing of such networks has been carried out in central California by the U.S. Geological Survey (USGS). The goal of this work has been to improve the sensitivity and hypocentral resolution of such networks to permit the detailed mapping of seismogenic structures within the crust. Such mapping, in conjunction with traditional geologic mapping and analysis, should help to clarify the internal processes that shape the Earth's crust and produce earthquakes.
The dedicated work of the UC Berkeley seismographic station and its staff had laid the groundwork for much of the expanded effort described below. Particularly important was the work of Perry Byerly in establishing the northern California seismic network and training students to study the earthquakes it recorded. The catalog of northern California earthquakes based on that network remains one of the primary accomplishments of California seismology (Bolt and Miller, 1975). This catalog was the basis for an excellent analysis of the tectonics of central and northern California by Bolt et al. (1968).
This summary of the development and results of the telemetered USGS northern California network includes:
1. A recapitulation of the origin and growth of the network,
2. a description of the standard USGS seismograph system and the characteristics of earthquake records it produces,
3. a presentation of the principal network results in the form of regional seismicity maps and cross sections, and
4. a discussion of those results in terms of the underlying processes that generate the earthquakes.
The USGS Northern California Seismic Network
Origin and Development
The development of the USGS telemetered network was preceded by exploratory studies, employing dense networks of portable seismographs, of aftershocks of the Parkfield earthquake in 1966 and of earthquakes along the creeping section of the San Andreas fault in 1967. Experimental eight-station telemetered network clusters along the San Andreas near Palo Alto (1966) and San Juan Bautista (1967) were augmented by telemetered stations along the San Andreas, Hayward, and Calaveras faults to form an irregular fiftystation network by the end of 1969. Early results of these experiments (Eaton et al., 1970) showed that a dense network of simple seismographs permitted mapping of microearthquakes with sufficient precision to delineate the causative faults within the crust and to determine the style of faulting associated with them.
To provide such network coverage for the entire San Andreas fault system, which seemed essential for any serious attempt to predict earthquakes on the San Andreas, would require hundreds of stations. Considering likely constraints on funding and manpower, it was clear that stations of the network would have to be very simple and inexpensive to install, maintain, and operate. The commercial equipment employed in the experimental telemetered network appeared to be generally satisfactory, so the basic parameters it embodied were adopted for the larger network. Efforts to improve the system components in terms of power consumption, internal noise, and overall reliability have continued until the present.
A typical station consists of a 1-Hz moving-coil vertical component seismometer and a small, low-power amplifier/VCO package to prepare the seismometer signal for transmission to Menlo Park via telephone line or radio link. Both the seismometer and electronic package are sealed in short sections of plastic pipe and buried directly in the ground. Power is supplied by lithium batteries for telephone-line sites or by either air-cell batteries or solar-cell power supplies for radio sites. The constant-bandwidth frequency-division FM multiplex system used for data transmission accommodates up to eight seismic channels on one voice-grade telephone circuit, and signals from separate components or sites can be combined on a single transmission circuit by simple addition of their carriers in a summing amplifier.
Methods of recording and analyzing telemetered seismic data have evolved gradually to accommodate the growing network. Initially, incoming signals were discriminated and recorded on 16-mm film-strip recorders (Develocorders) for hand analysis. Later, backup for the network was provided
by recording the incoming multiplexed signals in direct record mode on 14-track magnetic tape. At present, primary recording and analysis of the discriminated and digitized signals are carried out by computer, although the entire network is recorded on magnetic tape, and selected stations are recorded on Develocorders for backup (Lee and Stewart, this volume, chap. 5).
The distribution of USGS stations telemetered to Menlo Park is shown in figure 1. Most stations contain only one high-gain vertical component seismograph (dots). Others contain one or more low-gain horizontal and/or vertical components as well (triangles). Stations of the UC Berkeley network in operation in 1965 before the USGS net was installed are indicated by stars.
Although the USGS network grew at an average rate of about fifteen stations per year after 1966, there were important spurts in growth in the years 1968–1970, 1975–1976, and 1979–1983. The last two spurts were in response to substantial increases in funding for the earthquake program in 1973 and 1976.
The early network was concentrated along the San Andreas fault between San Francisco and Parkfield. The present areal coverage was attained by 1980, and subsequent increases have mostly filled in and reinforced the sparser parts of the network. By the mid-1980s data from more than 400 seismographs at more than 350 USGS stations were being telemetered to Menlo Park for recording and analysis.
Frequency Response of the Seismic System and Character of its Records
The response of the standard USGS seismic system can be described as broadband intermediate frequency range. It is flat (to constant peak ground velocity) from about 1 to about 25 Hz. The lower frequency cutoff corresponds to the seismometer free period, and the upper frequency cutoff is accomplished electronically in the discriminators to suppress system noise, including cross modulation from adjacent telemetry channels. The most serious limitation of the system is its relatively low dynamic range, about 40 dB. Overall system performance also depends on the mode of recording: poorest for Helicorders and Develocorders, better for compensated tape playbacks, and best for on-line digitization at the discriminator outputs. Overall responses of the high- and low-gain USGS systems are compared with those of the big Benioff (JAS) and the standard Wood-Anderson in fig. 2.
Between frequencies of 0.2 and 30 Hz the shape of the USGS system response curve is approximately the inverse of the spectral amplitude of quietsite Earth noise (QSN, fig. 3a). This relationship insures that the amplitude of recorded Earth noise is relatively independent of frequency within that range (QSN, fig. 3b) and that the detection of signals that are only slightly larger than background noise is independent of frequency. Earthquake signals are also transformed spectrally in the recording process. Logarithmic
Figure 1
Northern California Seismic Net. Star = 1965 UC Berkeley station.
Triangle = Telemetered USGS station, vertical plus horizontal.
Dot = Telemetered USGS station, vertical only.
Figure 2
Magnification curves for the standard and low-gain USGS
seismic systems, the standard Wood-Anderson seismograph,
and the 100-kg Benioff seismograph.
spectral ground displacement curves for magnitude 2 and 4 earthquakes, according to the Brune source model with an average stress drop of 5 bars, are compared with that of quiet-site Earth noise and with the USGS system magnification curve in figure 3a. Such curves for magnitude 1 through magnitude 7 earthquakes, for a recording distance of 100 km, were combined with the magnification curve to produce the logarithmic spectral record amplitude curves in figure 3b. The peaks in these curves should correspond to the dominant frequencies in the records. For earthquakes between magnitude 1 and just over magnitude 4, these peaks also correspond to the respective corner frequencies in the ground displacement spectral amplitude curves. For quakes of magnitude 5 and larger, the record spectral peak and predominant frequency remain constant at 1 Hz and correspond to the natural frequency of the seismometers.
As a specific example, the predominant frequency in the record of a magnitude 3.0 earthquake should be about 4 Hz, and record amplitudes should decrease at a rate of about 6 dB/octave toward both higher and lower frequencies. Records obtained from tape playbacks of the low-gain vertical and north-south components of a magnitude 3.0 earthquake, recorded at station
Figure 3
a) Comparison of USGS system
response curve with quiet-site ground
noise displacement spectrum (QSN) and
Brune earthquake ground displacement
spectrum curves (at 5-bar stress drop)
for magnitudes 2 and 4 earthquakes.
b) Comparison of USGS system record
spectral amplitude curves for magnitude
1 through 7 earthquakes (at 100 km
distance and for a 5-bar stress drop)
and for quiet-site noise.
HQR from a source 3 km deep and 22 km away, are shown in figure 4. In accordance with the expectation discussed above, the peak record amplitudes of this magnitude 3.0 earthquake fall in the 2.5–5.0-Hz band, and amplitudes fall off gently within the range 1–20 Hz and more abruptly at higher and lower frequencies.
Northern California Seismicity:
1980–1986
The distribution of earthquakes in northern California for the seven years 1980–1986 is shown in figure 5. Only earthquakes of magnitude 1.3 and larger with data from seven or more stations in their hypocentral determinations are included. This time period was chosen because network coverage
Figure 4
Low-gain vertical (HQRZ) and north-south (HQRN) component records of a 3-km-deep
magnitude-3 earthquake 22 km from station HQR. Top traces are without filters. Second
through seventh traces were played back through 24 dB/ octave bandpass filters. Filter
corner frequencies and relative playback gains are indicated on the individual traces.
has not changed substantially since 1980. Even for these years, however, the catalog is believed to approach completeness at magnitude 1.3 only in the core of the network between Cholame and Laytonville. In the northern and northeastern parts of the net, the catalog is incomplete below magnitude 2.0.
Several broad zones of seismicity dominate the map. The most prominent coincides with the Coast Ranges between Cholame and Laytonville. Another prominent zone is associated with the Mendocino fracture zone and triple junction, within about 100 km of Cape Mendocino. A third, somewhat less well-defined zone runs along the east side of the Sierra Nevada from near
Figure 5
Northern California seismicity: 1980–1986. Symbol sizes are scaled according
to magnitudes. Only events with magnitudes greater than or equal to 1.3 and
with seven or more stations in the hypocentral solution were included in the
plot. Abbreviations: SAF = San Andreas fault, NFZ = Nacimiento fault zone,
OF = Ortigalita fault, CF = Calaveras fault, HF = Hayward fault, GF =
Greenville fault, GVF = Green Valley fault, BSF = Bartlett Springs fault,
HBF = Healdsburg fault, MF = Maacama fault, MFZ = Mendocino fracture
zone, COA/KET = Coalinga/ Kettleman aftershocks region.
Mount Shasta on the northwest to Mono Lake on the southeast. A fourth zone appears to run along the western foothills of the Sierra Nevada from Shasta reservoir to Oroville, with a branch that deflects southward to the center of the valley north of the Sutter Buttes. Other small concentrations of earthquakes are scattered beneath the western Sierra Nevada and beneath the Great Valley, but these do not form a continuous zone like those described above.
We shall explore the distribution of earthquakes around Cape Mendocino and in the Coast Ranges in more detail in search of an explanation for the contrasting styles of seismicity in these principal regions of northern California.
Mendocino Seismic Zone
An expanded map of the Mendocino seismic zone is shown in figure 6, which also outlines the subregions for which cross sections are presented below. The Gorda/Juan de Fuca, Pacific, and North American plates meet at a common point, the Mendocino Triple Junction, where the Mendocino fracture zone meets the coastline. Global analysis of relative plate motions (Atwater, 1970) suggests that the relative motion between the Gorda/Juan de Fuca plate and the Pacific plate can be resolved into about 5.1 cm/year right-lateral displacement along the Mendocino fracture zone and about 2.7 cm/ year convergence across it (fig. 7). The same analysis suggests that the Gorda/Juan de Fuca plate is subducting obliquely (in about a N52°E direction) beneath the North American plate at about 2.5 cm/year if the motion between the Pacific and North American plates is 5.8 cm/year right-lateral strike-slip along the San Andreas. For somewhat smaller San Andreas slip rates, the direction of subduction is more easterly, but the rate of subduction is almost unchanged.
Just how the San Andreas ties into the triple junction is not clear. The trace of the San Andreas is very poorly defined between Cape Mendocino and Point Arena, a distance of about 150 km. Moreover, the region between the end of the Coast Ranges seismic zone and the Mendocino seismic zone appears to be almost aseismic. These problems, as well as the basic framework of plate motions (fig. 7), should be kept in mind as we examine the pattern of seismicity around Cape Mendocino in more detail.
The highest concentration of epicenters in the Mendocino seismic zone (fig. 6) is in a 50-km-long band extending about N75°W from the shoreline at Punta Gorda, just south Cape Mendocino, to about longitude 125°W. This zone lies beneath the north-facing Gorda escarpment at the eastern end of the Mendocino fracture zone (Bolt et al., 1968). A more diffuse zone of epicenters extends this band 80 km farther west to about 126°W longitude. The overall trend of this zone is 10º to 15° more northerly than the near-west trend of the Mendocino fracture zone west of 126°W longitude.
Figure 6
Map of the Mendocino seismic zone showing regions (A–Á through E–É) for
which cross sections were prepared. Abbreviations: SAF = San Andreas fault,
MF = Maacama fault, BSF = Bartlett Springs fault, MFZ = Mendocino fracture
zone, 1980 M. S. = epicenter of the November 8, 1980, Eureka earthquake.
The second prominent linear zone of epicenters was entirely defined by aftershocks within the first month after the November 8, 1980, Eureka earthquake. This zone extends from about 40.5°N, 126°W, where it joins the west end of the zone of epicenters described above, for a distance of about 140 km along a N53°E trend to a point about 30 km northwest of Trinidad Head. The trend of this zone agrees with the strike of the fault deduced from the fault-plane solution of the November 8 earthquake. It appears to mark the principal zone of faulting (left-lateral strike-slip) associated with that earthquake (Eaton, 1981).
A third group of earthquakes in the Mendocino region shows little tendency to concentrate in linear zones. Events of this group spread over a sub-
Figure 7
Plate tectonic setting of the Mendocino seismic zone. Relative plate motions
are from Atwater (1970). G/JF = Gorda/Juan de Fuca, P= Pacific, and
NA = North American plates. The G/JF-P motion is resolved into its components
parallel to (G/JF


fracture zone. The location (if not the definition) of the Mendocino triple
junction, the subduction zone north of Cape Mendocino, and the San Andreas
fault north of Point Arena are uncertain.
rectangular zone defined by the shoreward projection, parallel to a line trending S75°E, of the 1980 aftershock zone. These events are most concentrated near Cape Mendocino and die off gradually with increasing distance from that point. Their concentration also diminishes abruptly about 100 km inland from the coastline.
To explore the three-dimensional aspects of the distribution of Mendocino earthquakes we have plotted a sequence of five cross sections in which vertical projection planes are perpendicular to the N75°W trend of earthquakes associated with the Mendocino fracture zone and approximately parallel to the trend of the coastline between Cape Mendocino and Trinidad Head. The sections A–Á through E–É depict earthquakes in five contiguous 40 by 200-km rectangles that span the range from 60 km offshore to 140 km onshore. Vertical lines on the sections at 75 km show the position of the southern edge of the band of earthquakes west of Cape Mendocino or its landward projection. Just offshore, this line (fig. 6) coincides with the inferred fault that Jennings (1975) shows branching southeastward from the Mendocino fault zone. Horizontal lines at 20- and 30-km depths are shown to ease comparison of the sections. Sections west of A–Á were not included because focal depths are unreliable. All five sections are shown in figure 8, with A–Á (westernmost) at the top and E–É (easternmost) at the bottom. This sequence of sections should be viewed like sequential transverse sections of a biological specimen, which can be used to trace longitudinal variations in complex structures. The principal mapped features on figure 6 that we wish to trace and compare are: (1) events on the Mendocino fracture zone, (2) aftershocks of the 1980 Eureka earthquake, (3) events in the diffuse swarm centered on the triple junction and lying north of the fracture zone and its landward projection, and (4) events in the linear zones of epicenters in the northern Coast Ranges that terminate south of the Mendocino seismic zone.
Events along the Mendocino fracture zone are very prominent in sections A–Á and B–B́, where they are concentrated in a dense, vertically elongated zone of hypocenters at depths of 10 to 35 km that dips 70° to 75° toward the north (that is, to the right in fig. 8). Seismicity appears to terminate abruptly south of the fracture zone. The concentration of hypocenters at depths of 10 to 25 km and at distances of 80 to 85 km on section B–B́ corresponds to the cluster of events on figure 6 where the Mendocino fault zone (Jennings, 1975) approaches the shoreline at Cape Mendocino. On section C–Ć, 20 to 60 km inland from the shoreline, the trend of the fracture zone is represented
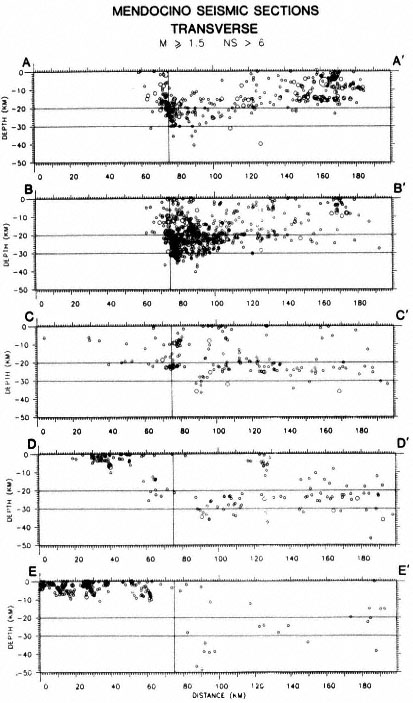
Figure 8
Transverse cross sections of the Mendocino seismic zone. Regions
corresponding to sections A–Á through E–É are outlined in figure 6. Only
earthquakes with magnitudes greater than or equal to 1.5 ( M ³ 1.5) and with
seven or more stations in the hypocentral solution ( NS > 6) were included.
only by modest clusters of events at 10- and 25-km depths, and farther east is unmarked by earthquakes.
The aftershocks of the 1980 Eureka earthquake are prominent on section A–Á at depths from the surface to about 20 km and at distances of 120 km to 180 km on the profile. The 1980 aftershock zone runs diagonally across region A–Á and passes out of it to the west at about 120 km on the profile. On section B–B́ the 1980 aftershocks are represented by the shallow cluster at 170 km. This cluster occurred about 20 km southeast of the eastern end of the principal 1980 fault break during the 1980 aftershock sequence (fig. 6).
The character of the scattered events north of the fracture zone and east of the 1980 aftershock zone appears simplest in sections C–Ć and D–D́, from 20 to 100 km east of the shoreline. On C–Ć these earthquakes appear to occur largely in a 100-km-thick zone between 20 and 30 km deep. This zone is horizontal between about 130 and 190 km on the profile. It appears to bow upward between 95 and 130 km and to bend downward sharply south of 95 km just before an abrupt cutoff at 85 km. In section D–D́ the zone is slightly thicker and more uniform in depth, although it does bend downward at its south end between 90 and 100 km on the profile. In section E–É events of this group are sparser than farther west and appear primarily in three patches: 80 to 100 km, 120 to 150 km, and 170 to 190 km. The patch on the south, at about 90 km, descends to a depth of about 50 km. A west-northwest to east-southeast profile through the zone of scattered earthquakes suggests that the zone dips very gently eastward for about 70 km from the coastline and then more steeply farther east. However, the number of events defining the steeply dipping part of the zone is very small (Cockerham, 1984).
The group of earthquakes discussed above is more difficult to isolate on sections A–Á and B–B́ because it merges with events along the fracture zone on the south and along the 1980 aftershocks zone on the north. On section A–Á these events appear in a horizontal band 10 to 20 km deep between 110 and 180 km on the profile. This band appears to thicken south of 110 km and to merge with events along the fracture zone at depths of 15 km to at least 30 km. On section B–B́ these events define a band 15–25 km deep between 110 and about 180 km. South of 110 km the zone thickens and appears to blend into the concentrated zone of hypocenters just north of the fracture zone. Heavier concentrations of events just north of the fracture zone suggest that the earthquakes may be related to disrupted seismogenic slab fragments. The scattered events on C–Ć at distances less than about 75 km mostly lie offshore, west of the inferred trace of the San Andreas fault. They suggest that earthquakes occur as deep as 20 km, but the network coverage is poor, and hypocentral locations are uncertain in this region.
The northern ends of the Maacama and Bartlett Springs faults appear as the shallow zones of earthquakes (0–10 km deep) between 20 and 50 km on section D–D́ and o and 65 km on section E–É. The sharp change in max-
imum depth of earthquakes marks the boundary between the Mendocino and Coast Ranges seismic zones.
Coast Ranges Seismic Zone
An expanded map of the Coast Ranges seismic zone, with outlines of regions for which cross sections were constructed, is shown in figure 9. The pattern of seismicity and its relationship to the San Andreas fault, as well as the position of the fault within the Coast Ranges, vary greatly from southeast to northwest. The most extensive feature of the seismicity is a nearly continuous band of earthquakes near the midline of the Coast Ranges, extending from Cholame on the southeast to Laytonville on the northwest. This line coincides with the creeping section of the San Andreas fault where it runs diagonally across the Coast Ranges between Cholame and Corralitos. Seismicity along the San Andreas is weak where it approaches the Coast northwest of the actively creeping section, between Corralitos and San Francisco along the southern end of the 1906 earthquake rupture zone. Northwest of San Francisco, where the 1906 offsets were largest, the San Andreas lies along the western edge of the Coast Ranges and is almost aseismic. Southeast of Cholame, in the region of the 1857 earthquake rupture zone, the San Andreas lies along the eastern edge of the Coast Ranges and, as northwest of San Francisco, is virtually aseismic.
In the region of complex faulting southeast of Hollister, adjacent to the section where creep dies out along the San Andreas, both the dense line of earthquakes and fault creep branch northward off the San Andreas fault onto the Calaveras fault farther east. The line of earthquakes follows the Calaveras, Hayward, Healdsburg, and Maacama faults, in order, past the east side of San Francisco Bay and on northwestward to Laytonville. A second, less continuous line of earthquakes branches eastward from the Calaveras fault south of Livermore. The second line can be followed northwestward from Livermore along the Greenville, Concord, Green Valley, and Bartlett Springs faults as far as Covelo. This line lies 30 to 40 km east of the principal Calaveras/Maacama line, and along its southern half it lies near the eastern edge of the Coast Ranges.
An apparent southeastward continuation of the line of earthquakes near the east edge of the Coast Ranges follows the Ortigalita fault from San Luis Reservoir to New Idria, east of the northern part of the creeping section of the San Andreas fault. An ill-defined linear zone of earthquakes west of the Coalinga/Kettleman aftershock zone suggests that the Ortigalita trend may extend even southeast of New Idria.
Additional, more prominent features of the southern part of the Coast Ranges seismic zone, however, are the broad bands of scattered earthquakes that lie along the flanks of the Coast Ranges, particularly on the eastern flank southeast of New Idria. There, the 20-km-wide by 50-km-long aftershock
Figure 9
Map of the Coast Ranges seismic zone showing regions (I–Í, A–Á, etc.)
for which cross sections were prepared. Abbreviations: SAF = San Andreas
fault, NFZ = Nacimiento fault zone, OF = Ortigalita fault, CF = Calaveras
fault, HF = Hayward fault, GF = Greenville fault, GVF = Green Valley fault,
BSF = Bartlett Springs fault, HBF = Healdsburg fault, MF = Maacama fault,
COA/ KET = Coalinga/Kettleman aftershock region.
Figure 10.
Longitudinal cross sections along the Maacama/Calaveras fault zone (I–Í)
and the San Andreas fault (II–IÍ). Only earthquakes with magnitudes
greater than, or equal to 1.5 (M ³ 1.5) and with seven or more stations
in the hypocentral solutions (NS > 6) were included. The dashed lines
mark the apparent lower limit of the zone of continuous seismicity along
the faults. The widths of the zones of earthquakes included on the plots
are 60 km for I–Í and 30 km for II–IÍ. Vertical exaggeration of these
sections is two times. Abbreviations: LV = Laytonville, CL = Clear Lake,
SB = Suisun Bay, LVM = Livermore, SF = San Francisco, COR =
Corralitos, BV = Bear Valley, PKF = Parkfield, CH = Cholame.
zone of the 1983 Coalinga and 1985 Kettleman Hills earthquakes, is the dominant feature on the map for 1980–1986. Both these large earthquakes, as well as almost all of their larger aftershocks, had thrust or reverse fault sources on planes with strikes nearly parallel to the San Andreas (Eaton, in press). The aftershock zone shows the extent of the zone of crustal shortening near Coalinga. Its large width contrasts sharply with the narrow lines of epicenters that mark creeping sections of the major near-vertical strike-slip faults and of the aftershocks of the large earthquakes that occur along them (Eaton et al., 1970; Cockerham and Eaton, 1987).
To examine the Coast Ranges seismicity in more detail, we have constructed cross sections for each of the boxes outlined on figure 9. Events within each box were projected onto a vertical plane parallel to the long axis of the box. Sections I–Í and II–IÍ (fig. 10) are longitudinal sections parallel to the dense lines of earthquakes in the northern Coast Ranges (Maacama, Bartlett Springs to Calaveras faults) and the southern Coast Ranges (San Andreas fault), respectively. The northern box (I–Í) is 60 km wide in order to include both the central and eastern lines of earthquakes, while the south-
ern box (II–IÍ) is only 30 km wide in order to separate activity on the San Andreas from that on its major branches north of Hollister.
The longitudinal profiles illustrate two principal aspects of seismicity along the faults: (1) the intensity of seismic activity along the fault and (2) the depth to the bottom of the continuous seismogenic zone along the fault. Two reference lines are drawn on the longitudinal sections. The first is a straight line at 15-km depth. The second (dashed) line marks the depth of the abrupt decrease in the abundance of earthquakes at the apparent base of the continuous seismogenic zone. Some of the scattered hypocenters below this line are reliably located and deserve special note. Others are possibly poorly located events that occurred at shallower depths.
Earthquakes on profile I–Í are moderate in number and rather evenly distributed along the fault from Laytonville to Suisun Bay (0 to 250 km) except for the dense shallow cluster of events in the Geysers/Clear Lake region (135 to 155 km). The depth to the bottom of the continuous seismogenic zone averages about 10 km over this region. It descends to about 12–13 km south of the Geysers/Clear Lake region and rises to only 5 km beneath, and just north of, that region. A small deeper cluster of well-located events, however, lies at 13–18 km beneath the shallow continuous seismogenic zone near Clear Lake. Near Suisun Bay the eastern line of seismicity lies at the eastern edge of the Coast Ranges, and earthquakes beneath Suisun Bay occur as deep as 15–25 km. Farther southeast along profile I–Í the bottom of the seismogenic zone ranges between 10 and 15 km and averages 12 to 13 km deep. The heavy concentration of events along this southern section of the profile reflects both an increased level of background seismicity and aftershocks of several large earthquakes.
The most prominent feature on section II–IÍ is concentration of earthquakes along the creeping section of the San Andreas fault, between Corralitos (120 km) and Parkfield (280 km). The base of the continuous seismogenic zone ranges from 10 to 15 km and averages 12 to 13 km deep along this section. Northwest of Corralitos, between 90 and 120 km on the profile, earthquakes shallower than 10 km are virtually absent, although weak seismicity between 10 and 15 km deep continues beneath the quiet zone. Farther northwest, patches of small, infrequent earthquakes occur between the surface and about 12 km deep in the distance ranges 55 to 90 km and 5 to 35 km. The northernmost of these earthquakes are on the San Andreas fault adjacent to San Francisco.
Seismicity along most of the southern half of the actively creeping section of the San Andreas, between about 210 and 256 km on the profile, is less intense than along the northern half (120 to 210 km) and at the extreme southern end just north of Parkfield. Most events in this section of less intense seismicity are between 2 and 12 km deep. The section of the fault that
broke in the 1966 Parkfield earthquake, between about 280 and 320 km on the profile, is less seismic than the section northwest of Parkfield, and earthquakes along this section die out southeastward. Southeast of Cholame (320 km) there is a 10-km gap in seismicity followed by weak seismicity between 330 and 360 km. This southeasternmost patch of earthquakes on the profile is mostly between 8 and 15 km deep.
The transverse sections A–Á to D–D́ in figure 11 were positioned to illustrate how the pattern of seismicity transverse to the Coast Ranges varies along their length. Each section is 200 km long and shows earthquakes from an 80-km wide box across the Coast Ranges projected onto a vertical plane that is perpendicular to the dense line of earthquakes traversing the box. On these sections, strike-slip faults perpendicular to the boxes appear as narrow, near-vertical linear concentrations of events. On all four sections the vertical line of events near 100 km on the profile represents the most prominent line of epicenters (fig. 9) near the midline of the Coast Ranges. It represents the San Andreas fault on D–D́, the Hayward fault on C–Ć, the Healdsburg fault on B–B́, and the Maacama fault on A–Á. The vertical lines of events at 130 to 140 km on profiles A–Á, B–B́, and C–Ć represent the line of epicenters, about 35 km east of the midline, along the eastern edge of the Coast Ranges. In section D–D́ the great mass of events between about 125 and 145 km represents the aftershocks of the 1983 Coalinga and 1985 Kettleman Hills earthquakes athwart the boundary between the Coast Ranges and the Great Valley.
South-to-north variations in seismicity of the San Andreas are demonstrated dramatically by the cross sections. Earthquakes along the southern 80 km of the creeping section of the San Andreas are densely clustered in a vertical line from the surface to a depth of about 13 km (D–D́). Earthquakes on the San Andreas near San Francisco are few in number and scattered over a somewhat broader zone than farther south (C–Ć). Section B–B́ north of San Francisco shows the San Andreas to be virtually aseismic. Section A–Á from Point Arena northward shows only minor seismicity along the San Andreas.
Most of the deeper earthquakes on the cross sections occur beneath the Great Valley or near the eastern boundary of the Coast Ranges. On section B–B́ the events 10 to 20 km deep near 190 km on the profile occurred about 10 km east of the Coast Ranges boundary, 20 km southwest of the Sutter Buttes. On section C–Ć the sparse, vertically elongated zone of earthquakes 15 to 25 km deep between 130 and 140 km on the profile is beneath Suisun Bay where the Valley indents the eastern edge of the Coast Ranges. On section D–D́ the earthquakes deeper than 15 km mostly lie beneath and east of the Coalinga/Kettleman aftershock zone. Although relatively few in number (about one percent as many as the Coalinga/Kettleman aftershocks), these
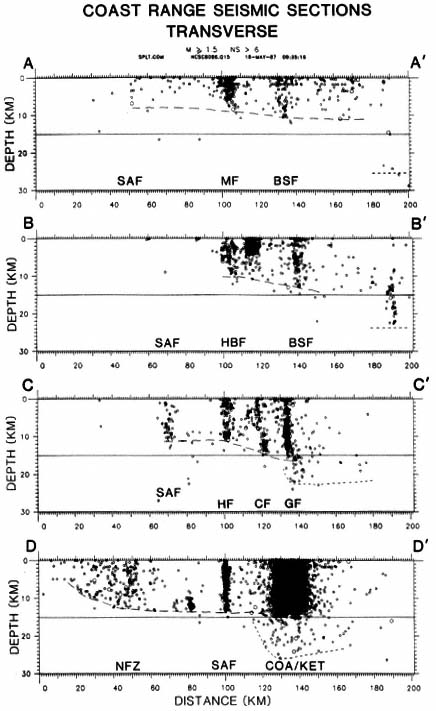
Figure 11
Tranverse cross sections of the Coast Ranges seismic zone. The regions
projected onto profiles A–Á through D–D́ are outlined in figure 9. Each
profile is centered on, and perpendicular to, the continuous line of
earthquakes near the Coast Ranges midline. Dashed lines indicate the
approximate bottom of the seismogenic zone beneath the Coast Ranges.
The events deeper than 15 km on the right end of the profiles are beneath
the eastern edge of the Coast Ranges or the adjacent Great Valley. The
dotted line indicates the approximate bottom of the seismogenic zone
beneath the Coast Ranges/Great Valley boundary region. Two times
vertical exaggeration. Abbreviations as for figure 9.
events cannot be ascribed to poor locations, and they reveal a broad zone of mild seismicity in the lower crust beneath the eastern edge of the Coast Ranges and adjacent Great Valley.
On sections A–Á to C–Ć the San Andreas fault lies near the coastline and the continental margin. On D–D́ it is about 70 km inland, and seismicity in the Coast Ranges west of the fault is remarkably different from that west of the fault, offshore on the northern cross sections. A landward-thickening zone of diffuse seismicity extends inland from the west end of the profile to near 60 km on the profile. The zone of modest concentration of events near 50 km corresponds approximately to the Nacimiento fault. Except for a concentrated cluster of events 10 to 13 km deep near 80 km on the profile (San Ardo), there is little seismicity between about 65 and about 100 km (San Andreas fault). The lower limit of the seismic zone is very sharp from about 10 km, where it is about 5 km deep, to the San Andreas, where it is about 13 km deep. Crustal seismicity is weak for about 15 km northeast of the San Andreas. Farther east, but still west of the Coalinga/Kettleman aftershocks, the density of earthquakes in the upper crust increases moderately, and earthquakes appear in the lower crust. Focal mechanisms of large earthquakes in the bands of seismicity along the coast, as well as in the Coalinga/ Kettleman region, show that both flanks of the Coast Ranges in box D–D́ are under compression normal to the San Andreas fault, and that the predominant mode of failure is along thrust and reverse faults on planes with strikes parallel to the San Andreas (Eaton, 1985; Eaton and Rymer, in press).
Tectonic Implications
Global plate tectonics provides an overview of the relative motion of the North American, Pacific, and Gorda/Juan de Fucca plates along their common boundaries in northern California: the San Andreas fault, the Mendocino fracture zone, and the coastal subduction zone north of Cape Mendocino. Plate tectonics studies, however, tell us little about the structure of the boundaries. Detailed local observations are needed to define particular
boundaries more precisely and to study the processes in the crust and upper mantle through which they operate.
Contemporary seismicity provides a snapshot of the number, location, size, and style of faulting associated with the plate boundaries and the triple junction. The record of seismicity based on instrumental studies is incomplete because of its short duration, but it can be supplemented by the longer-term historical seismic record. Earthquakes are important symptoms of deformation of the Earth's crust and mantle, but tell only part of the story. Much deformation occurs silently, particularly in the mantle and lower crust. This limitation must be kept in mind when we use seismicity to infer processes in the crust. Nonetheless, the northern California seismicity data do document the generation of earthquakes by plate boundary processes over a very large region with remarkable uniformity and sensitivity. The mechanical implications of the seismicity data, as well as their sensitivity and areal extent, invite their use to compare and contrast crustal processes in the two major seismic regions of northern California, the Mendocino and Coast Ranges seismic zones.
Mendocino
The pattern of earthquakes in the Mendocino seismic zone suggests that the southeastern corner of the relatively young and weak Gorda plate is being crushed against the northeastern corner of the older, stronger Pacific plate in consequence of the convergent component of relative motion in the region. The larger right-lateral strike-slip component of relative motion should carry the disrupted remnants of the south edge of the Gorda plate eastward beyond the east edge of the Pacific plate, where these remnants appear to be obducted onto (or against) the western edge of the North American plate. Subsequent northwestward motion of the Pacific plate relative to the North American plate should entrain the Gorda-plate debris in the boundary zone between those plates in the northern Coast Ranges.
The continuity of the grossly furrowed topography onshore between Cape Mendocino and Trinidad Head with that east of the Maacama fault farther south suggests that these regions share important features of origin and internal structure. The Franciscan Complex, which largely coincides with that topography, contains much material that appears to have been crushed and mixed by a process like that now affecting the southeastern corner of the Gorda plate (Fox, 1983a ).
The present geometry of the Gorda ridge relative to the Blanco fracture zone on the north and the Mendocino fracture zone on the south suggests that the southern quarter of the ridge, where it curves to remain perpendicular to the Mendocino fracture zone, is becoming inactive and is requiring an adjustment in the location of the Mendocino fracture zone between the Gorda ridge and the Mendocino triple junction. Such a readjustment is also
suggested by the trend of the band of earthquakes along the fracture zone just west of Cape Mendocino. The torque required to rotate the Gorda/Juan de Fuca plate in a clockwise direction and to maintain the plate-crushing contact between the Gorda and Pacific plates just west of Cape Mendocino, may be produced by the southeastward drag along the eastern edge of the Gorda plate caused by its oblique subduction beneath the North American plate. Left-lateral faulting on northeast striking faults across the southeastern corner of the Gorda plate (Silver, 1971 ), such as occurred during the November 8, 1980, earthquake, is a consequence of the strong normal forces developed across the eastern end of the Mendocino fracture zone by the process outlined above.
Coast Ranges
The driving force behind earthquakes in the Coast Ranges seismic zone is the transform (boundary) between the North American and Pacific plates. Details of the gross physical properties of this boundary and how it works are lacking. Some outstanding questions are: (1) How wide is the transform in the upper mantle, and where is it located relative to the San Andreas fault and the midline of the Coast Ranges? (2) Is displacement across the transform in the mantle abrupt and discontinuous, as at a fault, or distributed in some manner across a broad zone? (3) Is the upper crust decoupled from the lower crust and upper mantle over the transform? (4) Do rigid sections of the upper crust resist internal deformation and "integrate" distributed displacement across their bases and concentrate it in faults along their edges?
The principal observations from contemporary seismicity and the historical seismic record can be summarized by the following statements: (1) The maps and cross sections presented above show that the Coast Ranges seismic zone is complex and that its most prominent features vary from northwest to southeast within it. (2) Most of the displacement between the Pacific and North American plates at the Earth's surface occurs on the San Andreas fault. (3) Where the San Andreas crosses the center of the Coast Ranges, between Cholame and Corralitos, most of the displacement occurs as creep accompanied by countless small earthquakes; where it lies along the edges of the Coast Ranges most of the offset occurs during infrequent, very large earthquakes. (4) Long-term offset rates (over hundreds of years) across the Calaveras/Maacama and Greenville/Bartlett Springs fault zones, which are marked by linear concentrations of small earthquakes like that along the rapidly creeping section of the San Andreas, are small compared to that on the San Andreas (now locked) farther west. (5) The trace of the San Andreas fault between Point Arena and Cape Mendocino lies offshore and is difficult to identify. It is believed to deflect about 40 km to the east and generally to follow the coast north of Point Arena. Macroseismic effects of the 1906 earthquake indicate that this northernmost section of the fault broke in 1906. The
long-term offset rate on this section should be the same as that south of Point Arena, but the total offset across it should decrease to zero as it approaches the triple junction, which is its point of origin. (6) The depth to the base of the seismogenic zone along the principal strike-slip faults in the Coast Ranges averages about 10 km north and 12 to 13 km south of Clear Lake. The depth to the base of the seismogenic zone appears to increase gradually from west to east across the Coast Ranges. This effect is most pronounced along the eastern margin of the Coast Ranges and the adjacent Great Valley, where focal depths are as great as 15 to 25 km. Earthquakes deeper than 15 km (in the lower crust) are extremely rare elsewhere in the Coast Ranges but common beneath the Great Valley. (7) Both flanks of the Coast Ranges southeast of Hollister are marked by scattered patches and broad zones of earthquakes whose sources indicate crustal compression normal to the San Andreas fault. These earthquakes may be caused by lateral spreading of the southern Coast Ranges resulting from misalignment between the San Andreas fault in the upper crust and a more northerly trending transform in the mantle below. Such a misalignment is suggested by recent studies of global plate-motion directions (Minster and Jordan, 1984).
From the distribution of current seismicity and the position of the San Andreas fault, it appears that the entire Coast Ranges is underlain by a broad zone of right-lateral shear deformation. The restriction of earthquakes to the upper crust beneath the Coast Ranges, but not beneath the contiguous portions of the Great Valley on the east or the Mendocino seismic zone on the north, suggests that the lower crust deforms plastically beneath at least the central part of the Coast Ranges. The branching and spacing of major strike-slip faults in the upper crust north of Hollister suggest some sort of decoupling between the brittle upper crust and the plastic lower crust. The parallel, subequally spaced traces of the three major branches northwest of Livermore suggest that sections of the brittle upper crust resist internal deformation and concentrate distributed displacements beneath them onto their fault boundaries.
Decoupling of the upper and lower crust in the southern Coast Ranges can also account for the relatively aseismic zones lying between the actively creeping San Andreas fault and the zones of compression and reverse-fault earthquakes along both the east and west flanks of the Ranges. Horizontal decoupling horizons 12 to 15 km deep beneath the center of the Ranges curve upward through the brittle upper crust where it is driven beyond the margins of the plastic zone (over the transform) in the lower crust (Eaton and Rymer, in press).
Evidence for tracing the San Andreas between Point Arena and the triple junction is very weak. The principal zone of displacement between the Pacific and North American plates most likely lies near the coastline just southeast of the triple junction: the intense zone of seismicity between the
Gorda and Pacific plates terminates abruptly where the Mendocino fracture zone intersects the coastline. Farther south, the trace of the San Andreas is well defined where it strikes northwestward out to sea just north of Point Arena. Here, its trace is subparallel to, but offset about 40 km to the southwest of, the coastline southeast of Cape Mendocino. The most prominent feature of the rather weak seismicity linking these two sections of the fault is the diffuse north-south trending band of small earthquakes between Point Arena and the northern end of the line of earthquakes along the Maacama fault (fig. 5). The offset of the San Andreas may be associated with this band of earthquakes.
The sliver of crust between the Calaveras/Hayward/Maacama and San Andreas faults is an enigma. Its eastern boundary is marked by the line of frequent small earthquakes along the Coast Ranges midline, and its western boundary is the virtually aseismic section of the San Andreas that produced the 1906 earthquakes. South of Clear Lake it is nearly aseismic, but north of Clear Lake it contains diffuse clusters of small earthquakes. Topographically, this region is much simpler and more homogeneous than the region just east of the Calaveras/Maacama fault zone, which is characterized by bold northwest trending ridges of such relief and length as to suggest a tectonic origin (Fox, 1983b ). These relationships suggest a marked difference in the response of the upper crust west and east of the Calaveras/Maacama fault zone to the right-lateral strain across the Coast Ranges. West of that zone, the upper crust stores accumulating strain, without internal disruption, for eventual release along the San Andreas in a major earthquake. Along and east of that zone, it appears to yield gradually by internal deformation and slip along boundaries within it in a manner that may limit the size of earthquakes it can produce and enhance the grossly ridged topography that characterizes it.
References
Atwater, Tanya (1970). Implications of plate tectonics for the Cenozoic tectonic evolution of western North America. Geol. Soc. Am. Bull., 81: 3513–3536.
Bolt, B. A., C. Lomnitz, and T. V. McEvilly (1968). Seismological evidence on the tectonics of central and northern California and the Mendocino Escarpment. Bull. Seism. Soc. Am., 58: 1725–1767.
Bolt, B. A., and Roy D. Miller (1975). Catalog of Earthquakes in Northern California and Adjoining Areas: 1 January 1910–31 December 1972. Seismographic Stations, University of California, Berkeley, 1–567.
Cockerham, R. S. (1984). Evidence for a 180-km-long subducted slab beneath northern California. Bull. Seism. Soc. Am., 74: 569–576.
Cockerham. R. S., and J. P. Eaton (1987). The earthquake and its aftershocks, April 24 through September 30, 1984. In Seena N. Hoose, ed., The Morgan Hill, California, earthquake of April 24, 1984. U.S. Geol. Surv. Bull. 1639, 15–28.
Eaton, J. P. (1981). Detailed study of the November 8, 1980 Eureka, California,
earthquake and its aftershocks (abs.). EOS, 62: 959.
——— (1985). The May 2, 1983 Coalinga earthquake and its aftershocks: A detailed study of the hypocentral distribution and of the focal mechanisms of the larger aftershocks. In M. J. Rymer and W. L. Ellsworth, eds., Mechanics of the May 2, 1983 Coalinga Earthquake. U.S. Geol. Surv. Open-file Report 85–44, 132–201. Menlo Park, California. Regional seismic background of the May 2, 1983 Coalinga earthquake. Op. cit., 44–60.
Eaton, J. P., W. H. K. Lee, and L. C. Pakiser (1970). Use of microearthquakes in the study of the mechanics of earthquake generation along the San Andreas fault in central California. Tectonophysics, 9: 259–282.
Eaton, J. P., and M. J. Rymer (in press). Regional seismotectonic model for the southern Coast Ranges. In M. J. Rymer and W. L. Ellsworth, eds., Mechanics of the May 2, 1983, Coalinga earthquake. U.S. Geol. Surv. Professional Paper 1487.
Fox, K. F., Jr. (1983a ). Melanges and their bearing on late Mesozoic and Tertiary subduction and interplate translation of the west edge of the North American plate. U.S. Geol. Surv. Professional Paper 1198, 1–40.
——— (1983b ). Tectonic setting of late Miocene, Pliocene, and Pleistocene rocks in part of the Coast Ranges north of San Francisco, California. U.S. Geol. Surv. Professional Paper 1239, 1–33.
Jennings, C. W., compiler (1975). California Data Map No. 1: Faults, Volcanoes, and Thermal Springs and Wells. California Divisior of Mines and Geology.
Minster, J. B., and T. H. Jordan (1984). Vector constraints on Quaternary deformation of the western United States east and west of the San Andreas fault. Pacific Section Soc. Econ. Paleontology and Mineralogy, 38: 1–16.
Silver, E. A. (1971). Tectonics of the Mendocino triple junction. Geol. Soc. Am. Bull. 82: 2965–2978.