Mapping Alteration Mineralogy
The Geological Survey of Japan considers mapping hydrothermal alteration zones an extremely important element in geothermal exploration. Although springs and fumaroles are the most obvious surface manifestations of the hydrothermal system,
| |||||||||||||||||||||||||||||||||||||||||||||
alteration zones supply additional information that points out the areas of greatest temperature and permeability. Alteration zones can also guide exploration geologists to hidden systems or to ancient spring activity. The mapping process involves systematic sampling across the study area and analysis of mineral phases by x-ray diffraction and petrography. Study areas can range from a general map of altered areas over hundreds of square kilometers—which will often show the relationship of hydrothermal systems to large features such as calderas—to small areas of less than 1 km—where detailed variations in alteration can be documented.
An example of this type of exploration technique is the eastern Hachimantai Geothermal Area, Honshu, where there are many geothermal areas scattered throughout an 800-km2 volcanic field (Geological Survey of Japan, 1986; Nakamura et al ., 1981). Within the field, Nakamura et al ., have established three alteration subzones.
· Silicic subzones are characterized by porous, white or brown siliceous rocks that contain small amounts of alunite and sulphur. These subzones are usually found in the center of the system and can be evidence of strong hydrothermal activity in the past.
· Silicification subzones consist of hard, white, silicified rocks within a band around the silicic zone. This subzone can occur as blocks 0.5 by 0.7 km or as 10- to 50-m-wide veins. The minerals include saponite, chlorite, hydromica, mixed-layer clays, sericite-montmorillonite, alunite, anhydrite, gypsum, calcite, rutile, diaspore, and andalusite.
| ||||||||||||||||||||||||||||||||||||||||||||||||||||||||||||||||||||||||||||||||
· Argillization subzones are the outer-most zones of alteration; they consist of blue-black clays (the color is mostly related to finely disseminated pyrite). The dominant minerals are montmorillonite, kaolin, and alunite, in order of distance from the outer edge of the zone.
In addition to these alteration zones, a pyrophyllite zone, which may overlap the argillized rocks, has formed at higher temperatures and may be an indicator of higher permeabilities. Pyrophyllite is most likely formed within the system if temperatures are >300°C and if the geothermal fluids are acidic at depths of ~1 km.
Figures 3.12a and 3.12b show the distribution of alteration zones, which are identified by the dominant mineral phase, as well as the distribution of fluorine concentrations (another exploration tool). The schematic cross-section of B—B' in Fig. 3.12c was based on wells that were drilled into the vapor-dominated part of the Matsukawa geothermal field; this illustration shows a relationship between the reservoir and surface pyrophyllitic to kaolinitic alteration zones. Wells for the Kakkonda (Takinoue) geothermal field penetrated a water-dominated reservoir in a zone where rocks are mostly altered to montmorillonite (on a regional scale) but are locally altered to kaolinite, alunite, or pyrophyllite.
The examples from Nakamura et al . (1981), cited earlier, are sited in intermediate to silicic calc-alkaline rocks. However, different
Fig. 3.11
Diagram showing the alteration minerals in vein assemblages and the sequence of wall-rock
alteration for acid-sulfate and adularia-sericite-type deposits that occur in fossil hydrothermal
systems. No scale is given because the widths of alteration zones range from
centimeters to tens of meters outward from the vein.
(Adapted from Heald et al ., 1987.)
mineral zonation occurs in basaltic rocks. For instance, Tómasson and Kristmannsdóttir (1972) described three vertical zones in the Reykjanes geothermal area of Iceland, which are listed here in order of increasing temperature:
(1) a montmorillonite-zeolite-calcite zone,
(2) a mixed-layer clays-prehnite zone, and
(3) a chlorite-epidote zone.
The zones are not always clearly defined as a result of cooling and reheating after the invasion of sea water. Subsurface temperatures at a depth of 1 km exceed 200°C.
The date and length of hydrothermal activity in a geothermal system can be determined through potassium-argon dates for clays (Woldegabriel and Goff, 1989). These data can provide interesting and sometimes crucial information on the longevity (and perhaps future) of hydrothermal activity in an area to be drilled and developed. Woldegabriel and Goff (1989) have shown that hydrothermal systems within the Valles caldera of New Mexico became active soon after caldera collapse at 1 Ma and have been active from that time to the present.
The most desirable targets—permeable zones with hot water and steam—are narrow ones and, in some cases, may make up as little as 5% of the entire geothermal system. The size of this target can vary substantially. Figure 3.13 compares 16 epithermal ore bodies (fossil hydrothermal systems; Heald et al ., 1987) and 25 geothermal fields (Rowley, 1982). The areas of geothermal fields, from 0.15 to >100 km2 , are very similar to the areas of epithermal deposits, which range from 1 to >120 km2 . The projected surface areas of production zones within the 16 geothermal fields range from <0.5 to 60 km2 , which is 5 to 15% of the total area defined by hydrothermal activity, rock alteration, and elevated geothermal gradients. These areas
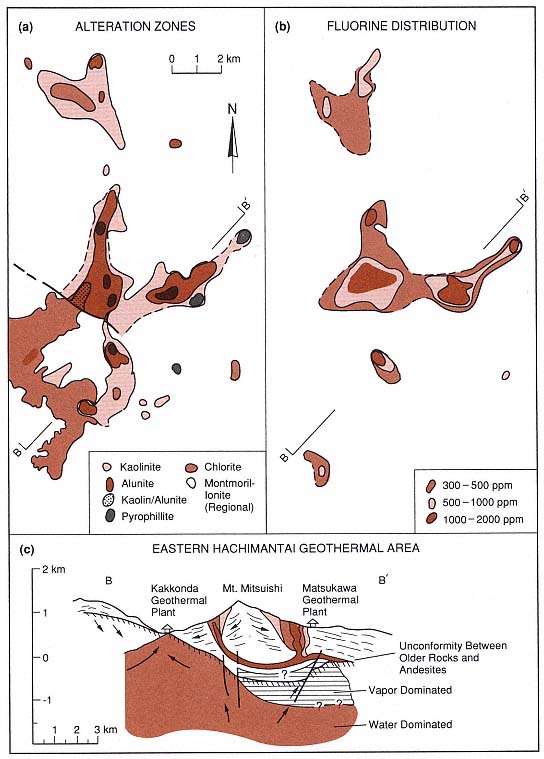
Fig. 3.12
Maps of alteration zones from the eastern Hachimantai geothermal area in Japan. (a) Map of
alteration zones indicates the predominant marker minerals. (b) Distribution of fluorine in
hydrothermally altered rocks. (c) Schematic cross-section of
the eastern Hachimantai geothermal area.
(Adapted from Geological Survey of Japan, 1986.)
Fig. 3.13
Dimensions and volumes of hydrothermal systems
are used to compare ore zones (fossil hydrothermal
systems) and developed hydrothermal reservoirs.
These graphs provide a general idea of the range
of areas and volumes for hydrothermal reservoirs.
(a) Length and width of ore zones. (b) Surface areas
of ore zones and volumes of fossil hydrothermal
systems. (c) Estimated areas of geothermal fields
and actual areas with production wells.
(Adapted from Heald et al ., 1987,
and Rowley, 1982.)
of production are the permeable pathways for hot fluids at the time of drilling. By analogy, epithermal ore deposits encompass the entire area affected by alteration throughout the history of the hydrothermal system; large ore-bearing veins were the main conduits for geothermal fluids and gases. By studying the analogy between active hydrothermal systems and epithermal ore bodies, it is possible to create three-dimensional models of volcanic geothermal systems. The depth of hydrothermal reservoirs ranges from <1 km to perhaps as much as 4 or 5 km. The depths of some of these reservoirs have not been determined. Mining epithermal ore deposits has provided us with the vertical extent and time-cumulative volume of many such ore deposits; they are from 400 to 1,000 m vertically and have volumes of 1 to 132 km3 (Heald et al ., 1987). The largest geothermal systems and epithermal ore bodies are associated with the Earth's largest volcanoes—calderas—which are discussed in the next chapter.