Chapter XVII—
Salamanca Province:
Hardening the Patterns
The patterns discovered in Jaén most likely existed elsewhere in the Guadalquivir valley, but they were not representative of Castile as a whole. This truth is proclaimed when one turns to Salamanca province, for almost none of the characteristics of Jaén are found here. Most of the people who lived in the countryside of the portion of the province covered by this study inhabited small towns and villages that were set relatively close together and enjoyed more egalitarian societies than the large agrarian towns of Jaén.
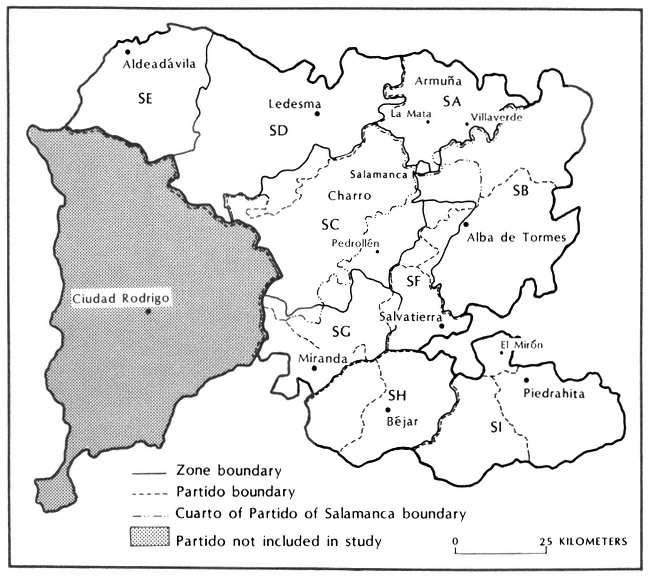
Geographically and socioeconomically there is much greater contrast among the regions of Salamanca than of Jaén. The portion of the Old Castilian plain that surrounds the city of Salamanca is another world from the hill towns and upland valleys of the southern sierras. The sharp contrasts facilitate comparison, with the result that I have divided the province into only nine zones, while Jaén has seventeen (Map 17.1).
Four zones make up the plain. Its communities are larger and more prosperous to the north and east, where the earth is rich and deep, than to the south and west, a land of thin, sandy soil, better suited to pastures than to fields of grain. In our time, interspersed among the villages like La Mata and Villaverde were many despoblados like Narros and Pedrollén. Armuña zone (SA) north of Salamanca city and Alba de Tormes zone (SB) in the northeastern corner of the province can be classed as rich plains zones. The other two zones, south and west of the city, will be identified as poor plains zones. Charro zone (SC), which includes Pedrollén, lies on either side of the road to Ciudad Rodrigo and Por-
Map 17.1.
Zones of Salamanca Province
tugal, and Ledesma zone (SD) to the north of it borders on the province of Zamora.
There are three sierra zones. On the east (and now in Ávila province) is Piedrahita zone (SI), occupying the valleys north of the Sierra de Gredos. El Mirón is on its northern edge. Just west of it, Béjar zone (SH) is dominated by the sierra of that name and lies astride the main pass between Old Castile and Extremadura. The large town of Béjar was already an important woolen center in the eighteenth century. Finally the zone of Miranda (SG) lies beneath the Sierra de la Peña de Francia. The towns through here are large by comparison with those of the plain. Steep, narrow, cobbled streets lined with two- and three-story granite houses, many still boasting coats of arms from past ages, provide human features that combine with the majesty of the sierras to make this one of the most picturesque corners of Spain.
The two remaining divisions do not fit either of these types. Aldeadávila zone (SE) is the northwestern corner of the province, bordering on
Portugal, where the Salamanca plain gives way to rolling hills and glaciated outcroppings that furnish the material for abundant stone walls. Reminiscent of the sierras, its towns spread out around granite churches with imposing square towers. Salvatierra zone (SF) lies in the center of the province, a relatively poor upland region that juts out into the plain from the ranges to the south. Its thin soil barely covers a shale base, and the small villages, abundant in slate, resemble those of the Charro plain to the west. Although these two zones are very different from each other, they have the common label of hilly zones. Appendix Q gives a detailed description of the geography, population, and political status of the zones.
How unlike Jaén Salamanca province is, one can judge from a simple comparison. In Jaén the mean amount spent by the buyers in each zone was directly proportional to the mean size of the towns in the zone: the bigger the towns, the more each buyer spent. In Salamanca precisely the opposite correlation appears. If one compares Table 17.1 with Table 17.2, which gives the mean town size, one sees that the larger the size of the towns, the smaller amount each buyer was likely to spend (r = –.58). The correspondence again is loose, only about one-third of the variation in the amount spent can be attributed to the size of the towns,
| ||||||||||||||||||||||||||||||||||||||||||||||||||||||||||||||||||||||||||||||||||||||||||
| ||||||||||||||||||||||||||||||||||||||||||||||||||||||||||||||||
and the correlation is significant only at the 10-percent level. As the present chapter proceeds, however, it will become apparent that the relationship is not fortuitous. The challenge is to produce a different concept of both structure and change to apply to this province.
The analysis of Jaén province was based on a distinction among the zones according to the extent of the orientation toward the outside market of the lands purchased by the different levels of buyers. At first sight the information provided by the sales in Salamanca province does not allow one to draw a similar distinction here.[1] Table 17.3 gives the basic information on the purchases made by Level 1 and Level 4 buyers. We can assume that the purchasers of rural estates were investing in com-
[1] Many sales in Salamanca province could not be used for analysis of the individual zones. Salamanca city, unlike Jaén, has a small término, so that the 233 sales within its limits were very largely urban properties. I have not included the city in any zone. In addition, the records of many sales of rural properties owned by religious institutions of the city did not state where the properties were located. The vast majority would have been in nearby towns in the partido of Salamanca city, like La Mata, Villaverde, and Pedrollén. But the partido of Salamanca is divided among three zones, SA, SB, and SC, and there being no way to determine in which zone each unlocated sale belonged, they had to be excluded. These are 657 sales (out of a total of 3,314 for the province). Finally, a few towns named in the Salamanca deeds could not be found, and some towns in different zones had the same name, so that 68 sales could not be assigned to any zone. The final number of sales that could be allocated is 2,356: SA, 368; SB, 554; SC, 97; SD, 207; SE, 200; SF, 102; SG, 185; SH, 242; SI, 401.
| |||||||||||||||||||||||||||||||||||||||||||||||||||||||||||||||||||||||||||||||||||||||||||||||||||||||||||||||||||||||||||||||||||||||||||||||||||||||||||||||||||||||||||||||||||||||||||||||||||||||||||||||||||||||||||||||||||||||||||||||||||||||||||||||||||||||||||||||||||||||||||||||||||||||||||||||||||||||||||||||||||||||||||||||||||||||||||||||||||||||||||||||||||||||||||||||||||||||||||||||||||||||||||||||||||||||||||||||||||||||||||||||||||||||||||||||||||||||||||||||||||||||||||||||||||||||||||||||||
mercial property, but only in the plains zones did estates form a sizable part of the disentail. These were alquerías and despoblados similar to Pedrollén or to Narros before it was colonized from La Mata in the 1780s, large properties dedicated to both arable and grazing usually leased for payment in money and kind to the farmers who exploited them.[2] Level 4 purchasers here, who bought most of the estates, were into the outside market. So, of course, were the buyers of large collections of arable plots that would be rented to small farmers for specified payments in wheat and other products. The large outside buyers of the arable plots whom we observed in La Mata and Villaverde were among these people. The plots they purchased, however, were identical to those bought by local farmers found in Level 1, who would be more oriented to domestic consumption than the market so that purchases of arable land in Salamanca are not useful as an indication of the extent of the buyers' involvement in the market.
In contrast, big buyers in the mountain zone of Béjar (SH) devoted the largest share of their purchases to pastures. Here Level 4 buyers were very different from their counterparts in the plains: they spent on the average thirty-three thousand reales; those of the plains four to ten times as much. Béjar zone had many sheep, twenty-two per vecino engaged in agriculture, but five others had more sheep per vecino (Table 17.4). The zone had few cows, yet the disentail indicates that more of its land was devoted to pastures than anywhere else. To what purpose? One may guess that they were leased to the owners of transhumant sheep. The main north-south sheepwalk (cañada) of the Mesta crossed the central sierras by the pass of Béjar, and the largest and best share of the wool shorn in Salamanca province still came from transhumant sheep.[3] One may logically conclude that many of the pastures acquired by the top buyers of Béjar zone were rental properties to be leased to sheep owners, most of whom resided in other parts of Castile. These were capitalist investments. The buyers were indirectly involved in the market for wool, and they probably had some sheep of their own.
The sales reveal little about the commercial orientation or lack of it of the smallest buyers. Everywhere except in Béjar zone they spent the largest share of their money on arable, whose orientation is indeterminate. This was true, of course, in Jaén too; but unlike Jaén, the second choice of the Level 1 buyers also offers few clues to the extent of their commercial orientation, except in the sierra zones.
[2] See Chapters 7 and 9. Chapter 18 will take up the subject of the despoblados and alquerías.
[3] Larruga, Memorias 34 : 307–9.
| ||||||||||||||||||||||||||||||||||||||||||||||||||||||||||||||||||||||
In Béjar zone (SH), while the largest buyers were looking for pastures to rent, the smallest buyers had their eyes turned to the outside agricultural market. Although they spent more in paying off censos than on any other item, they devoted almost a third of their capital to their second choice, improved and irrigated plots. All of the plots that Level 1 buyers acquired were linares, enclosed plots planted with flax and usually irrigated. Flax, like grain, could be grown either for domestic use or for sale to centers of linen weaving. According to the contemporary author of a survey of economic activity in Spain, Eugenio Larruga, the cultivation of flax was widespread in Salamanca province, but only certain areas harvested it commercially. He lists 131 towns in our zones where it was cultivated (Table 17.5), but only 16 grew more than a small amount for local use. According to Larruga's list, which of course may not be complete, a larger proportion of the towns in Béjar zone grew flax than in any other zone, and they sold much of it to Extremadura or traded it to outsiders for soap and olive oil.[4]
[4] Ibid., 35 : 1–19.
| ||||||||||||||||||||||||||||||||||||||||||||||||||||||||||||||||||||||||||||||||||||||||||||||||||||
The raising and preparation of flax for linen was highly labor intensive. Farmers selected the most fertile fields in their towns, plowed them five or six times, fertilized them heavily and scattered seed liberally, using three times as much seed as they would for grain. Once the flax was up they weeded by hand, and they devoted great care to the harvest. The process of turning the harvested flax stalks into linen was further time-consuming. The linseed for next year's planting must be beaten out, the stalks soaked for a week or ten days in a stream, dried, and gently pounded to remove the skin. The women then took over, beating the flax with a wooden swingle, combing and cleaning it, making it ready for spinning.[5]
The purchase of linen fields agrees precisely with the pattern described in Chapter 15. Highly labor intensive, the cultivation of flax interested the smaller buyers, those prepared to exploit the land person-
[5] Ibid., 19–21.
ally. Thirty-nine percent of the "improved" fields disentailed in Béjar zone were flax fields (linares). Level 4 buyers devoted only 5 percent of the money spent for improved fields to flax fields, Level 1 buyers 100 percent.[6] A significant proportion of the small buyers in Béjar zone were commercially oriented, one is led to conclude, but at the cost of great personal input.
The lowest level of buyers in the other two sierra zones also revealed distinctive preferences related to the nature of local agriculture, but it is less clear that they were oriented toward an outside market. In Miranda del Castañar zone (SG), only 29 percent of Level 1 purchases were arable, while 23 percent were orchards. All of these were chestnut groves, a regional specialty,[7] but most chestnuts were probably consumed locally, since grain was scarce. Level 1 buyers did make 13 percent of their purchases in vineyards and 8 percent in olive groves, no doubt with an outside market in mind, but as a group these buyers cannot be classified as commercially oriented.
Much the same can be said of the smallest buyers in Piedrahita zone (SI). Although half their purchases were arable fields, 22 percent were pastures. At midcentury this zone had the largest number of sheep and cattle per vecino in agriculture of all the zones in the province. Our study of El Mirón showed that pastures were the most sought-after purchase in the region, but they were much more likely to be used for cattle than for sheep, which could graze on the hills and stubble. Some cows and steers were produced for the market, but again, the smallest buyers in this zone did not belong structurally to commercial agriculture.
These inferences exhaust the information presented by the type of property purchased by different levels. The examples of La Mata and Villaverde in Armuña indicate that the nucleated towns of the rich plains zones (but not their despoblados) had a virtual grain monoculture, a conclusion reinforced by the high percentage of arable land in the disentail in these zones (Table 17.3).[8] Here every farmer, and thus every level of buyers, had to be involved to a greater or lesser extent in the sale of grain.
One is left with a sense that the picture is incomplete and selective. Reviewing the conclusions developed in Chapter 15, one discovers another approach. A much greater proportion of the purchases were paid
[6] Level 2, 79 percent; Level 3, 72 percent.
[7] Larruga, Memorias 35 : 21.
[8] On the grain monoculture of this region, see García Fernández, "Champs ouverts," esp. 695–701.
for in paper currency—vales reales—in Salamanca than in Jaén (70 percent compared to 45). Large buyers everywhere used vales reales more than small buyers and were more oriented toward the national market. Furthermore, a separate analysis of Salamanca province shows that properties oriented toward commercial agriculture were paid for in vales much more than those for home production. This at least is the logical conclusion from a comparison of the sales of rural estates and improved or irrigated fields. Eighty-six percent of the payments for rural estates—most of which would be oriented toward market production—were made in vales reales. The latter account for only 35 percent of payments for improved or irrigated fields—labor-intensive huertas, enclosed fields for herren (fodder harvested green), flax fields, and the like, not all directed to domestic consumption, of course, but of all the categories the one most fully of this kind.
Basically the argument being developed is that, although arable formed the largest proportion of the sales in most zones, and one cannot distinguish between arable bought for commercial purposes and arable bought for subsistence agriculture from the deeds' descriptions of the properties, one can predict reasonably well the orientation of the purchases by the currency used in payment. Table 17.6 provides this information for Level 1 and Level 4 buyers. In all the plains zones and both hilly zones Level 4 buyers paid for more than 70 percent of their pur-
| ||||||||||||||||||||||||||||||||||||||||||||||||||||||||||||||||
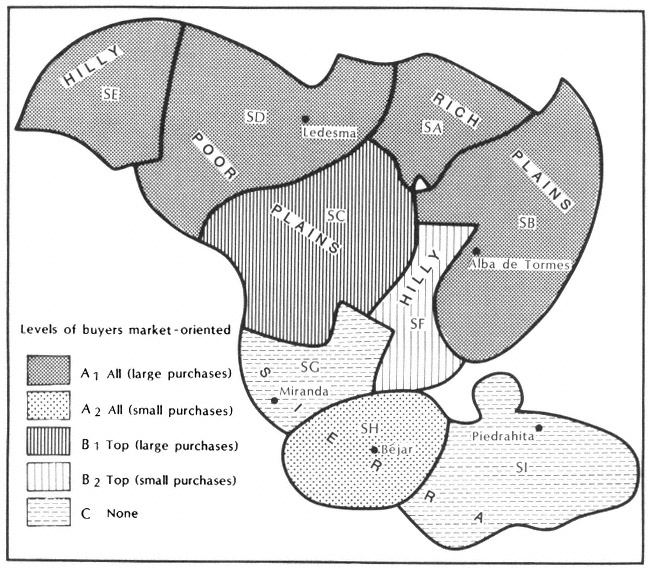
Map 17.2.
Salamanca Province, Types of Zones
chases with vales. This includes the four zones where Level 4 buyers put a quarter or more of their money into rural estates. In the three sierra zones Level 4 buyers paid for about half their purchases in vales, and were probably much less market oriented than their counterparts elsewhere. While Level 1 buyers used vales much less, those of SA, SB (rich plains), SD (poor plains), and SE (hilly) paid for 18 percent or more of their purchases in vales and were probably involved in the market to a significant extent.
On the basis of this analysis, which is less conclusive than one might wish, one can now assign the Salamanca zones to the categories developed for Jaén (see Table 17.1 and Map 17.2).
Type A. All levels of buyers involved in the outside market
A1 . Large purchases
Rich plains zones: SA (Armuña), SB (Alba de Tormes)
Poor plains zone: SD (Ledesma)
Hilly zone: SE (Aldeadávila)
A2 . Small purchases
Sierra zone: SH (Béjar)
Type B. Top levels of buyers involved in the outside market
B1 . Large purchases
Poor plains zone: SC (Charro)
B2 . Small purchases
Hilly zone: SF (Salvatierra)
Type C. No levels of buyers involved in the outside market
Sierra zones: SG (Miranda), SI (Piedrahita)
2
With no more than four zones in any one type, statistical correlations become almost impossible to establish, yet one can seek apparent relationships between the types and the social and economic characteristics of the zones. Certain obvious features show no correlation. This is true of mean town size (Table 17.2). Type A1 zones span the whole range from the next to the lowest (Ledesma) to the next to the highest (Aldeadávila). Industrial activity is also not related to the extent into the agricultural market (Table 17.7). There is less cloth making (fewer carders and weavers) in the commercially oriented Types A1 , B1 , and B2 zones than in Types A2 and C.
The table is drawn up so that geographic comparisons can also be observed, and it shows that the pattern of crafts can be explained much better by geographic affinities than by the extent of commercial agriculture. Cloth making was concentrated in the sierra zones, with SH (Béjar) far ahead of any other, obviously because the city of Béjar was a major woolen center of Castile. This region, one recalls, grew much flax, while SI (Piedrahita) had more sheep per peasant family than any other zone. Much of the wool and linen was woven locally, a task performed by professional carders and weavers, such as those we met in El Mirón.[9]
Table 17.7 shows that the total proportion of craftsmen in the popu-
[9] Zones SD, SE, and SF also grew flax, and this may explain their slightly larger proportion of clothmakers. All zones did some weaving, but the catastro summary does not distinguish between woolen and linen weavers.
lation reflects closely the number of carders and weavers. SD (Ledesma) is a deviant case, however; with few involved in cloth making it still has one of the highest proportions of craftsmen. This deviance is misleading, for it reflects a problem inherent in the study of the zones of Salamanca. The plains zones were dominated by three cities: Salamanca (population 16,438 in 1786), Ledesma (1,844), and Alba de Tormes (2,293). Salamanca city lies at the junction of three zones, and I excluded it from them. Alba de Tormes is in zone SB and Ledesma in SD. All these cities had a concentration of crafts serving their residents and the richer members of their hinterlands. If Ledesma is excluded from zone SD, the proportion of craftsmen becomes similar to that of the other plains zones. Alba de Tormes had less impact.
In sum, craftsmen tended to concentrate in the cities, but only Béjar had a specialized industry. Elsewhere, the sierra zones had more crafts-
| |||||||||||||||||||||||||||||||||||||||||||||||||||||||||||||||||||||||||||||||||||||||||
men than the plains zones, in part no doubt because the town size was larger in the sierras. But in part one can also observe that the proportion of craftsmen was negatively correlated to the commercialization of agriculture. We can recall that the craftsmen in La Mata and Villaverde, both in the rich plain of Armuña, were hard pressed and declining, faced by the competition of outside products brought in along the lines of communication that served to export their harvests. Artisans in the larger and more isolated sierra towns fared better, and their zones had more craftsmen than the plains, with the hilly zones in between. One may conclude that the concentration of crafts responded to two factors: positively to the production of local wool and flax and negatively to the commercialization of agriculture.
Because the greater concentration of cloth making in the sierra zones does appear in a region of noncommercial agriculture, it exhibits one of
the characteristic features of the putting-out system.[10] The appearance is misleading, however. Domestic weaving does not give evidence of being a new development in the sierras in the eighteenth century or of being organized as proto-industry. Nor did it offer an opportunity for economic growth. Béjar continues until now to be a center for woolen manufacture, but in the transition to modern factories, it destroyed the artisan production of the towns around it.[11] The case of the sierras thus does not invalidate my earlier conclusion that the lack of the necessary commercial infrastructure precluded the emergence of a proto-industry in central Spain similar to that in northwest Europe or the Spanish periphery. One cannot extrapolate directly from Salamanca to all Castile, of course, but historians who have been looking at early modern Spanish industry tend to support this conclusion.[12]
In Jaén muleteering was associated with market-oriented agriculture. Table 17.7 reveals no similar association in Salamanca. It is true that the two zones with the most transport activity, Armuña (SA) and Béjar (SH) have all levels of buyers involved in market-oriented agriculture (Types A1 and A2 ), but the concentration of arrieros in other Type A zones was among the lowest in the province. Again, geographic location, not commercialized agriculture, was the dominant factor. It worked in two ways. First, the sierra zones engaged in muleteering as they did in crafts, as compensation for poor agricultural potential. Second, towns that sent out arrieros were located on or near the main north-south highway from Andalusia and Extremadura through Béjar and Salamanca to León, Burgos, and the north (Map 17.3). It passed through Zones SH (Béjar), SF (Salvatierra), and SA (Armuña). A number of towns with arrieros were clustered in the vicinity of Salamanca. The city drew heavily on the food production of the surrounding plain, but our study of La Mata and Villaverde showed that their muleteering activity did not depend on transporting grain to the city, done rather by the farmers themselves. Muleteers served the city in other ways, in long-range operations to the north coast, Extremadura, and Madrid, that is, along the old Roman road. Although the arrieros in the region may have got their start from furnishing Salamanca city, their clientele was now located throughout the northern half of Castile.
[10] See Jones, "Agricultural Origins of Industry."
[11] González Enciso, "Protoindustrialización en España," 35. His Cuadro 5 gives the number of looms in four towns of the region, based on Larruga, Memorias. The catastro, however, shows weavers in all but four of the thirty-two towns of the partido, 525 altogether, although it does not specify what material they worked (AHN, Hac., Catastro, Salamanca, estado seglar).
[12] González Enciso, "La protoindustrialización en España."
Map 17.3.
Salamanca Province, Income from Muleteering, ca. 1750
In Jaén too, muleteering was a function of highways, those between Castile and Seville or Granada. Zones JD in the poor basin and JQ in the southern sierras owed their income from transportation to their location on the Madrid-Jaén-Granada road, for they, like Salvatierra and Béjar zones in Salamanca, were in poor agricultural districts. In Jaén we found that the presence of a major road also fostered commercial agriculture, especially specialization in olives. The main road of Salamanca had no such effect. Comparative advantages of location and type of soil determined the production of grain and livestock for the market, factors stronger than a secondary road system.
Despite such marked differences, at least one attribute of commercial agriculture was common to both provinces. The Madrid records of the sales show only about two-thirds as many men and women entitled to call themselves don and doña among the buyers in Salamanca as in Jaén, but here too they were associated with commercialized agriculture. In all zones, as we have come to expect, a far higher percentage of
big buyers were notables than small buyers (Table 17.8). Furthermore a greater proportion of buyers was notable in Type A1 and B1 zones than in the others, that is, zones where the top levels or all levels of buyers were into the market and spent a large amount per capita. A2 and B2 zones, where the amounts spent were small, had considerably fewer buyers called don or doña, similar in this respect to Type C zones, which were not into the market.
The census of 1786 supports this association. The zones where all levels of buyers were into the market (Types A1 and A2 ) had more hidalgos per thousand adult males than other zones (Table 17.9), with one apparent exception: SA (Armuña) had slightly fewer than SG (Miranda). The reason is easy to perceive. Salamanca city was the cabeza de partido for SA, as it was for zones SC and part of SB. The hidalgos associated with partido administration or who lived off the income of its lands were to be found in the city. In the sierra zones, including SG, the hidalgos lived in the zones; and they did also in SD (Ledesma), the zone with the highest proportion of hidalgos. The town and village structure was much
different from that of Jaén, but the association of hidalgos with commercial agriculture appeared here too.
Yet there was a difference even in this respect. The hidalgos of Jaén lived by and large in the towns where they owned and exploited their properties, forming the dominant portion of the local political and economic elites. In Salamanca province, with its myriad small towns and hamlets, this was not the case. Hidalgos clustered in the larger places: the mean population of towns with hidalgos was between 1.6 and 4.2 times as great as the mean population of all towns in the zones. Even if
one considers only towns that reported at least ten vecinos in the catastro, no zone had hidalgos in more than 40 percent of the towns. The zones identified as having all levels of buyers into the market (Types A1 and A2 ) had their hidalgos more widely scattered, that is, present in a larger percentage of their towns, than other zones. Nevertheless, one cannot escape the fact that most towns in all parts of the province, especially the smaller places, had no resident hidalgos. If nobles had a morethan-proportionate role in commercial agriculture and in making purchases during disentail, it had to be as absentees.
In Jaén we found that the presence of hidalgo residents was negatively correlated with lay señorío. In Salamanca lay señorío differed in important ways from that in Jaén, and its impact on the economy is far
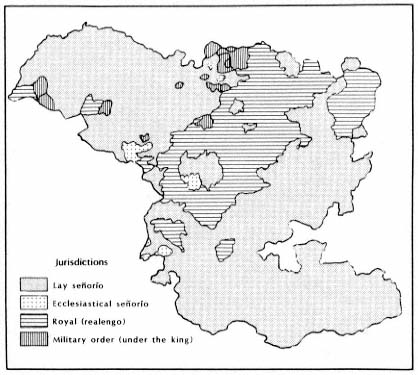
Map 17.4.
Salamanca Province, Seigneurial Jurisdictions
NOTE : Based on Mateos, Salamanca, Map 9.
less obvious. Much more of the province was under this type of jurisdiction, as one can observe from Table 17.10 and Map 17.4. Three-quarters of the population in the study area lived under lay señorío (two-thirds if one includes Salamanca city, which was royal).[13] The only administrative division primarily under royal jurisdiction was the large partido of Salamanca city, while nine smaller partidos were entirely under lay seigneurial control.[14] The situation was not so clear cut as this, however, because throughout the province there were "exempt towns" (villas eximidas), outside the jurisdiction of the partido within which they lay geographically.[15] The only zones with a majority of the population
[13] For the whole province the figure was 66.3 percent (Mateos, Salamanca, 39).
[14] Partidos of Alba, Barco de Ávila, El Mirón, Piedrahita, and Salvatierra, all under the Duque de Alba; Béjar under the Duque de Béjar; Ledesma under the Duque de Alburquerque; Miranda under the Conde de Miranda; and Montemayor under the Marqués de Castro Monte.
[15] The situation is spelled out in detail in España dividida en provincias. On the grant of exempt status in the sixteenth century, see Vassberg, Land and Society, 165–69.
under royal jurisdiction were those lying mainly in the partido of Salamanca: SA and SC.
The striking difference between señorío in Jaén and Salamanca was that the former was accompanied in two-thirds of the towns by the ownership of the largest properties in the town. This was not the case in Salamanca; of 419 places with separate catastro returns that were under señorío lego, the señor held the greatest share of real property in only 29 places (7 percent).[16] All señores hacendados mayores were absentee owners; most of them resided in Madrid.[17]
The three largest señoríos in the province reveal the nature of señorío here. The señores had the rights of jurisdiction, with the corresponding income from fines and appointments to municipal offices, and the crown at some time in the past had given them the alcabalas, or sales tax, and the tercias reales, the royal two-ninths of the tithes. These sources could produce considerable income, but they were called alienated rights (derechos enajenados ) because the loss was to the crown, not the subjects, since the latter would have had to make the payments in any case.[18] In fact the crown got very little from these territories, as we saw in the case of El Mirón.
The Duquesa de Alba, who lived in Madrid, was señora of five partidos covering the eastern sector of the province, all zone SI and most of SB and SF, 129 places of the catastro. In only 12 was she the largest owner of real property, including five cotos redondos, in which she was virtually the sole owner. In 11 other places she was hacendada mayor by virtue of the payments she received, and the catastro record of hacendados mayores permits us to appreciate how much of the local economy was absorbed by these payments. In 8 towns it ranged from 7 to 22 percent of the annual income from the land; in 3 cabezas de partido from 29 to 46 percent. These figures are misleading, however, because agriculture provided only part of the income of the towns. Cabezas de partido had many craftsmen and paid more alcabalas as a consequence, while towns in the sierra drew much income from livestock, yet neither of these types of income can be readily calculated from the catastro. The share of the gross town product going to the Duquesa de Alba was therefore less than these percentages, perhaps between 5 and 15 percent.
[16] In sixty-three places the señor was also the hacendado mayor, but in many of these his "hacienda" or property consisted not of land but of the complex feudal dues, taxes, and tithes paid to him. For a discussion of the wide variety of taxes, dues, and rights accruing to señores in Salamanca province, see Mateos, Salamanca, 39–53.
[17] Eight señores, hacendados mayores in fifty-eight towns, lived in Madrid.
[18] AHN, Hac., Salamanca, libro 7479.
The economic impact of the señorío of the Duque de Béjar was about the same. Lord of the partido of Béjar (the major portion of zone SH), he was hacendado mayor in 25 of the 32 towns of the partido, but in 20 of them because of his seigneurial rights. His income ranged from 3 to 76 percent of the income from agriculture in the town. These figures are even less indicative of the duke's true share, because income from livestock and from cloth making was high here. In 3 towns where the duke's income was over 60 percent of the harvests, it came mostly on alcabalas levied on local manufactures.[19]
The position of the Duque de Alburquerque was very different. Señor of the partido of Ledesma in the northwest (most of zone SD and part of SE), he had jurisdiction over 186 places but was hacendado mayor only in Ledesma, cabeza de partido, because of payments received as señor. Since Ledesma was a town of craftsmen, the weight of his señorío was comparable here to that of Alba and Béjar in their partido capitals. Outside Ledesma his presence was nowhere as onerous as that of the hacendados mayores.
Since seigneurial jurisdiction in Salamanca seldom entailed extensive ownership of real property and it absorbed most of the income that would have gone to the crown otherwise, it could have had little adverse economic effect. It may even have been helpful. Lay señorío in Jaén discouraged the presence of hidalgos. Not so in Salamanca, to judge from Table 17.11. Hidalgos were concentrated in the provincial capital and the cabezas de partido, but outside these places, regions of seigneurial jurisdiction had almost twice as many hidalgos proportionately as regions under the crown. Towns under lay señores were more than twice as likely to have a noble in their midst as royal towns. Since the presence of hidalgos is a good indication of commercialized agriculture, señorío in Salamanca does not appear to have discouraged it. Among the Type A1 zones, those most commercialized, Zone SD had the highest proportion of nobles and of noble buyers; it also was the zone with the greatest percentage of purchases made with vales reales, our best evidence of market-oriented farming (Tables 17.6, 17.8, and 17.9). It was dominated by the señorío of Alburquerque.
Why were the effects of lay señorío so different in the two provinces? One might expect that, being an older region of Christian Spain, Salamanca received an earlier form of señorío, less burdensome to its subjects. The major jurisdictions, however—Valdecorneja (the partidos of
[19] Baños, Béjar, Candelario.
| |||||||||||||||||||||||||||||||||||||||||||||||||||||||||||||||||||||||||||||
Piedrahita, El Mirón, and Barco de Avila), Alba de Tormes, Béjar, Miranda del Castañar, and Ledesma, were given to señores in the fourteenth and fifteenth centuries, no earlier than major portions of Jaén.[20] Although one cannot rule out the influence of earlier practices in the two regions, physical and human geography appear to account for the different nature of señorío. In Salamanca the towns were small, close together, peopled by self-employed peasant farmers. They gave little scope for building up large seigneurial properties in the fashion of the cortijos that could be carved out of the wastes that surrounded the large Andalusian towns. The lords chose to be satisfied with little real property and pushed instead to take over the royal income, the alcabalas and royal share of the tithes. As we shall see in the next chapter, large exploitations did exist in Salamanca, the cotos redondos comprising entire census units. They too were the product of geographic forces: many were in royal lands, and few of those lying in seigneurial regions belonged to their señor. The example of Salamanca suggests that seigneurial assumption of jurisdiction and royal revenues did not drive
[20] Enciclopedia universal ilustrada europeo-americana ("Espasa Calpe"), s.vv. names of cabezas de partidos. For Valdecorneja: Lunas Almeida, Historia de Valdecorneja, 24.
away hidalgos and affect economic development adversely, as did the connection of señorío with large absentee ownership, found in Jaén.[21]
3
Except for the relationship between hidalguía and commercial agriculture, this static picture of the province has developed few leads toward explaining the extent of involvement of the zones in production for outside markets. Geographic characteristics keep coming up as the most important, indeed the decisive, variable. More enlightening could be the evolution of the zones between the time of the catastro and the first disentail. One cannot, however, proceed to compare the cultivation in the 1750s with that around 1800, as we did in Jaén. Even though the sales permit one to infer the different land uses at the turn of the century, the catastro is unmanageable for this purpose. With over eight hundred towns and villages, each with its individual survey in various volumes, an analysis of the catastro to determine land use was beyond my resources. In addition, Salamanca had no obviously expanding crop, such as olives were in Jaén, that could serve to distinguish areas moving into the national market from those that were not.
I am thus not able to observe changes taking place in the second half of the century. However, because of the large number of towns involved, it proved possible to compare the process of disentail with the conditions prior to its inception or, more correctly, with the conditions revealed by the catastro. This is a relationship that we could infer only indirectly in Jaén.[22]
In following the process of disentail in the various towns in Part 2, we repeatedly found that the groups that benefited most from the desamortización were those that already had a strong position within the agricultural economy. The process itself seemed to favor such an outcome. Because the sales were at auction, they tended to put the land into the economically strongest hands. In a rural economy one could expect that the groups with the most disposable capital would be those that owned or controlled the land. It can thus be expected that the sales would strengthen existing patterns of control of the land—except, of course, that ecclesiastical owners would lose out. The Salamanca data allow one to test this hypothesis in two different ways.
The first involves the concentration of landowning. If the sales re-
[21] See Appendix R.
[22] An earlier version of the following analysis appeared as Herr, "Vente des propriétés de mainmorte."
inforced existing patterns, the acquisition of land should be concentrated among the buyers in proportion to the concentration already existing. The most obvious test of this proposition would be a comparison of two sets of Gini concentration coefficients (drawn from Lorenz curves) for each of the zones, one for landowning as shown by the catastro and one for the purchases. Neither is available, however, the first because of the prohibitive time that would be needed in the archives, the second because the Gini coefficients of the zones vary substantially according to the way the researcher decides to divide purchases made by more than one buyer among the different buyers (information on how they were in fact divided not being given in the Madrid records).[23]
Using the kinds of data with which we are familiar, however, one can develop surrogate indexes of concentration that permit a satisfactory test of the proposition. For the index of concentration of ownership at the time of the catastro, I used the product of two statistics. One was the percent of the total property in the zone that was owned at midcentury by the hacendados mayores (the largest property owner in each town). The catastro records in Simancas give the income of the hacendados mayores, and the provincial summaries of the catastro in Madrid provide data for obtaining the total income from land in each zone.[24]
Although this statistic alone is a simple index of concentration, I decided to multiply it by a second statistic: the ratio between the mean income of the properties of the hacendados mayores and the mean income of all properties. The reason for this step is that the size of not only the largest properties but the others as well determines the extent of concentration. There is more concentration (as measured by a Lorenz curve) where there are one or a few large properties in the midst of many small ones than where all properties are relatively large. The mean income of the properties of the hacendados mayores could be obtained directly, but that of other properties could only be approximated. For this purpose, the income of the properties of the hacendados mayores was subtracted from the total income in the zone, and the remainder was divided among the estimated number of other properties in the zone.[25]
The index of prior concentration is the product of these two statis-
[23] See Appendix S.
[24] The provincial summary in Madrid: AHN, Hac., Catastro, Salamanca, estados seglar, eclesiástico patrimonial, and eclesiástico, under "letra D" of each volume, gives the number of measures of land in each town belonging to each type of owner, broken down according to the annual income from each measure of land. The calculations are extensive, but made easier with a computer.
[25] See Appendix S.
tics. It can be looked on as the area of a rectangle. The vertical side is the percentage of property in the zone owned by the hacendados mayores, and the base is the ratio of the mean income of the properties of the hacendados mayores to the mean income of the other properties (Table 17.12).
The index of the effect of sales on concentration of landholding is a similar rectangle derived from the sales records. The base of the rectangle also represents a comparison of large to small properties, in this case the ratio of the mean amount spent by the buyers in Level 4 (the largest buyers) to that of the buyers in Level 1 (the smallest buyers). Rather than use the simple ratios, which run from 23 : 1 to 210 : 1, I sub-
stituted their logarithms. The reason is that the range is very high, the largest reading being over nine times the smallest. The other statistic in this index, to be described next, has a range of only 2.6. Multiplying them together would give an excessive weight to the first. The logarithm reduces the range to 1.7, less than that of the other statistic but not so dissimilar.
The vertical side of the rectangle is the percentage of buyers in Level 4 who bought more than one property. At first sight this figure may not seem directly comparable to the percentage of land owned by hacendados mayores used for the earlier index. It was chosen because this index was intended as a measure of change due to the sales, not of the already existing concentration of the lands being sold. Properties being farmed as single units were not ordinarily divided before their sale. Therefore the lowest concentration effect (the greatest increase in the number of landowners through the sales) would result if each property went to a different buyer. The percentage of buyers who bought more than one property is thus a measure of how much concentration was effected above this minimum. It is proper to use only Level 4 buyers in each zone because, smallest in number (they ranged from 3 to 12 percent of all buyers), they had the greatest effect on the pattern of landholding: by definition they accounted for 50 percent of the purchases. The index and its components are given in Table 17.13. (One should stress that even though this index measures the extent to which the sales created new large holdings in the hands of laymen, it is not a measure of the absolute change in concentration. Some religious endowments consisted of various properties that were sold off separately, thus tending to decrease the existing concentration of ownership. The absolute change was the difference between these two contrary effects, which I have not attempted to calculate.)
When the two indexes or sets of rectangles, one of the prior concentration of landowning and the other of the effect of sales on concentration, are compared, they give a high coefficient of correlation, r = .89. Statistically this means that the correlation could have occurred by chance less than once in a hundred cases (it is significant at the 1-percent level). Although the indexes are the products of circuitous calculations, they offer strong support for the validity of the proposition.
Figure 17.1 graphs the result, the regression line of the effect of the sales on the prior concentration. The resulting pattern supports both the division of the zones into types of participation in the market and into geographic regions. Type A1 zones (SA, SB, SD, SE) fall in the middle of
the pattern, with Type B1 (SC) far out on its own and Type C (SG, SI) together at the other extreme. Zones in the different geographic regions are even more closely associated, poor plains zones (SC, SD) with high concentration, sierra zones (SG, SH, SI) with low concentration, and zones in the other two geographic regions are also proximate to each other.[26]
[26] The statistical strength of the correlation depends greatly on the outlier SC. Without it, the correlation coefficient drops to 0.59, and consequently the correlation line swings clockwise. The pattern loses its statistical strength, being valid only at between the 10-percent and 20-percent level. What weakens the correlation is the deviance of Zone SB, which shows a much higher effect of concentration from the sales than the regression would predict.
Figure 17.1.
Salamanca Province, Regression of Concentration
Effect of Sales on Concentration of Prior Ownership
4
The nature of the data makes possible another test of the proposition that the sales at auction strengthened existing patterns of landholding, by comparing the amount of absentee ownership in each zone before the sales with the amount of property bought by nonresidents. We know already that absentee ownership was a strong characteristic of the province.[27] In the studies of individual towns we observed that around Salamanca city the large blocks of property were in the hands of outsiders and that nonresidents were the biggest buyers, a fact confirmed above for the province as a whole, since we saw that notables were the major buyers and they were largely absentees. Most hacendados mayores at
[27] Absentee ownership is defined as ownership of the property in a place by persons or institutions domiciled outside the place; nonresident buyers similarly are those domiciled outside the place where the property is located.
midcentury were also outsiders (Table 17.14). Some relationship between prior absentee ownership and absentee buying is apparent; the data permit us to test statistically the strength of the correlation.
To obtain an index of prior outside ownership (Table 17.15), I used three figures. The first (Column A) was the proportion of the land in each zone owned by absentee hacendados mayores. It is an accurate statistic of how large a share was owned by certain absentees, namely those who were the largest owner in the town. To get an approximation of absentees among other landowners, I used the ratio of the total value of the land in towns with absentee hacendado mayores to the total value of all the land in the zone (Column B), on the assumption that towns with absentee hacendados mayores would also have a larger share of smaller absentee owners. The third statistic (Column C) is drawn from information on ecclesiastical ownership, since much land belonged to religious institutions and foundations located outside the small places.
It represents an attempt to calculate the percentage of land in the hands of outside ecclesiastical owners. To obtain it, the share of land owned in each zone by ecclesiastical institutions is multiplied by the share of all the land in the zone that was located in towns where the hacendado mayor was an ecclesiastical institution. The final index is a simple mean of these three statistics. One should stress that the index does not represent an estimate of the proportion of land owned by outsiders; its purpose is to permit a comparison among the zones.
The index of sales made to outside buyers also had to be derived indirectly, for the Madrid notaries' deeds of deposit did not usually state the residence of the buyers, although where it was given I noted it. A search of local notarial records unearthed the residence of many of the largest buyers. In addition, unlocated persons who bought property in more than one town were considered residents of the town where they made the most purchases and nonresidents elsewhere. Those persons with names preceded by don not identified as priests, who bought in towns where the census of 1786 showed no hidalgos, were also considered nonresidents. (Not all laymen called don were hidalgos, but hidalgos were probably the most numerous group among them.)[28] The purchases thus identified as made by outsiders were totaled and divided by the total amount spent in the zone. The result, in Table 17.16, shows that the share of the sales in each zone that appears to have gone to outsiders ranges from 9 to 82 percent.
When the index of prior absentee ownership is compared to that of nonresident buyers, the two give a surprisingly high coefficient of correlation, r = .97. Figure 17.2 illustrates the close relationship between the two, r 2 = .94, implying that the amount of land that was bought by outsiders was 94 percent determined by the amount owned by outsiders before the sales.[29]
Where the land was in nonresident hands (much of it ecclesiastical), potential outside buyers would know about the possibilities, the channels of information were good. They could take over existing leases and tenants from the present ecclesiastical owner; the transactions costs of the purchase were low. Furthermore, where local farmers owned little, they also were likely to have little capital. As in La Mata and Villaverde, they might bid for small collections of arable plots but not for holdings
[28] See above, Chapter 15, section 4.
[29] The correlation coefficient in this case does not depend heavily on one outlying point.
Figure 17.2.
Salamanca Province, Regression of Sales to
Nonresident Buyers on Prior Outside Ownership
of many plots spread over various villages, and certainly not for a coto redondo like Pedrollén. But where the land was in local hands—in the sierras and to a lesser extent in the hilly zones—outsiders knew less about it and the residents had proportionately more wherewithal. Wealthy investors had less information and less interest in these regions, and vecinos were the main buyers.
As one can expect, outside owners and buyers were present in greater numbers where agriculture was oriented toward the national market (Type A1 and B1 zones). They used more vales reales than elsewhere to make their purchases. The zones with fewer outside owners and buyers not only paid much more in hard currency, but buyers also bid more against each other—there were more payments in specie above the minimum bid (Table 17.17). Chapter 15 distinguished in both provinces two types of agriculture: market oriented and local. The former was charac-
terized by greater use of vales reales, extensive cultivation, larger participation of hidalgos, and, we can now add in the case of Salamanca province, greater absenteeism. Regions of local agriculture relied more on hard currency, had more intensive farming and less land in the hands of outsiders, and were more socially egalitarian.
Chapter 15 concluded that all areas had some of both kinds of agriculture, indeed that most individuals were involved in both kinds. The more wealthy the individual, the greater his participation in the market was likely to be. What we find in Salamanca is that the distinction is not only social but regional, much more so than in Jaén. The plains around Salamanca City, including the partidos of Ledesma and Alba de Tormes, were strongly marked by commercial agriculture. The sierra zones were much less defined by external contacts. This was true even of Béjar zone (SH), which, because of its livestock and flax, was oriented toward the wider market. Its buyers had comparatively little money and were local people, like those of the sierra zones on either side. In the plain, the poor zones had more outside buyers and less active bidding at all levels than the rich zones. The latter had a more prosperous peasantry that offered an impediment to complete domination from without, peasants who were themselves participants in the greater economy.
The close relationship between prior outside ownership and the extent of purchases by nonresidents, together with the high correlation between prior concentration of ownership and concentration in buying, offers convincing evidence in support of the proposition that in an area where the economy was basically rural, sales of entailed land at auction, as provided by the desamortización of Carlos IV, perpetuated and accentuated existing patterns of landholding; they did not create new ones.
The two provinces do not offer evidence on how the result might differ in an area that was industrializing or whose economy was changing in other ways, but one can predict that the correlation between prior conditions and the redistribution of land would be weaker. Buyers with capital from sources other than agriculture could be expected to accentuate concentration and absentee ownership. The regions around Salamanca city offer some support for this view. The three zones surrounding it were SA, SB, and SC. Figure 17.1 shows that zones SB and SC are above the regression line, indicating that the effect of the sales was greater than the regression predicted. The deviance is especially notable in SB. If the correlation is recalculated without these three zones, the coefficient of correlation, r, rises from .89 to .95 (significant at the 1-percent level). Figure 17.1 shows the new regression line. Salamanca
city had no modern industry, and most of its income came ultimately from the plains around it. The university, the cathedral, and its many parishes and religious orders owned land and received tithes from farmers in this region. The city's merchants dealt in grain. Its craftsmen furnished their products to clerics, señores, hacendados mayores, and merchants who resided in the city and to the vecinos of the surrounding towns, drawing indirectly on the agriculture of the region. But Salamanca was also the capital of the province, receiving some of royal revenues that came from beyond the partido, and its artisans no doubt sold their wares throughout the province, the silver jewelry of the charro costume, for instance. Local grain was shipped to Madrid and the north, and the city's merchants received a share of the profits. The university drew students from throughout Castile.[30] Its leading citizens thus had available more capital than that produced by local agriculture, and this can explain the greater concentration of purchasing than that predicted by a regression line based on the structure of prior landholding. Its example offers support for the proposition that nonagricultural sources of income could hasten the concentration of landowning in a period of desamortización, provided, of course, that the recipients of such income chose to invest it in agriculture, and especially in commercially oriented farming.
Disentail encouraged the commercialization of agriculture by offering lands to men and women interested in a profitable investment, whatever the source of their capital. In this respect it carried out the wishes of Jovellanos and the royal reformers. Nevertheless, its impact in a country like Spain, where agriculture was by far the major occupation, was determined primarily by existing conditions, which it served to accentuate rather than mitigate. And this, of course, is not what Jovellanos had predicted, at least in the long run.
[30] See Kagan, Students and Society, 202–210, Map 5.4, and Appendix A, Table 4. The latest date for the geographic origin of students given for the University of Salamanca is 1690, but the pattern would be similar in 1800.