Seismic Array Operation in the 1970s
The 1960s were the decade of array deployment, while the 1970S were the decade of continuous real-time operation. For example, although LASA was completed in 1964, it did not become fully operational until 1971, coincident in time with NORSAR. The reason for this was simply that field instrumentation was commercially available, but an integrated computer
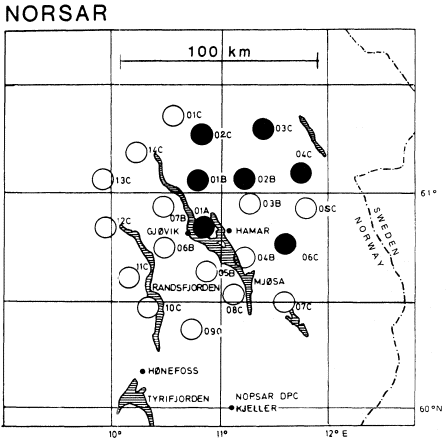
Figure 3
NORSAR. Each circle represents one subarray consisting of six short-period
and one three-component long-period instruments. All twenty-two subarrays
were in operation from 1971 to October 1, 1976, whereas only a subset of
seven subarrays (filled circles) have been in operation since then.
hardware-software system had to be developed specifically for array operation. For example, IBM (Federal Systems Division) spent more than four years on this task before completing the LASA and NORSAR data-processing systems (see Bungum et al., 1971). After these arrays became operational, it took a year before the software was reasonably bug-free and, equally important, before the staffs at the respective array data centers in Alexandria, Virginia, and Kjeller, Norway, had mastered the automated array operations. For example, multiple-phase recordings like P and PP were initially featured as separate events simply because the analyst did not have a display of the complete wave record. Shortcomings of this kind were easy to
detect because otherwise there would have been a marked increase of earthquake activity in the North Atlantic well off the midoceanic ridges.
More subtle problems were tied to the apparently larger number of earthquakes detected during local nighttime than during the day. With no scientific rationale for such a phenomenon, the alternative was that this was an artifact of array operation. The explanation turned out to be a diurnal change in noise characteristics, which were relatively broadband during the daytime, due to high-frequency cultural noise, and thus corresponded to a marked difference in detector false alarm rates for a fixed threshold. A few of the many nightly false alarms would inevitably be classed as "true" events, thus explaining the apparently higher earthquake activity. The solution to the problem was to keep the false-alarm rate flat by making the detector threshold a function of diurnal time (see Steinert et al., 1976). Also worth mentioning is that a "high-level" constraint was imposed on LASA not to report core phases, yet such events inevitably were recorded. In the array bulletin, such events were located at 105° distances. In due time, these artifactual epicenter solutions "filtered" into NEIC and ISC files and, not too surprisingly, have been the subject of a few tectonic studies and modeling.
The LASA and NORSAR arrays were termed teleseismic arrays, stemming from the fact that their large apertures, and hence large station separations, permitted operation only in essentially the 1.0–2.5-Hz band. This meant that local and regional event signals could not be handled properly due to poor signal correlation at higher frequencies (Ingate et al., 1985). This problem was further aggravated by the limited number of beams to be deployed due to limited computer capacity (IBM 360/40 computers of 1964). Poor detectability of regional events was to a large extent overcome by introducing so-called incoherent or envelope beamforming. The signal envelopes were highly correlated—even though the "originals" were not—and were of relatively low frequency (see Ringdal et al., 1975). Although envelope beamforming suppressed only the noise level variance (not the noise level per se) by a factor of

An interesting feature of array recordings is that sensor amplitudes for an individual event vary considerably and can be approximated by a log-normal probability distribution function (Husebye et al., 1974). Furthermore, any of the twenty-two NORSAR subarrays would, for one or more earthquake source regions within the teleseismic distance window, exhibit the largest signal amplitude. In other words, the amplitude "response" of the NORSAR siting structure is highly selective in terms of angle of incidence of the incoming wavefront (see figure 4).
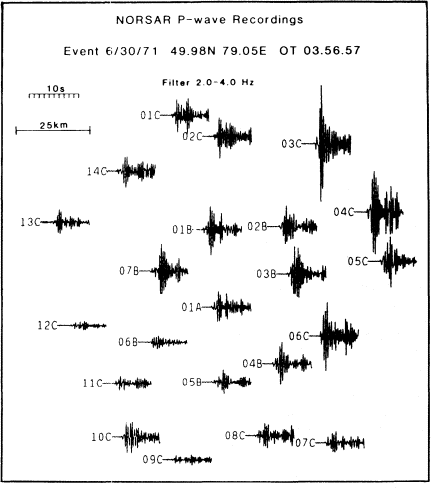
Figure 4
NORSAR. P-wave recordings from the center instruments of each subarray
for an explosion in eastern Kazakhstan ( mb = 5.4, distance 38°). Note the
large variations in signal amplitude and waveform complexity across the
array. The signal frequency contents are similar for all instruments with
the best signal-to-noise ratio in the band 2.0 to 4.0 Hz.
A practical aspect of the skewness in P-amplitude distributions across large arrays like LASA and NORSAR is that using only the four to six "best" subarrays for a given event results in signal-to-noise ratio enhancement, which is only marginally improved by including the remaining sixteen to eighteen subarrays in the beamforming process (Berteussen and Husebye, 1974). In the extreme, a single sensor may exhibit a signal-to-noise ratio roughly similar to that obtainable using the whole array. This, in turn, reflects a common observational fact regarding array monitoring of earthquake occurrence—almost all events (signals) detected by an array are visible on a subarray beam or single-channel record trace. This knowledge was once applied, but without much success, as an additional constraint to discriminate (nonparametric tests) between signal and noise wavelets for triggering close to the detector threshold (Fyen et al., 1975). The fundamental problem was that lowering detector threshold values causes the number of false alarms to increase more rapidly than the number of events expected from the log N recurrence relation (see fig. 5). In other words, even with elaborate processing schemes, there is little point in analyzing detections at and below thresholds at which the false alarm rate starts increasing rapidly. Besides, information extractable from small detections is not particularly useful in any context except generating "nocturnal" seismicity.
After a few years of practical experience in real-time operations of the LASA and NORSAR arrays, the work became rather routine and, moreover, expertly handled by analysts. At this time (around 1975) the more fundamental issue of large-array operation came into focus: could a limited number of large arrays manage the required seismic-event surveillance functions for monitoring compliance with a potential CTB? The performance of these arrays was relatively impressive; uptime on a monthly/yearly basis was 90–95 percent, and daily detections amounted to about twenty to twenty-five events, subject to seasonal variations and uncertainty in event locations of 50–200 km. However, the detection capability of these arrays, at body wave magnitude (mb ) ~ 4.0 at the 90 percent confidence level for favorable regions (see Ringdal et al. 1977), was not entirely superior to that of some ordinary stations at excellent quiet sites. In short, the problem of detecting weak signals is tied not only to suppressing ambient noise, but the site amplification factor also is important. In the extreme, a single instrument at NORSAR exhibited signal-to-noise ratios comparable to those of the best array beam, as hinted at above.
In the midseventies, after about five years of automated large-array operation, it became clear that even several large arrays of the LASA-NORSAR type would not be adequate for test-ban monitoring of nuclear weapons of yields down to 1 kiloton (mb~ 4.0 in granite). In particular, P-signals recorded in the teleseismic window would not provide a credible diagnostic
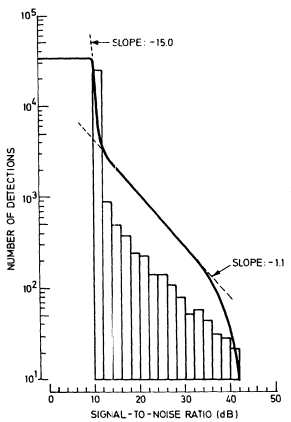
Figure 5
Number of detections by the automatic NORSAR
detector as a function of STA/LTA (signal-to-noise) ratio
for the period July to December 1972. The number of
detections increases sharply below a signal-to-noise ratio
of 12 dB where false alarms generated by noise fluctuation
dominate detections triggered by real events.
for source identification. This realization, in combination with funding problems, regrettably resulted in curtailing the NORSAR operation to seven operative subarrays, while LASA was closed down in 1978.
In summary, it was demonstrated during the 1970S that automated array operation was technically feasible, but large arrays were not sufficient for test-ban monitoring. Furthermore, P-signals in the teleseismic window were adequately understood in terms of generation mechanisms and propagation path effects, while their diagnostic power for source identification remained doubtful.