Chapter 3—
Surface Manifestations of Geothermal Systems
The surface manifestations of a geothermal system in a volcanic area are generally the features that first stimulate exploration. Consequently, the recognition, mapping, and evaluation of these features are important in the second stage or prefeasibility study, during which the geothermal potential is evaluated. The prefeasibility stage also involves sampling fluids and gases to be studied by hydrogeochemical techniques that help estimate the temperatures and compositions of hydrothermal reservoir fluids.
The most obvious expression of a geothermal reservoir occurs when fluids leak to the surface along faults and fissures or through permeable rock units. Depending on the reservoir temperatures and discharge rates, these surface manifestations take the form of seeps, fumaroles, hot springs, boiling springs, geysers, phreatic explosion craters, and zones of acid alteration. In addition, there are deposits of silica sinter, travertine, and/or the bedded breccias that surround phreatic craters. In this chapter, we describe the most common geothermal features seen in hot-water systems and vapor-dominated systems; Appendix A presents in detail the methods for mapping these features.
Hot springs are the most visible manifestation of hot-water geothermal systems that transfer heat to the ground surface (White, 1973). Some spring groups directly overlie a geothermal system and therefore may be used to locate drilling sites. However, springs may also discharge at the surface after flowing many kilometers down gradient from a hydrothermal reservoir; such outflow plumes can be misleading—they have a finite thickness, perhaps 0.5 to 1.0 km, and they overlie colder groundwater. Drillholes that penetrate these hot-water plumes show an increasing temperature
with depth in the upper part and then a rapid temperature decline at the bottom.
Chemical analyses of spring waters, considered along with the volcanic structure and hydrologic regime, will provide the data needed to interpret the degree of mixing between cold groundwater and an outflow hot water plume from a geothermal reservoir (Ellis and Mahon, 1977; Goff and Shevenell, 1987). Hot springs can act as an excellent guide for geothermal drilling if (a) the water analyses indicate there is minimal mixing with cold groundwater and (b) the geologic structures (for example, a crater) imply that the hot springs overlie a thermal source and maximum reservoir temperatures can eventually be reached through drilling.
Reservoir temperatures for hot-water systems show a considerable range: <90°C (low temperature), 90 to 150°C (intermediate temperature), and 150 to 240°C (high temperature) (White and Williams, 1975). The temperature of a hot spring will not exceed that of the boiling temperature of water at the altitude of that spring. The salinity of hot water systems can range from 0.1 to 3% (Renner et al ., 1975).
Vapor-dominated reservoirs—generally more than 85% steam—are ideal geothermal resources but, unfortunately, they are less numerous than hot-water systems (Truesdell and White, 1973; Ingebritsen and Sorey, 1988). Although such systems have been developed in many parts of the world (for example, the Geysers geothermal area of California), little is known about what lies under them; one known possibility is high-chloride brine. Usually these reservoirs occur where there is very high heat flow but low water recharge.
Near-surface gases from vapor-dominated reservoirs condense to form acids, which leach rocks in the spring area. These areas are characterized by bleached rock, acid-sulfate springs, and no chloride waters; acid springs may be accompanied by mudpots, geysers, and fumaroles (Renner et al ., 1975).
Hot Springs and Geysers
Very few hot springs on this planet have not been developed in some way. As spas, hot springs have offered comfort to mankind throughout the millennia; as an alternate energy source, hot springs are increasingly being considered for more practical uses. Hot springs range in size from seeps that produce barely enough hot water for bathing a few individuals to the awesome thermal areas of Yellowstone and the North Island of New Zealand, where hot water and steam are used for heating domestic buildings, heating greenhouses, and generating electricity.
Employed in geothermal exploration, hot springs provide a useful glimpse of the buried reservoir of hot water and/or steam. The thermal energy output (Et ) from a spring or group of springs can be calculated as noted by Goff et al . (1987):
where Vf = the volume fraction of geothermal water downstream from the hot springs (if all water issuing from a spring group is from hot springs, Vf = 1); Cpw@ 4.2 MJ/m3 or 4.2 kJ/l; Hr = the enthalpy of reservoir fluid; Tf = temperature (°C) of the hot springs; Ha = the enthalpy of water at ambient temperature; and Ta = ambient temperature. If cold spring water is mixed with geothermal fluids, one must know the chemistry of those waters to estimate the percentage of geothermal fluids. [For hydrogeochemical analysis and interpretation, see, for example, Henley et al . (1983) or Ellis and Mahon (1977).]
Although they are geologically rare manifestations of geothermal systems, geysers are spectacular. In his book on geysers and geothermal energy, Rinehart (1980) points out that a geyser is essentially a hot spring that periodically becomes hydrodynamically and thermodynamically unstable. These features have traditionally been classified as
either (a) fountain or pool geysers of hot water from which blobs of superheated water suddenly rise to the surface and explosively flash or (b) column or cone geysers that form cones or protuberances of silicic sinter above narrow subsurface tubes; these tubes are filled with water that periodically flashes to steam and emptying the tubes, which are later refilled.
Similar in mechanism to several types of hydrothermal eruptions, column or cone geysers are distinct because of their cyclic behavior. Only a rare set of hydrothermal circumstances provides the required combination of an underground water chamber with a conduit leading to the surface, water temperature and flux, and a surface opening of the size necessary for a geyser eruption.
Kieffer (1984a; 1989) has studied Old Faithful geyser in Yellowstone National Park, Wyoming, to better understand geyser eruption mechanisms and the associated microseismicity. Eruptions at Old Faithful produce a column of steam and water up to 50 m high that lasts from ~1.5 to 5.5 min. These eruptions, which occur every 40 to 100 min., emanate from a flared fissure ~1.5 by 0.6 m wide that is surrounded by a mound of silica sinter 4 m high and 50 by 70 m wide. The water reservoir is ~22 m below the ground surface. Hot water fills the conduit to within 6 m of the surface before an eruption. Apparently, the hydrostatic pressure of water in the conduit subdues its boiling, but growth and collapse of steam bubbles generates acoustic noise that resonates in the conduit, producing microseismicity that is similar to harmonic tremor. An eruption begins when vigorous boiling at the top of the conduit spills the water over the vent rim. This boiling unloads underlying water and triggers its vaporization. As steam is ejected, deeper levels in the conduit are unloaded in a feedback process until the conduit is emptied and recharge begins again.
Siliceous Sinter Deposits
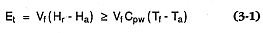
Deposits of siliceous sinter are common to many high-temperature hydrothermal areas. The mound-like or terraced deposits are associated with boiling hot springs and serve as excellent indicators of the presence of hydrothermal reservoirs with temperatures of >175°C (Fournier and Rowe, 1966). To form siliceous sinter deposits, fluids from alkaline hot springs must have enough silica in solution to become saturated with amorphous silica as they cool from 100 to 50°C. Rimstadt and Cole (1983) described three steps in the formation of siliceous sinter:
(1) quartz-saturated hydrothermal fluids in the reservoir rise to the surface where they cool and become supersaturated with amorphous silica;
(2) amorphous silica particles nucleate to produce a colloidal suspension; and
(3) amorphous silica particles are agglomerated and cemented as amorphous silica precipitates between particles, as is illustrated in Fig. 3.1.
White et al . (1964), in a classic study of the Steamboat Springs thermal area, Nevada, devised the classification of sinters summarized in the next two sections.
Single-Stage or Primary Sinters
Thin-bedded opaline sinters are thought to have been formed by primary deposition of silica on broad discharge aprons (Fig. 3.2). The fluids have a high content of dissolved silica, were discharged at near-boiling temperatures, and evaporated quickly.
Geyserite or banded opaline sinters , most abundant on sinter cones, are deposited either by geysers or by vigorously spouting springs. Water with a high silica content at or above boiling temperatures is ejected; it cools and evaporates quickly, precipitating silica at the moment the water reaches the ground surface. These deposits are characterized by fine banding and a botryoidal or "knobby"
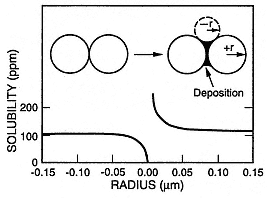
Fig. 3.1
Amorphous silica solubility at 25°C as a function of the radius (r) of the particles.
For particles with a positive radius of <0.05 µm, the solubility is noticeably greater
than the bulk solubility. If the negative radius of curvature in the embayment be-
tween two particles is <0.05 µm, the silica solubility is less than the bulk solubility
and the rate of silica precipitation will be accelerated—cementing them together.
(Adapted from Rimstadt and Cole, 1983.)
habit. White et al . (1964) noted that this sinter type is particularly useful in geothermal exploration because it is always deposited close to former spring vents and fissures.
Bedded opaline sinter with plant casts that lie parallel to bedding indicate that the plants were dead when incorporated into the sinter. In some situations, the casts are perpendicular to the bedding planes, implying that there was cooler water in the pools and plants continued to grow during silica deposition.
Cellular opaline sinter is deposited on the algae-covered discharge aprons of active hot springs. The rounded or oval cells are formed when gas is released from algae and other organisms. When a spring stops discharging, algal growth dries up and the deposit disintegrates into dust, and therefore cellular opaline sinter is rarely preserved in older deposits. Other types of cellular sinter are associated with filamentous bacteria that survive at temperatures of 70 to 90°C.
Flocculated silica deposits are soft and usually poorly preserved.
Multiple-Stage Sinters
Fragmental sinter , the most common opaline sinter, breaks easily into fragments when deposits dry out and are exposed to weathering and frost action. This fragmental debris may remain in place or be transported by wind and water. If younger, sinter-depositing springs flow over or through these deposits, they may become a cemented sinter breccia.
Opaline sinter is formed when opal is deposited by percolating thermal water. All of the previously described sinter types decrease in porosity after they are buried by younger deposits through this deposition. In some sinters, the process produces massive, glassy opal. On a microscopic scale, the cavities are filled with banded opal, which leaves geopetal structures.
Chalcedonic sinter is the most common within older deposits. During late-stage solution and deposition, chalcedony and quartz are deposited and earlier opal phases are at least partly recrystallized.
Sinter cement is an intermediate stage between clastic sediments and sinter deposits. Because hot springs often occur along rivers, sinter-cemented alluvial gravels are fairly common.
Form and Extent of Siliceous Sinter Deposits
Where hot springs issue from point sources, sinter deposits are cone-like or mounded. If water issues from a line of springs—most likely along a fault trace—nearly flat-lying, terrace-like deposits are formed downslope, becoming thinner with distance from the springs, as is depicted in Fig. 3.3. The terraces are topped by scattered sinter cones or ridges; ridges mark hot spring locations and are commonly associated with open fissures that break the terrace surface. Grey, white, or tan sinters that are bedded to massive and friable to dense and hard make up these terraces. By mapping layered sinters at
Fig. 3.2
Layered and knobby silica sinter terrace at San Ignacio, Honduras, deposited as overlapping low fans
from springs located along a fault. Springs are issuing from fractures developed in the hard, brittle sinter.
Beowawe, Nevada, Rimstadt and Cole (1983) found that each sinter terrace is composed of overlapping delta-shaped deposits and that each delta begins at a spring. These beds are nearly flat (dipping <10°). As each spring becomes choked with sinter, water begins to flow laterally through the sinter terrace to discharge at its flanks. The flank deposits dip more steeply (10 to 20°).
Siliceous sinter deposits range in magnitude from small mounds that cover a few square meters to terraces that comprise many square kilometers; thicknesses range from a few centimeters to tens of meters.
Travertine
Meteoric water, heated either around magma bodies or during deep circulation along faults, reacts with carbonate rocks and liberates CO2 . The hot waters are subsequently cooled as they mix with cooler groundwater and reach chemical equilibrium with the aquifer rocks at ~70°C (Bargar, 1978). If the water reaches the ground surface through fractures, CO2 escapes and the water becomes supersaturated with CaCO3 ; precipitation of the carbonate forms travertine near or above the ground surface. Distinctive mounded travertine deposits form around these springs, which have temperatures ranging from ~30 to 100°C.
Travertine deposits are indicators of geothermal reservoir temperatures that may be too low to generate electricity but may have direct-use applications such as for greenhouses or hot-water heating for nearby communities. Ellis and Mahon (1977) described potential problems with well-scaling that these deposits may also represent.
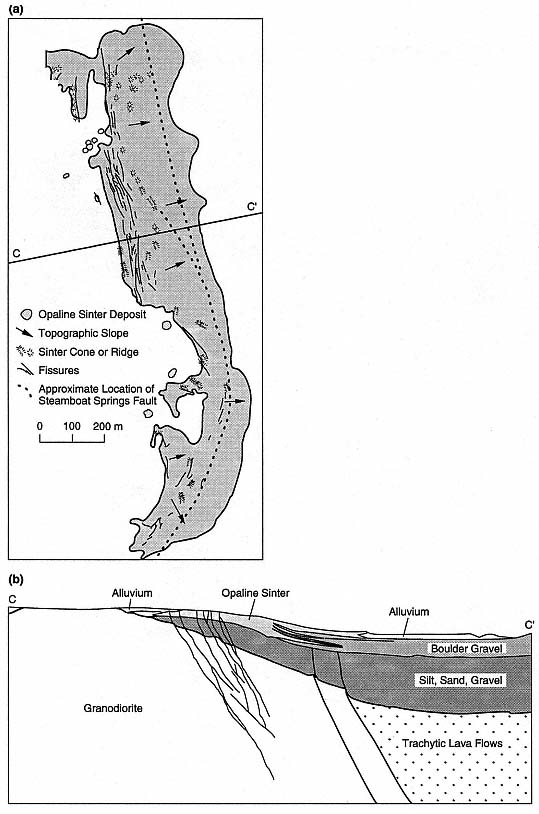
Fig. 3.3
(a) Simplified map of the youngest opaline sinter terraces at Steamboat Springs, Nevada, showing
the relationship between the elongate, narrow terrace complex and the parallel Steamboat Springs
fault (dotted line). (b) Cross-section through Steamboat Springs geothermal area.
(Adapted from White et al ., 1964.)
Although the hydrothermal reservoir immediately below travertine deposits might not have impressive temperatures, it could point toward a much hotter reservoir nearby. For example, Goff and Shevenell (1987) found that waters of the carbonate-depositing springs at Soda Dam, New Mexico, originate as outflow from a hotter intracaldera hydrothermal system located 10 to 12 km northeast of the dam. The outflow plume is diluted by groundwater, and therefore cooled, before it surfaces at Soda Dam.
Travertine ranges from a dense, banded rock, in which the banding is parallel to the fissure/spring orifice, to a porous, layered carbonate that dips away from the orifice. These outward-dipping layers may decrease in thickness with distance: from banded layers several meters thick near the spring orifice to laminae less than a millimeter thick hundreds of meters downslope from the spring. On close examination, travertines consist of mostly fine-grained (2- to 20-µm) sparry calcite, but they may also contain micrite (muddy calcite), chert, and clays. Ooids are common. These deposits vary from white to dirty gray but can also have a yellowish or reddish hue as a result of limonite or hematite staining. Travertine deposits sometimes preserve records of other geologic events in forms such as interbeds of clastic sediment or volcanic ash.
Most travertine structures fall into one of the three categories described here.
· Hot-spring cones or towers are formed through deposition by a spring flowing from a single point;
· Fissure ridges are elongate deposits that occur along springs that issue from faults or joints (as shown in Fig. 3.4). These ridges can cross drainages and act as dams behind which flat travertine terraces may be deposited (Bargar, 1978).
· Terraces build up through the accumulation of travertine and clastic sediment behind fissure ridges or as "terracettes" where hot springs flow down steep slopes.
The size and thickness of travertine structures will depend on the length of the spring orifice, flow volume, rate of deposition, and time that the spring has been active. These deposits range from thin coatings to fissure ridges nearly 100 m thick; fissure ridges can be as much as several kilometers long.
Travertine deposition is a geologically fast process. Allen and Day (1935) found that the travertines of Mammoth Hot Springs at Yellowstone Park are deposited at an average rate of 21 cm/yr. When Goff and Shevenall (1987) used uranium-thorium disequilibrium age determinations to interpret the history of the travertine deposit of Soda Dam, New Mexico, they found that the depositional rate has been variable over the last 1 Ma; most of the deposition occurred during three pulses of increased hydrothermal activity in the nearby Valles caldera.
Older Spring Deposits
Useful information about the history of the geothermal system is provided by the extent of these deposits, the relationship of older sinter and travertine deposits to faults or fissures, and the relationship between these deposits and presently active deposits. In fact, the relationship of old spring and fumarole deposits to new ones at Steamboat Springs, Nevada, has provided much of the background for our understanding of the evolution of hydrothermal systems (White, 1968).
Hydrothermal (Phreatic) Craters and Deposits
Steam eruptions that involve little or no juvenile tephra are termed hydrothermal eruptions (Muffler et al ., 1971), phreatic eruptions , or mud volcanoes (White, 1955); they are characteristic of the periodic behavior of many fumarolic areas. These eruptions form small craters, usually less than several hundred meters in diameter, which are
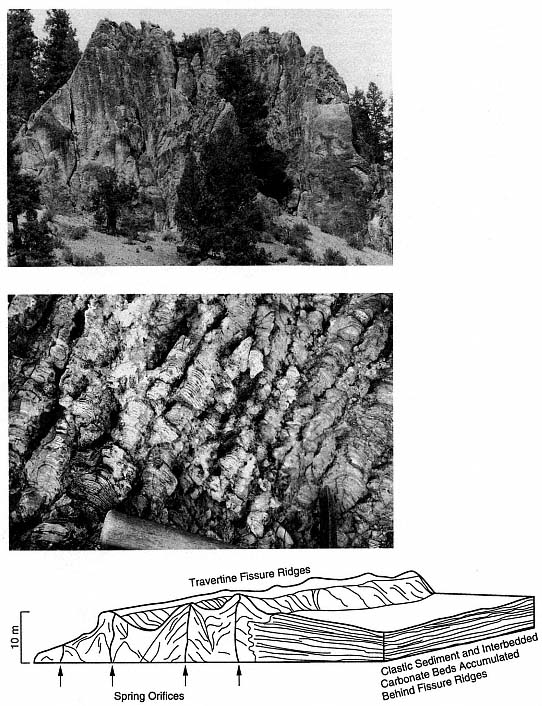
Fig. 3.4
(a) End-on view of 20- to 25-m-high travertine fissure ridge at Monon Hill, Creede caldera, Colorado.
The Creede travertine deposits are located along faults that intersect caldera margins and along
fractures located at the base of a resurgent dome. (b) Algal mounds in a travertine fissure ridge,
Creede caldera, Colorado. (c) Diagram of a travertine fissure ridge, showing the relationship
between springs that rose along faults and fractures and the layered travertine deposited there.
Where the travertine fissure ridge dammed a drainage, carbonate beds extend out as thin
wedges from the fissure ridge and are interbedded with clastic sediments.
surrounded by breccia, surge, and fallout deposits composed of lithic debris.
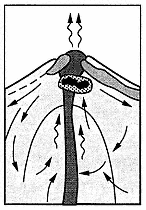
Hydrothermal eruptions occur in areas where the vapor pressure of geothermal fluids exceeds the hydrostatic boiling pressure for a given temperature. These eruptions take place at a point where the convective rise of geothermal fluids is impeded by a relatively impermeable layer termed caprock (Facca and Tonani, 1967). Caprocks are commonly formed when rock permeability is sealed by the precipitation of solids from geothermal fluids. Where a hydrothermal reservoir has a significant vapor-dominated region, additional over-pressure might be transmitted from the deep, cold-water hydrostatic head (Nelson and Giles, 1985). The vapor pressure of a geothermal fluid receives significant partial contributions from CO2 and H2 S, as well as H2 O. Because the former two gases have lower sublimation temperatures than water does, they can increase the vapor pressure by up to several tens of bars more than that of pure water for any given temperature (Kieffer, 1982; Nelson and Giles, 1985). When expansion of the overpressured fluid is initiated by a trigger such as the chemical breakdown and failure of the caprock or seismic or hydraulic fracturing, the eruption proceeds as a vaporization wave propagates down through the fluid and accelerates the vapor and fluid out through the conduit in a manner similar to that proposed for geyser eruptions (Kieffer, 1982; 1984a; 1989).
Two examples of hydrothermal eruption models, developed by Hedenquist and Henley (1985), are illustrated in Fig. 3.5. The first model is for a shallow hydrothermal reservoir with a temperature of 195°C and a depth of 200 m. The second is for a reservoir with a temperature of 230°C and a depth of 400 m. In both models, a sealed caprock has developed at 100-m depth through deposition of silica—and possibly carbonate where lower temperatures have allowed exsolution of CO2 . Because the overlying rock is sealed, fluid flow may be diverted at some greater depth and may follow another pathway to the surface. As vapor continues to accumulate below the sealed rock, the liquid water surface falls, and vapor pressure from the greater reservoir depths is transmitted to the seal (especially if significant noncondensible vapors are present).
In the case of eruption from the shallow hydrothermal reservoir, the transmitted vapor pressure is just above the lithostatic pressure. When the eruption occurs, hydrodynamic flow through the fracture conduit becomes hydrodynamically choked [u = usonic , as in Eq. (2-5)], and a pressure-balanced eruption occurs. Kieffer (1977) found that water-steam systems have greatly reduced sound speeds, ranging from 1 m to several hundred meters per second. In such an eruption, ejecta will follow ballistic trajectories to form fallout deposits.
For eruption from the deep hydrothermal reservoir, vapor pressure transmitted to the caprock can greatly exceed that required to lift the overburden. Overpressure builds because of the strength of the caprock. When the caprock fails, choked flow in the conduit is at a pressure above the lithostatic pressure and vent erosion occurs. The eruption is overpressured and supersonic at the surface; this circumstance produces blast conditions that form a crater and pyroclastic surges dominate ejecta dispersal.
In both shallow and deep reservoirs—but especially in shallow ones—a triggering mechanism is required to initiate caprock failure. The gradual breakdown of caprock strength through rate-limited chemical dissolution, sudden jarring by a seismic event, rapid heating by magma intrusion, the sudden influx of noncondensible gas, or unloading of overlying material through an avalanche or draining of a lake might trigger failure. An additional mechanism, hydraulic fracturing (discussed in Chapter 2), contributes to the failure of caprocks (Norton, 1984).
Hydrothermal eruption phenomena are strong indicators of active hydrothermal reservoirs. Phreatic craters and their deposits range from pits 1 m across to lake-filled depressions up to 1 km in diameter, as is seen in the example of the Eastern Kawerau Geothermal Field in New Zealand (Fig. 3.6). Ejecta deposits from these eruptions can extend >1 km from the crater center. Studies of lithic clasts within phreatic explosion breccias indicate that the foci for hydrothermal eruptions occur at many depths and have been observed as deep as 350 m (Bixley and Browne, 1988).
Most phreatic breccia deposits are massive, but they may also be bedded and may include graded bedding and pyroclastic surge dunes—features that are indicative of multiple steam blasts (Table 3.1). The massive deposits consist of poorly sorted angular tephra from sub-millimeter size to blocks several meters in diameter in a muddy matrix (Fig. 3.7). Nearly all the lapilli and blocks are hydrothermally altered and/or silicified; the glass has been altered to clay or hydrothermal quartz, and lithic and crystal components are replaced by clays, pyrite, chlorite, and other hydrothermal minerals. Many of the lithic clasts retain their relict textures and may contain several generations of fractures, filled with hydrothermal minerals, that formed in-situ during earlier hydrothermal
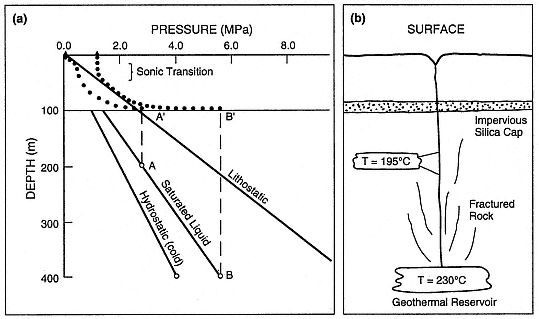
Fig. 3.5
Models of hydrothermal eruptions, showing (a) pressure vs depth and (b) a schematic cross section.
Pressure variations with depth of rock overburden (lithostatic), cold, vapor-unsaturated water
(hydrostatic), and hot, vaporsaturated water (saturated liquid) are indicated. The saturated liquid
curve depicts the effect of vapor pressure transmitted from a hot, underlying reservoir. For the
first model, involving a shallow reservoir at a temperature of 195°C, the pressurization history is
shown by a dashed line (A—A'). A gradual buildup of vapor pressure under the silica-cemented
cap continues until its failure, at which time steam erupts through a conduit with choked flow
and emerges at the surface at atmospheric pressure (dotted line). For the second model (B—B'),
which involves a deep reservoir, the transmitted vapor pressure greatly exceeds the lithostatic
overburden at the silicified cap. Ensuing eruptions are greatly overpressured as they emerge
from the vent conduit (dotted line), so that vent erosion promotes
the entrainment of lithic ejecta in expanding fluids.
explosions (Nairn and Solia, 1980). Bedding-plane sags are common; they resulted when blocks ejected during steam blasts impacted the muddy, fine-grained beds deposited earlier.
An analysis of the volume and variety of lithic clasts within a phreatic breccia provides a rough indication of both the stratigraphy under a geothermal area and the reservoir depth. One example of phreatic breccia, described by Espanola (1974), is from a minor hydrothermal eruption in early July 1966 within the Tikitere and Taheke hydrothermal fields of New Zealand:
"The eruption debris reached a maximum thickness of 0.3 m and consisted mainly of finely comminuted mudstone and sandstone with occasional large blocks up to 0.3 m diameter. The remaining debris was mostly pumice breccia and some rhyolite fragments from the Rotoiti Breccia Formation. The debris was found to have flattened the nearby surrounding scrub and damaged the tourist tracks. The old path, which partly encircled the amphitheater containing spring 6, was rendered impassable due to gravity slumping of the amphitheater banks towards the spring. The absence of Mamaku Ignimbrite in the ejecta indicates that the source of the eruption lay within the Rotoiti Breccia, i.e. within 90 m from the surface."
Phreatic craters and their deposits are undisputed indicators of the presence of a high-temperature hydrothermal system and therefore are excellent prospecting tools. If there is a sequence of phreatic breccia deposits, dating each deposit may provide information on thermal pulses that occurred during the history of the geothermal field. Because phreatic eruptions can be initiated accidentally by drilling or failure of a casing in a geothermal well (Bixley and Browne, 1988), these events must be considered potential hazards during the drilling and production processes.
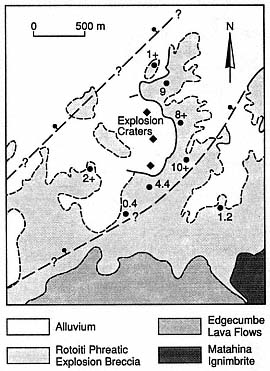
Fig. 3.6
Simplified geological map of the eastern Kawerau
Geothermal Field, New Zealand, showing the
location of phreatic explosion craters, the
Rotoiti phreatic explosion breccia, and normal
faults that traverse the area
(bar and ball on downthrown side).
Thicknesses are shown in meters.
(Adapted from Nairn and Solia, 1980.)
Hydrothermal Alteration
Hydrothermal alteration is a general term embracing the mineralogical, textural, and chemical response of rocks to a changing thermal and chemical environment in the presence of hot water, steam, or gas (Henley and Ellis, 1983). By mapping alteration mineral assemblages at the surface (but more commonly within drillholes), it is possible to locate the zones with highest temperatures, pressures, or permeabilities—all of which are important in geothermal exploration. The same techniques are used to map fossil hydrothermal systems associated with epithermal ore bodies. Epithermal is a
| ||||||||||||||||||||||||
mining term that refers to a hydrothermal mineral deposit (fossil hydrothermal system) formed within 1 km of the Earth's surface in the temperature range of 50 to 200°C (Park and MacDiarmid, 1970).
Figure 3.8 shows the cycle of solution for rocks during water/rock interaction and the deposition of hydrothermal minerals in pore space, both of which greatly affect the physical properties of reservoir rocks and make up the hydrothermal cycle (Elders, 1981). Leaching and fracturing reduce the bulk density and increase porosity and permeability, whereas the deposition of hydrothermal minerals increases the bulk density and decreases porosity.
Characterization and Interpretation
The two basic types of alteration associated with volcanic geothermal systems, acid-sulfate and adularia-sericite are modeled in Fig. 3.9. Acid-sulfate alteration occurs within the uppermost parts of a volcano or along caldera ring fractures where there is abundant, cool groundwater; acid-sulfate water is formed where the groundwater mixes with rising magmatic gases. Adularia-sericite alteration occurs within a flow regime high above or adjacent to a deep heat source and is characterized by neutral pH and alkalichloride waters (Heald et al ., 1987). Alteration rank , used as an empirical indication of temperature and permeability within a volcanic field, is determined through studies of secondary minerals; for example, epidote is an indicator of high temperature and adularia is characteristic of high temperature and high permeability within a hydrothermal system (Browne, 1977).
Many terms used to describe alteration assemblages have evolved in the literature of both geothermal and ore-deposit exploration. Heald et al . (1987) evaluated and correlated these terms and their uses in the two fields to generate the material presented in Table 3.2.
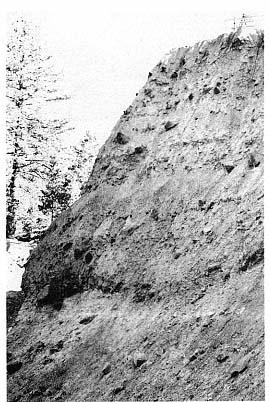
Fig. 3.7
Phreatic explosion breccia on the east wall of
South Crater, Inyo Craters, California. South
Crater is a 100-m-diameter phreatic (and
possibly partly phreatomagmatic) crater that
overlies both rhyolitic and basaltic dikes.
Deposits here are 25 m thick and consist of a
poorly bedded, cross-bedded lithic ash that
contains blocks up to 0.5 m in diameter (lower
half of the deposit) and massive, block-
bearing coarse ash (upper half of the deposit).
Browne (1977) described 51 hydrothermal minerals found in active geothermal systems; some of these minerals also occur in low-grade metamorphic rocks. The water/rock interactions in the system result in alteration of, first, volcanic glass and then a sequence of mineral phases—replacing them, leaching them, or depositing new minerals in available pore space (Browne, 1982). Typical alteration replacement products are listed in Table 3.3. The mineral assemblage depends on temperature, pressure, fluid composition, and permeability,
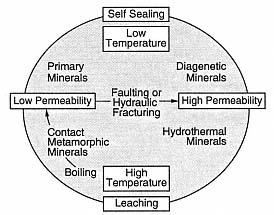
Fig. 3.8
The hydrothermal cycle. This diagram
demonstrates the interplay of water/rock
interaction, deposition of hydrothermal
minerals, and fracturing in a constantly
evolving hydrothermal reservoir.
(Adapted from Elders, 1981.)
and the sequence of mineral alteration and replacement varies from system to system, as is shown in Table 3.4 for several hydrothermal systems.
There is a general relationship between temperature and mineralogy for aluminosilicate alteration minerals (see Fig. 2.47), and mineral suites can be used to interpret temperatures within a geothermal system (Fig. 3.10; Henley and Ellis, 1983). For example, the minerals epidote and wairakite do not appear until 200°C.
During his examination of the geothermal field at Broadlands, New Zealand, Browne (1970) determined that many hydrothermal minerals are of little use in estimating subsurface temperatures and permeability; among these are chlorite, pyrite, calcite, and quartz, which are stable over a wide temperature range. Calcite is strongly affected by underground CO2 pressure. Mordenite, siderite, and cristobalite, which form at low temperatures, and epidote, which forms at high temperatures, are not greatly affected by permeability. Clays, which are excellent indicators of temperature, are not good
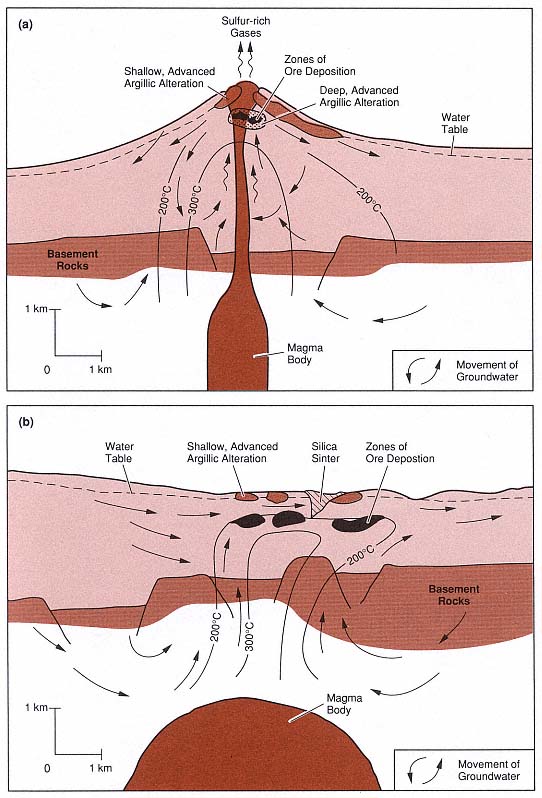
Fig. 3.9
Models of two types of fossil hydrothermal systems that are responsible for epithermal ore deposits.
(a) In the system characterized by acid-sulfate alteration, wiggly arrows represent rising sulfur-rich
magmatic gases; these gases condense and oxidize to form the acid fluids responsible for leaching
and argillic alteration of rocks within the volcano and at the surface. (b) In the system characterized
by adularia-sericite alteration, alkali-chloride waters have a neutral pH.
(Adapted from Henley and Ellis, 1983, and Heald et al ., 1987.)
| ||||||||||||||||||||||||||||||||||||||||||||||||||||
| ||||||||||||||||
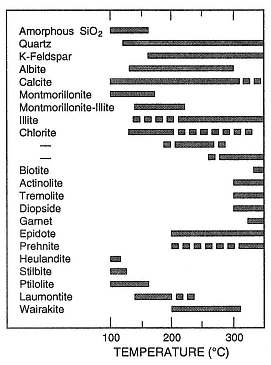
Fig. 3.10
Summary of temperature ranges for common
aluminosilicate minerals. Solid lines indicate the
most common temperature ranges for these
occurrences. The three ranges shown for chlorite
are related to the transition, with rising
temperature, from swelling chlorite through
mixed swelling and nonswelling
chlorite to nonswelling chlorite.
(Adapted from Henley and Ellis, 1983.)
| ||||||||||||||||||||||||||||||||||||||||||||||||||
guides to permeability. Browne (1970) found that the most important minerals in hydrothermal surveys are the feldspars, which are sensitive to temperature and permeability. Andesine (the most common feldspar at Broadlands) is altered at temperatures between 70 and 290°C, depending on permeability, to quartz, clay, calcite, albite, or adularia. Albite replaces andesine above 230°C. Adularia may replace andesine completely or may be mixed with albite. Good production zones contain abundant secondary quartz, adularia, and calcite (Table 3.5). At Broadlands, there is a correlation between high steam and water production and the presence of adularia as the dominant feldspar in the reservoir rocks. Browne and Ellis (1970) noted that pyrrhotite occurs above 180°C but is limited to impermeable zones.
In near-surface steam-heated zones of acidsulfate geothermal systems, underground boiling adds dissolved magmatic gases to the steam phase, and oxidation creates an acid condensate above the boiling zone (Henley and Ellis, 1983). The mineral assemblages that are characteristic of acid alteration include kaolinite, alunite, gypsum, opal, and hydrated iron oxides (Steiner, 1977); this assemblage is referred to as advanced argillic alteration.
Temperatures decrease and pH increases outward from the central portion of an acid hydrothermal system, producing a systematic variation in stable mineral assemblages that can be mapped horizontally—or vertically if there are coreholes. These trends are shown in Table 3.6 (Hayashi (1973) and in Fig. 3.11 (Heald et al ., 1987).
Mapping Alteration Mineralogy
The Geological Survey of Japan considers mapping hydrothermal alteration zones an extremely important element in geothermal exploration. Although springs and fumaroles are the most obvious surface manifestations of the hydrothermal system,
| |||||||||||||||||||||||||||||||||||||||||||||
alteration zones supply additional information that points out the areas of greatest temperature and permeability. Alteration zones can also guide exploration geologists to hidden systems or to ancient spring activity. The mapping process involves systematic sampling across the study area and analysis of mineral phases by x-ray diffraction and petrography. Study areas can range from a general map of altered areas over hundreds of square kilometers—which will often show the relationship of hydrothermal systems to large features such as calderas—to small areas of less than 1 km—where detailed variations in alteration can be documented.
An example of this type of exploration technique is the eastern Hachimantai Geothermal Area, Honshu, where there are many geothermal areas scattered throughout an 800-km2 volcanic field (Geological Survey of Japan, 1986; Nakamura et al ., 1981). Within the field, Nakamura et al ., have established three alteration subzones.
· Silicic subzones are characterized by porous, white or brown siliceous rocks that contain small amounts of alunite and sulphur. These subzones are usually found in the center of the system and can be evidence of strong hydrothermal activity in the past.
· Silicification subzones consist of hard, white, silicified rocks within a band around the silicic zone. This subzone can occur as blocks 0.5 by 0.7 km or as 10- to 50-m-wide veins. The minerals include saponite, chlorite, hydromica, mixed-layer clays, sericite-montmorillonite, alunite, anhydrite, gypsum, calcite, rutile, diaspore, and andalusite.
| ||||||||||||||||||||||||||||||||||||||||||||||||||||||||||||||||||||||||||||||||
· Argillization subzones are the outer-most zones of alteration; they consist of blue-black clays (the color is mostly related to finely disseminated pyrite). The dominant minerals are montmorillonite, kaolin, and alunite, in order of distance from the outer edge of the zone.
In addition to these alteration zones, a pyrophyllite zone, which may overlap the argillized rocks, has formed at higher temperatures and may be an indicator of higher permeabilities. Pyrophyllite is most likely formed within the system if temperatures are >300°C and if the geothermal fluids are acidic at depths of ~1 km.
Figures 3.12a and 3.12b show the distribution of alteration zones, which are identified by the dominant mineral phase, as well as the distribution of fluorine concentrations (another exploration tool). The schematic cross-section of B—B' in Fig. 3.12c was based on wells that were drilled into the vapor-dominated part of the Matsukawa geothermal field; this illustration shows a relationship between the reservoir and surface pyrophyllitic to kaolinitic alteration zones. Wells for the Kakkonda (Takinoue) geothermal field penetrated a water-dominated reservoir in a zone where rocks are mostly altered to montmorillonite (on a regional scale) but are locally altered to kaolinite, alunite, or pyrophyllite.
The examples from Nakamura et al . (1981), cited earlier, are sited in intermediate to silicic calc-alkaline rocks. However, different
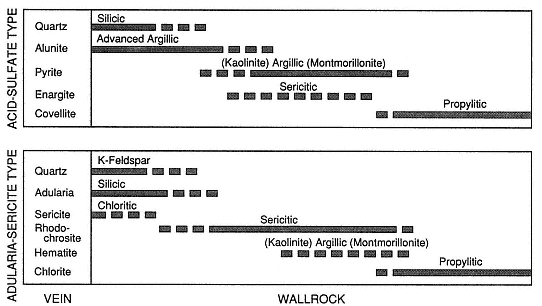
Fig. 3.11
Diagram showing the alteration minerals in vein assemblages and the sequence of wall-rock
alteration for acid-sulfate and adularia-sericite-type deposits that occur in fossil hydrothermal
systems. No scale is given because the widths of alteration zones range from
centimeters to tens of meters outward from the vein.
(Adapted from Heald et al ., 1987.)
mineral zonation occurs in basaltic rocks. For instance, Tómasson and Kristmannsdóttir (1972) described three vertical zones in the Reykjanes geothermal area of Iceland, which are listed here in order of increasing temperature:
(1) a montmorillonite-zeolite-calcite zone,
(2) a mixed-layer clays-prehnite zone, and
(3) a chlorite-epidote zone.
The zones are not always clearly defined as a result of cooling and reheating after the invasion of sea water. Subsurface temperatures at a depth of 1 km exceed 200°C.
The date and length of hydrothermal activity in a geothermal system can be determined through potassium-argon dates for clays (Woldegabriel and Goff, 1989). These data can provide interesting and sometimes crucial information on the longevity (and perhaps future) of hydrothermal activity in an area to be drilled and developed. Woldegabriel and Goff (1989) have shown that hydrothermal systems within the Valles caldera of New Mexico became active soon after caldera collapse at 1 Ma and have been active from that time to the present.
The most desirable targets—permeable zones with hot water and steam—are narrow ones and, in some cases, may make up as little as 5% of the entire geothermal system. The size of this target can vary substantially. Figure 3.13 compares 16 epithermal ore bodies (fossil hydrothermal systems; Heald et al ., 1987) and 25 geothermal fields (Rowley, 1982). The areas of geothermal fields, from 0.15 to >100 km2 , are very similar to the areas of epithermal deposits, which range from 1 to >120 km2 . The projected surface areas of production zones within the 16 geothermal fields range from <0.5 to 60 km2 , which is 5 to 15% of the total area defined by hydrothermal activity, rock alteration, and elevated geothermal gradients. These areas
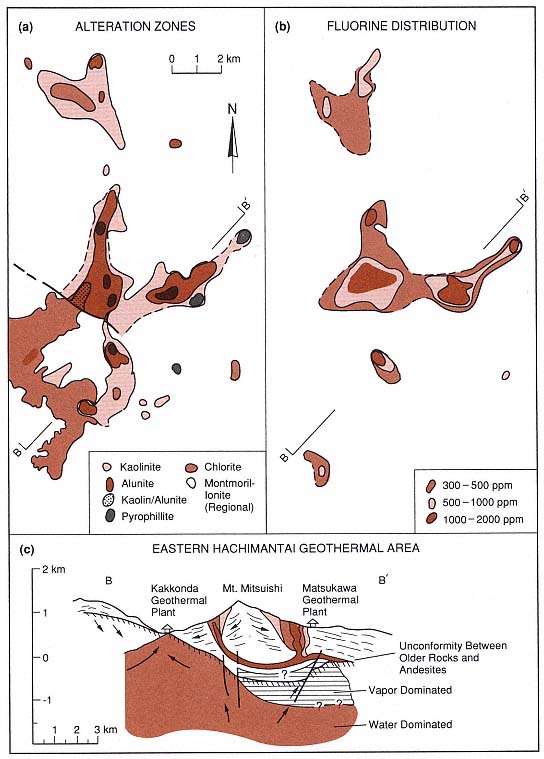
Fig. 3.12
Maps of alteration zones from the eastern Hachimantai geothermal area in Japan. (a) Map of
alteration zones indicates the predominant marker minerals. (b) Distribution of fluorine in
hydrothermally altered rocks. (c) Schematic cross-section of
the eastern Hachimantai geothermal area.
(Adapted from Geological Survey of Japan, 1986.)
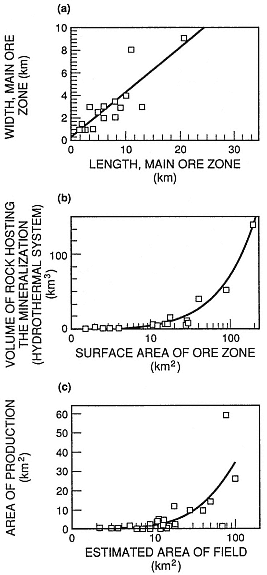
Fig. 3.13
Dimensions and volumes of hydrothermal systems
are used to compare ore zones (fossil hydrothermal
systems) and developed hydrothermal reservoirs.
These graphs provide a general idea of the range
of areas and volumes for hydrothermal reservoirs.
(a) Length and width of ore zones. (b) Surface areas
of ore zones and volumes of fossil hydrothermal
systems. (c) Estimated areas of geothermal fields
and actual areas with production wells.
(Adapted from Heald et al ., 1987,
and Rowley, 1982.)
of production are the permeable pathways for hot fluids at the time of drilling. By analogy, epithermal ore deposits encompass the entire area affected by alteration throughout the history of the hydrothermal system; large ore-bearing veins were the main conduits for geothermal fluids and gases. By studying the analogy between active hydrothermal systems and epithermal ore bodies, it is possible to create three-dimensional models of volcanic geothermal systems. The depth of hydrothermal reservoirs ranges from <1 km to perhaps as much as 4 or 5 km. The depths of some of these reservoirs have not been determined. Mining epithermal ore deposits has provided us with the vertical extent and time-cumulative volume of many such ore deposits; they are from 400 to 1,000 m vertically and have volumes of 1 to 132 km3 (Heald et al ., 1987). The largest geothermal systems and epithermal ore bodies are associated with the Earth's largest volcanoes—calderas—which are discussed in the next chapter.