Chapter Three—
The Status of Biological Diversity in California Today
Concern over the loss of species and their habitats in California is certainly not new. Save-the-Redwoods League was founded in 1918, and numerous other campaigns to protect specific areas or resources have been ongoing for decades. Loss of inland wetlands and the resulting impacts on the waterfowl of the Pacific flyway have been written about since the 1940s. And since the mid-sixties, there have been several calls for a statewide approach to protecting California's biological diversity, rather than concern for only individual pieces of the system. The Destruction of California is but one example of this more comprehensive concern (Dasmann 1966). More recent is the recognition by many citizens that many species and even entire ecosystems are now on the verge of elimination. The gravity of the problem is due to its omnipresence.
In the late 1980s, two significant studies were completed which summarized current understanding of the status of biological diversity in California: Sliding Toward Extinction by Jones and Stokes (1987) and California's Forests and Rangelands by the Department of Forestry and Fire Protection's Forest and Range Resource Assessment Program (FRRAP) (CDF 1988). These excellent documents provided a more complete understanding of California's biodiversity than had previously been available and made evident, through their limitations, where information was lacking.
An ideal assessment of the status of biological diversity in California would include an evaluation of the amount of diversity in the state at
all levels (genes, species, ecosystems, and landscape), a review of the condition or quality of these resources, an examination of the quantities at risk in comparison to the quantities protected, and an investigation of the trends in loss and protection. Although limited by incomplete data, we attempt such an assessment here. Because the health and acreage of habitats are essential to the maintenance of species, we have put primary attention on the status of California's ecosystems, although we also discuss at some length species and genetic diversity.
Genetic Diversity
Understanding genetic diversity expands our awareness of the richness of California's biological resources. Every individual organism contains a distinct collection of genes that help determine thousands of heritable traits such as height, weight, growth rate, flower color, fur color, or drought tolerance. The different individuals of a region together make up a population, which may be genetically different from other populations of the species. Although many heritable traits affect physiological processes we can't see, some genetic differences between populations of a species are quite noticeable. For example, the California poppies found near the coast are yellow-flowered, unlike the more common bright-orange flowers typical of the interior of the state. The genetic differences we can't see, such as drought tolerance, are also variable and uniquely adapted to the local conditions as those we can easily view. Genetic variety really is the spice of life.
Genetic differences make individuals within a population different from each other and make populations within a species distinct. Genetic variation at both the individual and population level has been shown to provide increased survivorship and productivity in many species. But more diversity is not always better. A portion of the genetic variation in a population is due to natural selection for traits that are well suited to the particular environmental conditions the population experiences. Maintaining locally adapted traits is critical to insuring the local population continues to thrive. Actions that indiscriminately add new gene combinations to a well-adapted population will have a detrimental effect, even though the total genetic diversity is increased.
Adaptive genetic diversity helps individuals grow well under the environmental conditions typical of the natural population. Moving in-
dividuals or populations to a new area may result in poor growth because the individuals are not well adapted to the environmental conditions of the new site. Mixing genes, such as by planting seeds from a population living in a moist coastal area with those from a drought tolerant Central Valley population, would increase the genetic diversity of the valley population, but would likely have detrimental effects. Recognizing the importance of local adaptation in forest trees led foresters to identify seed zones—areas of similar elevation and climate. To assure high survivorship and productivity of seedlings, trees replanted after harvest are grown from seeds taken from the same zone.
Patterns of genetic variation are not randomly distributed on the landscape. Many traits that influence survival and growth have been subject to natural selection, and the patterns of genetic variation often reflect environmental gradients. Some genetic variation present in populations and species does not appear to have been caused by past environmental changes or selective pressures. Nonetheless, this variation contributes to the population's ability to respond to future environmental changes or to human disturbances. Genetic diversity enhances the capacity to tolerate and adapt to conditions never before experienced, providing the population with long-term viability. When the degree of local adaptation in a species has not been determined experimentally, most conservation geneticists recommend management actions that maintain the natural patterns of genetic variation.
The maintenance of highly productive agricultural crops, timber species, or commercially important fish species requires wise gene resource management. The importance of gene resource conservation is well recognized in agriculture and is gaining notice in forestry and fisheries management. Similarly, maintaining viable populations of wild species requires attention to maintaining genetic diversity in wild populations.
Evaluating the status of genetic diversity requires answering the questions: what genetic diversity exists in California? what has been lost? what has been protected? and what are the likely future trends? Years of research have provided substantial information on the patterns of genetic variation in many California species. For these species, genetically distinct populations have been identified, and the amount of genetic variation typically found within and between populations is well established. Much is known about particular groups such as coniferous trees, small rodents, salmon and trout, and many species of flowers. Unfortunately, these species represent only a small percentage of the many organisms found in California.
Where data on patterns of genetic variation do exist, there is no single consolidated source of information. Rather the data are in the many papers published by individual investigators, making an evaluation of the status of even a single species difficult. In the early 1980s, the California Gene Resources Program completed statewide assessments and gene resource management plans for several species, including salmonids, Douglas fir, and the strawberry. They found that once the data were assembled for these species, enough information was available to improve significantly the management of genetic resources, even though comprehensive identification of genetically distinct populations had not yet been completed (California Gene Resources Program 1982).
Loss of genetic variation has rarely been documented. Many actions are contributing to the loss of genetic diversity, but with the exception of a few case studies, the magnitudes of the losses are poorly known. Systematic evaluations of loss of genetic diversity have been completed for only a small fraction of the species in the state. However, current patterns of losses of species and populations clearly reduce genetic diversity. Actions that result in the loss of genetic diversity include: loss of genetically significant populations, significant declines in population size, loss of population-level genetic diversity (particularly due to geographically systematic loss of individuals and populations),[1] disrupted patterns of gene exchange between populations through habitat fragmentation, and the neglect of genetics in management practices and conservation planning.
Some of the losses of genetic variation result from the activities that subtly change the genetic composition of wild populations. For example, many salmon species are propagated in hatcheries from eggs taken from wild fish. Hatchery managers catch salmon as they begin returning from the ocean and collect eggs and milt until they have enough to meet the hatchery's annual goal. By choosing the earliest returning fish, the hatchery managers are actively selecting for earlier runs of salmon. Because the timing of returning fish has a genetic basis, the practice of growing numerous hatchery fish from early returning fish and then releasing young hatchery fish back into the streams has changed the timing of the run in some areas to as much as two weeks earlier and shortened the length of the run. In Oregon, early-returning hatchery-raised fish, although advancing the timing of peak spawning, contributed little to the natural fish production of these streams (Nickelson et al. 1986). In many of these management circumstances, simply paying attention
to the genetic consequences of different management practices can significantly improve gene resource conservation. Salmonid gene resource management plans are being pursued actively in the Pacific Northwest (Riggs 1986, 1990a ) and could be implemented in California.
Conservation of genetic diversity can be accomplished through either maintaining genetic diversity in naturally occurring species in their native habitat, or through making collections of samples such as seeds, sperm, pollen, or whole organisms and maintaining these in appropriate storage facilities. Conservation efforts to protect genetic diversity of species by insuring that healthy populations continue to live in their native habitats are referred to as "in-situ" (on-site) conservation. "Exsitu" conservation removes samples off-site and stores them in artificial facilities such as seed storage banks, zoological parks, or botanical gardens.
Genetic conservation efforts are increasing, although to date less effort has been made to conserve genetic diversity of wild species than to conserve species or ecosystem diversity. Both in-situ and ex-situ conservation are receiving increasing national and international attention. For wild plants and animals, in-situ gene conservation is considered preferable as it maintains natural evolutionary processes. In addition, there are many practical problems with attempting ex-situ conservation for more than a small number of species.
The Global Biodiversity Strategy produced by a consortium of international organizations includes conservation of genetic diversity as one of its priority actions (World Resources Institute 1992). Nationally there are both government and private ex-situ conservation efforts including the U.S. National Plant Germplasm System and collaborations between zoological parks and botanical gardens to manage collections of high priority endangered species.
In California, several ex-situ conservation programs exist. In 1985, the state established the University of California Gene Resources Conservation Program to "assess the needs for genetic resource conservation, coordinate the various existing efforts, direct new efforts at preservation and collection, increase public awareness of conservation issues, and stimulate new research on topics of conservation biology" (McGuire and Qualset 1986). One of the emphases of this program is the conservation of the genetic resources of the 250 agricultural crops grown in California, mainly through a research grants program. The U.S. Forest Service (USFS) maintains collections of commercial and noncommercial forest tree species at the Institute of Forest Genetics in Placer-
ville. The San Diego Zoo conducts active research and conservation activities for many species of native and exotic endangered animals. In addition, botanical gardens such as the Rancho Santa Ana gardens in Claremont and the Tilden Regional Parks Botanical Garden in Berkeley have made substantial commitments to propagating and maintaining collections of endangered California native plants. All these different efforts would benefit from greater coordination as well as replication of stored material to assure that the conservation of a species is not dependent upon a single storage facility.
Despite the importance of in-situ conservation, genetic diversity is rarely taken into account in land conservation projects. In the past, little or no attention has been paid to the placement of reserves to include the best site for genetic variation, nor has the size of reserves considered genetic processes. Although many parks and natural areas function as gene resource conservation areas, the past emphasis on protecting high elevation mountainous sites assures a biased sample of genetic diversity; only populations adapted to the high-elevation environments are included (Ledig 1988). With the exception of the desert region, many of our low-elevation parks and preserves are too small to adequately protect the genetic diversity of the included populations. Few assessments have even been attempted to discover if the existing parks and natural areas adequately protect the genetic variation of even the commercial species. In contrast to California, Washington has recently established a system of one hundred gene-pool reserves for Douglas fir, recognizing the importance of maintaining genetic diversity of this commercial species to the future productivity of the timber industry (Wilson 1990).
Management practices can greatly affect genetic diversity. One notable example is the planting of nonnative rainbow trout throughout the streams of the Sierra Nevada. Planted fish interbred with the native subspecies and stocks of golden trout, nearly eliminating the native locally adapted populations of golden trout in areas like the upper Kern River. Timber harvest practices can select for diminished forest productivity by removing the best trees and leaving weaker or less well-dimensioned trees to provide seed for the future.
Some land management practices now consider the consequences for genetic diversity and future productivity, but more commonly genetics are overlooked. Many restoration projects occurring today are prone to the same difficulty. In an attempt to repair or mitigate environmental damage, restoration projects are replanting with native species. If no attention is paid to the genetic source of the seeds or plantings, the
integrity of the gene pool of the surrounding native vegetation may be at risk. Using local sources of plants for restoration will not only increase the likelihood of a successful project, but will also safeguard the existing population (Millar and Libby 1989).
In summary, although several endeavors are working to conserve genetic resources, we cannot quantitatively evaluate the status of genetic diversity in California today. It is well known that genetic resources are found in different levels: the genes themselves, the individuals of a species, and the races or populations that contain genetic attributes not found uniformly throughout the species. Although we know little about the patterns of genetic variation in most wild species, we can use basic principles to help incorporate genetic conservation into conservation and management actions. Genetic conservation efforts now receive less attention than species or ecosystem conservation even though genetic diversity is critical to species' long-term survival, and many activities are daily contributing to the loss of genetic diversity. Several organizations are making progress by increasing California's ex-situ conservation capacity, but these would benefit from coordination. In-situ efforts are still mainly by chance rather than by design. In wildlands, future management and conservation efforts could contribute greatly to maintaining genetic variation, even by the simple initial action of considering the consequences of various management alternatives on the genetic diversity of wild species and their populations.
Species Diversity
The number of species in an area has long been considered indicative of the region's biodiversity. Although species diversity reflects only a portion of the biodiversity of a region, most of us think of particular species as representative of an area, for example, "Redwood Country." Both the particular species present and the diversity of species in a region provide a means of comparing areas.[2] The total number of species gives an indication of the "richness" of an area, whereas the number of endemic species, those species restricted to a single region, indicates how distinctive the flora and fauna of that region are. By all measures, California has unusually high species diversity. California not only has an unusual number of plants and animals, even for so large a state, but a sizable number of California's species are
Tule Elk were nearly extirpated from California in the 1860s due to hunting for tallow, hides, and meat.
This population in Point Reyes National Seashore was reintroduced from the San Luis herd in 1978. (Photo by Charles Kennard)
endemic: that is, they are found nowhere else in the world. This confers both a blessing and an obligation.
California is world renowned for its varied and distinctive flora. Our wildflowers are sought for European gardens and the Monterey pine is a significant timber tree in Australia and other countries. There are an estimated 7,850 vascular[3] plant species in California (Hickman 1989).[4] In comparison, Texas, the next most species-rich state, has 5,500 species and Arizona has approximately 3,400 species, yet even they are considered species-rich states (Smith 1987) (table 3.1).
These numbers are estimates because the exact number of vascular plant species present in California is not known; researchers agree there are still many additional species awaiting discovery. When the last complete guide to the flora of California was published (Munz and Keck 1968), 6,633 native plants and 1,013 introduced plants were known to occur in the state (Howell 1972).[5] In the twenty years that followed, over two hundred new native plant species were discovered and described in California (Shevock and Taylor 1987).
| |||||||||||||||||||||||||||||||||||||||||||||||||||||||||||||||||||||||||||||
California also harbors the largest number of endemic plant species of any state except Hawaii. Over 1,600 full species of California native plants are found nowhere else in the world, and many of the subspecies are also endemic (Raven and Axelrod 1978, Shevock and Taylor 1987). Nearly half (48 percent) the species found west of the California deserts are endemic. This high endemism, which is very unusual for a continental area, is due in part to the Sierras, which create a wall barring migration and encouraging the evolution of new species. When the flora of the entire state is viewed, one-third (32 percent) of California's native plants are found nowhere else in the world (Raven and Axelrod 1978).
California's unusual plant species diversity results from the many factors that increase habitat complexity; these factors work in concert to create many different niches for plants. Mediterranean climates, with cool, wet winters and hot, dry summers, are found in only five parts of the world: California, Chile, southwestern South Africa, the Mediterranean, and western Australia. All five areas are noted for their diverse and unusual floras (Stebbins 1978). California's climate has more extremes than most of these areas (58 inches of rain annually in Happy Camp, Siskiyou County and 3 inches of rain annually in Blythe, Riverside County (Hornbeck 1983)). Complex geology has created varied topography with several distinct mountain ranges, major valleys, local features such as springs, and unusual substrates such as serpentine and limestone. In conjunction with the varied climate, these geological fea-
tures present a complex array of plant habitats. In some groups, genetic diversity and a diversity of habitats have led to the evolution of many new species within a single genus. In addition, California has a rich and varied climatological history, so that some of our species are relicts of past, cooler climates (Axelrod 1977). All these contribute to the evolution of a flora that is extremely diverse.
California is also home to one-quarter of the 2,300 vertebrates found in the United States (The Nature Conservancy 1989). The array of plant life, topography, and climate provide a diverse landscape for California's 833 different full species of furred, feathered, finned, and scaled native wildlife[6] (Moyle et al. 1989, Laudenslayer et al. 1991). Although 583 bird species have been sighted in California (Laudenslayer et al. 1991), 454 birds regularly occur in California, and 285 regularly breed in the state, (Bailey 1992). Only one full species of birds is endemic to California, the yellow-billed magpie, although in recent times, the California condor has also been restricted to California. Many subspecies of birds are restricted to the state. These endemic subspecies of birds are particularly common in oak woodlands and chaparral. Miller speculates that the plants and birds were "closely associated in their evolution" dating back to the Pleistocene (Miller 1951). Unlike California's flora, which has assimilated an enormous number of nonnative species, the avifauna includes relatively few permanent introductions. Only eight introduced birds have well-established breeding populations (DeSante and Pyle 1986), although 7 other species including several parrots are common escapees and may become established in southern California (Laudenslayer et al. 1991). Two of these introduced species, the European house sparrow and the starling, are found virtually throughout California.
Bears, deer, bobcats, coyotes, and squirrels are but a few of the 214 different mammals in California. In addition to terrestrial mammals, 37 species of whales, dolphins, porpoises and seals are included on this list. Only 19 mammals are found only in California (Jones and Stokes 1987), whereas 21 species of mammals, including burros, feral pigs, and Norway rats are introduced species (Laudenslayer et al. 1991). Many subspecies of mammals have been identified in the state, and endemic subspecies are particularly common among the small mammals of California.
The proportion of endemic and introduced species varies among the vertebrates. Of the 136 species of turtles, frogs, salamanders, lizards, and other reptiles and amphibians found in California, 17 are endemic and 8 are not native (Jennings 1987). In marked contrast, 40 percent
of the 66 full species of native freshwater fish are found only in California and 47 non-native species including carp, mosquito fish, and striped bass have been introduced (Moyle et al. 1989, Moyle 1992).
Insects and other invertebrates comprise the largest group of organisms in California. Butterflies are the best known of the insects, but among the estimated 28,000 California insect species (Powell and Hogue 1979), there are also bees, flies, beetles, grasshoppers, crickets, aphids, dragonflies, ants, and others. Neither the numbers of endemic insects nor an estimate of how many insects have been introduced to the state is available. Sailer (1978) estimates that 1.3 percent of the insect fauna of the United States are introduced. California may have a higher percent of introductions, as the state appears to be fairly vulnerable to the successful establishment of new species (Mooney et al. 1986). Some non-native insect species have been introduced to the state with little consequence, whereas tremendous efforts are waged to assure that some introduced agricultural pests, like the Mediterranean fruit fly, or forest pests, like the gypsy moth, do not become permanent residents.
There are many other types of invertebrates in addition to insects that contribute to California's diversity and to the healthy functioning of natural ecosystems. There are few estimates of how many of these less well-known but quite important organisms are found in the state. A recent study of the H. J. Andrews Experimental Forest in Oregon found 3,402 species of insects and other arthropods just on that one site (Parsons et al. 1991). The invertebrates in California include arachnids (spiders and their allies), crustaceans (such as crabs, crayfish, and shrimp), and molluscs (for example abalone, oysters, and snails). There is also a tremendously diverse group of worms and nematodes, which are crucial to maintaining ecosystem functions such as soil fertility. Anyone who has seen a tidepool realizes that intertidal regions contain a remarkable array of invertebrates. The crustaceans and molluscs are essential links in aquatic food webs in freshwater, estuarine, and marine systems.
In addition, many organisms that seem obscure to all but professional biologists in fact add significantly to the biodiversity of California and the health and well-being of the state's ecosystems. The many exotic wild mushrooms found in specialty food stores give only a glimpse of these riches. Plankton, diatoms, and other one-celled organisms make up the base of aquatic food webs, and perhaps 1,000–1,200 species of lichens, 4,000–5,000 kinds of gilled fungi, 300–400 types of slime
molds, and 660 species of mosses and liverworts contribute to the functioning of California's ecosystems (Jones and Stokes 1987).
What Has Been Lost? Trends in Species Endangerment
Although the California condor is probably the most famous California species in danger of extinction, it is not the first. We have ample evidence that the native species diversity of the state is declining. In fact, seventy plants and animals are known to have been lost from California. The grizzly bear, the gray wolf, the Tecopa pupfish, and the Santa Barbara song sparrow are four of the thirty-eight animals that have been eliminated (Jones and Stokes 1987, Steinhart 1990) (table 3.2). Although eight of these animals, like the wolf and the jaguar, are still found outside California, twenty-one animals are extinct. In addition, several species of birds used to breed regularly in California and now no longer breed in the state, though they are still regular visitors. Thirty-four plant species and subspecies (table 3.3), including the single-flowered mariposa lily and the Point Reyes Indian paintbrush, are presumed extinct in California (Smith and Berg 1988, Bittman 1992).
Extinction is only one measure of lost species diversity. When a single population is lost some biological diversity is lost, because each population contains a unique collection of genetic traits. In the long term, loss of these heritable traits may reduce the species' ability to respond to environmental changes. In the short term, the loss of any one population does not usually result in extinction, although it does bring that species closer to the edge. Too often we pay attention only when the last population is threatened or endangered, ignoring the first populations lost. Attention to the last populations sometimes produces good news; for example, five plants believed extinct have been rediscovered since 1988.[7] However, the news isn't always positive. An additional six to ten plants have not been found in the past thirty years, despite field searches by botanists. They may join our list of extinct plants.
To understand the current status of species diversity, we need to know not only which species have already been lost, but also how many are at risk today. Species are at risk when they become very rare, through either loss of populations or loss of individuals. Evaluating the numbers of species at risk, therefore, requires detailed information on the rarity
Table 3.2. Animals Extinct or Extirpated from California |
Extinct Animal Species and Subspecies |
Long-eared kit fox Vulpes macrotis macrotis |
San Clemente Bewick's wren Thryomanes bewickii leucophrys |
Santa Barbara song sparrow Melospiza melodia graminea |
Tecopa pupfish Cyprinodon nevadensis calidae |
Clear Lake splittail Pogonichthys ciscoides |
Thick-tail chub Gila crassicauda |
Pasadena freshwater shrimp Syncaris pasadenae |
Sooty crayfish Pacifasticus nigrescens |
Antioch shield-back katydid Neduba extincta |
Oblivious tiger beetle Cicindela latesignata obliviosa |
San Joaquin Valley tiger beetle Cicindela tranquebarica spp. |
Mono Lake hygrotus diving beetle Hygrotus artus |
Strohbeen's parnassian butterfly Parnassius clodius strohbeeni |
Sthenele satyr butterfly Cercyonis sthenele sthenele |
Atossa fritillary butterfly Speyeria adiaste atossa |
Xerces blue butterfly Glaucopsyche xerces |
El Segundo flower-loving fly Raphiomydas terminatus terminatus |
Valley flower-loving fly Raphiomydas trochilus |
Antioch robber fly Cophura hurdi |
Antioch specid wasp Philanthus nasalis |
Yellow-banded andrenid bee Perdita hirticeps luteocincta |
Species Extirpated or No Longer Breeding in California, but Surviving Elsewhere |
Gray wolf Canis lupus |
Grizzly bear Ursus arctos |
Mexican jaguar Felis onca |
White-tailed deer Odocoileus virginianus |
Bison Bison bison |
Common loon Gavia immer |
Barrow's goldeneye Bucephala islandica |
Harlequin duck Histrionicus histrionicus |
Harris' hawk Parabuteo unicinctus |
Sharp-tailed grouse Tympanuchus phasianellus |
Yellow rail Coturnicops noveboracensis |
Sonoran mud turtle Kinosternon sonoriense |
Bull trout Salvelinus confluentus |
Bonytail Gila elegans |
Colorado squawfish Ptychocheilus lucius |
Flannelmouthsucker Catostomus latipinnis |
Largescale sucker Catostomus snyderi |
Sources: Jennings 1987, Steinhart 1990. |
The endangered salt marsh harvest mouse encounters a researcher at an Alviso marsh, near San Jose. (Photo by Charles Kennard)
of each species, and the threats each species faces. Not surprisingly, compiling these data for all the species in California is a very large task. Researchers in California have been compiling these data for over twenty years; the estimates of species at risk are increasingly detailed despite the magnitude of the task and the rapid changes in California that are affecting wild populations of plants and animals.
The number of species on either the California or Federal Endangered Species lists is one approximation of the numbers of species at risk in California. Listed species have been recognized by the government as being on the brink of extinction. By definition, an endangered species is "in danger of extinction throughout all or a significant portion of its range" (16 U.S.C. sec. 1532(6)). Threatened species are those "likely to become an endangered species within the foreseeable future throughout all or a significant portion of its range" (16 U.S.C. sec. 1532(20)). In the fall of 1991, 150 plants and 106 animals in California were listed as threatened or endangered by the federal or state government;[8] an additional 66 plants were listed as rare (CDFG 1991a , 1991b ). Rare species have so few populations or individuals that they are intrinsically vulnerable to threats.[9]
Table 3.3. Plants Extinct in California |
Laurel Hill manzanita Arctostaphylos hookeri ssp. franciscana |
Curved-pod Mohave milk-vetch Astragalus mohavensis var. hemigyrus |
Ventura marsh milk-vetch Astragalus pycnostachyus var. lanosissimus |
Oregon moonwort fern Botrychium pumicola |
Single-flowered mariposa lily Calochortus monanthus |
Livid sedge Carex livida |
Pt. Reyes indian paintbrush Castilleja leschkeana |
San Fernando Valley spineflower Chorizanthe parryi var. fernandina |
Mosquin's clarkia Clarkia mosquinii ssp. mosquinii |
Enterprise clarkia Clarkia mosquinii ssp. xerophila |
California dissanthelium grass Dissanthelium californicum |
Mt. Diablo buckwheat Eriogonum truncatum |
Los Angeles sunflower Helianthus nuttallii ssp. parishii |
Mojave tarplant Hemizonia mohavensis |
Howellia Howellia aquatilis |
Santa Catalina Island desert-thorn Lycium hassei |
San Nicholas Island box-thorn Lycium verrucosum |
Mendocino bush mallow Malacothamnus mendocinensis |
Santa Cruz Island monkeyflower Mimulus brandegei |
Santa Catalina Island monkeyflower Mimulus traskiae |
Whipple's monkeyflower Mimulus whipplei |
Veiny monardella Monardella douglasii var. venosa |
Merced monardella Monardella leucocephala |
Pringle's monardella Monardella pringlei |
Adder's-tongue fern Ophioglossum vulgatum |
Shasta owl's clover Orthocarpus pachystachyus |
Saline Valley phacelia Phacelia amabilis |
Ashy phacelia Phacelia cinerea |
San Francisco popcornflower Plagiobothyrs diffusus |
Petaluma popcornflower Plagiobothyrs mollis var. vestitus |
Ballona cinquefoil Potentilla multijuga |
Keck's checkerbloom Sidalcea keckii |
Showy Indian clover Trifolium amoenum |
Caper-fruited tropidocarpum Tropidocarpum capparideum |
Sources: Smith and Berg 1988; M. Skinner 1992. |
The list of endangered species vastly understates the numbers of species at risk. Many species meet the scientific criteria for listing but the administrative process has not been completed. Increasingly, political controversies are obstructing listing of species that scientists agree are endangered. Often the controversies surrounding the listing process are arguments about the actions necessary to save the species, rather than evaluations of whether the species is in trouble.
Official lists of candidates for listing under the Endangered Species Act or species of concern lists held by the U.S. Fish and Wildlife Service or the California Department of Fish and Game indicate that 215 animal species and subspecies may be in trouble (CDFG 1991c ). The number of plant species and subspecies at risk in California is considerably larger. The California Native Plant Society's Inventory of Rare and Endangered Vascular Plants of California includes 383 plants which merit listing as threatened or endangered but are not yet listed by the state (Smith and Berg 1988, Skinner 1992). In short, 599 plants (9 percent of the native species and subspecies) and 306 vertebrates (30 percent of the full species of natives)[ 10]are documented to be declining or seriously at risk of extinction, yet only a small portion of this group has received the minimal protection afforded by the state and federal endangered species acts.
Unless conditions change, these species will not simply hang on at low numbers into the indefinite future while society decides whether or not to act. The Center for Plant Conservation recently estimated that if current trends continue 680 plants will become extinct in the United States by the end of the century. California is home to 129 of these species (Shabecoff 1988). The numbers of plants at risk in California are even more significant nationally because so many of these species are found nowhere else. If they are lost here, they are lost to the world.
Many other species are declining, but are not yet so diminished in numbers and geographic range to qualify as threatened or endangered species. Some of these are major commercial species like the crab, striped bass, and abalone. Others are species hunted for sport, such as the numerous species of waterfowl whose numbers have declined so dramatically. In addition, many common species' numbers and ranges have declined in response to the many activities threatening species in California. Although these species are not in imminent danger of extinction, the decline in their numbers represents a loss of genetic diversity nonetheless.
The history of the winter-run Chinook salmon shows that the declining commercial species of today may be the endangered species of to-
morrow. The world's population of winter-run Chinook spawn in California, virtually all of them in the Sacramento River system.[11] Annual runs numbered from 60,000 to 120,000 individuals in the late 1960s; in 1988 the annual run had only 2,000 fish (Moyle et al. 1989). The Department of Fish and Game (CDFG) has concluded that water diversions and dams are responsible for the precipitous decline of the winter-run chinook. The Red Bluff dam is a major impediment to spawning, and changes in the gravel beds downstream have diminished the spawning areas below the dam. The dam, water flow management, and drought continue to threaten the winter-run chinook salmon, which was listed as endangered by the Fish and Game Commission in 1989. Listing did not end the controversy, however. Fights over appropriate actions to recover the species continue while numbers decline. The run in 1992 contained only 191 fish (Diringer 1992).
Declining species may be indicators of the poor health of an ecosystem; when individual species can no longer be sustained by the system, something is amiss. In addition, because species are dependent upon others in the food-web, through predator-prey relationships and through cooperative relationships as between plants and their pollinators, when one species declines others will feel the effects. Loss of critical or keystone species in an ecosystem can result in a cascade of extinctions of other species that are linked together (Terborgh and Winter 1980). Linked species losses have been documented in the Pacific Northwest, where the removal of a single predator species resulted in the local loss of many other species in the marine intertidal ecosystem (Paine 1966).
Species Protection
Species can be protected by protecting their habitat, by regulating their take and harvest, or by a combination of habitat protection and regulations. Two laws, the California Endangered Species Act (CESA) and the Federal Endangered Species Act (ESA), are designed to protect animals from actions that would harm individuals or their habitat.[12] Plants receive less protection under these laws. Furthermore, the protection offered by the ESA, as measured by the population trends of listed species, appears ineffective. Nearly 75 percent of listed plant species and 58 percent of listed animal species are still declining, despite their listing under the CESA (CDFG 1991d ). Clearly, listing alone does not protect species. Many other laws regulate the harvest of species for commercial and recreational reasons. As these laws,
unlike the ESAs, govern only harvest of species, they cannot protect species from other threats such as pollution or habitat loss. For most endangered organisms, regulating loss is not enough to prevent extinction. By the time a species is eligible for listing, affirmative actions are needed to ensure recovery.
Protection of habitat is widely recognized as the most effective way to protect species. Many people advocate establishing a system of parks or protected areas to protect representative habitats of all the species in the state. To evaluate our progress on this front, we must look at the status of ecosystem diversity in the state.
Terrestrial Ecosystem Diversity
Ecosystem diversity encompasses the variety of different systems in which plants, animals, and microorganisms interact with the nonliving environment. Although ecosystem diversity is the largest scale of biodiversity, we can think of many different scales within ecosystem diversity. The largest is biome, which is a community characteristic of a broad global climatic region, such as the boreal forest found in Canada, Siberia, and other high-latitude areas of the Northern Hemisphere. The next smaller scale is the habitat-type, a repeating assemblage of plants and animals characteristic of the environmental constraints of a region or locale, such as the familiar oak woodlands, redwood forests, Sierran trout streams, or coastal dunes. The smallest scale is the micro-habitat . Examples include the deep pools trout live in, or the fallen logs in the redwood forest under which salamanders dwell.
The best scale at which to evaluate ecosystem diversity in California is the habitat-type. The names alone evoke images exemplifying California: valley oak woodland, Joshua tree desert-woodland, or mixed conifer forest. Evaluating the status of terrestrial ecosystem diversity requires knowing how many habitat-types there are, how much area each one covers, what has been lost, the current condition of California's habitat-types, and what has been protected. This section addresses these questions first for terrestrial habitats, and second for aquatic habitats.
Like many other researchers, we use dominant vegetation as an indicator of terrestrial habitat-type. This is for both theoretical and pragmatic reasons. The geographic distributions of the dominant plant spe-
cies are generally well correlated with climate, so vegetation is considered indicative of the climate and other environmental variables. In addition, the dominant vegetation has a profound effect on the resources available at a site and influences which other species will be found. For example, little sunlight reaches the forest floor underneath a tall forest, constraining which species can grow there. Finally, different types of vegetation provide different homes or habitats for wildlife. Hawks that nest in tall trees won't make their home in chaparral. So vegetation diversity indicates habitat-type diversity. Vegetation types are distinct, identifiable, recurring assemblages of organisms and environmental features that incorporate a significant portion of a region's biodiversity. In addition, inventorying the existing vegetation of an area is a relatively straightforward task, although for a region the size of California a time-consuming and expensive task, and hence has not yet been accomplished.
To review the status of California's habitat diversity, we must have units or categories of analysis. However, unlike species diversity, no scientific consensus exists on how to identify units or subunits of habitats that can be counted or evaluated. Each different vegetation classification system has been designed to meet a particular goal—identifying wildlife habitat, identifying highly productive timber types, or identifying units of plant diversity. Since agencies and researchers organize data for their own purposes it is frequently quite difficult to synthesize information from different sources. Although there are published efforts to translate between different systems (e.g., de Becker and Sweet 1988), the proliferation of specialized classification systems makes the comparison of classifications awkward at best and results in incompatible data sets (table 3.4). The assortment of approaches to habitat-type classification does not decrease the importance of assessing the status of habitat diversity in California; it simply makes the task more challenging.
California's habitat-type diversity is very rich, corresponding to the notable species diversity. The Department of Fish and Game's Natural Diversity Data Base (NDDB) is the best single source of information on the status of rare species and rare habitats in the state. Unlike most habitat classification systems, NDDB's list is designed with the purpose of documenting California's biodiversity. The NDDB list of natural communities identifies 273 terrestrial communities in California (Holland 1986). Unfortunately the NDDB program does not have estimates of either current or historic acreages for the majority of the com-
| ||||||||||||||||||||||||||||||||||||||||||||||||||||||||||||||||||||||||||||||||||||||||||||||||||||||||||||||||||||||||
munity types it identifies. No statistics are available to show how widespread each of the 273 types are. The only source of statewide data on current acreages of habitat-types in California is the Department of Forestry's Forest and Range Resource Assessment Program (FRRAP). However, this program uses one of the most generalized classification systems in California, lumping many different habitat-types together. The FRRAP assessment collects information on the acreage of 31 terrestrial habitat-types plus water areas and urban/agricultural areas (CDF 1988). For example, FRRAP identifies only 10 different types of shrub vegetation whereas NDDB identifies 93 types; and although NDDB identifies 123 different types of aquatic habitat, FRRAP lumps everything into one category—water.
Although FRRAP's system does not adequately represent the diversity of habitat-types in California, it is the only comprehensive collection of acreage estimates for the entire state. Simplifying California into thirty-one different habitat-types streamlines the inventory task, allow-
ing broad statistics to be compiled. Unfortunately, this broad-brush approach suggests that everything with the same name is the same ecosystem. Over-aggregation encourages people to forget that the foothill hardwood habitat-types of Tehama County are different from those of Kern County or San Diego County. The soils, dominant oak species, and many of the resident animals are different between these three areas.
A second problem with broad categories for inventorying habitat-type diversity is that some special habitat-types are overlooked because they are small or occur infrequently. Vernal pools and desert oases are two examples of habitat-types that are very important to wildlife, but because they are found as small dots on the landscape they are not included in a statewide mapping effort. As a result, small habitat-types are not included in the broad list of habitat-types or in the statistics. Visually, on a map of the state's habitat-types, in the area painted tan for the desert, oases will also be painted tan, rather than blue for a watery area. Vernal pools will be painted green for the grassland matrix in which they occur, instead of blue for a wetland.
Community types that occur infrequently are also omitted from the broad-brush approach to habitat-type inventorying. For example, serpentine soil areas, though not necessarily small, are relatively uncommon in the state. Serpentine soils have unusual chemistry due to the minerals in the rocks on which they occur. The characteristic soils make it difficult for most plants to grow. As a result, serpentine areas often have unusual vegetation and many endemic species. Not only do serpentine areas occur infrequently around the state, some areas are covered with herbaceous species, others with shrubs, and others with trees. Serpentine areas and other infrequent habitat-types are difficult to include in a broad-brush inventory, even though they contribute significantly to California's ecosystem diversity. In a map, they are also painted the same color as the surrounding habitat-type.
Despite the limits of the FRRAP inventory, it is the best available, and it is the first such comprehensive analysis. Mapping and inventorying at a detailed scale is a large and difficult endeavor. New efforts are progressing to produce a more detailed analysis of the vegetation of California, both through collaborations among state agencies and through innovative work being done using remote sensing data and field work to combine habitat data in a geographic information system at University of California, Santa Barbara. Our knowledge will improve as these efforts come to fruition.
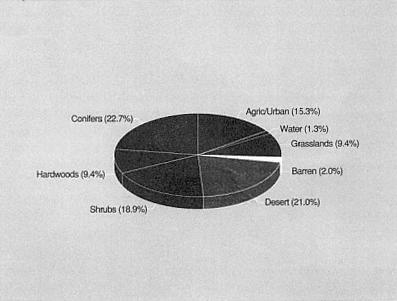
3.1.
California biomes. Percent of the state's area by biome (CDF 1988).
The total area of the state is 101 million acres. These figures do
not include 2 million acres of unirrigated agricultural land in California.
A broad overview of land patterns shows that the majority (83 percent) of California's 101 million acres are wildlands. Densely populated urban areas and agricultural areas cover 15 percent of the state[13] and 1 percent is covered by water (figure 3.1). Dividing California's area into biomes, conifers cover 23 percent and are typical of the mountains of northwestern California and the Sierra Nevada. (Conifers also occur in the mountains of the South Coast and Peninsular Ranges and on several high mountain peaks in the desert.) Hardwoods (e.g., oak woodlands) cover about 9 percent and are most prevalent in the Central Coast Ranges and the Central Valley where they form a mid-elevation band. Shrublands including chaparral, coastal scrub, and sagebrush cover 19 percent, spanning elevations from high to low. Grasslands and other herbaceous types cover 9 percent of the state, mainly in the Central Valley, Central Coast Ranges, and Sierran foothill regions. Over one-fifth of California (21 percent) is desert, including a great variety of shrub and cactus habitat-types. The high peaks and other extremely rocky areas comprise the last 2 percent of the area: alpine barrens or
| ||||||||||||||||||||||||||||||||||||||||||||||||||||||||||||||||||||||||||||||||||||||||||||||||||||||||||||||||||
rock (figure 3.1). Table 3.5 lists the acreages of each of the thirty-one habitat types assessed by FRRAP.
Losses of Terrestrial Ecosystems in California
Since European settlers first arrived in California, over 17 million acres have been converted from natural habitat to urban or agricultural uses.[14] Although these processes began three hundred years ago, much of the habitat loss has occurred recently, and the pace has been increasing. Nearly 5 million acres were converted between 1950 and 1980, approximately 3.8 million to agricultural land and 1 million to urban uses (CDF 1988). Five major habitat-types have lost significant acreages in this thirty-year period: grasslands, coastal scrub, foothill oak woodland, closed-cone pine-cypress, and redwood forests (table 3.6). Although these habitat-types are not usually thought of as being in danger, significant losses over such a short period guarantee that the species dependent upon these habitat-types, and the ecological services these habitat-types provide, have been greatly diminished in some parts of California.
For many of the 10 million acres converted from native ecosystems to agriculture or urban uses prior to 1950 we will never know what habitat-types were lost. Some habitat-types, like interior wetlands and Central Valley riparian forests, have lost over 80 percent of their historic acreage. However, for certain regions, like the southern San Joaquin Valley which is now almost entirely irrigated agriculture, the original vegetation remains a mystery. Only a few tiny fragments of native vegetation remain to provide clues as to the nature and extent of the original vegetation. The Valley's saltbush scrub, vernal pools, and grasslands are home to blunt-nosed leopard lizards and giant kangaroo rats, both of which are endangered species persisting in the remnants of these habitats; researchers can only speculate on how much of each habitat-type was previously found in the Valley.
Conversion of land to more intensive uses has not occurred evenly across habitat types. In general, habitats associated with water—wetlands, vernal pools, and riparian vegetation—have lost proportionally more acreage than other types. Any habitat-type found only along the central and south coast is also likely to be subject to significant habitat loss from urban development. For example, the coastal sage scrub in San Diego and Orange counties has been reduced to only a fraction of
| ||||||||||||||||||||||||||||||||||||||||||||||||||||||||||||||||||||||||||||||||||||||||||
Few low elevation landscapes look as they did when European settlers first arrived in
California. Here introduced annuals dominate where native perennial grasses were once common.
(Photo by David Cavagnaro)
its historic acreage (Westman 1987), and losses are continuing. One result has been the decline of several species dependent on coastal sage scrub, including the California gnatcatcher and the coastal cactus wren, both of which have been proposed for listing under the state and federal Endangered Species Acts. Land use patterns in adjacent parts of Mexico are also greatly impacting the coastal sage scrub and its resident species.
Land conversion figures compiled by FRRAP refer only to conversion from native vegetation to agricultural use or urban use. Areas where the vegetation was manipulated for low-intensity rural purposes, such as converting a brushfield to grassland for grazing, represent additional habitat losses and are not documented by FRRAP. Nor is land subjected to rural or low-density residential development reflected in the figures of acreage converted, despite dramatic increases in this growth pattern in the foothills and some areas of southern California and the desert. Both of these "uncounted" conversions result in habitat loss and fragmentation. Small patches within larger areas are paved or built upon, leaving the landscape as a whole with less wildland. But data are not available to evaluate which habitats have been most affected by habitat-type conversions or rural/"ranchette" development.
Current Conditions and Future Trends
What is the health of the acres that have not been converted for agricultural or urban uses? Determining the condition of California's ecosystem diversity is at the heart of evaluating the status of biodiversity and of predicting future trends. If the habitats are healthy and can successfully provide ecosystem services and maintain viable populations of all species, then we can expect biodiversity to fare well (although not in those habitats that have lost tremendous acreage). Conversely, if many habitats are degraded, the future is likely to include additional losses of biodiversity unless the practices causing degradation are altered. Current and future threats to biodiversity are discussed in depth in chapter 4; only a few points, focused on specific habitats, will be mentioned here.
Information on condition or habitat quality is available for only a few terrestrial habitat-types and these data are disturbing. Many habitat-types are known to be threatened by existing land management practices, pollution, and water use and diversions. For example, nearly 18 million acres of California are privately owned grazing land. Most of this grazing land is either annual grassland, or valley foothill woodland. The U.S. Soil Conservation Service documented surface erosion problems on 6.9 million acres of nonfederal grazing land in California (USDA 1984). Thus a significant percentage of the private rangelands are experiencing excessive surface soil erosion. Soil erosion contributes to decreased ecosystem services through nutrient loss from the soils, soil degradation, and water quality problems.
The condition of an ecosystem may change, making it less suitable for wild plants and animals, while still providing some goods and services. The California grasslands long ago were converted from a grassland dominated by native perennial grasses to one dominated by annual species introduced from the Mediterranean (Heady 1977). This complete shift in the dominant species from natives to nonnatives has likely had an adverse effect on many native species, but the grasslands remain productive rangelands. Introduced grasses provide good forage, and although they compete with the natives for water, nutrients, and space there is no conclusive evidence that the introduced grasses alone have caused the extinction of any native species. In contrast, several introduced species are serious range weeds. For example, yellow star thistle from Europe is now a problem in twenty-eight counties because it is
unpalatable to livestock. Probably one million acres of rangeland have been made less productive by this species (Thompsen 1985, cited in CDF 1988).
Desert habitats seem hardy to the casual observer because of the harsh climates they endure, but they are very vulnerable to damage from off-road vehicles and military maneuvers. The desert has become increasingly accessible as a recreation area for California's growing population. More than 35,000 miles of roads and trails crisscross the desert. Off-road travel in the desert breaks open the protective cover of desert pavement and native plant growth, exposing the surface to wind erosion and leaving scars that take decades or even centuries to heal (Stebbins 1990). Desert soils are particularly vulnerable to compaction and damage, and the harsh conditions makes recovery slow (Webb and Wilshire 1983). In 1980, the Bureau of Land Management estimated that 47,900 acres were disturbed by motorized vehicles, but researchers at the University of California estimated that significant disturbance had occurred in ten times this area, and impacts of unrated severity had occurred in perhaps twenty times this area (Wake 1980).
Although the condition of California's habitats may be the best indicator of the status of biodiversity, it is also the most difficult to evaluate. Too often it is assumed that so long as some vegetation is standing, and some animals are present, all is well. Unfortunately, this is not the case; where data are available, they show that many diverse activities are decreasing the health of habitat types.
Protection of Terrestrial Ecosystems
Land acquisition is one of the most important tools in the protection of biodiversity. Today 12 percent of California is in some type of protected area; but only half of this area, or 6 percent of the state, is managed primarily for the protection of biodiversity. The remainder serves several purposes. Is this enough to protect biodiversity? To answer this question, we must know whether the existing system of protected areas includes representative examples of California's biodiversity, and whether these areas are managed to adequately protect biodiversity.
Before evaluating whether California's parks and protected areas are adequate to protect biodiversity, first ask the question, Should parks be expected to do all that is needed? The answer is a resounding, No! Conservation planners all over the world recommend a multifac-
eted approach to habitat protection, starting with a system of protected areas that include key sites where the land is dedicated to conservation. These "core" areas provide safe sites for species and ecosystems. Land surrounding the core, when managed sustainably for multiple uses, provides both economic return from the land and habitat for many different species. These multiple-use lands can act as "buffer areas" between preserves and areas away from the core that have little habitat value for biological diversity. In addition to land preservation, laws and regulations to protect critical habitats and species and to guarantee that lands are not degraded are necessary components of a conservation program.
Although many acknowledge that parks alone are not enough, all agree that parks are essential to the protection of biodiversity (for example: Harris 1984, McNeeley and Miller 1984, Jensen 1987a , Western and Pearl 1989). Parks protect populations of species from land conversion and habitat loss, and maintain gene pools for wild species. As large areas of California are used more intensively, many species will only be able to persist in parks and protected areas. But more importantly, parks allow the ecosystem processes to continue. Functioning, productive ecosystems change over time, and the species living within these ecosystems evolve in response to changing environmental conditions.
An ideal system of protected areas in California would contain representative stands of all the habitat-types in the state. Each protected area would be designed to incorporate the patterns and variety found at a landscape scale to assure that successional sequences and wildlife corridors are included. The system would also contain duplication so that the geographic range of each habitat was represented. Widespread habitat-types, such as white fir forest, found from the Warner Mountains of Modoc County, south along the Sierra Nevada, to some of the high desert ranges, should be included in more than one preserved area to encompass the full range of species present within that habitat-type, as well as the genetic variation between the different populations of the wide-ranging species. To the extent that different locations of the white fir habitat-type vary in their species composition, ecological interactions, and genetic makeup, duplication actually provides completeness to the reserve system. To the extent that different examples of white fir habitats are similar, duplication provides redundancy and thereby safeguards the system against loss of one site from a catastrophic event
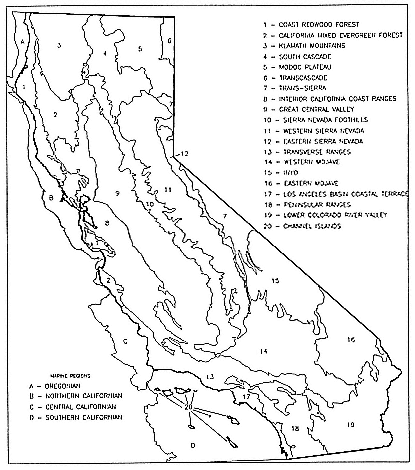
like fire. This strategy for designing a system of natural areas is used by the U.S. Forest Service for the identification and establishment of Research Natural Areas (RNAs) in California. Their goal is to have one RNA of each forest type within each province of California (see figure 3.2). California Department of Parks and Recreation (DPR) and the University of California's Natural Reserve System have similar goals of protecting representative examples of the state's ecosystems.
Habitat-types are very unevenly included within the parks and protected areas of California. Although 12 percent of California is in some type of protected area, 12 percent of each habitat-type is not; a few habitat-types are much better represented (figure 3.3). Of the twenty-five types of habitats evaluated by FRRAP, two (alpine dwarf scrub and subalpine conifer forests) have over 90 percent of their acreage in protected areas (CDF 1988). They will fare well unless threats from outside affect their survival in parks. Other habitats are also over-represented. Conifer forests cover 23 percent of California, but comprise 38 percent of the land in protected areas. Both of these patterns reflect the large acreages of the Forest Service Wilderness Areas and the National Parks in the high Sierra. Other habitat types, like valley riparian forest and perennial grasslands, are dramatically under-represented; less than 2 percent of their area is within protected areas (table 3.7). Unfortunately, the habitats that are poorly represented include some of those that are highly threatened.
The parks and protected areas of California are also unevenly distributed geographically. although 29 percent of the land east of the Sierra is in some type of reserved status, only 3 percent of the Sacramento Valley region is reserved. This pattern reflects both land ownership and regional history. Regions that are major agricultural areas or are primarily under private ownership have fewer reserved acres. The risk posed by the skewed regional distribution of preserves is that species found only in those regions with few reserves are less well protected, and only a small portion of the genetic diversity of wide-ranging species is protected.
Many land management agencies in California have a goal of protecting representative examples of the state's habitat-types in each province, but progress toward this goal is uneven. This is in part due to a lack of detailed information about which habitats occur within the existing parks and preserves of California (Jensen 1983). Without a fairly detailed understanding of which habitat-types already occur within parks
3.2.
Ecological regions of California (from the Natural Diversity Data Base).
The USFS uses a similar but more simplified map of provinces.
and preserves, it is difficult to efficiently improve protection. Gaps in the reserve system need to be identified and then filled by new acquisitions.
Sufficient data already exist to fill some of the obvious gaps in the reserve system while the data bases are improving. FRRAP has made a first-cut estimate using a fairly coarse analysis. In the fall of 1989, the DPR began an inventory of the vegetation types found on its 1.2 million acres (Roye 1989). The Forest Service is currently evaluating its target system to ascertain if representative examples of forest types are,
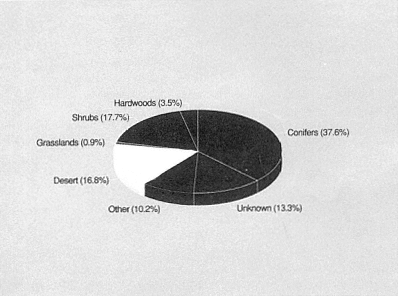
3.3.
Vegetative cover of California's protected areas. Total acreage in
protected areas is approximately 12 million acres (CDF 1988).
or will be, included in their RNAs. But some of the federal agencies have made little progress in designating protected areas and others do not have a plan to protect representative habitats.
Recognizing the importance of evaluating the gaps in protection provided by reserve systems, the U.S. Fish and Wildlife Service (USFWS) has begun a study of the protection status of vegetation types and vertebrate species. Using geographic information systems, they can overlay the boundaries of parks and reserves over the distributions of vegetation and vertebrate species ranges and get a coarse-scale overview of the gaps in habitat and species protection. The work will identify landscapes that contain large numbers of potentially unprotected vegetation types and species. Such areas may be most desirable for future preserve establishment and can be the focus of intensive field investigations.
These projects are referred to as "gaps analyses." The California "gaps" project is jointly funded by the National Fish and Wildlife Foundation and Southern California Edison Company and is being completed at University of California, Santa Barbara (Davis et al. 1991). The project necessarily includes many collaborators, including the U.S. Fish and
| |||||||||||||||||||||||||||||||||||||||||||||||||||||||||||||||||||||||||||||||||||||||||||||||||||||||||||||||||||||||||||||||||||||||||||||||||||||||||||||||||||||||||||||||||||||||||||||||||||
Wildlife Service, the California Department of Fish and Game, the California Department of Forestry, the California Nature Conservancy, and many others. The initial phase of the California gaps analysis is being conducted for Southern California. The anticipated products include a new vegetation map for California, digital information on the distribution of vertebrates, and an analysis of the vertebrates and vegetation included within existing protected areas. This research is likely just the first low-resolution compilation of information, but it will facilitate more detailed regional studies. Gaps analyses are being conducted in all the western states and are planned for all the states in the country. When complete, it should be possible for the first time to identify gaps (or redundancies) in systems of parks and protected areas across state boundaries.
Knowledge of what areas need additional attention is a necessary but not sufficient condition for successful conservation. Often important biological areas are sites including several land owners, and only cooperative projects can succeed. Collaborations between agencies have been sporadic in the past. Now a collaborative effort called the Interagency Natural Areas Coordinating Committee (INACC) is encouraging agencies to work together on conservation activities at the regional level. INACC, a program initiated by CDFG, was started by agreement of the heads of the major state, federal, and private land management organizations in California. After several years of meetings at the statewide level, regional committees were formed. Both the magnitude of the task and the need for local coordination motivated the groups to meet to discuss land management and protection issues specific to each region. Although regional INACC committees have not yet been formed in each region of the state, those already started are proving to be one of the more successful ways of establishing contact between the various agencies involved in biodiversity management. Individuals living and working within the same region are able to share information on management problems and solutions and can work toward more complete regional representation of biodiversity within their area by looking across jurisdictional boundaries.
There are many types of protected areas and managed areas in California, not all of which are "core" areas where biodiversity protection is the highest priority. Each designated category of reserved land has different objectives and substantially different constraints on the types of activities permissible (Cochrane 1986). Approximately 6.4 million acres in California have been set aside primarily for the protection and
maintenance of ecological processes and the species dependent upon these processes. These lands are designated as parks, nature reserves, research natural areas, and other similar categories. Another 5.5 million acres of reserves are used for a combination of purposes, such as recreation and commodity production in addition to the conservation of species and ecological processes. Wilderness areas, wildlife refuges, and recreation areas are some of the designations of these protected areas.
Different levels of protection are afforded by the different categories of protected area. Some areas are managed primarily for the production of waterfowl or deer, whereas others are open for use as all-terrain vehicle recreation areas. Some areas are subject to fire suppression, others to prescribed burning, and some managed areas are grazed by livestock. These different goals and management practices make it difficult to ascertain whether a given area is "protecting" all of the components of biological diversity. As a rough estimate, only about half of the lands in reserved status, or about 6 percent of California, are managed primarily for the protection and maintenance of ecological processes and all native species present in these areas (table 3.8).
Conflicts regarding the appropriate management of California's state parklands are becoming more common. Many believe that state parks are not functioning as "core" areas of California's conservation efforts, safe from practices that have adverse impacts on biodiversity. The purpose of state parks, run by the California Department of Parks and Recreation, "shall be to preserve outstanding natural, scenic, and cultural values, indigenous aquatic and terrestrial fauna and flora" (Public Resources Code 5019.53). Despite this mandate many state parks are embroiled in management controversies because grazing is permitted in park lands, and because of proposals to remove non-native vegetation such as eucalyptus.[15] Not all lands managed by DPR have nature conservation as their primary goal. Nearly one-fifth of the lands managed by the DPR are state recreation areas which "consist of areas selected, developed and operated to provide outdoor recreational opportunities" (PRC 5019.56). These areas include state recreation areas and state beaches. In these areas, recreation has primary importance, resulting in adverse impacts to threatened habitats like coastal dunes. However, because these are recreation areas, such uses—even those with adverse impacts—are permitted and are not inconsistent with the goals of these areas. Many of the Department of Fish and Game's wildlife refuges have management prescriptions that increase waterfowl production, certainly a worthy goal. Some waterfowl areas are also grazed,
| ||||||||||||||||||||||||||||||||||||||||||||||||||||||||||||||||||||||||||||||||||||||||||||||||
which may be compatible with waterfowl production, yet contributes to the loss of sensitive species such as the sandhill crane (Cohen 1989b ). Focus on selected species results in decisions that can adversely affect other plants and animals living in the refuge.[16] Because conservation dollars are limited, reconsideration of management goals for some re-
served areas may be appropriate and has occurred on some sand dune sites.
The promise of protection in reserved areas versus the reality of management practices is even more controversial on federal lands than on state park land or wildlife areas because of the large acreages involved. Ten million acres of federal land are designated as parks, wildernesses, or recreation areas in California. These lands are 85 percent of the protected area acreage in California, making their management crucial to protecting biodiversity. Unless federal protected areas are in good condition, and co-occurring uses are compatible with biodiversity, the acreage figures exaggerate their conservation value.
Wilderness areas contain the most acreage of any category of protected area in California. Most of the wilderness areas were set up by act of Congress. In the process of designating wilderness, Congress authorized the continuation of numerous nonconforming uses such as mining, water development, fire control, and livestock grazing (McClaran 1990). The goals and objectives in wilderness areas are thereby often conflicting, and no data are available on the impact of these nonconforming uses on the protection of species and ecosystems. For other categories of protected areas, congressional direction is clear, but the appropriateness of current practices are controversial. For example, the desirability of allowing grazing on research natural areas, which are set aside as baseline areas for scientific research and educational purposes, is being debated.
In addition to the ten million acres of various categories of protected areas in California, the federal government owns and manages thirty-five million acres with a multiple-use mandate under the Federal Land Management Planning Act of 1976 and the National Forest Management Act of 1976 (figure 3.4). Much of the rangelands and commercial timberlands in California are managed by the federal government. These nonreserved areas (mainly U.S. Forest Service lands and Bureau of Land Management lands) are also important for the maintenance and conservation of the state's biological diversity.[17] Conceptually, these lands could be the "buffer areas" of the idealized conservation strategy discussed above. If managed properly, they should be able to provide both commodities and habitat.
The fight over the northern spotted owl is a key example of the difficulty of managing multiple uses in national forests while simultaneously maintaining species and habitat-types. The declining owl populations indicate that past forest management practices, particularly the
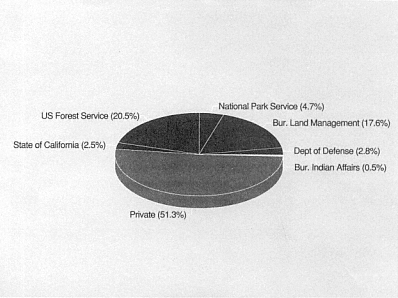
3.4.
Land ownership in California. Total area of the state is 101 million acres.
harvest rate, were incompatible with the continued presence of owl populations. Because the northern spotted owl is found in Washington, Oregon, and California, some argue that there is no need to maintain the owl throughout its range, that management should be allowed to eliminate the owl in some areas. Others argue that the real concern is the old-growth forests that owls inhabit, and that the old-growth forests should be protected in all three states. The long-term outcome of the old-growth/spotted owl controversy cannot be predicted. However, it is easy to predict that there will be other conflicts over the appropriate intensity of use of federal multiple-use lands. Because of the continuing conflicts over appropriate management of multiple-use lands, they cannot be considered protected areas.
Conflicting management goals for various categories of public lands are only one of the factors lessening the value of these areas for protection of biodiversity. As documented in chapter 4, there are numerous threats to biological resources in California. Many of these threats, such as air pollution or water diversions, cannot be constrained by property lines. As a result even if a preserve is designed and dedicated to protecting all the species and vegetation types present, success may depend
upon actions outside the jurisdiction of park managers. For this reason, where regulatory control of the threats that cross boundaries is inadequate, species and ecosystems in parks are still at risk. For example, air pollution from the Central Valley has been documented to be a problem in Sequoia National Park (CARB 1988), and selenium-contaminated water forced the closing of Kesterson National Wildlife Refuge.
Parks and protected areas are the centerpiece of protecting biodiversity. But buying or setting aside land is simply the first step. Managing the parks and preserves, and protecting them from the many diverse threats, are also critical components of a conservation strategy.
Aquatic Ecosystem Diversity
Aquatic habitats in California contain a rich array of water-dependent species and provide essential seasonal habitat to many terrestrial species in California during the long, dry summers. Unfortunately aquatic habitats throughout the state have been substantially changed and damaged in the past 150 years. Despite an increasing awareness of the importance and the vulnerability of aquatic habitats, few actions are being taken to protect these vital components of California's biodiversity.
What Aquatic Diversity Does California Have?
California contains seven major drainage systems, each with its own subsystems: the Klamath River, Sacramento-San Joaquin, North/Central Coast, Lahontan, Death Valley (sometimes separated into the Owens/Mojave and Amargosa units), South Coast, and Colorado River systems (sometimes separated into the Salton Sea and Colorado River units). These systems are defined by major rivers and their associated drainage basins. Although the majority of interior streams and lakes drain eventually into the large rivers, many of the coastal streams drain directly into the ocean. Separated in a past geologic era, each drainage system now contains a distinctive fish (and invertebrate) fauna. The Natural Diversity Data Base identifies 123 different aquatic habitat-types in California, based on fauna (Ellison 1984);[18] of these, 78 are stream habitat-types.
Riparian forest in Tulare County—less than 5 percent of this type
of habitat remain in California. (Photo courtesy Walt Anderson)
The mean annual runoff from California's rivers and streams is 71 million acre-feet (MAF)[19] of which 31 MAF flow from the Sacramento-San Joaquin River system (DWR 1987). Water is unevenly distributed around the state; most of the rainfall occurs in the North Coast region and in the Sierra. As a result 40 percent of all the state's runoff is from the North Coast and 44 percent is from the Sacramento-San Joaquin system. The remaining 16 percent (less than 12 MAF) is the runoff from the east side of the Sierra, the vast desert regions, the Central Coast ranges, and southern California (DWR 1983). People are distributed in a pattern that is almost a reverse image of rainfall; more than half the state's population lives in the Central Coast ranges and southern California.
California contains both natural lakes and manmade reservoirs. Reservoirs are included as lakes in classifications of aquatic habitats because these impoundments of streams and rivers often support populations of fish and other organisms that are characteristic of lakes. The major natural lakes in California are Lake Tahoe, Clear Lake (the largest freshwater lake completely within California), Eagle Lake, Goose Lake, and the saline Mono Lake. Numerous smaller lakes are found throughout the Sierra Nevada especially in the southern Sierra. The largest inland
body of water within California is the saline Salton Sea. Dry until the Colorado River filled it in 1904, the Salton Sea now receives inflows of Imperial Valley irrigation water. NDDB's aquatic classification lists forty-six different types of lake and pond habitats in California (Ellison 1984).
The interconnections between terrestrial and aquatic communities are nowhere so evident as in an estuary. An estuary is a marine bay with freshwater inflows at one end, creating a salinity gradient between the coastal side and the freshwater inflow (Goldman and Horne 1983). The shores of estuaries have been the sites of human habitation throughout history. Estuaries are known to be important nurseries for the fisheries of the world and are renowned for their productivity. Both freshwater and salt marshes are found on their edges. California contained approximately 552,000 acres of coastal estuary in 1967[20] (Ringold and Clark 1980).
Freshwater wetlands occur inland from salt and brackish marshes, as well as in the interior of California. There are approximately 93,000 acres of salt, brackish, and freshwater marsh in coastal California and 374,000 acres of freshwater wetlands remain in the Central Valley (DPR 1988). Additional acreage occurs in the Modoc Plateau region.
California has 1,827 miles of shoreline as measured by the U.S. Corps of Engineers (cited in Ringold and Clark 1980). This shoreline contains 412 miles of beach; the remainder is primarily rocky shoreline. The intertidal and splash zone communities contain a distinctive and diverse array of species. NDDB lists sixteen different intertidal and splash zone communities, found on various types of substrates from Del Norte County to San Diego (Ellison 1984).
Historic Threats and Losses of Aquatic Habitats
Aquatic habitats are the most dramatically and completely altered biotic communities in California. A significant proportion of the natural aquatic habitats of California has been severely altered and degraded, endangering the species dependent upon these habitats (see for example figure 3.5). The Natural Diversity Data Base lists 34 percent of the lake and pond habitat-types and 50 percent of the stream habitat-types as rare or endangered.
Significant changes to aquatic habitats have occurred since the middle of the nineteenth century, when gold miners dug up stream beds, and since the turn of the century, when brook trout and rainbow trout were
introduced to previously fishless high Sierra lakes and streams. Dr. Peter Moyle, the leading expert on California's native fish, is blunt about the changes to California's major inland waterways:
The once turbulent and muddy lower Colorado River is now a giant, dammed irrigation ditch and drain. . . . The giant lakes of the San Joaquin Valley are today vast grain farms. The Sacramento-San Joaquin Delta, once an enormous tule marsh dissected by meandering river channels, has been transformed into islands of farmland protected by high levees from the water that flows in straight, dredged channels. (1976, p. 46)
The period of large dam and reservoir construction in California took off with the Central Valley Project in the 1950s, although the first dams were built much earlier. In 1860, no streams were dammed. By 1920, there were 14 reservoirs, each with holding capacities of over 50,000 acre-feet. Most of these had been built by local water agencies or local governments. In 1949, 37 such reservoirs existed (Hornbeck 1983). By 1988, there were 102 major reservoirs;[21] 27 of them Federal. There are now more than 1,200 reservoirs in California with a combined storage capacity of over 43 million acre-feet (California Department of Finance 1988).
Although the numbers and surface area of "lake habitats" have increased greatly in the last seventy years, reservoirs have been added at great loss of river and stream habitats and their dependent species. Natural lakes have also been lost. Historically, the Tulare Basin of the Central Valley contained two huge lakes: Tulare and Buena Vista. These have been drained and converted to irrigated agriculture.
Threats to freshwater aquatic communities are often evaluated in terms of their effects on fish fauna. Because fish are incapable of avoiding many of the impacts to their habitat, they serve well as indicators of the condition of the entire aquatic ecosystem. The very large numbers of endangered fish in California suggest that the aquatic habitats where these fish reside are undergoing profound modifications. Seventy-two percent of the native freshwater fish in California are either listed or likely candidates for listing as threatened or endangered, or are extinct (Moyle et al. 1989).
Moyle (1976) discusses three basic causes of the historic decline of inland native fish fauna: habitat change (which includes both habitat loss and habitat degradation), introductions of non-native species, and fishing. Although the best-documented examples are for fish, these forces have also changed the diversity and abundance of other types of aquatic organisms.
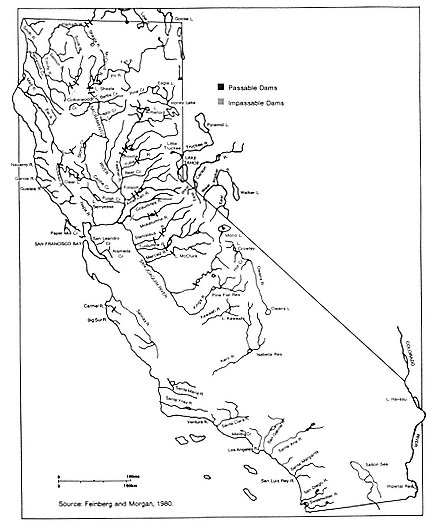
3.5.
Major dams that affect fish migration.
Nearly every aquatic system in California has been subjected to some type of habitat alteration. The habitat changes have included modifications of the aquatic habitat itself, such as stream channel alterations (straightening and dredging) which have destroyed fish spawning areas and altered the stability and vegetation of the banks; dams and reservoirs, which have impeded and altered natural streamflows; and dewatering (diversion), which has removed water for irrigation, power gen-
eration, or industrial and municipal consumption and thereby affected spawning grounds, stream flows, and riparian vegetation growth patterns. In Eagle Lake, for example, diversion for irrigation reduced creekflow into the lake, resulting in decreased survivorship of trout eggs and fry.
The second cause of decline in native fish fauna has been the introduction of non-native species. Forty percent of the inland fish in California are introduced species. Especially in combination with human modification of aquatic habitats, introduced fish and molluscs have increased in abundance at the expense of native fish such as the Sacramento perch. Some of the introduced fish are predatory and have become pests, devouring the juveniles of other species. For example, white bass, which were introduced into Lake Nacimiento in the mid-1960s, escaped into the San Joaquin River system in the early 1980s. The Department of Fish and Game (which had introduced these fish) then had to undertake a major eradication program to eliminate the white bass to prevent damage to the San Joaquin River fishery (CDFG 1987). Introduced centrarchid fish (sunfish) and bullfrogs have been hypothesized as one cause of the decline of amphibians in California (Hayes and Jennings 1986).
Fishing, both sport and commercial, and management practices that favor fishable species at the expense of any others, have a major effect on native fish fauna. The Pacific sardine fishery reached its peak between 1934 and 1944 when 800 million pounds of sardines were landed each year. The entire fishery began a rapid decline after 1944, due to a combination of fishing pressure and weather patterns. The northern stocks were particularly hard hit; San Francisco has not had a commercial sardine fishery since 1951 (Skinner 1962). The sturgeon fishery lasted for only a brief flurry and then underwent a dramatic decline. The largest freshwater fish, sturgeon was scorned as a commercial fish in the mid-1800s. As the state's population grew with the influx of easterners, demand for sturgeon and caviar soared. The first commercial catch records are from 1875. By 1885 the catch was 1,658,000 pounds and by 1901 the fishery was closed and the fish was believed to be on the verge of extinction (Skinner 1962).
One major threat to lakes that is not common in riverine systems in California is eutrophication from overfertilization with nutrients. Several lakes in California including Clear Lake, Lake Tahoe, and many smaller lakes have suffered from increased algal growth from sources such as fertilizer and sewage. The algal growth decreases oxygen levels
in the lakes, harming animal life. At Lake Tahoe, increases in algal growth over the last thirty years were caused by basin development on erosive soils. Streams carrying nutrients and natural organic compounds from erosion are the most important source of nutrients responsible for increased algal growth in the lake (Goldman and Byron 1986). Disturbances to the soils in the watershed increase nutrient release from streams into the lake.
Many forces have contributed to the alteration and degradation of coastal estuaries and their associated wetlands. The largest threats to estuaries are habitat loss from filling and dredging, pollution, sedimentation, logging, and harbor development. Estuaries along the South Coast receive additional pressures from oil production. Changes in the species resident in estuaries are the results of the introduction of non-native species, overfishing, sedimentation from hydraulic mining, water diversions, point and non-point source pollution, toxic wastes, and possibly synergies between these factors (Nichols et al. 1986). Despite years of research, debate continues as to the causes and degree of change to San Francisco Bay. This is in part because there are numerous different threats to the Bay's biological resources, and the relative effect of each stress is difficult to determine. In other estuaries of California, threats are similar to those acting in San Francisco Bay, especially pollution, sedimentation, and the dredging and filling for ports and harbors (Dennis and Marcus 1983).
Between 1947 and 1967, 255,800 acres, or 53 percent, of the total statewide coastal estuarine and wetland acreage was lost by filling and dredging. This is over four times the acreage lost anywhere else in the United States. Over half of this area was in the San Francisco Bay-Delta system. Between 1950 and 1967, San Francisco and Suisun bays lost 192,000 out of a total of 294,000 estuarine and wetland acres, until filling was virtually stopped by state action in the 1970s after the establishment of the Bay Conservation and Development Commission (Ringold and Clark 1980). This 65 percent loss within the San Francisco Bay-Delta system represented the greatest decrease of habitat in any single estuary in the United States at that time. Extensive use of the watersheds for off-road vehicle recreation, agriculture, and urban development has caused erosion and thus sedimentation of south coastal waters. With the enormous population expansion and accompanying urban development, the coastal wetlands of southern California have experienced a 75 percent reduction (Dennis and Marcus 1983). In recent years the loss has been slowed down, in part due to the California
Coastal Commission and numerous laws to protect coastal and interior wetlands.
Threats to shoreline and intertidal habitats include development, offshore drilling, oil spills and other forms of pollution, excessive collection of tidepool organisms, and overfishing. Dramatic oil spills in Santa Barbara brought the problem to people's attention, and many emergency response efforts were designed. These actions lessen but do not eliminate the threat oil spills pose to shore and intertidal habitats. Although recreational and commercial divers have depleted abalone populations, the major threat to most intertidal species is pollution. Sedimentation of coastal waters, from erosion, is the most widespread type of pollution. Erosion is a natural hazard, but activities such as agriculture and urban development accelerate the process.
Protection of Aquatic Habitats
Attitudes regarding the uses of rivers have begun to change in recent years, from emphasizing human use of the river toward protection of the river for the river's sake. Preservation of parts of rivers and streams has often resulted from the actions of local citizens (Palmer 1986). Federal protection of California's streams and rivers has been granted since 1968 through the Wild and Scenic Rivers Act, which prohibits dams, reservoirs, or other impoundments on designated rivers. State wild and scenic designation, first granted in 1972, offers the same protection as federal, except that it does not preclude projects permitted by the federal government. Reaches of thirteen rivers in California are designated wild and scenic rivers: American, Eel, Feather, Kern, Kings, Klamath, Merced, Salmon, Scott, Smith, Trinity, Tuolomne, and Van Duzen.
Protection of aquatic ecosystems will require assuring adequate water quantities as well as water quality in the streams and rivers of the state. To date, the existing system for regulating water use and water quality does not assure the protection of aquatic biodiversity. California has an administrative system for allocating rights to use water. The State Water Resources Control Board (SWRCB) has the task of permitting water use rights throughout the state and of setting water quality standards. Under the existing system it is impossible to buy water or own rights for instream flow; rather, rights are granted for the diversion and offstream use of water. The SWRCB can, however, establish standards for the minimum flows and water quality necessary to protect fish and
wildlife. Not surprisingly, this process is extremely controversial. In some watersheds in California, use of all the water has already been allocated, without determining the instream flows needed to maintain aquatic biodiversity. In overallocated watersheds the SWRCB can choose to meet the needs of fish and wildlife—but water must then be taken away from an existing permit holder to provide for the needed minimum flows. For example, if through the politically volatile Bay-Delta hearings, the SWRCB determines that additional flows are needed to maintain water quality for the San Francisco Bay and the Delta region, the number of acre-feet that other users can withdraw will have to be reduced. It is clear that the existing permit holders have a large incentive to influence the decision-making process against more flows to fish and wildlife.
To date, the existing water appropriation system provides little protection to aquatic ecosystems, whereas price subsidies discourage water conservation. Creative managers and environmentalists are finding ways to buy water at one end of a drainage system and sell it to an offstream user at the other end of the drainage system in order to have water flowing through the system at a critical time of the year. Clearly, the water appropriation system is not designed for the protection of biodiversity; in fact, it contributes to the endangerment of aquatic habitats (see chapter 4).
There are many waterfowl refuges throughout California managed by either the Department of Fish and Game or the U.S. Fish and Wildlife Service. Many of these contain fresh- or saltwater wetlands. Although these are extremely important protected areas—because 80 to 95 percent of historical wetland acreage has been eliminated—there are many flaws that limit the ability of these refuges to adequately protect aquatic diversity. Few wetland refuges have dedicated water rights, so they may not receive water in times of drought (Gilmer et al. 1982).
Certain forms of protection have been given to shoreline communities. Six of the twenty-one National Wildlife Refuges in California are coastal refuges containing 17,000 acres of estuaries and wetlands. Elkhorn Slough, located near Monterey Bay, is the second largest estuary in the state (San Francisco Bay is the largest). It is now a national estuarine sanctuary. Offshore, several federal marine refuges have been established to protect certain areas for fishing or to protect critical bird nesting areas. These national marine sanctuaries include Cordell Bank, the Gulf of the Farallones Islands, Monterey Bay, and the Channel Is-
lands. Efforts to withdraw these areas from offshore oil drilling have been quite controversial, but are essential to their protection.
Although 42 percent of the coastline is in public ownership, it is difficult to determine its protection status. Approximately one-fifth of the coast is federally owned, in both national seashores and military bases. State beaches managed by DPR, the remainder of the publicly owned shoreline, get a tremendous amount of recreational use. One-third of the coast is used for either public or private recreational uses (USGS 1971, cited in Ringold and Clark 1980). This may have a detrimental effect on the nearshore intertidal communities. A substantial portion of the undeveloped shoreline is partially protected simply because it is inaccessible due to steep cliffs and erosive slopes.
Many of the historic threats to aquatic habitats such as water diversion and reduced water quality have not greatly diminished. Although the rate of habitat alteration has slowed, the direction has not. Water diversions and declining water quality continue to pose substantial threats to California's aquatic systems. In addition, new threats such as pollution, acid deposition, and sedimentation threaten streams and rivers, and land use changes threaten seasonal wetlands, low-elevation ponds, and desert aquatic habitats. As a result many streams, rivers, lakes, ponds, and estuaries are subject to a multitude of different stresses. Protection of aquatic habitats must include both the designation of protected areas and assuring adequate water flows and water quality. Because identification and protection of aquatic habitats is not a priority for any state entity in California, future trends do not look promising for aquatic biodiversity.
What Do These Trends Portend for the Future?
California is endowed with a wondrous assortment of species and ecosystems that comprise the state's biodiversity and provide us with a host of benefits. But human activities are beginning to overtax the regenerative abilities of natural systems.
The loss of, and damage to, ecosystem diversity in California is evidenced by the decline and degradation of many of the state's habitat-types. On a statewide basis several terrestrial habitats have lost more
than 50 percent of their historic acreages. The majority of the aquatic habitats are altered or in poor condition. If this loss were evenly distributed across California, perhaps the species dependent upon these habitats would simply have suffered declines in their populations. But in fact, the habitat losses have been very unevenly distributed, with great losses in the Central Valley and coastal California. For species dependent upon habitats that once occurred in these regions and which have now been replaced by agriculture or urban land uses, entire populations have been lost, and in some instances, species have gone extinct. Although we have data on the past and present acreages for some habitats, we have little information on the condition of these habitats. Many human activities degrade natural systems diminishing their productive capacity. Even without decreases in acreages, degraded areas can no longer sustain high populations of the native species resident there.
Ecological theory can be used to predict the species losses that will occur from continued loss of habitat. As the area of habitat increases, the number of species present increases, following a regular pattern predicted by island biogeography theory (MacArthur and Wilson 1967). This pattern can also predict how many species will be lost when the acreage of habitat decreases. However, the rate of loss cannot be predicted because it depends both on characteristics of individual species and the pattern of fragmentation that occurs as habitat is lost. In California, several habitats such as riparian forests and wetlands have already lost substantial acreage. Ecological theory predicts that we should anticipate the loss of species dependent upon these areas, but theory cannot tell us how rapidly these losses will occur. Many remaining small habitat areas may already be too small to support healthy populations of a number of the species present today. Because individual animals and plants live for many years, the population losses and ultimate extinctions will occur on a scale of decades rather than years. Thus the processes of loss have already begun, but the consequences are not yet evident.
Of particular concern is the fact that many of the habitats that have lost the most acreage are coincidentally also habitats that are unusually rich in species. These habitats include valley riparian forests, montane riparian forests, wet meadows, and perennial grasslands (Jensen 1988). Unfortunately these are among the habitats that have been most greatly altered and destroyed by human activities. In short, we are losing keystone habitats, those habitats that contain many more species than acres alone would predict, and we are losing these habitats first.
Maintaining biodiversity in California will require a commitment to sustaining functional examples of the habitats of the state. Because of the linkages among habitats and between habitats and species, a habitat-oriented approach rather than a species-oriented approach is preferable. The focus should be on keystone habitats that are important to many different species, as we are losing these species-rich habitats first. Although only a few of the species dependent on these habitats have been lost or are in danger of extinction, we should anticipate significant loss of species dependent upon these habitats if trends continue unabated. In some regions of California this loss is already occurring; but, as we are losing populations rather than entire species, we cannot yet see the decline. Nowhere in California is the loss of populations and genetic diversity being monitored for species that are declining but not yet endangered.
If fifty years ago one tried to predict the status of biodiversity in California today, the effort would very likely have been unsuccessful for three reasons. First, we knew far less about the many linkages within and among the genetic, species, and habitat levels of biodiversity and how those linkages influence the responses of species and habitats to human activities. Second, we could not have anticipated the types and severity of threats to biodiversity that, in fact, originated during the past half century. Third, we could not have anticipated the array of new laws and agencies and the patterns of other social and institutional changes of the past fifty years, some of which expedite and some of which impede efforts to protect biodiversity. Even had such a prediction been made, we would find it difficult to test its validity, because of the difficulties (as discussed above) in assessing the status of biodiversity today.
In some important respects, we are in a better position now to attempt a forecast. One reason is that society is more aware today than it has ever been of the present and long-range threats to the environment, of the ways ecosystems respond to those threats, and of the barriers to dealing with these threats. This is because of the dramatic increase in environmental issues which has led to new research and education. Some of this research is also improving our assessment capacity. Awareness of the present and future threats to biodiversity in California, and current perceptions of the barriers to surmounting these threats are summarized in the following two chapters, respectively. A second reason is more speculative, perhaps, but since it underlies the motivation for this book we state it boldly. The public is likely to be more proactive and less reactive to the problem of biodiversity loss in the future than it has
been in the past, simply because of increased awareness of society's dependence on biodiversity. In other words, our increased knowledge of the value of biodiversity and the threats to biodiversity makes us more likely to set a course of action and then follow it. The question remains, however, as to which course California will set. In the penultimate chapter we set forth our vision of a strategic plan for overcoming barriers and coping with threats to the preservation of California's remaining biodiversity.