Chapter XVI—
Jaén Province:
The Determinants of Growth
In order to proceed, I have divided the two provinces into a number of zones that I have sought to make geographically and economically homogeneous. They have been drawn on the basis of maps and studies of the physical landscape and geology and extensive personal travels throughout the two provinces by automobile. The purpose is to establish units with different social and agrarian patterns that can be used for a comparative analysis of their evolution.
The division of the province of Jaén into zones is not obvious. Except in the mountains, the region has a low rainfall, weather stations reporting a mean annual precipitation ranging from 487 millimeters at Cazalilla near the Guadalquivir River to 601 millimeters at Jaén. Conversely, evaporation is high everywhere. There is not much difference in annual mean temperature either, ranging from 16° to 18° centigrade. Climate, in other words, is relatively similar throughout the study region, with a cool, moist winter and spring, and a hot, dry summer.[1]
In the eighteenth century and still today, agriculture predominated over grazing, even in the mountain valleys; and agriculture was, and is, marked everywhere by a division between wheat fields and olive groves. The marls that predominate are excellent for olives but less favorable to
[1] Information on the geography and climate of Jaén province comes from Higueras Arnal, Alto Guadalquivir, and Lázaro, Elias, and Nieves, Regímenes de humedades. In addition, I was given invaluable help by don José María Ontañon and doña María del Carmen Cid of the Centro de Estudio Hidrográfico, Madrid, whom I consulted at length and who traced maps of the soils of Jaén for me.
the cultivation of wheat, and over the centuries olives have been gradually replacing wheat. Today there are districts where the rolling hillsides of red or brown earth are dotted as far as one can see with silvery green olive trees set out in precise geometric patterns, columns of plumed soldiers marching up hill and down. In few places of the world has reason tamed nature so successfully. Yet, lest we forget that this is Andalusia, the two or three trunks that make each tree, taunting imposed discipline, become circling dancers with arms flung back in their own flamenco ritual. But go on a few kilometers and the unbroken rows of trees give way to rectangles of alternating olive grove and grain fields, the latter verdant and waving in the spring, sprinkled with brilliant flowers, then brown and parched after the June harvest.
There are few level plains, for the basin of the Guadalquivir undulates in waves of different lengths, heights, and directions. On reaching the southern ranges, the land rises sharply, and a short way up the olive trees give way before thin soil or barren limestone rock, the stark mountains wrapped in flowing green polka-dotted skirts, Gypsy maidens decked out for a perpetual fiesta of the local Virgin. The richness of Jaén's rolling basin, with its broken pattern of olive groves, wheat fields, and stark white towns, the towering ranges on the south and east, the wild, wooded Sierra Morena on the north, make the province a constantly varied vision of beauty.
As is common in southern Spain, the inhabitants of Jaén are gathered into large settlements. In the census of 1786, Jaén had seventy-four cities and towns, with an average population of 2,380. Both for military defense and to escape the heat of summer and the danger of epidemics, most towns of Jaén stand white and nucleated at high points in their territories. Baños is a good example. In the Guadalquivir basin many sit on hilltops, and at the southern and eastern edges of the basin they are located up the base of the mountains, with their fields stretching out beneath them and the barren slopes above serving as protection from attack. The capital city, Jaén, at the foot of the Sierra de Jabalcuz, is a perfect example, dominated by the Castillo de Santa Catalina, which commands the two approaches from Granada, the older western road that circles the higher ranges and the newer road south through the sierra. On the northern limits of the province, the ranges are lower and several towns nestle in saddles where roads pass through the hills, as does Navas.
Close by the towns, where water flows either from streams or wells, lie the irrigated huertas with their vegetable plots and fruit trees. In the
eighteenth century, and still today, the closest land to the nucleus was called the ruedo, the most intensively cultivated zone that is not irrigated. Beyond is the campiña of the town, not to be confused with the term campiña applied generally to the basin of the Guadalquivir as opposed to the sierra. In the empty spaces between the towns of the basin there were, and are, scattered residences and farm buildings of the large estates, the cortijos that roused the ire of Carlos III's reformers and of those of the Second Republic and the casas de campo in the major olive groves. In the case of Baños, we saw that this land use reflects the pattern known as von Thünen's rings, with the intensity of cultivation depending not only on quality of soil and availability of water but on the distance from the town nuclei.
I divided the province into nineteen zones (Map 16.1). Five are located fully in the valley of the Guadalquivir, in the western part of the province. Three have rich soil, centering on the cities of Andújar (Zone JA); Arjona (JB), which includes the town of Lopera, studied in Part 2; and Linares (JE). In the ensuing analysis, they are referred to as rich basin zones. The two other zones in this region are further south, in a rolling plain where salt deposits have reduced the fertility of the soil. Santiago de Calatrava zone (JC), made up of three distinct blocks because of the way the municipal boundaries run, is near the Córdoba frontier, while Mengíbar zone (JD) is in the center of the province. They are called poor basin zones. South and east of this region are four zones whose towns have their lands in the valley of the Guadalquivir and their town nuclei against the foothills of the southern and eastern ranges. Identified here as south basin zones, they are Martos (JF), Jaén (JG), Mancha Real (JH), and Cazorla (JI). The Sierra Morena zone, JJ (Baños), is in the foothills of this range and is made up of the town we studied and a similar one called Vilches. Two rolling ridges or hog's backs (lomas ) rising between rivers in the northeastern part of the province are the location of four zones, the two to the west rich loma zones: Baeza (JK) and Ubeda (JL); and the other two poor loma zones: Santisteban (JN), which includes the town of Las Navas of Part 2, and Villanueva (JM). Finally five zones are located south of the basin of the Guadalquivir. Three of them are sierra zones, Bédmar (JO), Pegalajar (JP), and Cambil (JQ); and two lie in broad valleys in the south, isolated from the rest of the province, Alcalá la Real (JR) and Huelma (JS), the southern valley zones. Appendix P provides a detailed description of the geography, population structure, and political status of these zones.
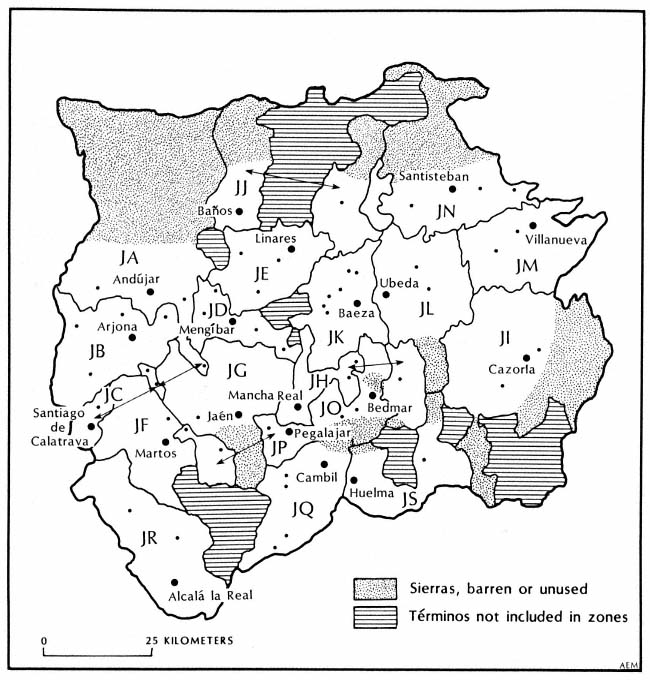
Map 16.1.
Zones of Jaén Province
2
Few readers will have been surprised to learn from the previous chapter that two types of economy existed in the provinces—market and local—and that they can be associated with different social groups, although the prominent role of nobles and clergy in commercial agriculture may seem paradoxical at first. If we turn to the data for the individual zones within the provinces, we can refine this simple observation, for the zones show that the different factors associated with the two types of economy come together in a variety of ways to produce distinct
subpatterns, which in turn help us to understand the economic forces at work in rural Spain at the end of the old regime.
When added to the deeds of deposit, the midcentury catastro and various censuses provide a diachronic perspective. The detailed information of the catastro on individual property holding in each town, which made possible the studies in Part 2, is unmanageable at the provincial level, at least for this study. The royal bureaucracy in the eighteenth century, however, extracted much of the information from the reports and their results have fortunately been preserved in most cases. The Archivo General de Simancas has a precise listing of the property of the largest owner in each town, the hacendado mayor, including his, her, or its (if it was an institution) name and residence. Simancas also has a copy of the responses to the forty questions that formed the first part of each town survey, with data on the number of vecinos, houses, people in various occupations, wages, prices, types of harvest, tithes, taxes, and similar matters ("Respuestas generales" or "Interrogatorio general"). Even these questionnaires are not readily usable in extenso—they may run to fifty folio sheets for one town—but their contents were extracted and tabulated in large volumes now in the Archivo Histórico Nacional. This series normally has three volumes for each province, the first ("Estado seglar") devoted to the property and other income of laymen and secular institutions (including the town council, that is, town property); the second ("Estado eclesiástico") for that of ecclesiastical institutions, foundations, and funds; and the third ("Eclesiástico patrimonial") for that of individual clergymen. For purposes of the present study, I have assembled these data, already quantified town by town, into totals for the zones within the province. Unfortunately, for Jaén only the volume summarizing the information of the secular estate has survived.[2]
A number of eighteenth-century censuses have been preserved that give the population (vecinos or total inhabitants) of individual towns. The "Vecindario general de España," located in the Biblioteca Nacional and already described in Chapter 1, gives the vecinos around 1712. The number of vecinos at the time of the catastro (ca. 1752) can be obtained from the respuestas generales, question 21, but it has also been tabu-
[2] For most towns the information is drawn from AHPJ, Catastro, maest. segl. The volumes with this information are missing for the following towns, and I obtained it from the copy in AGS, Dirección General de Rentas, Única Contribución, libros 323–27: Albánchez, Alcalá la Real, Cabra de Santo Cristo, Castillo de Locubín, Fuente del Rey, Higuera de Calatrava, Jabalquinto, La Guardia, Los Villares, Lupión, Marmolejo, Tobaruela, Torre del Campo, and Torrequebradilla.
lated from the towns of Salamanca province in a document in the Real Academia de la Historia.[3] The same place houses the original individual town returns of the census taken in 1786 and published the next year. These record the number of each sex, single, married, and widowed, in each of six age groups, as well as the number of individuals in various legal estates and occupations.[4] Finally, I have made use of the number of vecinos and inhabitants recorded for each town in 1826 by the royal geographer Sebastían de Miñano.
The information on the sales has been described in the last chapter. It is now, however, broken down by zone, and within each zone by level of buyers.[5] The level of each buyer is determined by his location on the Lorenz curve of the zone.[6] Thus in a zone where purchases were priced low, a buyer who appeared in Level 3 or even 2 in the province may be placed in Level 4, and vice versa. Buyers in Level 4, or any other level, do not spend equal amounts of money from zone to zone and are not equally wealthy. Table 16.1 gives a sense of the difference among the zones in Jaén province in this respect. It shows the mean purchases of Level 1 and Level 4 buyers and of all buyers in each zone. If one compares the mean amount spent by all buyers in each zone, as shown in this table, with the mean town population in each zone (Table 16.2), one finds a rough, direct relationship (r = .52). One can deduce that, as a general rule, in larger towns, the upper levels of society, those that furnished the buyers of disentailed properties, had more money than the corresponding levels in smaller towns. The correspondence is far from exact, however, r2 = .275, meaning that only about one-fourth of the variation in the amount spent can be attributed to the size of the towns in the zones.
By using the commercial market–local consumption spectrum that emerged from the global look at the two provinces, one may distinguish the zones in Jaén province by the strength of the orientation of their agriculture toward a wider market, as revealed by the nature of the prop-
[3] Real Academia de la Historia, leg. 9-30-3, 6258, no. 13. It is dated 30 Jan. 1760, but it comes from the returns of the catastro. Ibid., no. 14, is a later census of vecinos dated 14 Aug. 1772. I entered it in my analysis, but it proved of little use.
[4] Ibid., legajos 9-30-2, 6228 and 6240–42; 9-30-3, 6259.
[5] All sales but one (in an isolated town not included in any zone) could be assigned to zones. Where the location of the property was not specified in the deed of deposit, I assigned the sale to the zone in which the religious institution that was the former owner was located. No doubt some lay elsewhere, but not enough to invalidate the analysis. The number of sales in each zone is JA, 186; JB, 147; JC, 22; JD, 28; JE, 179; JF, 283; JG, 911; JH, 289; JI, 263; JJ, 116; JK, 762; JL, 482; JM, 273; JN, 208; JO, 47; JP, 160; JQ, 59; JR, 146; JS, 80; Total 4,641.
[6] See Chapter 15, section 1, esp. Fig. 15.1.
| ||||||||||||||||||||||||||||||||||||||||||||||||||||||||||||||||||||||||||||||||||||||||||||||||||||||||||||||||||||||||||||||||||||||||
erties disentailed. For instance, although some olive oil was consumed locally, one can posit that most owners and buyers of olive groves were conscious of a national and even an international market and involved in it. Unfortunately, arable land, the largest type of purchase, involving 32 percent of the money spent, could produce wheat and other grains either for local consumption or for the broader market, so that the amount of it disentailed in each zone does not help one distinguish the economy of the zone. On the other hand, cortijos and other rural estates, which can be identified, did produce primarily for the broader market. Table 16.3 and Map 16.2 distinguish the zones by the percent of the total purchases devoted to olive groves and to rural estates. The higher the readings, the more the zone can be assumed to produce for the market economy.
Olive groves are strong in the north and west of the province, cortijos in the south and east. The only zones with strength in both types of cultivation are Andújar (JA), bordering Córdoba province on the Guadalquivir River, and Mancha Real (JH), between the Guadalquivir and the southern ranges. The two zones in the northeast (JM, JN) and a belt of
| ||||||||||||||||||||||||||||||||||||||||||||||||||||||||||||||||||||||||||||||||||||||||||||||||||||||||||||||||||||||||
zones in the center and south (including the zone of Jaén city) do not show up as high in either type of clearly commercial property (JD, JF, JG, JK, JP, JQ, JR).
To understand better the economy of the various zones, one can distinguish them according to the orientation toward the market of the different levels of buyers. The purchases of each level show if it was primarily interested in buying properties directed toward market production and was able to acquire them. I shall divide the zones into three
| ||||||||||||||||||||||||||||||||||||||||||||||||||||||||||||||||||||||||||||||||||||||||||||||||||||||||||||||||||||||||||||||||||||||||||||||||
categories according to these criteria, using the premise that olive groves and cortijos were engaged more in market production than other types of property. Some grain grown in small plots was also destined for the outside market, of course, but since much of it would be for local consumption, the marketed proportion of the grain not grown in cortijos would be less than that of the cortijos. Vines would also be directed toward an outside market, but most fruits and vegetables would be too perishable.
The three categories of zones are as follows:
Type A. All levels of buyers into the market. Those zones where both Level 4 and Level 1 buyers directed their purchases toward market-oriented properties. To qualify for this type, Level 4 buyers (highest) must devote the largest share of their purchases to olive groves or rural estates or both together, and Level 1 buyers (lowest) must either devote a larger share of their purchases to olive groves than to arable or must
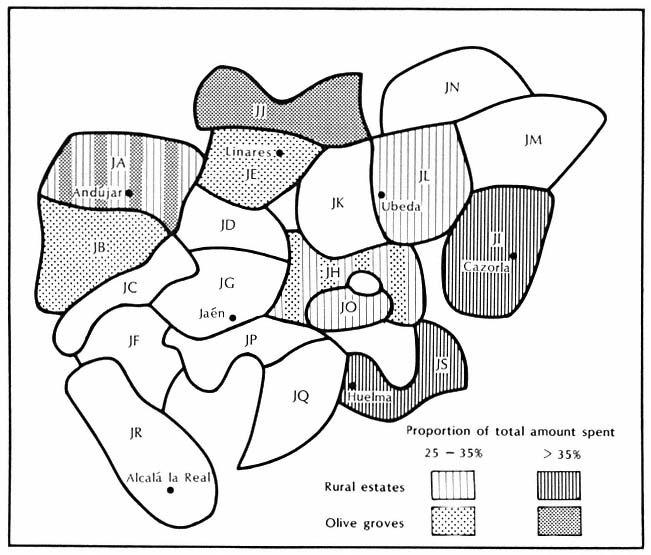
Map 16.2.
Jaén Province, Rural Estates and Olive Groves in Disentail, 1799–1807
have olive groves as their next choice after arable. The second alternative for Level 1 buyers is necessitated by the fact that in most zones sales of arable outweighed considerably sales of olive groves, so that Level 1 buyers, even if they preferred olive groves, had more arable available to purchase. Zones where Level 1 buyers preferred urban properties, improved or irrigated plots, or the redemption of censos to olive groves do not qualify for this type.[7]
Type B. Top levels of buyers into the market. Those zones where Level 4 is into the market but Level 1 is not, under the terms defined above. These are primarily zones strong in cortijos, where Level 1
[7] In Zone JO, Level 1 preferred improved or irrigated plots to olive groves (24 percent to 21 percent), but they also bought many vineyards (14 percent). Since vineyards produced for the market, I have included this zone in this category. (It is impossible for Level 1 buyers to have rural estates as their preferred type of purchase, since most of these were cortijos, whose price was greater than the total amount spent by someone in Level 1, and thus rural estates are not used as a criterion for considering the market orientation of these buyers.)
| ||||||||||||||||||||||||||||||||||||||||||||||||||||||||||||||||||||||||||||||||||||||||||||||||||||||||||||||||||||||||||||||||||||||||||||||||||||||||||||||||||||||||||||||||||||||||||||||||||||||||||||||||||||||||||||||||||||||||||||||||||||||||||||||||||||||||||||||||||||||||||||||||||||||||||||||||||||||||||||||||||||||||||||||||||||||||||||||||
buyers did not have available olive groves that would put them into the market.[8]
Type C. No levels of buyers into the market. Those zones where neither Level 4 nor Level 1 is into the market as defined above. Although these zones obviously sold some produce on the outside market, the nature of the properties that were disentailed indicates that this commerce was not conducted on a major scale and was not the primary objective of local agriculture.[9]
Table 16.4 shows the distribution of the zones into these three types.
3
One may now proceed to compare these different types of zones on the basis of other known characteristics. For instance, the mean amount spent by the buyers in each zone proves to be related to the extent that the buyers were into the market. If one ranks the zones according to the mean amount spent and draws a line between numbers 11 and 12, as is done in Table 16.5, one finds that seven of the nine zones in Type A (all levels into the market) and four of five zones in Type B (top levels into the market) are above this line. All the zones in Type C (no levels into the market) are below the line. Zones JH and JO, belonging to Type A, fall below the line. The considerably smaller mean amount spent by their buyers than those of other zones in Type A indicates that these two zones had a distinct economic level and deserve to be grouped separately. I have therefore divided Type A into Types A1 and A2 . The same is true for Zone JQ in Type B, which becomes the only zone in Type B2 . These subcategories are already incorporated in Table 16.4. Henceforth most of the discussion will exclude Type A2 and Type B2 zones, which are too few in number to draw conclusions about the significance of their characteristics. With these exceptions, being into the wider market, whether by all levels of buyers or by the top levels, meant that the properties sold in the zone were more expensive and the average buyer spent more than in the zones that were not into the market.
[8] Zone JP shows a high demand among Level 1 buyers for improved or irrigated plots (23 percent). Some of these were probably devoted to market gardening for nearby Jaén city, but I do not count this as production for a wider or national market.
[9] This categorization ignores the purchases of Levels 2 and 3. In most cases Level 2 preferences reflect Level 1, while Level 3 is closer to Level 4. Thus Type A is properly called "All levels of buyers market oriented" and Type B "Top levels market oriented."
| ||||||||||||||||||||||||||||||||||||||||||||||||||||||||||||||||||||||||||||||||||||||||||||||||||||||||||||||||||
Map 16.3 shows that these types reflect geographic affinities. Except for the two unclassified poor zones, JC and JD, marked by infertile soil, small towns, and few purchases, most of the central and west of the Guadalquivir valley consists of Type A zones (all levels into market). Type B zones (top levels into market) form a ring around this block on the east and south, while Type C (no levels into market) are peripheral in the northeast and southwest. Only one Type A zone is not contiguous to the others, JR (Alcalá la Real), made up by the three rich valleys in the southwest. Type A2 zones (all levels into the market, small purchases) lie next to each other on the eastern edge of the A zones, and the B2 zone (top levels into the market, small purchases) is nearby, in the long valleys above Jaén city.
Because of the way in which being into the market is determined, with the bottom levels depending on the purchases of olive groves and the top levels on either olive groves or rural estates, one would expect Map 16.3 to reflect closely Map 16.2, which shows the zones of heavy purchases of olive groves and rural estates. There is a similarity but by no means an identity. All the zones that had a large proportion of their
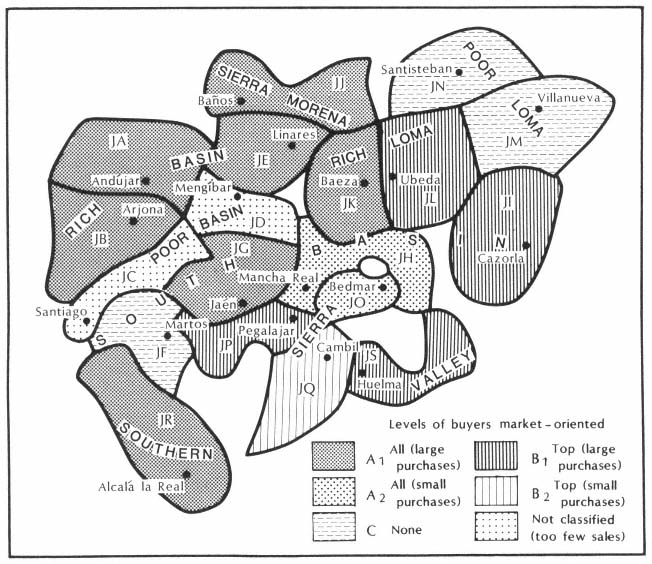
Map 16.3.
Jaén Province, Types of Zones
sales in olive groves do, in fact, fall into Type A (except Zone JC, not classified for lack of sufficient sales), but so do four other zones that were not strong in olives. In three of these, the small buyers sought the available olive groves within their means, while the upper levels went for rural estates. In the fourth, JO (a Type A2 zone), Level 1 got into the market by buying vineyards as well as olive groves. Three of the six zones strong in rural estates thus fall into Type A, leaving only three others for Type B, along with two others not strong in rural estates. Those zones that had a large share of their sales in either rural estates or olive groves belong to one of the types that were into the market—and quite properly so—but by concentrating their purchases on the available rural estates (JP) or olive groves (JQ), the upper level of buyers placed two other zones among those where the upper levels were into the market.
One may question whether the division of the zones into these three types in reality represents different orientations toward the wider mar-
ket. It could, for instance, be simply a reflection of the size of their towns, with Type A zones containing the largest towns and Type C the smallest. (One recalls that we have found a rough correlation between the mean size of the towns and the mean amount spent by the purchasers.) If one treats these three types of zones as random samples drawn from an imaginary larger population of zones with similar characteristics and applies a test of significance to the differences in the size of their towns in 1786, one finds no significant relation between town size and the three types. The mean town size has the expected trend, but the difference in town size varies so widely within each type of zone that the difference is not significant.[10] The three types of zones thus reflect something other than town size.
Another possibility would be that the types offer a measure of general economic activity and not simply the market orientation of agriculture. To explore this possibility, one must go back fifty years to the information in the catastro. Table 16.6 shows the proportion of artisans and craftsmen among the vecinos in each zone in the early 1750s. On the surface, the three types of zones do seem related to artisan production. The mean number of all craftsmen per thousand vecinos declines from Type A1 , to B1 , to C and, disaggregating the crafts, so do the numbers of carders and weavers and of tailors. On the other hand, the number of sandalmakers (alpargateros) per thousand vecinos is highest in Type C zones and lowest in Type A1 , responding perhaps to the greater isolation of Type C towns. Tests show that these trends are not significant, however, because of the wide variation among the readings within each type of zone (again treating the three types of zones as if they were random samples drawn from a larger population). The same is true of the income of the retail food stores per vecino, although here there is a hint of a possible relationship.[11]
In fact, other factors can be more readily associated with at least two types of crafts. The concentrations of carders and weavers, for instance, are found in the zones with the largest mean town population, and indeed, they are located in the large towns. Jaén, Ubeda, Baeza, Alcalá la Real, and Andújar, the only municipalities in the province with over two thousand vecinos, had 109 of the 115 carders in the province and 148 of the 156 weavers. Alpargateros also have a different association.
[10] Mean town population: Type A = 3,230, B = 2,960, C = 2,680. Despite the apparent trend, the null hypothesis, that all three types come from the same parent population, is not disproved by an analysis of variation, whether one uses the mean town population for each zone, or the individual population readings of all the towns.
[11] An analysis of variation shows F = 1.75. For a 20 percent probability, F = 1.87.
| |||||||||||||||||||||||||||||||||||||||||||||||||||||||||||||||||||||||||||||||||||||||||||||||||||||||||||||||||||||||||||||||||||||||||||||||||||||||||||||||||||||||||||||||||||||||||||||||||||||||||||||||||||||||||||
The high concentrations (over ten per thousand vecinos) all occur in the four loma zones and Cazorla, contiguous in the east. Theirs was a regional specialty.
On the other hand, one kind of activity recorded in the catastro correlates well with the three types of zones. This is the income of muleteers (arrieros). Table 16.7 shows the income per vecino from muleteering in the zones, and Map 16.4 locates the towns that reported income from
| |||||||||||||||||||||||||||||||||||||||||||||||||||||||||||||||||||||||||||||||||||||||||||||||||||||||||||||||||||||||||||||||||||||||
muleteering. Type A1 zones have a mean per vecino income from arrieros of 19.5 reales; Type B1 , 5.8; Type C, 0.9. An analysis of variation shows that there is less than a 5-percent probability that these differences occurred by chance. Even more conclusive is a comparison of the number of towns in each type of zone that had a major sector of muleteering (here defined as having a minimum of one thousand reales total annual income for all the arrieros in the town). Eighteen of twenty-seven towns in Type A1 , zones reach this figure, three of twelve in Type
Map 16.4.
Jaén Province, Income from Muleteering, ca. 1750
B1 , and only one of eleven in Type C. The difference in proportions is significant at the 1-percent level.
Of course, active muleteering could be independent of the nature of local agricultural production, as is shown by zone JQ, the deviant case labeled Type B2 . It had the largest arriero income per vecino of all the zones. It lay on the new road from Madrid to Granada through the sharp valleys south of Jaén city, and all its arriero income came from the two towns nearest the border with Granada, Campillo de Arenas and Noalejo. Relatively small mountain towns, they specialized in transport independently of their agricultural activity. Zone JD was a similar
case, second in income per vecino from arrieros only to JQ. All of its arrieros were located in one town, Mengíbar, site of the main ford across the Guadalquivir River on the way south to Jaén and Granada. A small town, it was nevertheless the largest of five in this poor valley zone and prospered from its location. Surrounded by zones actively into the market (Type A1 ), it stood in a natural spot to develop muleteering.[12] Elsewhere the variation in the amount of muleteering income among the three types of zones lends support to the proposition that the types do in fact represent different orientations toward commercial agriculture. Although positive proof is lacking, all the information adduced leads to the conclusion that the three types of zones differed in the market orientation of their agriculture but not significantly in other forms of economic activity except muleteering, which can be seen as a forward linkage of commercial agriculture.
4
Having determined the extent of the involvement in the market of the agriculture of the different zones, we may proceed by observing how this factor is related to their social structure. To begin with, I shall use the information provided by the sales during the disentail. One statistic is especially revealing: the proportion of the buyers who were notables (as defined in Chapter 15). Table 16.8 gives these figures for Levels 1 and 4 and all buyers, broken down by type of zone. Among the three types of zones, there is a significant difference in the proportion of buyers who were notables. Zones with all levels of buyers into the market (Type A1 ) had the highest proportion (46 percent), zones not into the market (Type C) the lowest proportion (30 percent), while those where only the top levels of buyers were into the market were in between (35 percent). This trend appears also among Level 1 (small) buyers, but not to a statistically significant extent among Level 4 (large) buyers. The previous chapter showed that there were many more notables among the top buyers in the province as a whole, and the table shows that to be the case in the individual zones (except the zones not included in the three types because they had few buyers). Not here, however, but in the lower levels does a clear pattern emerge of the proportion of buyers who were notables directly correlated to the extent of involvement in the wider market.
[12] For its location at the main ford, see Biblioteca Nacional, Tomás López, "Atlas particular," and Laborde, View of Spain 2 : 108.
| ||||||||||||||||||||||||||||||||||||||||||||||||||||||||||||||||||||||||||||||||||||||||||||||||||||||||||||||||||||||||||||||||||
The census of 1786 reveals that the pattern was not peculiar to buyers alone but characterized the population as a whole. The zones where all levels of buyers were into the market (A1 ) were those with the largest proportion of nobles among the residents. The census called for an enumeration of the hidalgos in each town, a piece of information not included in the questionnaire or provincial summaries of the catastro. Table 16.9 shows the number of hidalgos per thousand adult males in each zone. In many respects the accuracy of the census for Jaén is suspect, as already noted in the case of Baños, so that the number of hidalgos reported may not be correct. The trend is clear, however. The ratio of nobles to adult males is distinctly higher in all but two Type A1 zones than in Type B1 , zones (the two deviant A1 , zones are contiguous in
| ||||||||||||||||||||||||||||||||||||||||||||||||||||||||||||||||||||||||||||||||||||||||||||||||
the north center). Two of the Type C zones show a lower proportion of hidalgos than the large majority of Types A1 and B1 zones, but the third, JM in the northeast, has the highest ratio of all zones. (The high count is in the two newer towns Villacarrillo and Villanueva del Arzobispo, the other older, pre-conquest town Iznatoraf reported only one noble. One cannot tell from the data whether the deviance of JM is real or the result of an enthusiastic census taker.) Except for these three cases the pattern reflects the picture drawn from the sales: the more fully a zone was involved in the outside market for agricultural products, the larger was its class of hidalgos.
This information permits us to look again at the conclusion reached in the last chapter about the relation between social class and commercial agriculture. The data in Tables 16.8 and 16.9 indicate an apparent paradox. The zones of local economy (Type C), where the average amount spent by the buyers was low, mostly located on the periphery of the province, had the fewest nobles and the most distinctly stratified group of buyers (small buyers having a far smaller proportion of nobles than large buyers). By contrast, the wealthy zones, where all levels of buyers were into the market and the average amount spent by buyers was high, had the most nobles and reveal the least stratification among
the buyers. The percentage of nobles is higher and more evenly distributed among the levels. Zones in which only the top levels of buyers were into the market lie in between.
If one recalls from Part 2 the contrast between Baños and Lopera on one hand (both located in zones where all levels of buyers were into the market, JJ and JB), and Navas on the other (zone JN, no levels into the market), one can posit a conclusion. The first two had a wealthy resident elite headed by a number of hidalgo families. Their elite formed a distinct layer at the top of the social pyramid (8 percent of the vecinos in Baños, 10 percent in Lopera, see Tables 11.20 and 12.14), which ran their towns and extracted wealth from the land without getting their hands dirty. But in Navas there was only one landowning don out of 214 male vecinos, the notary. The information provided by the present chapter indicates that this contrast can be generalized to the entire province. One can conclude that there were two distinct typologies of social structure in Jaén province. Towns in zones actively engaged in commercial agriculture attracted more wealth and developed a strong resident economic, social, and political elite of which hidalgos formed a major part. Nonnobles were a vast majority of the vecinos, but among the buyers they were a bare majority (a minority in two zones), and even at the lowest level of buyers they were not an overwhelming majority. The conclusion of the last chapter is reinforced: the presence of commercial agriculture and a strong resident hidalgo class went hand in hand.
At the other extreme, areas involved primarily in a local economy did not produce or attract a resident elite of this nature. A few hidalgos were present and formed the apex of the social pyramid. When they bought disentailed lands, they sought the best properties, having the most money to spend, and dominated the top level of buyers, where they might be joined by outsiders. But they left to local commoners the largest amount of land put on sale. Although there was greater disparity in the composition of the buyers, this reflected a smaller and weaker, not a stronger, local elite.
Type B zones, where the top levels of buyers were into the market, are a halfway stage between the two extremes. Disentailed property here was split more evenly between what was commercially oriented and what was produced for local consumption. The elite of notables, smaller than in Type A zones, stressed the purchase of market-oriented properties, leaving the less expensive properties to the noncommercialized, nonnotable sector of the towns.
5
This analysis of the relationship between the different types of agricultural activity and social structure offers a static picture of the rural world of Jaén at the end of the old regime. Our next task will be to make the picture move, to demonstrate evolution during the half century under study and discover the forces at work. The data will not always permit the sequence to be fully in focus, but the picture will be instructive, nonetheless.
One may start by determining in which zones the market economy was expanding. For this purpose, one would like to compare the proportion of land devoted to harvests for the market at the time of the catastro with that shown by the sales, but the data available do not permit so precise a comparison. The catastro of each town states the area devoted to each type of cultivation and the value of the annual harvest,[13] while the records of the sales give the price but not always the size of the ecclesiastical properties that were sold. The extent of land devoted to the various harvests at the time of the sales is unknown, but from the available data one can compare the value of land devoted to cereals and olive groves at the time of the catastro with that shown by the sales. If the ratio of olive groves to arable shows an increase between the two dates, one can assume increasing production of olive oil for the market. There is unfortunately no way of determining an absolute increase in grain production for the market, but because the demand for olive oil was outdistancing that for grain, as will be explained below, greater participation in the market was likely to show up as an increasing ratio of olive groves to arable.
Even here there are difficulties. One saw in Chapter 5 that the ratio of catastro value to sales price varied widely among the properties devoted to different cultivations. One must adjust for the different markup of the two types of property when comparing figures from the two sources. Table 16.10 shows the results.
My comparison of the figures (Column D of Table 16.10, which measures the change in olive tree cultivation vis-à-vis arable in each zone) is based on three assumptions, all of them open to some error: (1) that the sales represent a true cross section of the cultivated land in each zone between 1799 and 1807; (2) that the ratio of the markup of olive groves
[13] This information is in the introduction to the survey of property owed by laymen in each town, the libro maestro seglar. Where maest. segl. is lost, I used the earlier estimate in AGS, resp. gen. QQ 10, 12, 13, 14 (see n. 2 above).
| ||||||||||||||||||||||||||||||||||||||||||||||||||||||||||||||||||||||||||||||||||||||||||||||||||||||||||||||||||||||||||||||||||||||||||||||||||||||||||||
to arable between the catastro and the sales is everywhere similar (that is, 43 : 24); and (3) that the lands sold whose use is not specified are on the whole arable. How open to error this procedure can be is seen in the figures for zones JK and JN, both of which show a considerably smaller ratio of olive groves to arable in the sales than in the catastro. If one assumes that olive cultivation was expanding at least as fast as grain production, the readings for these zones suggest that one should allow a margin of error of at least 50 percent in comparing the two ratios. Greater growth than 50 percent in Column D provides a strong presumption of expansion of olive groves in the second half of the century. Zones JR, JL, JP, JS, JH, JO, JQ, and JC show such expansion.
Map 16.5 makes the result visual. Assured growth occurred primarily in the south of the province: the three southern sierra and the two southern valley zones. Two other zones were contiguous to older olive regions, JC in the west and JL on the Loma de Ubeda, next to Baeza zone. The other zone to show growth, JH (Mancha Real), was the only Guadalquivir basin zone with an established olive production at mid-
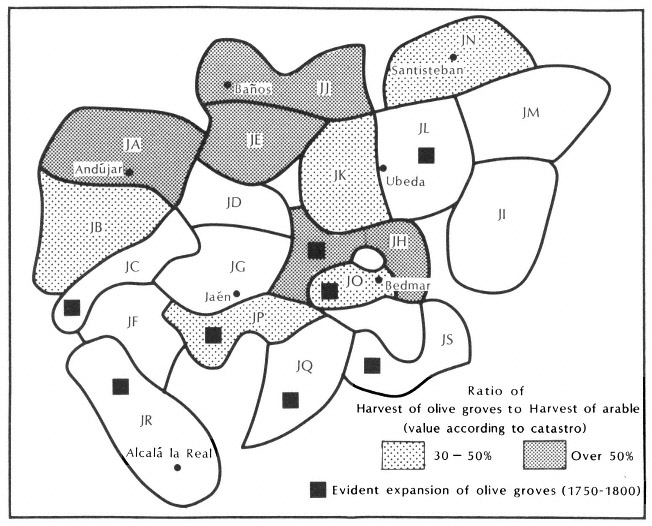
Map 16.5.
Jaén Province, Concentration of Olive Groves, ca. 1750,
and Expansion of Olive Groves, 1750–1800
century that definitely revealed expansion. The traditional olive areas in the north and west, Andújar, Arjona, Linares, Baños, and Baeza, either did not expand olive groves or expanded so little as not to show up in this analysis. (Zone JN, also an olive zone in 1751–53, showed an apparent decline in olives and in the sales appeared as a region not into the market. It was a marginal zone as far as commercial agriculture was concerned. Las Navas was located here.) On the other hand, five of the eight zones of confirmed growth had few olive trees in 1750.
This apparent paradox may be partially the effect of the statistical procedure: it is easier to achieve a high proportional increase when starting from a low base. The range of the estimates in Column D is so wide, however, as to indicate that the difference in rate of growth was real. For all the shakiness of the table, it suggests that the expansion of olive production in Jaén province took place in waves. A first wave, antedating 1750 and not observed in this study, had affected the rich basin zones JA (Andújar), JB (Arjona), JE (Linares) as well as the two loma zones JK (Baeza) and JN (Santisteban) and the Sierra Morena zone JJ (Baños). In the half century of this study growth here either slowed or came to a halt. Other zones that had turned toward olives before 1750 continued to expand, JH, JO, and JP. JH (Mancha Real) was in the basin south of the river, JO (Bedmar) and JP (Pegalajar) in the sierras nearby. Finally, a new wave of expansion after 1750 hit many of the zones not previously affected, leaving only two in the east and a belt of three in the center still strongly committed to grain as the cash crop in 1800. These last, oddly, include Martos (JF) and Cazorla (JI), today among the areas in the province most intensively dedicated to olive cultivation. Apparently their specialization did not begin until after the fall of the old regime.
That most zones strongly devoted to olive cultivation in 1750 give little evidence of growth in production over the next half century presents a puzzle. During this period the price of olive oil rose somewhat faster than that of wheat. According to the price tables published by Earl Hamilton for New Castile, if the mean of annual prices for the decade 1751–60 is assigned the index number 100, during the decade 1791—1800 the mean price of wheat was 196, of olive oil 230.[14] At the end of the century olive oil had a wider market than wheat. It was being exported from Spain to northern Europe, whereas the market for wheat was limited to central Spain, since the periphery imported grain from
[14] Hamilton, War and Prices, Appendix 1.
abroad.[15] Why should landowners already engaged in producing olive oil not continue to push into an expanding market? The answer may be economically rational if one considers that the expansion of olive groves could entail taking over arable land. The use of labor for the cultivation of olives and grain is complementary. The harvests are about six months apart, with olives in winter and grains in the summer, and the plowing of olive groves and the pruning and care of the trees can be done during the slack seasons for grain growing (Figure 16.1). So long as the local labor did the cultivation of olives, the opportunity costs of expanding olive production were low. Although the chapters on Baños and Lopera show that migratory labor was used for grain harvests and thus presumably was available for olive harvests as well, the marginal cost of migratory labor would be higher. The differential rise in the price of olive oil was not great enough to encourage unbalancing the established economy by turning grain fields to olive groves. Pastures and wastes would be sacrificed, but most of these were public lands and could be turned to private use only by corrupt means. Expansion into pastures and wastes was probably going on, but if a balance of wheat and olives was being maintained, it would not show up in Table 16.10. In other words, under prevailing circumstances, there was a limit to the proportion of land that could be economically devoted to olives, and the older olive regions of the Guadalquivir basin appear to have approached this limit by 1750. Only a sharp drop in the price of wheat vis-à-vis olive oil, such as occurred at the end of the nineteenth century when American wheat invaded the world market and the international demand for olive oil rose sharply, would create conditions that would encourage the expansion of olive groves beyond this limit.[16]
If this were the full explanation, the proportion of land devoted to olive production would have stopped in all zones at about the same level. This was not the case, however. In the zones that showed no clear growth between 1750 and 1800 (JA, JB, JE, JJ, JK), the ratio of the value of olive harvest to arable harvest ranged from 34 to 225 percent in the 1750s. The ratio was highest in Andújar (JA), a zone that in many ways was unique. The mean amount spent here by buyers was twice as high
[15] According to Laborde, View of Spain 2 : 75, 132–33, Cádiz and Málaga exported olive oil to northern Europe (along with wines and dried fruits). Townsend, Journey Through Spain 3 : 30, corroborates the export of oil from Málaga. Laborde says Andalusia also shipped some oil (together with much wheat) to other parts of Spain (2 : 131). For wheat imports to Spain: Anes, "Agricultura española," 258.
[16] For the expansion in demand of olive oil after 1880, especially in South America, see Vicens Vives, Historia 5 : 238–39.
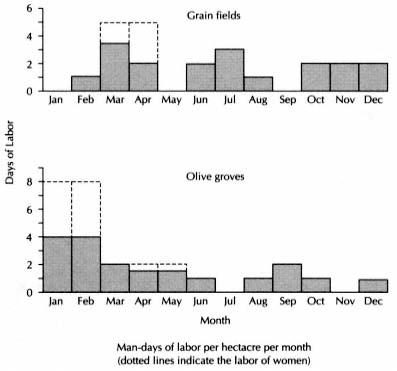
Figure 16.1.
Seasonal Demand for Labor in Grain Fields and Olive Groves
SOURCE . Martínez Alier, La estabilidad del latifundismo. Appendix 1,
no. 3, pp. 350–51 (based on Consejo Económico Sindical de Córdoba,
"Bases para un plan de desarrollo económico de la provincia," June 1962).
NOTE : The greatest demand for labor comes in February and March. In
February the end of the olive harvest overlaps with fertilizing the arable
(a task perhaps not performed in the eighteenth century). In March, pruning
and cultivating the olive trees overlaps with weeding the grain fields. Much
of the harvesting of olives and weeding of grain fields is done by women.
as in any other zone (Table 16.1), and the total land disentailed that was olive groves and cortijos was higher than in any other zone (76 percent, Table 16.3). One can see some reasons for its peculiarities. Within it lay the wide alluvial basin of the Guadalquivir River, the most fertile soil in the province. The English traveler Joseph Townsend commented on its location "in a rich and highly cultivated plain," and the Frenchman Alexandre de Laborde noted that "the land about is very fertile and produces a great deal of corn, oil, wine, honey, fruit and game."[17] Equally important, no doubt, was its location on the highway from Ma-
[17] Townsend, Journey Through Spain 2 : 296–97; Laborde, View of Spain 2 : 111.
drid to Seville and Cádiz. The continual traffic on this road, making it easy to import grain and migrant labor, combined with its fertility, could encourage its landowners to develop olive production beyond the level of the balance with arable that would be favored elsewhere. Evidence for the importance of the Andalusian highway is also provided by Baños (JJ) zone. Also on the highway, it was the other zone that had stabilized at a high ratio of olives to arable (107 percent).
6
If we return now to the categorization of the zones into three types of orientation toward the outside market at the end of the century, we find a clear and suggestive relationship between these categories and the evidence of increase in olive cultivation (Table 16.11). Type A1 zones, where all levels of buyers were into the market, show little expansion (only one zone of seven). These are the zones of relatively large, established hidalgo elites. At the other extreme, all three Type C zones, not into the market, also show no evidence of significant expansion of olive production. Expansion occurred in Type B1 zones (three of four), those with only the top levels of buyers into the market and thus with a narrower elite than A1 zones. Four other zones also gave evidence of expansion. Three were the deviant cases of types A and B, those that were into the market but with average purchases much lower than the majority of the zones of their types, and the fourth was zone JC, not included in any type because of its few sales. The B2 zone was acting like B1 zones, expanding its olives. The difference that calls for explanation is between A1 and A2 zones, since the former were not expanding their production. Table 16.8 shows that the A2 zones (the two contiguous zones east of the zone of Jaén city, JH, Mancha Real and JO, Bedmar) had a similar percentage of their buyers who were noble as the A1 zones. There was also much income from arrieros in this region, concentrated in JH zone (see Table 16.7 and Map 16.4), another characteristic of A1 zones. Although similar in these respects to A1 zones, the A2 zones had not seen their wave of expansion recede by 1750 and were still in full growth. Perhaps their distance from the major arteries of traffic explains their late blooming and the modest fortunes of their elites. If so, they provide another example of the influence of communications on economic growth.
The main conclusion to draw from Table 16.11, however, is that the zones where the top buyers were devoting the largest proportions of their capital to acquiring cortijos were those where the expansion of
| ||||||||||||||||||||||||||||||||||||
olive production was most pronounced. (Compare Table 16.4, Types A2 and B1 .) Commercial agriculture was old here, but it had been directed to grain production, hence the cortijos; now the rural entrepreneurs were discovering the advantages of olives, for they were nowhere near the limit of efficient use of labor in the olive groves.
An apparently extraneous factor may clarify the forces at work, the jurisdiction over the towns. Spanish municipalities could be under any of four types of jurisdiction: (1) directly under the crown (royal or realengo ); (2) under lay señores, that is held by a hereditary grant to a noble family (señorío lego ); (3) under ecclesiastical señores, such as episcopal sees and monasteries (señorío eclesíastico ); and (4) under the military orders founded in the Middle Ages (señorío de orden militar ). The last were effectively under the crown since the king of Castile became the permanent grand master of the orders in 1523. Table 16.12 shows the percentage of each type of zone under each jurisdiction. It is based on the population rather than the number of towns, so as to avoid giving undue weight to small places, of which many were under señorío lego. Towns in A1 zones, which experienced the wave of growth in olive production prior to 1750, were overwhelmingly under royal jurisdiction (89 percent of the population), either in royal municipalities or in the territory of the Order of Calatrava. In Type C zones, not into the market and not expanding, only 46 percent of the population lived under royal jurisdiction. Except for Type B2 (zone JQ), those zones experiencing the current wave of expansion (Types A2 , B1 ) were closer to Type C than to Type A1 , zones, with respect to the jurisdiction under which they lived.
| |||||||||||||||||||||||||||||||||||||||||||||||||||||||||||||||||||||||||||||||||||||||||||||||||||||||||||||||||||||||||||||||||||||||||||||||
Why was this so? Did señorío retard economic growth, or did the kings of Castile, when they gave towns to new lords, consciously retain for themselves the ones that were most economically evolved? The rulers had granted seigneurial jurisdiction over the towns of Jaén at various times (Map 16.6). Since the province formed a part of the frontier of Granada until the conquest of this kingdom, strategic considerations were central to the early decisions on jurisdiction. In 1231, before the conquest of the kingdom of Jaén was complete, Fernando III assigned the strategic fortress of Quesada, on the southeastern frontier, to the archbishop of Toledo to capture and defend. Quesada soon fell, and in the next twenty years Cazorla and Iznatoraf and the villages in their region were added to what became known as the Adelantamiento de Cazorla, under the jurisdiction of that prelate, who ruled through a local official called the adelantado until the seventeenth century. The Muslims captured Quesada in 1303, and after it was recovered, Alfonso XI kept it under the crown, subject to the city of Ubeda. The rest of the adelantamiento remained with the archbishop through the eighteenth century. Cazorla was the main center south of the Guadalquivir, but to the north Iznatoraf was superseded by two villas created by the archbishop in the late fourteenth and fifteenth centuries out of villages within this town's limits: Villanueva del Arzobispo and Villacarrillo.[18] Elsewhere in Jaén, the usual royal policy was to keep the main towns and those along the frontier under the king's jurisdiction. Of the latter, only Bedmar received a señor before 1400. Various places in the north of the province were given out before 1410, notably the jurisdiction of Santisteban del Puerto and some towns between Bailén and Baeza, but not these two important centers. As the war against Granada proceeded in the fifteenth century, the two frontier fortresses of Alcaudete and Huelma received señores, as well as Bailén. The remaining seigneurial jurisdictions were granted by the Habsburgs, except for the small town of Los Villares in the southern sierra apparently not given out until Felipe V.[19]
In the eighteenth century the king still had the towns along the main highways to Seville and Granada except Bailén on the Andalusian highway, Alcaudete on the old road to Granada, and Noalejo on the new
[18] Rivera Recio, Adelantamiento. I am indebted to Stanley Brandes for this reference.
[19] See Ladero Quesada, Andalucía, 56–64, for the fifteenth century and earlier, and Guia oficial de España, 1902 , 244–322, for the rest. The latter gives the date of the original grant of the title. It may not coincide with the grant of señorío over a specific town, but it is the best evidence readily available.
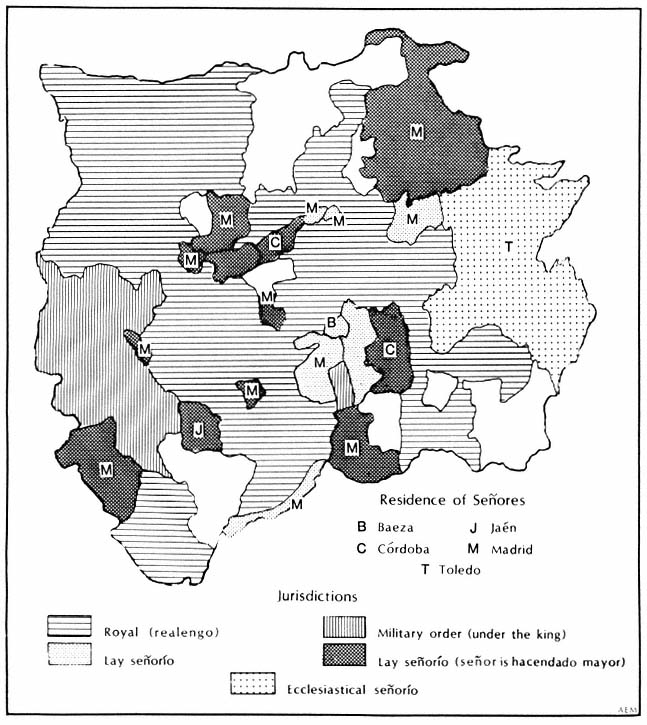
Map 16.6.
Jaén Province, Jurisdictions and Residences of Señores
one. Through the Order of Calatrava he also held the west. Although strategic considerations entered into the alienation of jurisdiction, conscious economic planning does not seem to have been involved. The economic evolution of the towns under lay señorío thus appears to have been more an effect than a cause of the type of jurisdiction.
Señores received tribute from their towns, but the case of Navas, one of the first given out, unless widely atypical, indicates that this tribute was not heavy. One has to look for indirect rather than direct effects of seigneurial domination to account for the relative backwardness of their towns. Evidence for such effects is not hard to find. One feature is the residence of the señores. Of twenty-five towns in all zones under señorío
lego, seventeen had señores who resided in Madrid at the end of the eighteenth century and three others lived elsewhere outside the province (Córdoba, Granada).[20] Only three resided in the province, but none of them in the town of which he was señor. (The residence of the señores of two towns is unknown.) Lay señores were thus by the middle of the eighteenth century overwhelmingly absentees (if they had ever been residents), most of them living in Madrid. The lord of the towns of ecclesiastical señorío was the archbishop of Toledo, also nonresident.
Benign neglect by an absentee señor or señora might not have been prejudicial, were it not for the fact that in most cases he was also the owner of extensive properties in the towns under his jurisdiction, indeed he was frequently the largest property holder (hacendado mayor). This was so in seventeen of the twenty-five towns of señorío lego, in fifteen of the twenty towns whose lay señor lived outside the province (Map 16.6).[21] In two other towns under señorío lego the largest property owner, who was not the señor, also lived outside the province. The hacendado mayor was much more likely to be an absentee in towns under señorío lego than under other forms of jurisdiction (Table 16.13). Eighty-two percent of the population under royal jurisdiction lived in towns where the largest property owner was either a vecino or the municipal council, and an additional 13 percent where he lived somewhere else in the province. For the population under lay señorío the situation was almost the reverse: only 18 percent lived in towns where a vecino was the hacendado mayor; 72 percent were in towns where he lived outside the province (for 57 percent, in Madrid). Towns of the military Order of Calatrava had a pattern close to that of realengo towns, except that more hacendados mayores lived elsewhere in the province (in Baeza, Jaén, Martos, and Huelma) than in the town itself. The six towns in the eastern part of the province under the archbishop of Toledo were very similar to royal towns. Lay señorío stands out as the only jurisdiction where the largest owners were heavily absentees. In conceiving the effect of this fact on economic development, it seems proper to assume that absenteeism among other large owners was more likely where the largest owner was an absentee.
A second potential disadvantage of lay señorío appears in the relation between the property in the hands of the hacendado mayor and the total property in the town (Table 16.14). In towns of this jurisdiction the
[20] The residence of twelve is identified either by resp. gen. Q 2 or by the list of hacendados mayores in AGS, Dirección General de Rentas, Única Contribución, libro 328; and five others by a survey made for Napoleon in 1808: ANP, AF IV, 1608 , 2 : 46.
[21] List of hacendados mayores (see above, n. 20).
| |||||||||||||||||||||||||||||||||||||||||||||||||||||||||||||||||||||||||||||||||||||||||||||||||||||||||||||||||||||||||||||||||||||||||||||||||||||||||
| ||||||||||||||||||||||||||||||||||||||||||||||||||||||||||||||||
largest owner had a far greater proportion of all the property (a mean of 35 percent) than elsewhere. The mean for realengo is 10 percent, and for the other two types even lower. Nor is this the result simply of the smaller size of towns under señorío lego;[22] the hacendados mayores had on the average much larger properties than elsewhere. The mean income from their properties was over seventy thousand reales, in other jurisdictions forty thousand or less (see the table). Thus towns under señorío lego had a much higher concentration of property than other
[22] The mean town population in 1786 for the different types of jurisdiction was realengo, 3,410; military order, 2,360; señorío lego, 1,280; señorío eclesiástico, 2,760.
towns, with the largest property frequently in the hands of the señor himself. Furthermore these large owners were far more likely to be absentees than those elsewhere. In the distribution of property and nonresidence of the largest owners, towns of lay señorío formed a class by themselves.
If these characteristics explain why towns under lay señorío had responded less than others to the lures of the market, they should correlate with the extent that the zones were into the agricultural market, but in fact they do not. If concentration of property in the hands of hacendados mayores were a cause of economic backwardness, one would expect a trend of less to greater concentration from Type A1 to Type C zones, but no such trend shows up. Nor should this be surprising. Large properties were more rather than less commercially oriented than others. Absenteeism of the hacendado mayor does not provide such a trend either.
The towns of señoro lego had a different characteristic that more likely accounts for their slower economic growth. They did not attract a strong hidalgo elite. The census of 1786 indicates that towns under lay señorío averaged 3.5 hidalgos per thousand adult males, while those under other forms of jurisdiction averaged between 17.6 and 25.0 (Table 16.15). In almost three-fourths of the towns under lay señorío there were no hidalgos present; the proportion of towns without hidal-
| ||||||||||||||||||||||||||||||||||||||||||||||||||||||||||||||
gos was between one-fifth and one-third for other jurisdictions. Small towns as a rule had a smaller proportion of hidalgos than big ones, but the difference between towns under lay señorío and others cannot be accounted for only by their smaller size.[23] When all towns under lay señorío with populations over one thousand are compared with royal towns in the same population range, the former still have a strikingly smaller proportion of nobles, as the table shows. In the six towns under the archbishop of Toledo in the eastern part of the province, hidalgos were as dense as in towns under the crown. The incompatibility between señorío and hidalgo residents applied only to señores who were laymen.
One of the characteristics of Type A1 zones was a prosperous hidalgo elite, as shown by the census of 1786 and the characteristics of the purchasers (Tables 16.8 and 16.9). We see now that even though royal towns had such an elite, those under lay señorío did not, or did to a much lesser extent. For reasons that may have been largely social, hidalgos preferred to live in towns where they were directly under the king rather than under another noble.[24] In royal towns they had the government effectively in their hands and the church as well, to judge from Baños and Lopera. Their relative absence surely was related to the undeveloped state of the economies of towns of señorío lego.
Although lay señorío appears to have been a major factor contributing to economic backwardness in Jaén province, ecclesiastical señorío was not, according to the evidence developed here. Only one of the six towns under the archbishop of Toledo had an absentee hacendado mayor, they did not have a high concentration of land ownership (the proportion owned by hacendados mayores was even lower than in royal towns), and three had a large contingent of hidalgos. In all these characteristics they resembled royal towns. Yet they were all located in zones that showed no commercial expansion in our period.[25] The only appar-
[23] The increasing proportion of hidalgos as town size grows is as follows (total hidalgos over total males 25 and over, census of 1786): towns with populations 30–499, 3.2 hidalgos per 1,000 adult males (N = 13 towns); 500–1,499, 10.6 (N = 22); 1,500–2,999, 9.8 (N = 17); 3,000–14,999, 16.8 (N = 16); over 15,000, 48.4 (N = 1, Jaén city). The concentration of hidalgos in the larger cities of Jaén (and the rest of Andalusia) was already the case at the end of the sixteenth century (Molinié-Bertrand, "'Hidalgos,'" 80).
[24] Domínguez Ortiz, Sociedad española, 326, remarks that under the Habsburg rulers, "when a town fell under señorío, the more illustrious families expatriated themselves so as not to be subject to someone they considered of equal or lesser rank than they." Vassberg, Land and Society, 98–99, also reports a strong preference in the sixteenth century for royal jurisdiction over señorío.
[25] They were two of the three towns in Zone JI, the only Type B zone not to give evidence of commercial expansion, all three of the towns in Zone JM, and one of four in Zone JN (both Type C).
ent reason for the backwardness of these regions was their geographic isolation in the northeast and east of the province, away from any major transportation artery. The 1787 map of Tomás López shows no direct road from either Cazorla or Villanueva del Arzobispo west to Jaén, Ubeda, or the main Andalusian highway, or east to Murcia. The only connection was a local north-south road. Even today it takes a considerable detour from any regularly traveled route to reach these towns.
7
One might anticipate a relationship between the different types of zones and their demographic structure. Certain connections have already appeared involving the size of towns. Town size was related to jurisdiction and to the proportion of hidalgos in the population, but it was not significantly related to the type of zone. Population changes between the four main census dates, 1712, 1751–53, 1786, and 1826, would give an indication of the different demographic development of the various zones, provided of course that the data are sufficiently reliable. Unfortunately, we have plenty of evidence that the data are not very good. The towns were big, census takers hardly went from door to door, and they had to accept the information available from the municipal officials and the clergy. The information in the catastro is probably the best, but this gives only the vecino count. The 1712 census of vecinos is everywhere notoriously low, for the respondents feared that it would be used to impose taxes or military conscription. Rather than attempt to establish real growth rates, I have compared the figures in the consecutive censuses, looking for different patterns of growth among the types of zones and hoping that errors in reporting would balance out (Table 16.16). While the different types of zones show markedly different growth rates, the variation among the zones within each type is so great that these differences are not statistically significant. One does find a meaningful pattern, however, for the middle time period, from the catastro to the census of 1786, if one takes not the types of zones but the individual zones. Comparing the population change of those zones that showed an expansion of olive cultivation against those that did not, one finds a more rapid population growth among the former, statistically significant at the 1-percent level.[26]
[26] Since the vecinos reported by the catastro do not include the clergy, I subtracted the number of clergy in 1786 from the total population before comparing it with the vecino count of 1751–53. Zones JC and JD omitted.
| |||||||||||||||||||||||||||||||||||||||||||||||||||||||||||||||||||||||||||||||||||||||||||
This information provides convincing evidence that the zones that we have determined were expanding their commercial agriculture were also undergoing a more rapid population growth than either those zones already heavily commercialized by 1750 or those not yet significantly commercialized in 1800. Before 1751–53 and after 1786, the population was also increasing, but no distinct patterns emerge among the types of zones or between those zones expanding commercially and those not doing so between 1750 and 1800. If population growth was related to the expansion of commercial agriculture, as the data strongly indicate, then the distinct wave of growth that we have identified in certain parts of the province did not begin much before 1750 or extend much after 1800. Commercial growth would certainly have been present in the province, especially after 1800, but following a different pattern. Indeed, I propose that the disentail changed the pattern by giving an opportunity for commercially oriented elites of all zones to expand their activities.
The demographic mechanisms whereby the expanding zones grew faster than the others between 1751–53 and 1786 cannot be satisfac-
torily determined by the available data. The information provided in Table 16.16 reveals no statistically significant difference in family size in 1751–53 among Types A1 , B1 , and C, nor does any turn up between the zones growing commercially and those that were not. Likewise, the census of 1786 shows no significant correlations for the proportion of the population under sixteen (that is, for a younger and presumably more rapidly expanding population) or for the proportion of males in the labor force (over sixteen). One may assume that part of the differential growth was due to migration and part to natural increase, but the available data do not enable us to sort out the factors.
8
The analysis of the nature and evolution of the different zones of Jaén province has been complex, but when all the features are assembled a clear pattern emerges. The transition from agricultural production for local consumption to that for a wide market proceeded in various stages. Sometime before 1750 the richer sectors of the Guadalquivir basin and some adjacent loma and foothill regions had developed a strong commercial agriculture based on the balanced cultivation of wheat and olive groves. Other regions to the east of these, the zones of Ubeda, Cazorla, and Huelma, had numerous cortijos devoted to commercial grain production but few olives. Some of the province was only weakly oriented toward the market at this time: a belt of the Guadalquivir basin marked by saline soils unpropitious for grain, running from Menjíbar to Martos and including at this time the zone around Jaén city, and certain outlying regions: the southern valleys of Alcaudete and Alcalá la Real, the sierra valleys south of Jaén, and the loma around Villanueva del Arzobispo in the northeast.
How long this pattern had been in existence this study cannot say. The flimsy demographic data covering the first half of the century do not reveal any pattern of evolution in this period. The province had been known for its olives since at least the sixteenth century, but we do not know the area and extent of olive production at that time or the changes that had occurred since.
The towns of advanced commercial agriculture in 1750, those with a balance of grain and olives, had as a rule strong sociopolitical elites, of which hidalgos were the outstanding sector, including clergy of hidalgo background. Hidalgo families, in fact, stood out as the commercial agricultural class par excellence in Jaén. These towns had other distinctive
characteristics. Many had a prosperous sector of muleteers, and their largest landowners, the hacendados mayores, were more likely to be local residents than in other regions. They were also more likely to be under royal jurisdiction. Towns under lay seigneurial jurisdiction, in contrast, on the whole lacked both a strong hidalgo elite and advanced commercial agriculture at the beginning of our period.
A wave of expansion of olive cultivation swept over portions of the province in the second half of the century—the only stage of economic growth that this study can identify and describe. In these regions a demographic spurt responded to the improving economic conditions. The regions of the north and west that had already achieved a balance of arable and olive groves did not experience this wave, but the region east and south of the city of Jaén, although already actively involved in the cultivation of olives in 1750, did expand this crop. In addition most of the zones that had specialized in grain production for the market in 1750—the regions of cortijos and few olive groves—participated in this wave. Together they formed a semicircle around the east and south of the older olive area. These were less wealthy zones, with a weaker hidalgo elite and extensive lay señorío. The general expansion of economic activity in Spain in the second half of the century drew these sectors into olive production, overcoming their less propitious social structure and relative geographic isolation.
By 1800 only three zones in the east and northeast—Cazorla (JI), Villanueva del Arzobispo (JM), and Santisteban (JN)—and Martos zone (JF) in the west lacked evidence of active commercial production. (All regions, of course, shipped some products out for sale, the question is one of degree.) The first three contained the six towns of ecclesiastical señorío, but this does not appear to be the cause of their backwardness, which our information can assign only to their geographic isolation. Martos, in contrast, was on the old road to Granada and belonged to the Order of Calatrava. The explanation for its failure to take off before 1800 would appear to be its soil. A saline marl, it is not conducive to good arable, with the result that the zone had not developed the export of grain. Although its soil is ideal for olives—as one can see today from its virtually seamless blanket of silver-green trees—it had only a weak hidalgo elite in the eighteenth century (Table 16.9) and little commercial orientation. Its case indicates that entry into commercial agriculture in the old regime came first via the sale of grain and not directly with olives. Oil production required a significant capital investment: ten to fifteen years' wait after planting for the production of the first harvests,
and the building of olive mills. The commercial growth of grain could provide the needed savings. A later wave of olive expansion would turn Martos into one of the richest olive zones in Spain, as it would Cazorla in the east, but not until after the old regime.
Wide commercialization of agriculture thus begins in most parts of Jaén well before the end of the old regime. Four factors interacted to determine the rhythm of the different regions: the quality of the land, the accessibility of major highways, the nature of jurisdiction, and the presence of a prosperous, largely hidalgo elite, which ideally included the hacendado mayor. Originally, the development of this elite depended greatly on the other three factors, most notably the type of jurisdiction.
The example of Jaén province indicates that lay señorío—feudalism, if one wishes—retarded the transformation of agriculture into commercial production by removing the largest owners from the towns and discouraging the presence of hidalgos and no doubt by other subtler means not detected through our data. The economic takeoff of the late eighteenth century, however, affected towns of señorío lego as well as others, moving them into olive oil, where they were not inhibited by factors such as poor soil or poor communications.
Although señorío was an obstacle, hidalguía was not. Hidalgo families formed the core of the sector that developed the local agricultural potential. Hidalgos too might be considered feudal, especially because a good part of their property was tied up in vínculos and mayorazgos, but they were far from being anticapitalist as a group. The reformers of Carlos III's reign, one recalls, roundly condemned entail as harmful to the economy and hidalgos as an idle, parasitic class. Jovellanos claimed that no one in Andalusia was investing in the improvement of agriculture because entail made owners neglectful absentees. Cortijos too they found evil; they wanted these estates divided into prosperous homesteads. In their eyes, the laws of property in Andalusia had created a class of poderosos who were taking over whole towns and impoverishing the laboring poor.
The present study indicates that the reformers misread the situation. Vinculos in some instances were surely neglected, as were other types of property, but as a group the notables were interested in agricultural development. Cortijos offered them the wherewithal to pursue further commercialization through olive groves. They included many poderosos, for we have seen them in control of municipal governments and they exploited the large and powerless class of jornaleros. But what eco-
nomic initiative existed was largely in their hands. More like members of the English gentry than the royal reformers appreciated, very different from the popular perception of the lazy impoverished hidalgo stereotyped by the authors of the Golden Age and accepted uncritically by later historians, they seized a good possibility when it arose.
Such a possibility came with the desamortización of Carlos IV. These hidalgos and other notables associated with them were eager to break entail—the entail of the church—if they could get more land for themselves, and this meant members of the hidalgo families who had entered the clergy as well as the heads of families. Notables were of course not the only buyers, but they dominated the top levels and were proportionately much more numerous among all buyers than in the population as a whole. Disentail strengthened their class and pushed it toward greater commercial orientation.
Everywhere commoners also bought lands, in most zones in larger numbers than the notables. Properties that were not market oriented were more likely to go to them, and those that needed intensive labor input. Commoners with available capital also bought commercial properties, especially olive groves, and thus established a common interest with the notables. This was especially the case in those zones of grain culture, where the hidalgo elite was exiguous. Desamortización did not mean the displacement of an older landed class by a new class of capitalists but rather the invigoration of the older class by adding new recruits and by giving its more driving individuals a chance to excel. In the process, it accelerated the commercialization of agriculture.