Summary: Volcanological Interpretation
Several different but naturally related processes might stimulate fracturing of potential geothermal reservoir rocks: (a) magma intrusion, (b) hydrothermal circulation, (c) magma degassing, and (d) hydrovolcanic processes. For the hydrovolcanic (phreatomagmatic) case, the series of schematic illustrations in Fig. 2.71 depicts the formation of a hypothetical fractured geothermal reservoir underneath a volcano.
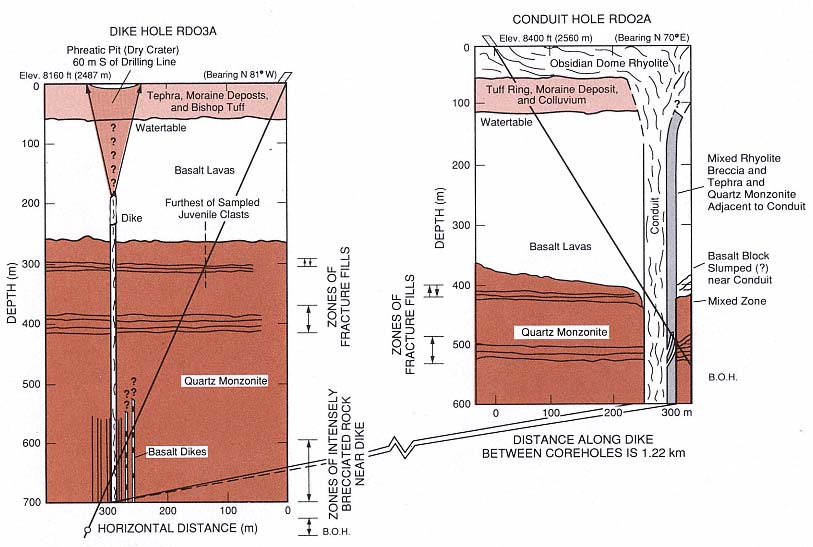
Fig. 2.67
Cross section of dike and conduit core holes showing natural hydrofractures as wavy horizontal lines at depths of 300 to 500 m.
(Adapted from Heiken et al ., 1988.)
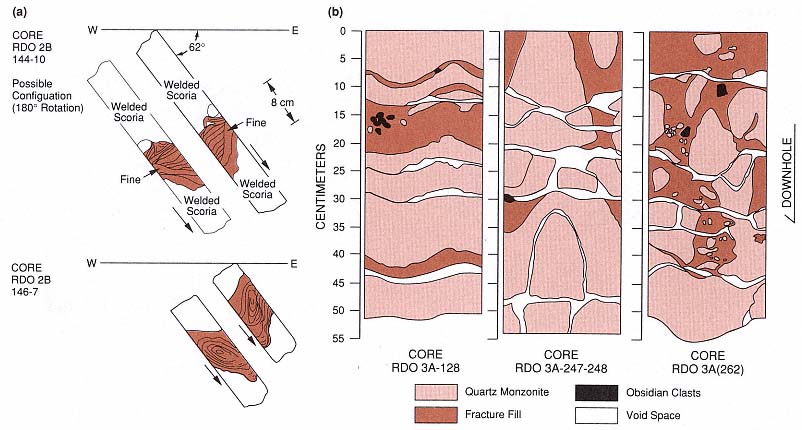
Fig. 2.68
These sketches of cores containing clastic fracture fillings were made by mapping core surfaces on velum wrapped around
the core.(a) Orientation of core segments taken 5 and 1 m west of the conduit that was intersected by the conduit core hole.
The gray, cross- and convolute-bedding fillings range in thickness from 7 to 40 cm. Of the two possible orientations shown,
the lower of each set best fits the bedding texture. (b) Core maps showing fracture fill,
host quartz monzonite, obsidian clasts, and void space.
(Adapted from Heiken et al ., 1988.)
This scenario combines aspects of all four processes listed above. The initial intrusion of a gas-rich magma moves upward along a fracture, opening the fracture with its fluid-rich top. This slow mechanism of crack propagation (termed "stress corrosion" by Anderson and Grew, 1977) is related to rock breakdown by the corrosive crack-tip fluids and rapidly varying pressure brought on by nucleate boiling along the crack walls. At some point, degassing of the magma might drive a hydrofracture into near-surface, poorly competent aquifer strata. The initial Plinian eruptions are driven by exsolving gases under high pressure. With increased fracturing, the aquifer rock fails catastrophically and allows water to mix with the magma, which results in dry phreatomagmatic eruptions. The eruptions gradually become wetter as more water is supplied by the increasingly fractured aquifer. At some stage, the extrusion of magma ceases—perhaps in response to chilling by the aquifer. By this time, hydrothermal circulation is well developed, and fluid from the aquifer continues to transfer heat from the intrusion below the volcano.
The geothermal potential of such a system has only been tested in a few areas (for example, Funiciello et al ., 1976; Barberi, 1985), and its overall importance depends upon a number of geologic controls:
· age and size of the subvolcanic intrusion,
· presence of a sufficient aquifer,
· porosity and permeability of basement rocks,
· fracture strength of basement rocks,
· tectonic regime and location of preexisting fracture systems, and
· clay content of host rocks and the degree of hydrothermal alteration.
In conclusion, we offer the simple model illustrated in Fig. 2.71 as an example of one of several different volcanic processes that develop fracture permeability in basement rocks and promote hydrothermal circulation.
Fig. 2.69
Solutions for hydrofracture at Obsidian Dome, illustrating a model for volcanic hydraulic fracturing.
(a) Hypothetical contours of maximum principal stress (Pollard et al ., 1983; see Fig. 2.63) indicate
the horizontal propagation of hydrofractures from the dike as they intrude into the granodiorite
(quartz monzonite) host rock. (b) Calculated values of fluid overpressure required to form
hydrofractures as a function of depth for the upper and lower set of fractures observed in the dike
core hole. (c) Calculated fracture dimensions and average observed fracture widths for several
different depths. (d) Calculated fluid viscosities required to form the observed fractures.
(e) Calculated fracture formation velocities. Fracturing may have occurred in spurts, causing the
fractures to propagate several meters at a time.
Fig. 2.70
Hydrothermal brecciation model of Hulen and Nielson (1988). This depth vs temperature plot shows
the boiling point curves under hydrostatic (ph ) and lithostatic (pl) pressure, as well as that
required for hydrofracture (pb ). For hydrofracturing that begins at 515 m, path AB follows
pressure buildup and subsequent fracturing as a response to increased temperature; path AC
represents hydraulic rock rupture in response to a rapid pressure release.
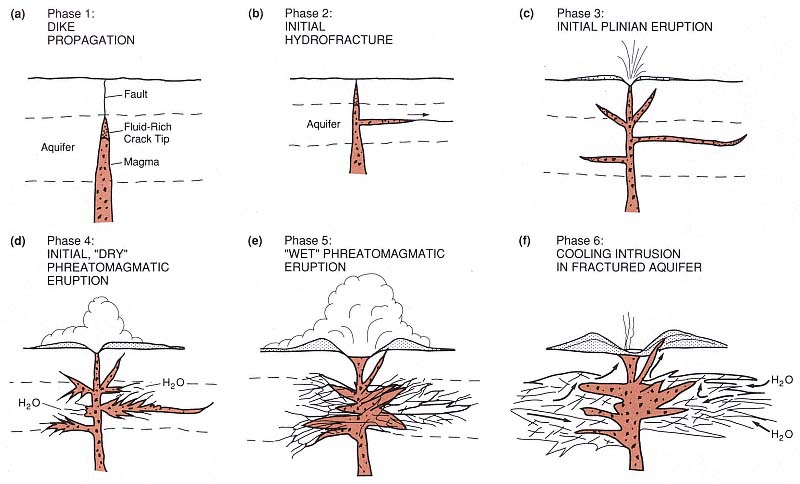
Fig. 2.71
Schematic sequence illustrating the six-phase development of a fractured geothermal reservoir under a phreatomagmatic volcano.
Phases 1 through 3 are hypothesized from the studies of Obsidian Dome discussed in the text (Heiken et al ., 1988).
Phases 4 and 5 reflect the findings of Barberi (1985) for phreatomagmatic eruptions through a deep aquifer;
the tephra deposits record increasing water interaction as the eruption progresses, presumably as a response to the
increased fracture permeability of aquifer rocks induced by hydrofracturing. Phase 6 illustrates posteruptive
cooling of magma intruded below the volcano. Hydrothermal circulation in the aquifer around the intrusion,
greatly enhanced by the magma-induced hydrofracturing, may develop a geothermal reservoir.