Potential Effects of Sewage Effluent Removal on the Lower Salinas River Riparian System[1]
Thomas T. Jones and Bruce W. Snyder[2]
Abstract.—The effects of summertime stream dewatering on the Salinas River and Lagoon due to removal of two wastewater treatment discharges were examined. It was found that there would be no adverse impact on the lagoon, but that the riparian vegetation may suffer from loss of water. A four- to six-year monitoring program is proposed to determine the precise effects.
Introduction
The Salinas River system is located in the intermontane valley of the Central Coast Ranges of California. From its headwaters in San Luis Obispo County, the river flows northwesterly through the Salinas Valley to its mouth in Monterey Bay. Almost all of the surface flow occurs from December through April as precipitation runoff.
Surface flow in the river is regulated by three dams and reservoirs on the upper reaches of the Salinas, Nacimiento, and San Antonio rivers. Santa Margarita Lake on the Salinas River is used as a municipal water supply for the city of San Luis Obispo. The Nacimiento Reservoir and the San Antonio Reservoir are used for flood control in the winter and spring and for groundwater recharge of the lower Salinas Valley aquifers in the summer and fall.
Proposed Project
In 1974, the Central Coast Basin Water Quality Control Plan Report (State Water Resources Control Board and Regional Water Quality Control Board, Central Coast Region 1975) called for removal from the Salinas River of the sewage effluent generated by the City of Salinas' two secondary wastewater treatment plants. This was to be accomplished by abandoning the treatment plants and pumping the wastewater to a new regional plant to be built on the Marina landfill site. This would result in the removal of about 0.28 m3 per second (10 cfs) of effluent from the river. During the summer months this effluent constitutes all or a major portion of the flow in the river below the Highway 68 bridge. The Basin Plan (ibid .) recognized this fact and recommended that a study of the effects of the effluent removal be conducted before project implementation.
The Monterey Regional Water Pollution Control Agency (MRWPCA) was the agency responsible for implementing the project. The Environmental Impact Statement (US Environmental Protection Agency and Monterey Regional Water Pollution Control Agency 1978) on the Final Facilities Plan (Engineering-Science 1978) also recommended that the effects on the river and lagoon of removal of effluent be studied. A task force composed of representatives from various concerned state and local agencies was formed to monitor and direct the study. The study was initiated in early 1979 with the objective of determining the effects of the flow reduction on the lower Salinas River. This paper summarizes the results of that study, completed in March 1981 (Engineering-Science 1980), and the actions which have followed.
Ecosystem Characterization
Study Area Description
The area potentially affected by the proposed project includes riparian forest, freshwater marsh, saltwater marsh, and the lagoon near the river mouth. A map of the study area is shown in figure 1. The boundary farthest upstream is set by the City of Salinas Alisal wastewater treatment plant outfall, which discharges about 0.004 m3 per second (1.5 cfs) about 200 m. (220 yd.) upstream of the Highway 68 bridge. The reach of river just upstream from Alisal is normally dry during the summer; water releases from the two reservoirs upstream are regulated such that all surface flow has percolated into the ground above this point. The City of Salinas' main treatment plant discharges about
[1] Paper presented at the California Riparian Systems Conference. [University of California, Davis, September 17–19, 1981].
[2] Thomas T. Jones is Environmental Engineer with Engineering-Science, Inc., Berkeley, Calif. Bruce W. Snyder is Terrestrial Ecologist with Engineering-Science, Inc., Denver, Colo.
Figure l.
Map of the study area showing sampling locations
and significant point source discharges to the river.
0.24 m3 per second (8.5 cfs) about 2.5 km. (2.5 mi.) downstream from Alisal.
Except for the riparian corridor, the land on both sides of the river has been extensively cleared for agricultural use. The land north of the river is uniformly flat for several miles; just south of the river and inland from Highway 1, the land rises sharply to elevations of 40 to 100 m. (125 to 330 ft.).
The lagoon at the mouth of the river is part of the 210 ha. (518 ac.) Salinas River Wildlife Refuge and serves as a feeding and breeding ground for large numbers of birds. During high flow periods, the lagoon is open to the bay, and the river discharges to Monterey Bay. During the summer, sand dunes close off the mouth, and the river discharges through Moss Landing Harbor about 6.5 km. (4 mi.) to the north via the old Salinas River channel.
Baseline Study Plan
The first phase of the monitoring program was a baseline study, initiated in 1979. Its objectives were to: 1) characterize the study area with respect to hydrology, water quality, and ecology; and 2) determine if there was a need for detailed impact analysis because of the proposed project. The study was conducted during the summer of 1979. Nine sampling stations, shown in figure 1, were established. At each station except Station 6, which proved to be inaccessible, the flow, electrical conductivity (EC), and temperature of the water were measured biweekly; in addition, at Stations 7 and 8 the dissolved oxygen (DO), ammonia, total organic nitrogen, nitrite, nitrate, phosphorus, and major cation and anion concentrations were measured monthly. This was done to better identify impacts on the water quality in the lagoon. The ecological portion of the study identified the dominant plant and animal species within the study area; it consisted of a literature review and two week-long field trips to the area.
Hydrology and Water Quality
Sources of Water Flow
A major effort of the baseline study was to identify the sources of summertime flow in the lower Salinas River. There are three major point sources of discharge within the study area; the two City of Salinas treatment plants and the Blanco Drain, which discharges an average of about 0.11 m3 per second (4 cfs) approximately 8 km. (5 mi.) upstream from the mouth. This drain discharges agricultural irrigation water runoff from about 2,400 ha. (6,000 ac.) north of the river. In addition to these major point sources, there are numerous nonpoint sources of agricultural return water along both sides of the river and along the north side of the lagoon.
There are two other potential sources of water to the lagoon: groundwater inflow from the surrounding land, and seawater inflow from Monterey Bay. The magnitude of the groundwater inflow (or outflow) was measured by constructing groundwater wells around the periphery of the lagoon and calculating the magnitude and direction of flow based on soil permeability and water level difference in the wells. Seawater inflow was estimated by performing a salt balance on the lagoon water, and by a previous study which directly measured seawater inflow (Muckel etal . 1964).
Since it was impossible to measure the nonpoint flow into the river directly, it was calculated by performing a mass balance between the various sampling points on the river. The average nonpoint inflow between stations was estimated as the difference between the upstream flow and any known point source inflows within the reach. An average value for this flow per unit length of river was then computed and applied to the entire length of river and lagoon to give a total value for nonpoint inflow.
Using the data thus collected, an overall water budget for the river and lagoon was constructed. This is presented in figure 2. Surface flow into the lagoon accounted for about 92% of the inflow; of this, about 45% was from the treatment plants and the rest was from the Blanco Drain outfall and nonpoint sources. In the river, the quantity of flow from the treatment plants ranged from 100% in the upper reaches of the study area to about 45% at the head of the lagoon. Groundwater inflow from the periphery of the lagoon was negligible; seawater inflow was also very small. One source of water which was
Figure 2.
Low-flow water balance for the lower Salinas River and Lagoon.
not measured was subsurface flow in the river channel.
Water Quality
Important water quality parameters which would be most affected by the proposed project were total dissolved solids (TDS), nutrients, ammonia, DO, pesticides, and coliform levels. TDS was measured at each station biweekly; nutrients, ammonia, and DO were measured monthly at Stations 7 and 8 to assess their effects on the lagoon. Pesticides and coliform levels were not measured, but data from other sources were reviewed. The significant findings for each parameter are discussed below.
Total Dissolved Solids .—TDS was determined indirectly by measuring electrical conductivity (EC) and temperature. The TDS values for the treatment plant effluents were generally less than half those for the Blanco Drain outfall, which is representative of agricultural runoff water. As expected, therefore, the TDS values generally increased downstream as more agricultural water entered the river. In particular, the TDS at the lower end of the lagoon (Station 8) was substantially higher than anyplace else in the river, due largely to seawater inflow through the sand dunes. The result of removing the sewage effluents would be to generally raise the TDS level in the river and lagoon by about a factor of two, from 1,000–1,500 mg. per l. at present to about 2,500–3,000 mg. per l.
Nutrients .—Nutrients in the form of total nitrogen and total phosphorus were measured at the upper (Station 7) and lower (Station 8) ends of the lagoon. Total phosphorus (as P) values ranged from 3.20 to 20.26 mg. per l. at Station 7 and from 0.72 to 5.56 mg. per l. at Station 8. Total nitrogen (as N) values ranged from 14.7 to 21.0 mg. per l. at Station 7, and from 4.4 to 11.2 mg. per l. at Station 8. The data indicated that nutrient removal in the lagoon was high. In addition, there was a shift in nitrogen speciation from predominantly ammonia nitrogen and nitrate to predominantly organic nitrogen and nitrate forms. These effects were undoubtedly due to algal activity in the lagoon. The treatment plant effluents are major contributors of these nutrients; mass balance calculations indicated that the two treatment plants contributed at least half and often virtually all of the nutrients found at Station 7. The Blanco Drain water (and most likely, nonpoint agricultural return water as well) occasionally had high nutrient levels, due to over-application of fertilizer, but generally it had low nutrient concentrations.
Ammonia .—Ammonia levels at Station 7 ranged from 3.09 to 16.0 mg. per l. and at Station 8 from 0 to 4.8 mg. per l. The levels of ammonia were directly correlated with high levels of ammonia in the treatment plant effluents. Mass balance calculations indicated that the plants consistently contributed most or all of the ammonia found at Station 7. Presumably, the ammonia levels upriver were even higher since less dilution water for the plant effluents was available. At the pH and temperatures encountered, these ammonia levels would lead to unionized ammonia—which is its toxic form—considerably in excess of the US Environmental Protection Agency EPA criterion of 0.02 mg. per l. Fish sensitivity to un-ionized ammonia varies widely among species and within the same species depending upon other environmental stress parameters (Willingham 1976).
Dissolved Oxygen .—DO levels at Station 7 ranged from 5.9 to 21.5 mg. per l. and at Station 8 ranged from 9.0 to 24 mg. per l. These generally high values were undoubtedly due to algae photosynthesis. All measurements were taken in the late morning or early afternoon when photosynthetic production of DO would be relatively high. Usually, in environments with high algal productivity, such as this, values drop substantially at night or in very cloudy weather, and can even be reduced to zero, due to algae decay.
Pesticides .—Historical pesticide data for the Salinas River, treatment plant effluents, and Blanco Drain water were examined. All the Salinas River levels were well below 1 ppm with the exception of one measurement of over 30 ppm of Diazinon at Stations 2 and 3 in October 1978. Diazinon was used to contol mosquitoes in the river and was undoubtedly the source of the high levels. A fish kill also occurred at this time, and was attributed to either the pesticide or the high ammonia levels, or a combination of both (Greenfield and Grunt 1978). A few pesticide analyses from Blanco Drain water also showed levels consistently less than 1 ppm. No pesticides have ever been detected in the effluents of either treatment plant.
Coliforms .—Coliform levels at various locations in the river have been periodically monitored by various agencies, (e.g., Bureau of Sanitary Engineering 1971; Irwin 1976). These studies have consistently shown much higher coli-
form levels below the treatment plant discharges than above them. Although coliforms can be contributed by agricultural runoff water, it is likely that most of the coliforms in the river were due to the treatment plant effluents. High coliform levels indicate a health hazard, and they were one of the main factors in the decision to remove the treatment plant discharges from the river. Chlorination by the treatment plants has been subject to periodic breakdown in the past, which led to very high coliform levels in the effluent.
Ecology
The lower Salinas River ecological environment is composed of four major systems: salt marsh, freshwater marsh, riparian woodland, and river/lagoon. In the past, various water resource development activities have been responsible for significant degradation or loss of these once abundant systems throughout central California and elsewhere in the West. Because of the magnitude of past losses and the inherent biological values of these systems, they are now the focus of attention in ecological circles.
Salt Marsh
About 25 ha. (63 ac.), or seven percent of the study area, is salt marsh intermixed with mudflats and salt pans. The salt marsh system is located in the lower river sections near the confluence of the coast and lagoon environments. High concentrations of soil salts restrict the diversity of plants that can exist in the salt marsh. California coastal salt marshes are dominated by pickleweed and salt grass and receive only irregular salt water flooding. Pickleweed comprised about 90% of the salt marsh vegetation. Additional plant species appeared in localized areas along the lagoon/marsh interface where more frequent flooding reduces soil salinity.
The mixture of shallow water, mudflats, and vegetation in the salt marsh constitute an important wildlife area, especially for birds. The dense stands of pickleweed were heavily utilized by both resident and migrant waterfowl. Bird abundance and species diversity in the salt marsh and adjacent lagoon area were the highest in the study area. Over 127 species, both resident and migrant, have been observed in the general area. Major bird groups included gulls, terns, shorebirds, wading birds, and waterfowl. Figure 3 shows the lagoon and bordering salt marshes.
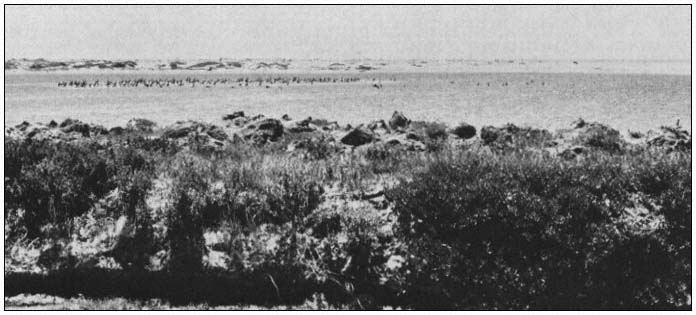
Figure 3.
Salinas River Lagoon, with salt marsh area in the foreground and sand dunes separating the
lagoon from Monterey Bay in the background. Note the utilization of the lagoon by birds.
Inputs of soil moisture in the salt marsh come from both freshwater and saltwater sources. Saltwater comes directly from nearby Monterey Bay as salt spray or storm surges. High winds and tides send water around or over the dunes and onto low-lying marsh areas. Freshwater inputs are supplied primarily by rainfall. However during flood conditions, overbank flooding from the Salinas River is an additional source.
Land elevation has very important effects on salt marsh soil moisture and standing water dynamics. Elevation of the salt marshes isolates them and prevents their regular inundation by either saltwater from the bay or freshwater from the Salinas River. The salt marshes are perched
above the normal river channel and receive water from the river only during extremely high flow conditions. During normal flow conditions, water of the lower Salinas River Lagoon is channeled away from the salt marshes by high streambanks and therefore plays no significant role in the salt marshes' short-term hydroperiod. The water and salinity regime of the Salinas salt marshes are instead controlled by rainfall and by oceanic and evaporative processes not linked to normal river flows.
Freshwater Marsh
The freshwater marsh system is very limited in size and distribution; this system totals less than 0.8 ha. (2 ac.), less than 0.5% of the study area. Freshwater marshes occur as isolated, small stands rather than large, contiguous units. The dominant emergent plant was broad-leafed cattail. Small stands were scattered throughout the channel; they were most abundant below the Blanco Drain outfall, where water was constantly available.
The limited distribution and small size of this system precludes the development of any uniquely associated wildlife assemblage. Wildlife species present in freshwater marsh areas were also found in adjacent riparian woodlands.
The presence of standing water is the crucial parameter in this system. The depth of water and duration of submergence determine vegetative composition, zonation, and succession.
Riparian Woodland
Riparian woodland dominates the terrestrial areas, comprising approximately 93% of the upland portion of the study area. Riparian woodland extended almost continuously from the Highway 68 bridge to just east of the Highway 1 bridge. It formed an extremely narrow corridor, being confined to the Salinas River channel and occasional scattered waste places along the banks and floodplain that have not been converted to agricultural uses. Cottonwood and willow species were the important plant dominants. The relative abundance of these plants varied considerably along the river. Land elevation, local depth to groundwater, and, most importantly, the local land management techniques employed in adjacent areas determine the vigor, stature, and relative abundance of these species in the corridor.
The open floodplain bordering the Salinas River channel is frequently flooded by the natural rising of the river. Species growing in this habitat are adapted to flooding and constantly moist soil. Groundwater is continually recharged by overbank flows and subsurface seepage from nearby surface flows (Keller 1977; Johnson etal . 1976; Crouch 1979). Most species are low-growing annual or perennial herbs and grasses.
Wherever unstable soils accumulate to form slightly elevated gravelbars, dense stands of shrubs up to 7 m. (24 ft.) tall have developed. The dominant shrub, sandbar willow, is the first species to colonize the gravelbars. Other dominant shrubs include arroyo willow and mule fat. Herbs usually grow towards the edge of the gravelbars. In time, the elevation of the gravelbar becomes higher and the gravelbar more distant from the river due to continual soil deposition. As a result, flood frequency decreases.
These new conditions favored the establishment of riparian forest, characterized by tall trees crowded and tangled with vines (Sands 1979). There were several vegetation layers within the forest along the Salinas River. Overstory trees attained heights up to 23 m. (75 ft.). The dominant overstory species was Fremont cottonwood. A subcanopy layer 4.6–13.7 m. (15–45 ft.) high was formed by red willow, black cottonwood, and box elder. Understory species consisted primarily of tall herbs and tangling vines.
This riparian forest or woodland corridor provides refuge for a large number of wildlife species unable to exist in adjacent agricultural areas. Bird population levels and species diversity were high. Common mammals included raccoon, deer, and cottontail rabbit. Coyote, grey fox, and bobcat were occasionally present.
River/Lagoon
For analytical and descriptive purposes, the river and brackish lagoon environments were combined into one functional ecosystem. This was done because of the intricate interdependencies, the absence of any distinct boundary between the two systems, and the functional similarity of the driving forces of the two systems.
The freshwater riverine zone extends roughly from the Alisal wastewater treatment plant outfall downstream approximately to the California Highway 1 bridge. At the bridge, a gradual transition from fresh to slightly brackish water occurs as the river merges imperceptibly into the lagoon itself. The position of the interface betwen these two zones shifts continually. Water salinity in the lagoon and upstream transitional zone fluctuates seasonally depending on river discharges, rainfall, and periodic saltwater influxes from Monterey Bay.
A larger sandbar forms across the river mouth during the summer and fall months, effectively sealing off the lower river from Monterey Bay and restricting regular tidal exchanges with bay waters. Sandbar development and maintenance are predominantly controlled by alongshore forces. Normal river discharges are too weak during the summer to counterbalance sandbar development. A water-control weir diverts summer streamflow from the lagoon to Monterey Bay through the old Salinas River channel which discharges through Moss Landing Harbor about 1.5 km. (1 mi.) to the north. The sandbar essentially excludes saltwater influences, making upstream freshwater discharges the system's sole driving
force and the source of system energetics. Consequently, the hydrodynamics of the lower stream and lagoon areas during the summer and fall seasons are unlike classic river-influenced bays in which saltwater influxes and river discharges are physical forces of approximately equal importance regulating plant and wildlife populations.
Formerly, the Salinas River and Lagoon supported large populations of fish. Today, however, the populations have been significantly altered by major hydrologic changes in the watershed. Three groups of fish currently occur in the Salinas River: native, introduced, and marine visitors. Over the years, 23 fish species have been reported in the Salinas River; five are introduced, 16 are native, and two are anadromous. Among the native fish, populations of eight species have declined significantly in recent years. The other eight species have remained stable. Benthic invertebrates are also basic components of the Salinas River and Lagoon food chains.
Impact Analysis
The proposed streamflow withdrawals represent major potential hazards to the basic integrity of some of the ecosystems on the lower Salinas River. An ecosystem-oriented impact analysis was conducted to assess the possible effects resulting from this periodic stream dewatering.
The most important objective of the impact analysis was to anticipate potential environmental changes arising from the proposed action which would threaten the preservation and perpetuation of the aquatic, wetland and riparian systems as they currently exist. The approach to achieving this objective was to: 1) identify and evaluate the critical ecological processes that maintain existing wetland, riparian, and aquatic systems in the study area; and 2) determine if and how the proposed action could cause changes in these processes, and thus possibly alter the functional stability of the riparian woodlands, salt marsh, freshwater marsh, and river/lagoon systems. An additional objective was to identify general mitigation measures for the anticipated ecosystem changes.
Impacts of the proposed project were considered beneficial if they enhanced biological productivity and diversity, and detrimental if they lowered productivity and diversity. The understanding implicit in this approach was that system characteristics such as biotic quality and quantity, species richness, species diversity, and overall biomass productivity are expressions of the overall stability and health of the ecosystem. Major disruptions of a system's functional integrity and stability would be expressed as shifts in plant composition, decreased plant vigor, loss of productivity, disappeance of certain wildlife species, or reduced animal abundance. These changes could be measured in the field.
In order to assess these complex ecosystems in an organized manner, an innovative analytical approach was used which utilized four ecosystem models. The models integrated and summarized a large amount of diverse ecosystem information and presented the information as diagrams showing the ecological interrelationships controlling the presence and development of plants and wildlife. Development of each model resulted from an extensive literature review and synthesis of diverse physical and biological data which established functional linkages between ecosystem components.
The analysis indicated that stability in each ecosystem was regulated by a different set of physical parameters. Even though all ecological processes are important to the integrity of a natural system, critical pathways become apparent through the large number and kinds of other system components they controlled. Ultimately, this control could be traced to vegetation and wildlife populations. Some of these ecological processes were linked to streamflow. Critical pathways for each system type were identified as follows.
Riparian Woodland: frequency, duration, and timing of stream flooding, and soil moisture.
Salt Marsh: soil moisture and soil salinity.
River/lagoon: freshwater stream discharge, stream velocity, and depth of standing water.
Freshwater Marsh: average depth of standing water and duration of soil submergence.
The hydrologic regime of the Salinas River was the pivotal issue of the analysis. The river's past and present flow characteristics provided important background information that was essential for assessing the future status of the biological systems.
The lower Salinas River possesses flow characteristics typical of other central California coastal systems. Streamflow varies seasonally and is often quite erratic between years, since flow is a function of annual rainfall patterns. Flows are heaviest following winter and spring storms and lowest during the long summer dry seasons.
Because riparian, wetland, and aquatic ecosystems are dependent on available water, the most critical phase of the annual hydroperiod is generally the summer low-flow period, when water availability is lowest and biological demand is highest. A dependable and adequate supply of soil moisture and water during these stress conditions is essential for the maintenance of these water-dependent systems.
The environmental analysis indicated that two aspects of the river's hydrologic character had major influences on the nature and quality of the riparian and other biological systems. These
were: 1) timing, duration, and frequency of flooding; and 2) presence of perennial streamflow. A river's flood regime regulates riparian woodland regenerative capacity and also provides the mechanism for transporting upper watershed nutrients to downstream embayments and estuaries. Perennial streamflow helps maintain a permanent shallow water table within the root zones of the riparian and wetland vegetation which, in turn, sustains the vegetation through the summer. Removal of the wastewater treatment discharge presents no threats to the flooding regime of the river, although it does pose a significant potential hazard to the perennial flows in the channel.
Historical streamflow data indicate that, with few exceptions, constant but low flows were present in the river channel. The quantity of this low flow averages 0.03 to 0.06 m3 per second (1 to 2 cfs). From the mid-1950s to the present, summer flows at the Highway 68 bridge have stabilized at a relatively constant level due to the Alisal treatment plant discharges. Daily average flow ranged consistently from 0.03 to 0.08 m3 per second (1 to 3 cfs) during the July to September period. Sustained summer flows are important for maintaining standing water in the upper stream channel and probably for contributing to adequate soil moisture levels in adjacent riparian areas. Treatment plant flows have partially compensated for reductions in the annual streamflows caused by upstream impoundments.
The major environmental changes resulting from the proposed effluent removal project are summarized below by ecosystem. All anticipated significant impacts would result from manipulation of the existing hydrologic regime. The greatest effects would occur in the riparian woodland and river/lagoon systems, which are directly susceptible to flow reductions. The most significant effects would be caused by substantial lowering of the groundwater table beneath major sections of the nearby riparian woodland. In addition, in the upper stretches of the river, stream dewatering would eliminate the aquatic biota where the streambed dries out. Where wastewater flows provided major sources of water for freshwater marshes, there would be a moderate loss of wetland habitat and its associated wildlife benefits. The fact that most of this habitat-type is located downstream of other incoming water sources reduces the overall significance of this potential change.
All other environmental effects are generally expected to be of relatively small significance. Expected reductions in nutrient and detrital transport pathways were considered insignificant because other detrital sources are available, and the expected diversions would occur during minor transport periods. Major imports probably occur during winter and spring months. Specific ecosystem effects are summarized below.
Salt Marsh
No adverse or beneficial environmental impacts are anticipated for the salt marsh ecosystem. This system is apparently isolated hydrologically from the ecological processes which would be affected by the proposed project. The source of system energetics and critical regulatory processes is not controlled by the influences of wastewater flow reductions.
Freshwater Marsh
The freshwater marsh complex is a small system composed of discontinuous units of limited distribution. An assessment of the project effects on the entire ecosystem was complicated by its distributional characteristics. Some freshwater marsh areas are dependent upon wastewater treatment plant flows, while others are dependent upon agricultural return flows. Stands entirely dependent on agricultural return water would remain unchanged. Stands supported by treatment plant effluent would disappear. The ratio of these two types is unknown.
The total freshwater marsh ecosystem constitutes only about 0.5% of the entire study area. The proportion of this system which would be lost because of project activities represents an incremental decrease in overall habitat diversity, reduction in biological productivity, and loss of habitat for wetland-associated wildlife species, particularly waterfowl and wading birds. From the standpoint of the total freshwater marsh in the study area, the anticipated changes represent low to moderately significant changes. From the standpoint of the total ecosystem integrity of the study area, the anticipted changes would be of low significance.
Riparian Woodland
The greatest potential for significant adverse terrestrial impacts would occur in this ecosystem. Figure 4 shows a typical section of river with bordering riparian vegetation. Analysis of the best available hydrologic information suggested that the current treatment plant discharges constitute the major source of soil moisture for the riparian woodland. During the summer growing season, availability and abundance of adequate soil moisture is of paramount importance to the maintenance of system integrity. Removal of the water source could be expected to lead to the elimination or degradation of up to about 90% of the existing riparian woodland. It is essential that the existing water table not be lowered beyond the root zone (depths greater than 3.3 m. [10 ft.]) of the willows and cottonwoods. Given the degree of uncertainty associated with conclusively identifying the precise mechanism maintaining the present level of the water table, it was recommended that at least 0.042 m3 per second (1.5 cfs), and preferably up to 0.28 m3 per second (10 cfs) be maintained during the summer from the Alisal treatment plant downstream.
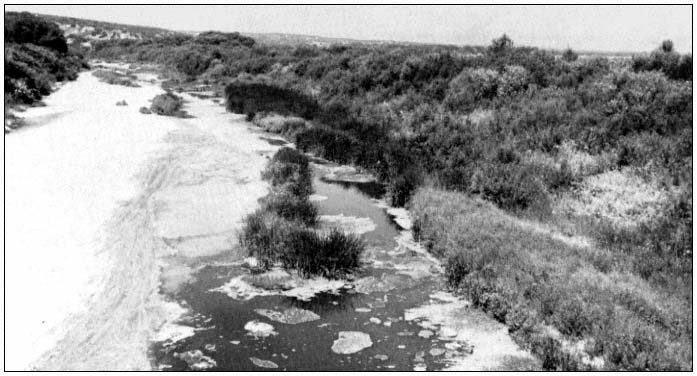
Figure 4.
Typical section of the Salinas River with bordering riparian vegetation.
One important mitigating consideration involved determining where the present water table is located within the riparian corridor and identifying its primary sources of recharge. If it could be conclusively shown that the primary source of soil moisture was either subsurface agricultural return water and/or shallow subsurface flows from upchannel recharge operations instead of existing surface flows from the treatment plants, the need for replacement surface flows would be less critical. However, this would not affect the adverse impacts on aquatic life from stream dewatering.
Lowering the water table would cause longterm, ecosystem-wide changes that would include major shifts in plant composition from cottonwood and willow probably to more drought-resistant brush and oak species; reduced ecosystem productivity; reduced quantities of riparian woodland; and reduced quality of riparian wildlife habitats, particularly for breeding bird species. The importance of riparian woodland to breeding birds is widely recognized. Local replacement breeding areas are not readily available; this impact could not be mitigated.
River/Lagoon
The greatest potential for significant adverse aquatic impacts exists in this ecosystem of flowing and standing water. The proposed project would remove a major source of summertime streamflow and initiate environmental changes ranging from complete dewatering in the upper stream reaches to little or no change at the extreme lower end of the lagoon. The magnitude of this change at any point would vary according to supplemental sources of stream inflows from agricultural return flows. The range of associated fish and wildlife impacts would vary accordingly. The most significant impacts would occur where dewatering was the most severe. Aquatic productivity would be completely eliminated in dewatered stretches. Available stream habitats and refuge areas for freshwater fishes would be significantly reduced, and the quality of the remaining fishery would be degraded by reduced flows and possibly by poorer water quality. Reduced streamflows might lead to higher concentrations of TDS and agricultural pesticides entering the lagoon system. This would be offset by lower dissolved nutrient and ammonia concentrations, and by the occasional DO depletion produced by treatment plant effluents. The resultant cumulative effect on the lagoon fish species is uncertain. The composition of fish species remaining after the project would be expected to consist of more stresstolerant species, such as carp. In the longterm, the ratio of salt-tolerant species to freshwater species would probably increase, because of the reduction in upstream freshwater refuge areas.
Because the freshwater fishery in the upstream reaches of the study area is not substantial, and elimination of the discharges would improve a number of water quality parameters, this impact was considered less important than the potential impact on the riparian vegetation.
Proposed Mitigation Measures
The results of the impact analysis indicated that the effect of the project on the lagoon would be minimal, but that serious adverse effects on the upstream riparian vegetation, which has value as a wildlife habitat, could occur. An adverse impact on the freshwater fishery would definitely occur, but since this fishery is not extensive and is considered of low value in the upstream reaches, this impact was not considered severe. It was concluded that to mitigate the known and potential impacts, some or all of the water lost due to removal of the wastewater treatment discharges should be replaced from another source.
Potential Water Sources
Seven alternatives were considered, and six possible sources of replacement water were identified. These alternatives were:
1. no action, allowing all flows to be diverted to the regional wastewater treatment plant with no Salinas River augmentation;
2. retaining and upgrading the quality of one or both of the City of Salinas treatment plants;
3. upgrading and pumping a portion of the effluent from the regional treatment plant back to Salinas and discharging it into the river during the summer;
4. developing a perched water aquifer wellfield and diverting pumped groundwater to the river;
5. developing a deep aquifer wellfield and diverting pumped groundwater to the river;
6. releasing additional quantities of water from the Nacimiento or San Antonio reservoirs; and
7. pumping effluent from the City of Salinas industrial waste lagoons to the Alisal discharge point.
Initial screening of the six flow replacement alternatives eliminated all but Alternative 4 from further consideration. Alternative 2 was prohibitively expensive due to the high level of treatment required. The net cost, assuming almost complete nitrogen and phosphorus removal, biochemical oxygen demand (BOD) and suspended solids limits of 5 mg. per l., and almost complete coliform kill, was estimated to be $1.7 million to retain just the Alisal plant, and $7.8 million to retain both plants.
Alternative 3 was also prohibitively expensive, costing $4.1 million to return 0.04 m3 per second (1.5 cfs), and $12.7 million to return 0.28 m3 per second (10 cfs) to the point of the Alisal plant discharge. Alternative 5 was also relatively expensive and had the additional drawback of being an uncertain source of supply and a potential future source of municipal and irrigation water. Alternative 6 was not feasible because water rights for this purpose could not be obtained. Alternative 7 was rejected because of concerns about industrial pond effluent quality, and because of the likelihood that flow was already seeping from the ponds into the river. Alternative 4 was therefore the only feasible flow replacement alternative. However, there remained the question of whether or not sufficient water was indeed available from the aquifer. Water from this aquifer was too high in TDS for agricultural or municipal use, but was suitable for flow replacement. Developing wells and transporting it to the river would be relatively inexpensive because existing treatment plant outfalls could be used, and the annual operational cost would be low.
Consequently, in January 1981 several wells into the perched aquifer were dug and tested for their yields. It was found that insufficient water was available to make well development worthwhile. This eliminated the last potential source of inexpensive replacement water, and left the no action alternative as the only remaining choice.
Selected Alternative
At the August 5, 1981 meeting of the task force, it was agreed that because no easily developed replacement water was available, the precise effects of reducing or removing the effluent flow should be determined. A further study of the effects of flow removal on the riparian vegetation was proposed. It was the consensus of the group that if significant deterioration of the riparian vegetation should occur, replacement water should be obtained. If no significant harm to this vegetation occurred, stream dewatering would be permitted. A four- to six-year monitoring study would be conducted to determine what, if any, would be the effects on the riparian vegetation if some or all of the flow was removed.
The proposed study is to monitor depth to groundwater table across the river channel, and vegetation vigor, growth, and reproduction at five stations along the river. The first two years of the study will provide baseline data before any flow is removed. The following two years the 0.24 m3 per second (8 cfs) flow from the Salinas main plant will be removed; the, only effluent flow left will be the 0.04 m3 per second (1.5 cfs) from the Alisal plant. If no effects are observed at this flow level, the Alisal plant flow will be removed for the last two years of the study. Criteria for determining what constitutes a "significant effect" will be set before the study begins. If a significant effect does occur due to the flow removal, some form of flow augmentation must then be developed by the MRWPCA.
Conclusions and Recommendations
Although the monitoring program will be designed to answer specific questions about flow reduction in the Salinas River, the data and results generated should be widely applicable to other riparian systems. A better understanding of the dynamics of riparian systems should be gained from this effort.
The results of this study have made it clear that a regional project such as this can have a number of beneficial as well as adverse impacts which may not be perceived at the outset. Although the EIR/EIS process should identify most of the impacts, it is often impossible to accurately predict effects on complex hydrological and biological systems such as riparian systems. It is therefore critical that study of potential effects on complex systems begin very early in the planning stages of any project which may affect them.
Literature Cited
Bureau of Sanitary Engineering. 1971. Sanitary engineering investigation of Salinas River, Reclamation Ditch and Blanco Drain. 23 p. California Department of Public Health.
Crouch, G.L. 1979. Changes in the vegetation complex of a cottonwood ecosystem on the South Platte River. In : Riparian and wetland habitats of the Great Plains: proceedings of the thirty-first annual meeting. Great Plains Agricultural Council, Fort Collins, Colorado.
Engineering-Science, Inc. 1978. Final facilities plan for North Monterey County (California). 283 p. Monterey Peninsula Water Pollution Control Agency, Monterey, Calif.
Engineering-Science, Inc., 1980. Lower Salinas River flow reduction impact report prepared for Monterey Regional Water Pollution Control Agency. 175 p. Monterey Regional Water Pollution Control Agency, Seaside, Calif.
Greenfield, H.R., and C.D. Grunt. 1978. Fish die-off in the Salinas River. Northern Salinas Valley Mosquito Abatement District.
Irwin, T. 1976. USDI Geological Survey, water quality investigation, Salinas River. California Water Resources Investigation (November) 76– 100.
Johnson, W.D., R.L. Burgess, and W.R. Keammerer. 1976. Forest overstory vegetation and environment on the Missouri River floodplain in North Dakota. Ecology Monograph.
Keller, E.A. 1977. The fluvial system: selected observations. p. 39– 46. In : A. Sands (ed.). Riparian forests in California: their ecology and conservation. Institute of Ecology Pub. No. 15. 122 p. University of California, Davis.
Muckel, D.C., K. Dyer, and J. Behnke. 1964. Report on salinity problems at the mouth of the Salinas River. U.S.D.A. Soil and Water Conservation Research Division, Agricultural Research Service.
Sands, A. 1979. Public involvement in riparian habitat protection: a California case history. p. 216– 227. In : R.R. Johnson and J.F. McCormick (tech. coord.). Strategies for protection and management of floodplain wetlands and other riparian ecosystems. USDA Forest Service GTR-WO-12. 410 p. Washington, D.C.
State Water Resources Control Board and Regional Water Quality Control Board, Central Coast Region. 1975. Regional water quality control plan, Central Coastal Basin (3). State Water Resources Control Board and Regional Water Quality Control Board, Coastal Region, Sacramento, Calif.
US Environmental Protection Agency and Monterey Regional Water Pollution Control Agency. 1978. Final environmental impact statement and report, North Monterey County facilities plan. US Environmental Protection Agency and Monterey Water Pollution Control Agency, Monterey, Calif.
Willingham, W.T. 1976. Ammonia Toxicity, Control Tech. Branch, Water Division, US Environmental Protection Agency, Washington, D.C.