11—
RIPARIAN SYSTEMS AND WATER DIVERSION PROJECTS
CAN THE CONFLICTS BE RESOLVED?
The South Fork (Kern River) Wildlife Area
Will the Commitment Be Forgotten?[1]
Carolyn Fleshman and Darrell S. Kaufman[2]
Abstract.—This study reports the ecological effects of reservoir inundation on a portion of the floodplain riparian system of the South Fork, Kern River, Kern County, California. The South Fork Wildlife Area, lying within gross pool of Isabella Reservoir and administered by the US Army Corps of Engineers, constitutes the prime portion of one of the largest and healthiest riparian forests remaining in California. In spring, 1980, the entire sanctuary was inundated by Isabella Reservoir, drastically reducing its unusually high bird populations and contributing to a reduction in the overall habitat values of the forest.
Introduction
The South Fork Wildlife Area (SFWA) is an ecological reserve and wildlife management area established by the Sacramento District, US Army Corps of Engineers (CE), within the gross pool (the area subject to flooding when the reservoir fills to its highest level) of Isabella Reservoir, Kern County. While the reservoir dams both the North and South Forks of the Kern River (see fig. 1), the most luxuriant riparian forest (and the SFWA) occur on the floodplain of the South Fork.
The SFWA serves as a unique example of preservation and enhancement of an area of extremely rich biological diversity and productivity by the CE, an agency often criticized for its disregard for natural values. The SFWA project has won the CE, Sacramento District, several awards for excellence as a conservation initiative. However, a recent change in water management and a proposed water development project threaten to reverse all improvements the CE has made, and, if implemented, destroy the resource that it has striven to protect.
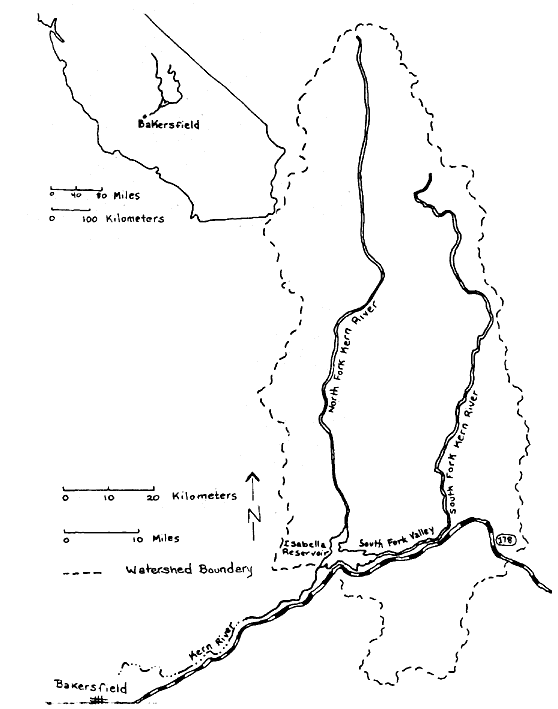
Figure 1.
Map of the Kern River watershed showing the
South Fork Valley and the SFWA location.
The first part of this paper presents background information on the ecology and management of the SFWA, and a description of Isabella Reservoir management policies affecting it. The second part details the results of bird censuses and vegetative transects designed to assess the impacts of reservoir inundation on the SFWA.
[1] Paper presented at the California Riparian Systems Conference. [University of California, Davis, September 17–19, 1981].
[2] Carolyn Fleshman and Darrell S. Kaufman, Environmental Field Program, University of California, Santa Cruz. Co-authors in alphabetical order.
South Fork Valley
The South Fork Kern River (fig. 1) supports one of the largest contiguous riparian forests in the State, encompassing over 1,000 ha.[3] The forest is one of the best remaining examples of a native deciduous riparian system in California (USDI Fish and Wildlife Service 1980).
Hydrology and Geology
The South Fork, unlike most Sierran streams, flows through a broad, gently sloping floodplain. Draining a watershed of 1,370 km2 , the South Fork begins in the Golden Trout Wilderness and flows south, then east through the South Fork Valley. Originally it joined the North Fork, but now it empties into Lake Isabella, a reservoir created in 1954 by damming the North and South Forks of the Kern River at their confluence.
The South Fork once cut through a deeply incised canyon, into the underlying rocks of the Sierra Nevada basement complex at the time of the Sierra Nevada uplift. Changes in topography, probably the result of block faulting at or near the present dam site, raised the elevation of the Kern River drainageway. This in turn produced a sediment trap, causing the canyon to be partially filled with unconsolidated alluvial sediments, largely decomposed granite, carried down from the surrounding mountains. This accumulated material now forms the South Fork floodplain and is the substrate of the South Fork riparian system.[4]
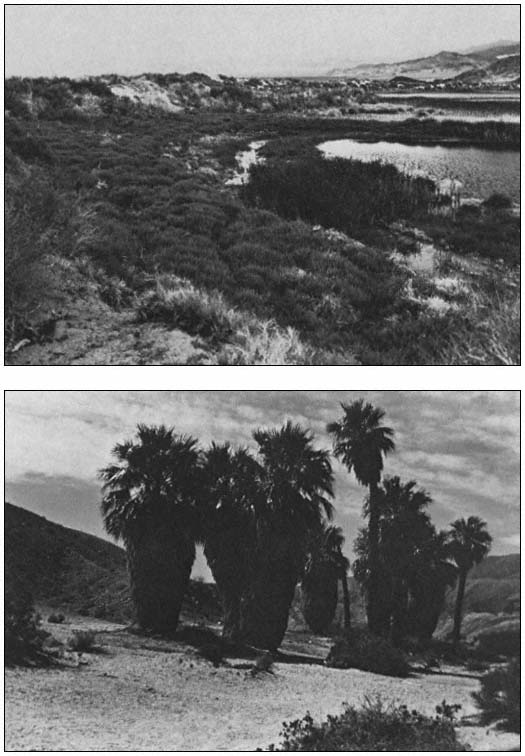
The low hydraulic energy of the South Fork, and the gradual topography and porous soils of its floodplain provide aquifer storage and a high water table for the Valley throughout the year. These characteristics create optimum growing conditions for a luxuriant native riparian woodland (fig. 2).
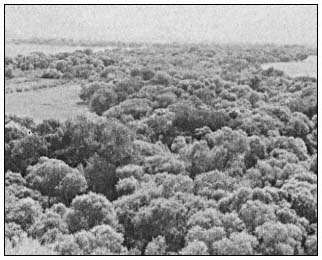
Figure 2.
View of the lush cottonwood/willow forest
of the South Fork Valley, looking east.
Vegetation
Dominated almost entirely by a mature growth of various willows (Salixgooddingii , S . lasiandra , and S . laevigata ) and Fremont cottonwood (Populusfremontii ), some of them estimated to be up to 300 years old,[5] the South Fork forest forms a meandering vegetated corridor through nearly the entire length of the Valley. Its total length is about 16 km., its average width 0.75 km. At the eastern end, the cottonwoods and willows intergrade with a relict stand of Joshua trees (Yuccabrevifolia ). An extensive network of marshes weaves in and out of the forest for much of this length. The valley floodplain offers a distinct visual contrast to the sparse, xerophytic vegetation of the adjacent slopes.
Subjected to various land use practices, the structure of the forest reflects the activities of humans since the early settlers arrived following the Walker expedition of 1834. Portions of the forest were cleared for agricultural fields or cut for fuel (Powers 1971). Grazing, which continues today, has inhibited regeneration of the forest, resulting in areas of homogenous old growth with a dense understory of mulefat (Baccharisviminea ) and stinging nettle (Urtica sp.). Areas where grazing has recently been eliminated are showing a remarkable recovery rate, with proliferous new growth of cottonwood and willow seedlings.
Wildlife
This unusually verdant valley supports an extraordinary abundance and diversity of wildlife. Singularly rich in avifauna, the South Fork riparian forest owes its diversity of birdlife to its location at the confluence of five distinct biogeographic regions, a situation which occurs nowhere else in North America north of Mexico. In the South Fork Valley, the Sierran Forest, Intermountain Sagebrush, California Grassland, American Desert, and California Chapparral provinces converge (Bailey 1978). Over 200 species, including songbirds, woodpeckers, waterfowl, raptors, and others, fill the South Fork forest with a jungle-like symphony of song in the breeding season. Riparian-dependent
[3] Gaines, D.A. 1977. Riparian cottonwood-willow forests in California, an inventory of potential preserves. Report prepared for The Nature Conservancy, Western Regional Office.
[4] Warner, R.E. 1980. Riparian vegetation/wildlife relationships in the South Fork Kern watershed. Unpublished field study prepared for the Kern County Wildlife Resources Commission. 26 p.
[5] Shevock, James. 1981. Personal conversation. Plant ecologist, USDA Forest Service, Sequoia National Forest, Calif.
species such as Wood Duck,[6] Red-shouldered Hawk, Yellow-breasted Chat, Blue Grosbeak, and Yellow Warbler, once common throughout California's riparian forests, but now absent from many of them,[3] still inhabit the South Fork.
The cottonwood/willow forest is a haven for flycatchers, warblers, swallows, and other migrants on their flights over the mountains and deserts. Unusual species such as Indigo Bunting and Rose-breasted Grosbeak are also drawn to the forest.
The South Fork Valley supports an exceptionally high breeding bird population of 98 species, more than one third of the regular nesting species in California identified by Hehnke and Stone (1978). The largest population of the State Rare Yellow-billed Cuckoo outside of the Colorado River region, an estimated 24 pairs, breeds in the South Fork forest.[7] A pair of Osprey also nest in the Valley, one of only two breeding pairs between Mexico and Sacramento.[7] In addition, there are two Great Blue Heron rookeries with approximately 100 active nests.
The South Fork represents one of the last refuges for many species of birds threatened by habitat loss. Thirty-eight species found here are included on the 1981 Audubon Blue List for California, and the California Natural Diversity Data Base List of Special Animals.
Isabella Reservoir
Authorization
The CE Isabella Project was authorized by the Flood Control Act of 1944 to protect the city of Bakersfield, built on the floodplain of the Kern River, from floods. Project authorization included provisions for irrigation and recreation in addition to flood control. The Federal Government paid for approximately 70% of the project costs, with irrigation and hydroelectric power interests contributing 20% and 8% respectively.[8] The project, involving construction of a main and auxiliary dam, began in 1948 and was completed in 1954.
Normally, all water released from the main dam is used for irrigation of agricultural fields in Kern County. When flows are in excess of demand they can be diverted into the California Aqueduct via the Kern River/California Aqueduct Intertie, or to the Tulare and Buena Vista Lakebeds. Releases of floodwaters into the Lakebeds are usually damaging to crops, however.
South Fork Wildlife Area
Riparian System .—The creation of Isabella Reservoir resulted in the immediate loss of approximately 1,300 ha. of South Fork riparian forest.[9] An additional 1,417 ha. of riparian system lie within gross pool elevation (2,605.5 ft. msl). Of this additional area, only approximately 125 ha. are presently heavily forested, the remainder having been deforested by agriculture, woodcutting, grazing, and fire. The area is periodically inundated by the reservoir during years of especially high runoff. This portion of the forest, where the South Fork broadens into a braided delta, is the greatest in width and most dense (fig. 3).
In 1966, in a planning aid letter to the CE, the USDI Fish and Wildlife Service (FWS) recognized the superior value of the remaining cottonwood/willow forest as wildlife habitat. They recommended that grazing be eliminated in the forest because of its adverse impacts, and that the CE manage the area for the enhancement of wildlife values (US Army Corps of Engineers 1979a).
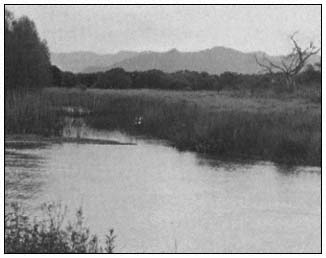
Figure 3.
Morning view of the South Fork
Wildlife Area, looking southeast.
Management Plan .—In 1977, a wildlife management plan for what was to become the SFWA was developed by local CE rangers with professional training in wildlife management. The first phase of the plan called for restoration and wildlife improvement activities in 505 ha. of floodplain riparian zone, from the eastern boundary of the reservoir's gross pool line west to elevation 2,580 ft. msl. The major objective of the plan, to convert agricultural land within the riparian zone back to riparian forest by allowing agricultural leases to expire, has been partially achieved (ibid .) Leases have not been termi-
[6] Scientific names of bird species mentioned in the text are included in Appendix A.
[7] Barnes, Robert. 1981. Personal conversation. President, South Fork Watershed Association, Calif.
[8] Schontzler, G. 1981. Politicians, farmers wrangle over who gets Kern River water. The Bakersfield Californian, Feb. 16, 1981. Sec. B2, p. 1.
[9] Estimated from an aerial photograph taken in 1946, prior to construction of Isabella Dam.
nated, but have instead been placed on inactive status, allowing grazing or agriculture on an interim, short-term basis, as prescribed by the District Engineer.[10]
Other improvements under the SFWA plan have included construction of nesting structures for Mourning Dove, Wood Duck, and Osprey; and construction of a trail system for which an interpretive guide is being prepared. In addition, a riparian reforestation and habitat manipulation program is being implemented.
Because the SFWA lies within gross pool elevation of Isabella Reservoir, the management plan was designed to function under normal operations of the reservoir. Prior to 1978, the reservoir rarely inundated the riparian forest except in years of exceptionally high runoff, and then only for short durations (US Army Corps of Engineers 1978).
SFWA Awards .—In recognition of an outstanding demonstration of its knowledge and appreciation of the most important environmental values, the CE, Sacramento District, received a National Honor Award in the US Army Chief of Engineers Design and Environmental Awards competition for 1979. It also won a CE Divisional Award during the same year. In addition to numerous other commendations, the SFWA management plan earned the CE, Sacramento District, a National Audubon Society award, which was presented in a special on-site ceremony.
Reservoir Water Management .—The flood control function of the reservoir and, secondarily, irrigation demand dictate reservoir operation. According to the Lake Isabella Regulations Manual (ibid .), reservoir level should be drawn down to 170,000 acre-feet (AF) by 1 November each year and kept at this level until 1 February when snowmelt runoff predictions become available. This seasonal drawdown prepares the reservoir for both rain and snowmelt floodwaters. Any water remaining in the reservoir above this 1 November level, that is, within Flood Control Space, is called "winter carryover," and is dependent upon "prevailing conditions" (ibid .). Under no circumstances, however, is the storage of winter carryover permitted above 245,000 AF between 1 November and 1 March, as this minimum reservation is required to control rainfloods (ibid .).
To accomodate irrigation interests, since 1978 winter carryover has been substantially higher than the prescribed flood control capacity, as described in the Regulations Manual. In fact, since 1978 water has encroached on the rainflood reservation space of 325,000 AF (reservoir capacity above 245,000 AF) 40% of the time.[11] A comparison of historical reservoir operations shows that reservoir storage for the 1978–1981 period was substantially higher than ever before (fig. 4). First-of-the-month reservoir storage for the 1978–1981 period was an average of 40,000 AF higher than that of the 1967–1970 period when the total reservoir inflow was actually 13% higher.
The representative for the Kern County water districts maintains that the high winter carryover is the result of a CE reevaluation of the Kern River Basin hydrology.[12] However, the most recent hydrological study shows that the Probable Maximum Flood is actually higher than previously predicted (US Army Corps of Engineers 1979b).
The CE, Sacramento District, Operations Division claims that the completion of the California Water Project, making more water available to Kern County users and allowing more conservation of Kern River water, is responsible for the difference.[13]
Although both parties deny any connection, the Kern River/California Aqueduct Intertie was completed in 1977, reducing the flood hazard to Tulare Lake Basin—the ultimate destination for Kern River floodwaters—by absorbing floodwaters from the Kern River and transporting them south to the Los Angeles area (US Army Corps of Engineers 1978). The Intertie thus reduces the hazard of permitting encroachment into the Flood Control Space of Isabella Reservoir. It also results in the further diversion of water from the basin, which in the past had partially recharged the badly depleted groundwater aquifer.
Regardless of the reason for the change in reservoir storage, it has not been officially acknowledged, and thus no environmental assessment of its effects has been considered. Because of the high winter carryover, the reservoir fills earlier and to a higher elevation during the annual spring snowmelt runoff season, thus changing the timing and increasing the frequency, duration, and depth of reservoir inundation of the SFWA. With a reservoir storage increase of 40,000 AF (the minimum average increase since 1978 as compared to the 1967–1970 period) the reservoir is expected to inundate the lower boundary of the South Fork riparian forest once every four and one-half years, as compared to the 1977 calculation (ibid .) of once every six years. The entire sanctuary will be flooded every 20 years, as compared to once in 100 years.
Prior to 1980, the reservoir reached gross pool capacity only once in its history, in 1969. In 1980, as the result of high winter carryover
[10] Slattery, Thomas. 1981. Personal correspondence. US Army Corps of Engineers, Sacramento District, Real Estate Division.
[11] Calculated from Isabella Project Office daily records.
[12] Williams, Chuck H. 1981. Personal conversation. Kern River Watermaster, Bakersfield, Calif
[13] Verke, Mark. 1981. Personal conversation. US Army Corps of Engineers, Sacramento District, Operations Division, Reservoir Control Section.
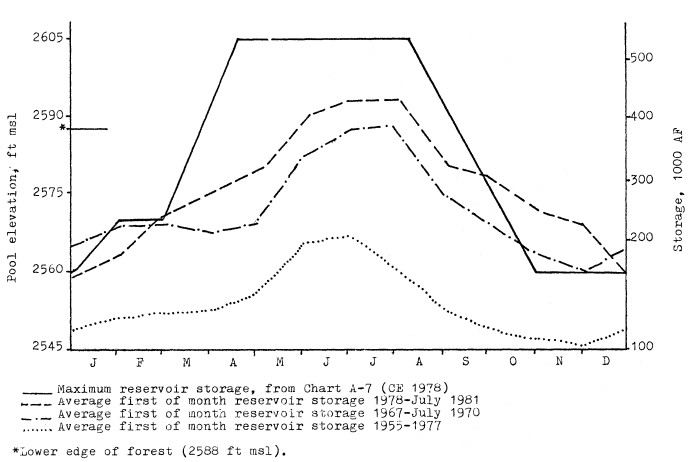
Figure 4.
Comparison of Isabella Reservoir storage for three time periods.
(265,000 AF average from 1 November to 1 March) and high runoff (nearly 200% of normal), Isabella filled to gross pool again and rose an additional 0.46 m. (1.5 ft.) over the dam spillway, an unprecedented event. Encroachment of the riparian forest of the SFWA began in early April, peaked in early July when the entire sanctuary was inundated, and receded in September.
Effects of Reservoir Inundation
Identified by the FWS as the fourth preservation priority in the State, the importance and unique value of the South Fork forest has been widely recognized (see Gaines 1977, and Warner 1980, cited in footnotes 3 and 4), yet no systematic, baseline studies have been conducted in the area. Consequently, when Isabella Reservoir filled to gross pool capacity in 1980, the effects of reservoir inundation on the SFWA could not be predicted. The purpose of the present study was to monitor these effects on the avian community and to evaluate the overall effects of periodic inundation on the habitat values of the SFWA. Necessary to achieve this end, and important in itself, was the establishment of baseline data on bird population diversity and density in 1981.
Methods
Bird Censusing
A variable circular plot technique was used in estimating bird populations.[14] This method has been recommended for assessing the effects of habitat manipulation (Verner 1980).
In order to reduce variability, as suggested by Dawson (1980) and Verner (1980), the number of individuals of a species detected through time, rather than absolute densities, was used in measuring the responses of avifauna to flooding in 1980. Bird densities and diversities were calculated from 1981 data, when the high degree of disturbance from inundation was not a factor.
Fourteen observation stations, representative of five subhabitat-types, were established within the 160 ha. study area:
4 along a forest/field ecotone where inundation is frequent;
3 along a relatively undisturbed ecotone;
[14] Reynolds, R.T., J.M. Scott, and R.A. Nussbaum. 1980. A variable circular-plot method for estimating bird numbers. Unpublished report.
5 in closed-canopy forest;
1 in a dense grove of young trees; and
1 in an open stand of mature trees.
The bird censuses consisted of five "counts", each comprised of six "surveys", completed during April and May 1980 and 1981. A total of 360 person-hours was spent conducting bird surveys. An intensive search for active nests was conducted on the mornings of 22 and 23 May, 1981 at four stations within the closed-canopy forest.
Vegetative Transects
To characterize the difference in vegetative composition, structure, and condition at various frequencies of reservoir inundation, four 100-point transects, modified from Davis (1977), were conducted. The transects ran north to south along elevations corresponding to the 5-, 10-, and 25-year reservoir stage recurrence intervals taken from Chart 20 of the Reservoir Regulations Manual (US Army Corps of Engineers 1978). A control transect was run at the 300-year reservoir stage recurrence interval. Although not subjected to reservoir inundation, the control transect area was actively grazed.
Results and Discussion
Displacement of Birds
When the study period began on 7 May, 1980, Station 1, the lowest in elevation, was under 7.5 cm. (0.25 ft.) of reservoir water. The reservoir steadily rose, inundating five ecotonal stations by 30 May, 1980. In response to reservoir inundation, bird populations and species richness showed significant declines. Figures 5 and 6 depict the decline in these parameters in relation to water depth for the five stations subjected to inundation during the study period.
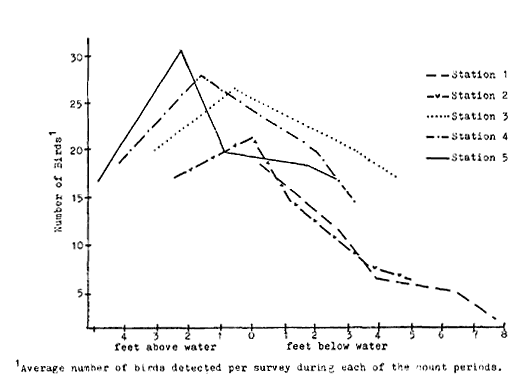
Figure 5.
Bird populations and Isabella Reservoir
inundation levels, 1980, at five stations.
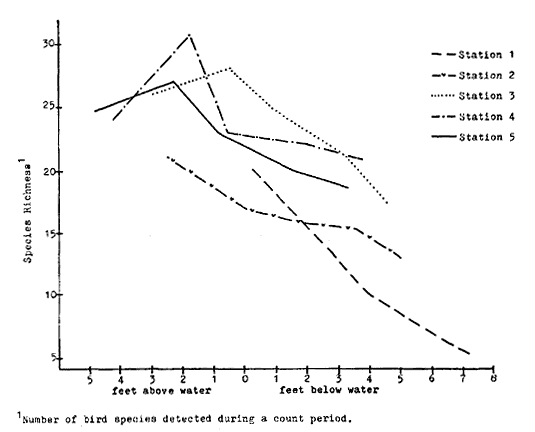
Figure 6.
Bird species richness and Isabella Reservoir
inundation levels, 1980, at five stations.
Because bird species have different habitat requirements, utilizing the riparian environment differently, their responses to inundation varied. Bird species were grouped into the following four guilds based on their preferred nesting sites: 1) species which nest on the ground; 2) species which nest in shrubs; 3) species which nest among the foliage or branchwork of trees; and 4) species which nest in tree cavities.
The declines in bird populations and species richness are depicted for each guild in figure 7. The figure illustrates proportionately greater decline in ground and shrub nesters. The percent decline represents the average for the five stations once the reservoir level reached each station and assumes a linear decline. Data show, however, the decline in bird species abundance was roughly logarithmic, showing the greatest de-
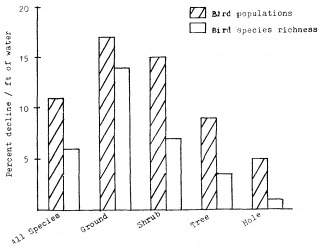
Figure 7.
Average decline of bird populations and
species richness for four nesting guilds. The
percent decline per foot of inundation once
Isabella Reservoir water level reached each
station was averaged for five ecotone stations.
cline during the first several feet of inundation, then leveling off.
As the water rose, birds utilizing the ground and shrubs for nesting and food sources were displaced to higher ground. Nests were destroyed and unfledged young were drowned. In general, tree nesting species stayed in flooded territory for a short time, but were eventually forced to leave because of reduction in available food and the threat to nests as the reservoir filled. The emigrating forest birds were temporarily replaced by shorebirds foraging along the shoreline of the advancing reservoir. Once inundation was complete, however, this habitat niche was also eliminated.
The influx of emigrating birds to unflooded regions, illustrated by increases in population densities and species richness just prior to inundation of a station, upset the balance of the entire avian community. There was a marked increase in agonistic activity, especially among the wrens and orioles, as competition for scarce unclaimed territories was heightened. The more aggressive species such as Starlings and blackbirds were observed to dominate perch sites previously shared by many species. Interspecific conflicts, indicative of lack of suitable nesting sites, were frequently observed. All of these factors cut into the parents' time and energy budgets. Smaller, more crowded territories, with a less abundant food supply, reduced nesting success and eliminated the opportunity for second and third broods.
Bird Census, 1981
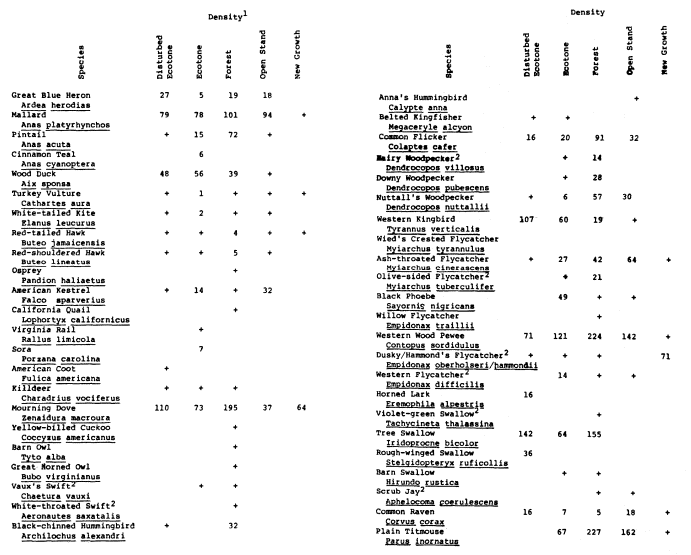
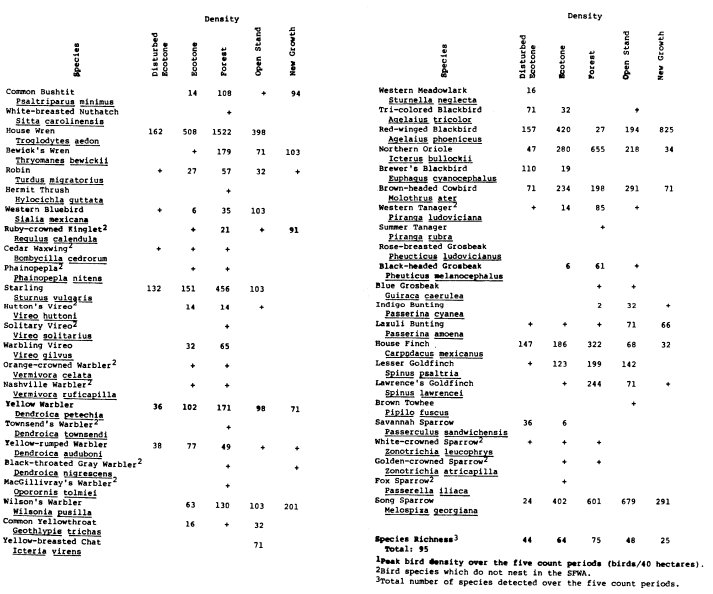
Average aggregate bird densities, species diversity, and species richness for each count in each subhabitat-type are shown in table 1. Densities and diversities include only breeding populations. The highest average aggregate density was 3959 birds per 40 ha. in the closedcanopy forest. The low species diversity in the new-growth subhabitat-type is attributed to the predominance of Redwinged Blackbirds, which comprised over 60% of the total density; when this species is excluded, the new-growth subhabitattype had the lowest density as well.
The exceptionally high bird densities of the South Fork forest well exceed the high density limits established by Peterson (1941), and are comparable even to worldwide maxima (Johnson et al . 1977). The intensive search for and location of 66 nests at four of the survey stations supports the high estimates obtained. Twenty-two active nests were found within a radius of 30 m. from Station 8 alone; the resulting breeding bird density would be over 6,000 birds per 40 ha. Bird densities for individual species within the SFWA are given in Appendix A.
When the rate of decline of bird populations observed in 1980 is applied to the high density estimates of 1981, the effects of reservoir inundation are clearly shown to be devastating.
Vegetation
Caution must be used in drawing conclusions about the effects of reservoir inundation on the condition of vegetation in the SFWA, as it has been affected by land use practices such as grazing, farming, and woodcutting as well (fig. 8). However, it is clear that prolonged inundation has significant immediate and long-term effects on vegetation. While some effects are readily observable after one season, others are not until some years later, when trees may die abruptly after a period of continued growth (Ewel 1978).
The immediate result of flooding, described by Teskey and Hinckley (1977), is the creation of an anaerobic environment around root systems, producing a variety of physiological plant stresses. The duration, depth, and rate of movement of floodwater are important factors controlling oxygen availability to the roots and hence the degree of stress produced. The time of year is also important; plants are much more susceptible to stress during the growing season (Walters etal . 1980).
Table 2 summarizes the data from four vegetative transects along the 5-, 10-, 25-, and 300-year reservoir stage recurrence intervals. Data show that total tree density, tree species diversity, average percent canopy cover, and average tree height all decrease with greater frequencies of reservoir inundation. The number of trees that died during the 1980 growing season (dead trees in 1981, with the previous year's leaves remaining), number of fallen trees, and degree of mistletoe (Phoradendron flavescens ) infestation decreases with increasing elevation.
The decline in total tree density from 550 trees per ha. at transect 4 to 1 tree per ha. at transect 1 is dramatic. Although transect 2 appears to be more dense than transect 3, the filling in of a former open field with young black willow (Salix Gooddingii ), of which 51% are more than 50% decadent, accounts for the high density figure.
Tree condition related to three age-classes for each tree species is shown in figure 9. The histogram illustrates a greater degree of decadence at lower elevations where inundation is most frequent.
Ewel (1978) concluded that the dependence of species composition on hydroperiod and depth of flooding is clearly the most sensitive characteristic of riparian ecosystems. Long periods of flooding eliminate the more sensitive species and generally favor the early successional stage species (Walters etal . 1980). The degree of decadence and mistletoe infestation were especially high among the cottonwoods along the lower elevation transects. In contrast, along the same transects, there was a high proportion of healthy black willow. These results indicate that Fremont cottonwood is least tolerant and black willow most tolerant of prolonged inundation in
| ||||||||||||||||||||||||||||||||||||||||||||||||||||||||||||||||||||||||||||||||||||||||||||||||||||||||||||||||||||||||||||||||||||||||||||||||||||||
the SFWA. Teskey and Hinckley (1977) classified Fremont cottonwood as "intermediately tolerant," that is, able to withstand one to three months of partial inundation during the growing season, and black willow as "tolerant," or able to withstand flooding for most of one growing season.
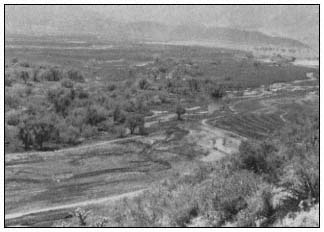
Figure 8.
Scattered willows and cottonwoods of the
SFWA where the forest enters Isabella Reservoir.
| |||||||||||||||||||||||||||||||||||||||||||||||||||||||||||||||||||||||||||
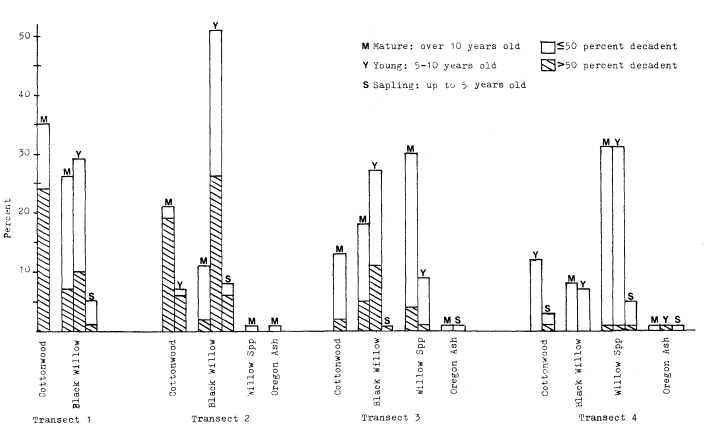
Figure 9.
Tree species composition, degree of decadence, and age-class for four vegetative transects within the SFWA, 1981.
The combined effects of grazing and inundation have retarded the regeneration of new trees, especially at lower elevations where large open fields have shown high potential for riparian reforestation. On transect 1, there were no seedling, sapling, or young cottonwoods. All seedling willows were concentrated in one narrow slough and had sprouted in 1981. Transect 2 had a high percentage of young willows concentrated in the interior forest, where aerial photographs show a former open field. This area was probably not easily accessible to cattle. Transect 4, an actively grazed area above gross pool, also had few seedlings or saplings of any species and was the only transect which showed a high percentage of mulefat—a shrub which is less palatable to cattle. The majority of the saplings, preferred food for cattle, were able to survive by growing through the protective center of a mulefat shrub.
The increase in percentage of fallen trees from transect 4 to transect 1 indicates that increased inundation also reduces soil stability, resulting in less support for root systems.
Another effect within the study area was the change in herbaceous vegetation in open fields. Prior to inundation, dominant plants were alfalfa (Medicagosativa ), mustards (Rorrippa and Descurainia spp.), and various grasses (Graminae). When the water receded, the fields were recolonized by cocklebur (Xanthium ) of little wildlife value and a nuisance to visitors.
The plant species composition also changed in a cattail (Typha ) marsh of 4 ha. The cattails did not regenerate after inundation and were replaced with curly dock (Rumex spp.) and monkey flower (Mimulusguttatus ).
Vegetation-Bird Relationships
The longer term effects of reservoir inundation on bird populations will be the result of an overall decrease of habitat value of the forest. Bird densities along ecotone stations are correlated with tree densities, both increasing with elevation. This correlation is also supported by the findings of Carothers and Johnson (1975) in a homogenous cottonwood forest. They found a linear relationship between bird density and tree density with a more rapid decline in bird populations if tree density fell below 25 trees/ha. Johnson (1970) also found that breeding bird populations in a cottonwood forest were reduced when tree density declined.
Tree species composition and age-class diversity also increased with elevation, showing an association between less diverse forest and lower bird densities at lower elevations.
The reduction in density of mature cottonwoods, in particular, has negative implications for bird populations. Nest site locations in the SFWA show that although mature Fremont cottonwood composed only 12% of the forest tree composition in the proximity of stations 8, 10, and 13 (transect 3), they supported 89% of the 45 nests found at these stations. Willow species, constituting 83% of the trees, supported only 9% of the nests. Three percent of the nests were found in herbaceous understory. In a study of nesting birds of a cottonwood/willow community in California, Ingles (1950) also found that hole-nesting birds preferred cottonwood over other tree species.
Although new growth is essential to the continued viability of the forest and contributes to structural diversity, study results show that uniform stands of young trees are less favored habitat for birds than mature groves. Anderson etal . (1978) concluded that along the lower Colorado River, as trees mature they approach their full value to wildlife.
The elimination of the 4 ha. cattail marsh displaced a blackbird colony of several thousand breeding birds in 1980. Because the cattails failed to regenerate, the colony was reduced to less than 50 pairs in 1981.
As Best etal . (1978) has pointed out: "Birds with restricted habitat usage patterns are more vulnerable to changes in land use practices than those occupying a wider variety of environments." The high dependency of birds on riparian vegetation makes them especially susceptible to the effects of habitat degradation.
Additional Effects
Inundation also had important secondary impacts on wildlife and habitat improvements of the SFWA. Fishing activities, popular once the forest was under water, caused considerable disturbance to the Great Blue Heron rookery and to nesting Osprey. Because of the interference, no Osprey were hatched in 1980. Perch poles, necessary for successful utilization of nesting platforms, were washed away.
Reductions in mammals and other vertebrates were not quantified, but animals floating on debris or drowned were encountered daily during the study period in 1980. While mature birds were able to fly ahead of the advancing water level in the reservoir, many other terestrial animals were trapped. A prominent local naturalist has noted the absence of numbers and species of animals throughout the winter after inundation.[15] The recolonization rates for all species are unknown.
Inundation caused substantial damage to CE-constructed improvements in the SFWA. Artificial nesting boxes were inundated, many with occupants. All three footbridges were washed out and required reconstruction. Water control structures, including Waterman gates, levees, and ponds were destroyed, and cattle exclusion fences severely damaged. Repeated inundation will result in the destruction of the water system rebuilt in 1981, as well as other repairs and improvements; and damage or death to newly planted cottonwoods and willows.
Inundation also precluded visitor use of the SFWA for at least three spring and summer months during the season when visitation at Isabella Reservoir is highest.
Conclusions
Reservoir inundation has many adverse impacts on vegetation and wildlife in the SFWA. Flooding drastically reduces the unusually high bird populations of the SFWA by drowning and displacement. Prolonged flooding decreases tree density and diversity, which reduces the overall habitat value of the forest. The timing of inundation, during the spring nesting season of birds, and growing season of trees, amplifies these effects. Inundation is also destructive to CE structural and other improvements and significantly reduces the opportunity for visitor use of the area.
While high winter carryover is an immediate concern, enlargement of Isabella Reservoir, which is currently under consideration,[16] poses a more long-term threat of permanent inundation of part of the SFWA and more frequent inundation of the remainder.
Although the CE has made commendable habitat improvements, it maintains that it is helpless to prevent seasonal inundation of the SFWA. It has often been stated that because the SFWA is not one of the authorized purposes of Isabella Reservoir, it cannot be included in the determination of winter carryover. Failure to consider the management of the SFWA as a part of the management of the reservoir is a result of the lack of official recognition of the CE's responsibility to protect the values of the SFWA, and a lack of recognition of a change in winter carryover policy as a significant action requiring environmental impact assessment and mitigation.
If the CE's commitment to enhancement of natural values is to be honored, the South Fork Wildlife Area must be recognized as a legitimate concern and incorporated into reservoir operations and management.
Acknowledgements
This research was supported by a grant from the Environmental Field Program, University of California, Santa Cruz. We wish to thank Dr.
[15] Wilson, Lee. 1981. Personal conversation. Kernville, Calif.
[16] US Army Corps of Engineers, Sacramento District. 1977. Kern River Basin investigation.
Richard Warner for invaluable assistance throughout the study. Thanks also to the US Army Corps of Engineers, Sacramento District, and Isabella Project Office for providing information, logistic support, and other helpful assistance throughout the study.
Literature Cited
Anderson, B.W., R.D. Ohmart, and J. Disano. 1978. Revegetating the riparian floodplain for wildlife. p. 318–333. In : R.R. Johnson and J.F. McCormick (tech. coord.). Strategies for protection and management of floodplain wetlands and other riparian ecosystems: Proceedings of the symposium. [Callaway Gardens, Ga., Dec. 11–13, 1978]. USDA Forest Service GTR-WO-12. 410 p.
Bailey, R.G. 1976. Ecoregions of the United States. U.S. Government Printing Office 777–124. USDA Forest Service Intermountain Region, Ogden, Utah.
Best, L.B., D.F. Stauffer, and A.R. Geier. 1978. Evaluating the effects of habitat alteration on birds and small mammals occupying riparian communities. p. 117–124. In : R.R. Johnson and J.F. McCormick (tech. coord.). Strategies for protection and management of floodplain wetlands and other riparian ecosystems: Proceedings of the symposium. [Callaway Gardens, Ga., Dec. 11–13, 1978]. USDA Forest Service GTR-WO-12. 410 p.
Carothers, S.W., and R.R. Johnson. 1975. Water management practices and their effects on non-game birds in range habitats. p. 210–222. In : Management of forest and range habitats for nongame birds: Proceedings of the symposium. [Tuscon, Ariz., May 6–9, 1975]. USDA Forest Service GTR-WO-1. 343 p.
Davis, G.A. 1977. Management alternatives for riparian habitat in the southwest. p. 59–67. In : R.R. Johnson and D.A. Jones (tech. coord.). Importance, preservation and management of riparian habitat: a symposium. [Tuscon, Ariz., July 9, 1977]. USDA Forest Service GTR-RM-43. 217 p. Rocky Mountain Forest and Range Experiment Station, Fort Collins Colo.
Dawson, D.G. 1981. The usefulness of absolute ("census") vs. relative ("sampling" or "index") measures of abundance. p. 554–558. In : C.J. Ralph and J.M. Scott (ed.). Estimating the numbers of terrestrial birds: Proceedings of the symposium. [Asilomar, Calif., Oct. 26–31, 1980]. Cooper Ornithological Society, Allen Press. Lawrence, Kansas.
Ewel, K.C. 1978. Riparian ecosystems: conservation of their unique characteristics. p. 56–62. In : R.R. Johnson and J.F. McCormick (tech. coord.). Strategies for protection and management of floodplain wetlands and other riparian ecosystems: Proceedings of the symposium. [Callaway Gardens, Ga., Dec. 11–13, 1978]. USDA Forest Service GTR-WO-12. 410 p.
Hehnke, M., and C.P. Stone. 1978. Value of riparian vegetation to avian populations along the Sacramento River system. p. 228–235. In : R.R. Johnson and J.F. McCormick (tech. coord.). Strategies for protection and management of floodplain wetlands and other riparian ecosystems: Proceedings of the symposium. [Callaway Gardens, Ga., Dec. 11–13, 1978]. USDA Forest Service GTR-WO–12. 410 p.
Ingles, L. 1950. Nesting birds of the willow-cottonwood community in California. Auk 67:325–333.
Johnson, R.R. 1970. Tree removal along southwestern river: effects on associated organisms. Amer. Phil. Soc., Yearbook 1970. p. 312–322.
Johnson, R.R., L.T. Haight, and J.M. Simpson. 1977. Endangered species vs. endangered habitats: a concept. p. 68–79. In : R.R. Johnson and D.A. Jones (tech. coord.). Importance, preservation and management of riparian habitat: a symposium. [Tuscon, Ariz., July 9, 1977]. USDA Forest Service GTR-RM-43. 217 p. Rocky Mountain Forest and Range Experiment Station, Fort Collins Colo.
Peterson, R.T. 1941. How many birds are there? Audubon 43:179–187.
Powers, R. 1971. South Fork Country. Western Cove Press, Los Angeles, Calif.
Shannon, C.E.; and W. Weaver. 1948. The mathematical theory of communication. University of Illinois Press. Urbana, Ill.
Teskey, R.O., and T.M. Hinckley. 1977. Impact of water level changes on woody riparian and wetland communities. Vol. I: Plant and soil responses to flooding. USDI Fish and Wildlife Service OBS-77/58. 30 p. National Stream Alteration Team, Columbia, Mo.
US Army Corps of Engineers, Sacramento District. 1978. Isabella Lake reservoir regulation manual.
US Army Corps of Engineers, Sacramento District. 1979a. Isabella Lake master plan. Design memorandum no. 5.
US Army Corps of Engineers, Sacramento District. 1979b. Kern River Basin hydrology. Office report. January, 1979.
USDI Fish and Wildlife Service. 1980. Important fish and wildlife habitats in California: an inventory. Portland, Oregon.
Verner, J. 1980. Measuring responses of avian communities to habitat manipulation. p. 543–547. In : C.J. Ralph and J.M. Scott (ed.). Estimating the numbers of terrestrial birds: Proceedings of the symposium. [Asilomar, Calif., Oct. 26–31, 1980]. Cooper Ornithological Society, Allen Press. Lawrence, Kansas.
Walters, A.M., R.O. Teskey, and T.M. Hinckley. 1980. Impact of water level changes on woody riparian and wetland communities. Vol. VII: Mediterranean region, western arid and semi-arid region. USDI Fish and Wildlife Service OBS-78/93. 84 p. National Stream Alteration Team, Columbia, Mo.
|
|
Potential Effects of Sewage Effluent Removal on the Lower Salinas River Riparian System[1]
Thomas T. Jones and Bruce W. Snyder[2]
Abstract.—The effects of summertime stream dewatering on the Salinas River and Lagoon due to removal of two wastewater treatment discharges were examined. It was found that there would be no adverse impact on the lagoon, but that the riparian vegetation may suffer from loss of water. A four- to six-year monitoring program is proposed to determine the precise effects.
Introduction
The Salinas River system is located in the intermontane valley of the Central Coast Ranges of California. From its headwaters in San Luis Obispo County, the river flows northwesterly through the Salinas Valley to its mouth in Monterey Bay. Almost all of the surface flow occurs from December through April as precipitation runoff.
Surface flow in the river is regulated by three dams and reservoirs on the upper reaches of the Salinas, Nacimiento, and San Antonio rivers. Santa Margarita Lake on the Salinas River is used as a municipal water supply for the city of San Luis Obispo. The Nacimiento Reservoir and the San Antonio Reservoir are used for flood control in the winter and spring and for groundwater recharge of the lower Salinas Valley aquifers in the summer and fall.
Proposed Project
In 1974, the Central Coast Basin Water Quality Control Plan Report (State Water Resources Control Board and Regional Water Quality Control Board, Central Coast Region 1975) called for removal from the Salinas River of the sewage effluent generated by the City of Salinas' two secondary wastewater treatment plants. This was to be accomplished by abandoning the treatment plants and pumping the wastewater to a new regional plant to be built on the Marina landfill site. This would result in the removal of about 0.28 m3 per second (10 cfs) of effluent from the river. During the summer months this effluent constitutes all or a major portion of the flow in the river below the Highway 68 bridge. The Basin Plan (ibid .) recognized this fact and recommended that a study of the effects of the effluent removal be conducted before project implementation.
The Monterey Regional Water Pollution Control Agency (MRWPCA) was the agency responsible for implementing the project. The Environmental Impact Statement (US Environmental Protection Agency and Monterey Regional Water Pollution Control Agency 1978) on the Final Facilities Plan (Engineering-Science 1978) also recommended that the effects on the river and lagoon of removal of effluent be studied. A task force composed of representatives from various concerned state and local agencies was formed to monitor and direct the study. The study was initiated in early 1979 with the objective of determining the effects of the flow reduction on the lower Salinas River. This paper summarizes the results of that study, completed in March 1981 (Engineering-Science 1980), and the actions which have followed.
Ecosystem Characterization
Study Area Description
The area potentially affected by the proposed project includes riparian forest, freshwater marsh, saltwater marsh, and the lagoon near the river mouth. A map of the study area is shown in figure 1. The boundary farthest upstream is set by the City of Salinas Alisal wastewater treatment plant outfall, which discharges about 0.004 m3 per second (1.5 cfs) about 200 m. (220 yd.) upstream of the Highway 68 bridge. The reach of river just upstream from Alisal is normally dry during the summer; water releases from the two reservoirs upstream are regulated such that all surface flow has percolated into the ground above this point. The City of Salinas' main treatment plant discharges about
[1] Paper presented at the California Riparian Systems Conference. [University of California, Davis, September 17–19, 1981].
[2] Thomas T. Jones is Environmental Engineer with Engineering-Science, Inc., Berkeley, Calif. Bruce W. Snyder is Terrestrial Ecologist with Engineering-Science, Inc., Denver, Colo.
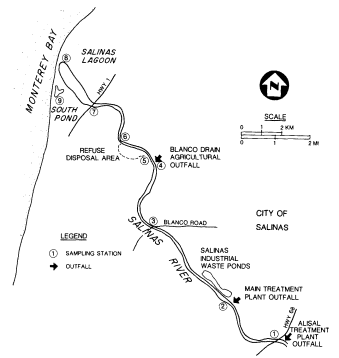
Figure l.
Map of the study area showing sampling locations
and significant point source discharges to the river.
0.24 m3 per second (8.5 cfs) about 2.5 km. (2.5 mi.) downstream from Alisal.
Except for the riparian corridor, the land on both sides of the river has been extensively cleared for agricultural use. The land north of the river is uniformly flat for several miles; just south of the river and inland from Highway 1, the land rises sharply to elevations of 40 to 100 m. (125 to 330 ft.).
The lagoon at the mouth of the river is part of the 210 ha. (518 ac.) Salinas River Wildlife Refuge and serves as a feeding and breeding ground for large numbers of birds. During high flow periods, the lagoon is open to the bay, and the river discharges to Monterey Bay. During the summer, sand dunes close off the mouth, and the river discharges through Moss Landing Harbor about 6.5 km. (4 mi.) to the north via the old Salinas River channel.
Baseline Study Plan
The first phase of the monitoring program was a baseline study, initiated in 1979. Its objectives were to: 1) characterize the study area with respect to hydrology, water quality, and ecology; and 2) determine if there was a need for detailed impact analysis because of the proposed project. The study was conducted during the summer of 1979. Nine sampling stations, shown in figure 1, were established. At each station except Station 6, which proved to be inaccessible, the flow, electrical conductivity (EC), and temperature of the water were measured biweekly; in addition, at Stations 7 and 8 the dissolved oxygen (DO), ammonia, total organic nitrogen, nitrite, nitrate, phosphorus, and major cation and anion concentrations were measured monthly. This was done to better identify impacts on the water quality in the lagoon. The ecological portion of the study identified the dominant plant and animal species within the study area; it consisted of a literature review and two week-long field trips to the area.
Hydrology and Water Quality
Sources of Water Flow
A major effort of the baseline study was to identify the sources of summertime flow in the lower Salinas River. There are three major point sources of discharge within the study area; the two City of Salinas treatment plants and the Blanco Drain, which discharges an average of about 0.11 m3 per second (4 cfs) approximately 8 km. (5 mi.) upstream from the mouth. This drain discharges agricultural irrigation water runoff from about 2,400 ha. (6,000 ac.) north of the river. In addition to these major point sources, there are numerous nonpoint sources of agricultural return water along both sides of the river and along the north side of the lagoon.
There are two other potential sources of water to the lagoon: groundwater inflow from the surrounding land, and seawater inflow from Monterey Bay. The magnitude of the groundwater inflow (or outflow) was measured by constructing groundwater wells around the periphery of the lagoon and calculating the magnitude and direction of flow based on soil permeability and water level difference in the wells. Seawater inflow was estimated by performing a salt balance on the lagoon water, and by a previous study which directly measured seawater inflow (Muckel etal . 1964).
Since it was impossible to measure the nonpoint flow into the river directly, it was calculated by performing a mass balance between the various sampling points on the river. The average nonpoint inflow between stations was estimated as the difference between the upstream flow and any known point source inflows within the reach. An average value for this flow per unit length of river was then computed and applied to the entire length of river and lagoon to give a total value for nonpoint inflow.
Using the data thus collected, an overall water budget for the river and lagoon was constructed. This is presented in figure 2. Surface flow into the lagoon accounted for about 92% of the inflow; of this, about 45% was from the treatment plants and the rest was from the Blanco Drain outfall and nonpoint sources. In the river, the quantity of flow from the treatment plants ranged from 100% in the upper reaches of the study area to about 45% at the head of the lagoon. Groundwater inflow from the periphery of the lagoon was negligible; seawater inflow was also very small. One source of water which was
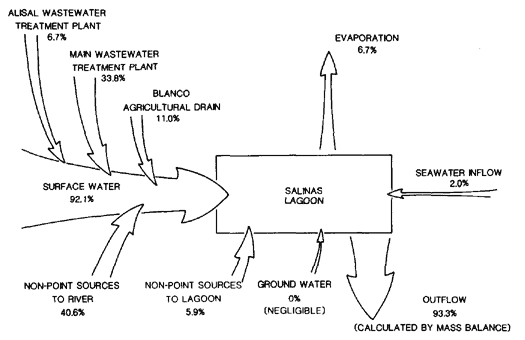
Figure 2.
Low-flow water balance for the lower Salinas River and Lagoon.
not measured was subsurface flow in the river channel.
Water Quality
Important water quality parameters which would be most affected by the proposed project were total dissolved solids (TDS), nutrients, ammonia, DO, pesticides, and coliform levels. TDS was measured at each station biweekly; nutrients, ammonia, and DO were measured monthly at Stations 7 and 8 to assess their effects on the lagoon. Pesticides and coliform levels were not measured, but data from other sources were reviewed. The significant findings for each parameter are discussed below.
Total Dissolved Solids .—TDS was determined indirectly by measuring electrical conductivity (EC) and temperature. The TDS values for the treatment plant effluents were generally less than half those for the Blanco Drain outfall, which is representative of agricultural runoff water. As expected, therefore, the TDS values generally increased downstream as more agricultural water entered the river. In particular, the TDS at the lower end of the lagoon (Station 8) was substantially higher than anyplace else in the river, due largely to seawater inflow through the sand dunes. The result of removing the sewage effluents would be to generally raise the TDS level in the river and lagoon by about a factor of two, from 1,000–1,500 mg. per l. at present to about 2,500–3,000 mg. per l.
Nutrients .—Nutrients in the form of total nitrogen and total phosphorus were measured at the upper (Station 7) and lower (Station 8) ends of the lagoon. Total phosphorus (as P) values ranged from 3.20 to 20.26 mg. per l. at Station 7 and from 0.72 to 5.56 mg. per l. at Station 8. Total nitrogen (as N) values ranged from 14.7 to 21.0 mg. per l. at Station 7, and from 4.4 to 11.2 mg. per l. at Station 8. The data indicated that nutrient removal in the lagoon was high. In addition, there was a shift in nitrogen speciation from predominantly ammonia nitrogen and nitrate to predominantly organic nitrogen and nitrate forms. These effects were undoubtedly due to algal activity in the lagoon. The treatment plant effluents are major contributors of these nutrients; mass balance calculations indicated that the two treatment plants contributed at least half and often virtually all of the nutrients found at Station 7. The Blanco Drain water (and most likely, nonpoint agricultural return water as well) occasionally had high nutrient levels, due to over-application of fertilizer, but generally it had low nutrient concentrations.
Ammonia .—Ammonia levels at Station 7 ranged from 3.09 to 16.0 mg. per l. and at Station 8 from 0 to 4.8 mg. per l. The levels of ammonia were directly correlated with high levels of ammonia in the treatment plant effluents. Mass balance calculations indicated that the plants consistently contributed most or all of the ammonia found at Station 7. Presumably, the ammonia levels upriver were even higher since less dilution water for the plant effluents was available. At the pH and temperatures encountered, these ammonia levels would lead to unionized ammonia—which is its toxic form—considerably in excess of the US Environmental Protection Agency EPA criterion of 0.02 mg. per l. Fish sensitivity to un-ionized ammonia varies widely among species and within the same species depending upon other environmental stress parameters (Willingham 1976).
Dissolved Oxygen .—DO levels at Station 7 ranged from 5.9 to 21.5 mg. per l. and at Station 8 ranged from 9.0 to 24 mg. per l. These generally high values were undoubtedly due to algae photosynthesis. All measurements were taken in the late morning or early afternoon when photosynthetic production of DO would be relatively high. Usually, in environments with high algal productivity, such as this, values drop substantially at night or in very cloudy weather, and can even be reduced to zero, due to algae decay.
Pesticides .—Historical pesticide data for the Salinas River, treatment plant effluents, and Blanco Drain water were examined. All the Salinas River levels were well below 1 ppm with the exception of one measurement of over 30 ppm of Diazinon at Stations 2 and 3 in October 1978. Diazinon was used to contol mosquitoes in the river and was undoubtedly the source of the high levels. A fish kill also occurred at this time, and was attributed to either the pesticide or the high ammonia levels, or a combination of both (Greenfield and Grunt 1978). A few pesticide analyses from Blanco Drain water also showed levels consistently less than 1 ppm. No pesticides have ever been detected in the effluents of either treatment plant.
Coliforms .—Coliform levels at various locations in the river have been periodically monitored by various agencies, (e.g., Bureau of Sanitary Engineering 1971; Irwin 1976). These studies have consistently shown much higher coli-
form levels below the treatment plant discharges than above them. Although coliforms can be contributed by agricultural runoff water, it is likely that most of the coliforms in the river were due to the treatment plant effluents. High coliform levels indicate a health hazard, and they were one of the main factors in the decision to remove the treatment plant discharges from the river. Chlorination by the treatment plants has been subject to periodic breakdown in the past, which led to very high coliform levels in the effluent.
Ecology
The lower Salinas River ecological environment is composed of four major systems: salt marsh, freshwater marsh, riparian woodland, and river/lagoon. In the past, various water resource development activities have been responsible for significant degradation or loss of these once abundant systems throughout central California and elsewhere in the West. Because of the magnitude of past losses and the inherent biological values of these systems, they are now the focus of attention in ecological circles.
Salt Marsh
About 25 ha. (63 ac.), or seven percent of the study area, is salt marsh intermixed with mudflats and salt pans. The salt marsh system is located in the lower river sections near the confluence of the coast and lagoon environments. High concentrations of soil salts restrict the diversity of plants that can exist in the salt marsh. California coastal salt marshes are dominated by pickleweed and salt grass and receive only irregular salt water flooding. Pickleweed comprised about 90% of the salt marsh vegetation. Additional plant species appeared in localized areas along the lagoon/marsh interface where more frequent flooding reduces soil salinity.
The mixture of shallow water, mudflats, and vegetation in the salt marsh constitute an important wildlife area, especially for birds. The dense stands of pickleweed were heavily utilized by both resident and migrant waterfowl. Bird abundance and species diversity in the salt marsh and adjacent lagoon area were the highest in the study area. Over 127 species, both resident and migrant, have been observed in the general area. Major bird groups included gulls, terns, shorebirds, wading birds, and waterfowl. Figure 3 shows the lagoon and bordering salt marshes.
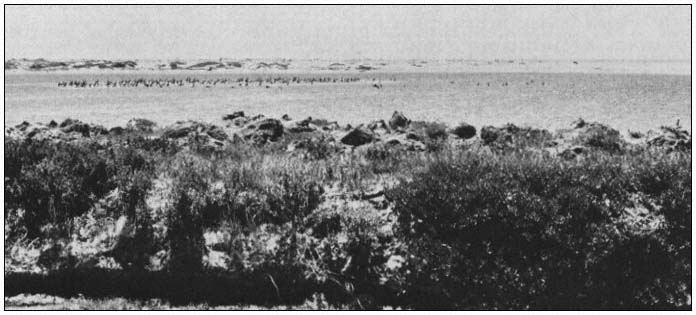
Figure 3.
Salinas River Lagoon, with salt marsh area in the foreground and sand dunes separating the
lagoon from Monterey Bay in the background. Note the utilization of the lagoon by birds.
Inputs of soil moisture in the salt marsh come from both freshwater and saltwater sources. Saltwater comes directly from nearby Monterey Bay as salt spray or storm surges. High winds and tides send water around or over the dunes and onto low-lying marsh areas. Freshwater inputs are supplied primarily by rainfall. However during flood conditions, overbank flooding from the Salinas River is an additional source.
Land elevation has very important effects on salt marsh soil moisture and standing water dynamics. Elevation of the salt marshes isolates them and prevents their regular inundation by either saltwater from the bay or freshwater from the Salinas River. The salt marshes are perched
above the normal river channel and receive water from the river only during extremely high flow conditions. During normal flow conditions, water of the lower Salinas River Lagoon is channeled away from the salt marshes by high streambanks and therefore plays no significant role in the salt marshes' short-term hydroperiod. The water and salinity regime of the Salinas salt marshes are instead controlled by rainfall and by oceanic and evaporative processes not linked to normal river flows.
Freshwater Marsh
The freshwater marsh system is very limited in size and distribution; this system totals less than 0.8 ha. (2 ac.), less than 0.5% of the study area. Freshwater marshes occur as isolated, small stands rather than large, contiguous units. The dominant emergent plant was broad-leafed cattail. Small stands were scattered throughout the channel; they were most abundant below the Blanco Drain outfall, where water was constantly available.
The limited distribution and small size of this system precludes the development of any uniquely associated wildlife assemblage. Wildlife species present in freshwater marsh areas were also found in adjacent riparian woodlands.
The presence of standing water is the crucial parameter in this system. The depth of water and duration of submergence determine vegetative composition, zonation, and succession.
Riparian Woodland
Riparian woodland dominates the terrestrial areas, comprising approximately 93% of the upland portion of the study area. Riparian woodland extended almost continuously from the Highway 68 bridge to just east of the Highway 1 bridge. It formed an extremely narrow corridor, being confined to the Salinas River channel and occasional scattered waste places along the banks and floodplain that have not been converted to agricultural uses. Cottonwood and willow species were the important plant dominants. The relative abundance of these plants varied considerably along the river. Land elevation, local depth to groundwater, and, most importantly, the local land management techniques employed in adjacent areas determine the vigor, stature, and relative abundance of these species in the corridor.
The open floodplain bordering the Salinas River channel is frequently flooded by the natural rising of the river. Species growing in this habitat are adapted to flooding and constantly moist soil. Groundwater is continually recharged by overbank flows and subsurface seepage from nearby surface flows (Keller 1977; Johnson etal . 1976; Crouch 1979). Most species are low-growing annual or perennial herbs and grasses.
Wherever unstable soils accumulate to form slightly elevated gravelbars, dense stands of shrubs up to 7 m. (24 ft.) tall have developed. The dominant shrub, sandbar willow, is the first species to colonize the gravelbars. Other dominant shrubs include arroyo willow and mule fat. Herbs usually grow towards the edge of the gravelbars. In time, the elevation of the gravelbar becomes higher and the gravelbar more distant from the river due to continual soil deposition. As a result, flood frequency decreases.
These new conditions favored the establishment of riparian forest, characterized by tall trees crowded and tangled with vines (Sands 1979). There were several vegetation layers within the forest along the Salinas River. Overstory trees attained heights up to 23 m. (75 ft.). The dominant overstory species was Fremont cottonwood. A subcanopy layer 4.6–13.7 m. (15–45 ft.) high was formed by red willow, black cottonwood, and box elder. Understory species consisted primarily of tall herbs and tangling vines.
This riparian forest or woodland corridor provides refuge for a large number of wildlife species unable to exist in adjacent agricultural areas. Bird population levels and species diversity were high. Common mammals included raccoon, deer, and cottontail rabbit. Coyote, grey fox, and bobcat were occasionally present.
River/Lagoon
For analytical and descriptive purposes, the river and brackish lagoon environments were combined into one functional ecosystem. This was done because of the intricate interdependencies, the absence of any distinct boundary between the two systems, and the functional similarity of the driving forces of the two systems.
The freshwater riverine zone extends roughly from the Alisal wastewater treatment plant outfall downstream approximately to the California Highway 1 bridge. At the bridge, a gradual transition from fresh to slightly brackish water occurs as the river merges imperceptibly into the lagoon itself. The position of the interface betwen these two zones shifts continually. Water salinity in the lagoon and upstream transitional zone fluctuates seasonally depending on river discharges, rainfall, and periodic saltwater influxes from Monterey Bay.
A larger sandbar forms across the river mouth during the summer and fall months, effectively sealing off the lower river from Monterey Bay and restricting regular tidal exchanges with bay waters. Sandbar development and maintenance are predominantly controlled by alongshore forces. Normal river discharges are too weak during the summer to counterbalance sandbar development. A water-control weir diverts summer streamflow from the lagoon to Monterey Bay through the old Salinas River channel which discharges through Moss Landing Harbor about 1.5 km. (1 mi.) to the north. The sandbar essentially excludes saltwater influences, making upstream freshwater discharges the system's sole driving
force and the source of system energetics. Consequently, the hydrodynamics of the lower stream and lagoon areas during the summer and fall seasons are unlike classic river-influenced bays in which saltwater influxes and river discharges are physical forces of approximately equal importance regulating plant and wildlife populations.
Formerly, the Salinas River and Lagoon supported large populations of fish. Today, however, the populations have been significantly altered by major hydrologic changes in the watershed. Three groups of fish currently occur in the Salinas River: native, introduced, and marine visitors. Over the years, 23 fish species have been reported in the Salinas River; five are introduced, 16 are native, and two are anadromous. Among the native fish, populations of eight species have declined significantly in recent years. The other eight species have remained stable. Benthic invertebrates are also basic components of the Salinas River and Lagoon food chains.
Impact Analysis
The proposed streamflow withdrawals represent major potential hazards to the basic integrity of some of the ecosystems on the lower Salinas River. An ecosystem-oriented impact analysis was conducted to assess the possible effects resulting from this periodic stream dewatering.
The most important objective of the impact analysis was to anticipate potential environmental changes arising from the proposed action which would threaten the preservation and perpetuation of the aquatic, wetland and riparian systems as they currently exist. The approach to achieving this objective was to: 1) identify and evaluate the critical ecological processes that maintain existing wetland, riparian, and aquatic systems in the study area; and 2) determine if and how the proposed action could cause changes in these processes, and thus possibly alter the functional stability of the riparian woodlands, salt marsh, freshwater marsh, and river/lagoon systems. An additional objective was to identify general mitigation measures for the anticipated ecosystem changes.
Impacts of the proposed project were considered beneficial if they enhanced biological productivity and diversity, and detrimental if they lowered productivity and diversity. The understanding implicit in this approach was that system characteristics such as biotic quality and quantity, species richness, species diversity, and overall biomass productivity are expressions of the overall stability and health of the ecosystem. Major disruptions of a system's functional integrity and stability would be expressed as shifts in plant composition, decreased plant vigor, loss of productivity, disappeance of certain wildlife species, or reduced animal abundance. These changes could be measured in the field.
In order to assess these complex ecosystems in an organized manner, an innovative analytical approach was used which utilized four ecosystem models. The models integrated and summarized a large amount of diverse ecosystem information and presented the information as diagrams showing the ecological interrelationships controlling the presence and development of plants and wildlife. Development of each model resulted from an extensive literature review and synthesis of diverse physical and biological data which established functional linkages between ecosystem components.
The analysis indicated that stability in each ecosystem was regulated by a different set of physical parameters. Even though all ecological processes are important to the integrity of a natural system, critical pathways become apparent through the large number and kinds of other system components they controlled. Ultimately, this control could be traced to vegetation and wildlife populations. Some of these ecological processes were linked to streamflow. Critical pathways for each system type were identified as follows.
Riparian Woodland: frequency, duration, and timing of stream flooding, and soil moisture.
Salt Marsh: soil moisture and soil salinity.
River/lagoon: freshwater stream discharge, stream velocity, and depth of standing water.
Freshwater Marsh: average depth of standing water and duration of soil submergence.
The hydrologic regime of the Salinas River was the pivotal issue of the analysis. The river's past and present flow characteristics provided important background information that was essential for assessing the future status of the biological systems.
The lower Salinas River possesses flow characteristics typical of other central California coastal systems. Streamflow varies seasonally and is often quite erratic between years, since flow is a function of annual rainfall patterns. Flows are heaviest following winter and spring storms and lowest during the long summer dry seasons.
Because riparian, wetland, and aquatic ecosystems are dependent on available water, the most critical phase of the annual hydroperiod is generally the summer low-flow period, when water availability is lowest and biological demand is highest. A dependable and adequate supply of soil moisture and water during these stress conditions is essential for the maintenance of these water-dependent systems.
The environmental analysis indicated that two aspects of the river's hydrologic character had major influences on the nature and quality of the riparian and other biological systems. These
were: 1) timing, duration, and frequency of flooding; and 2) presence of perennial streamflow. A river's flood regime regulates riparian woodland regenerative capacity and also provides the mechanism for transporting upper watershed nutrients to downstream embayments and estuaries. Perennial streamflow helps maintain a permanent shallow water table within the root zones of the riparian and wetland vegetation which, in turn, sustains the vegetation through the summer. Removal of the wastewater treatment discharge presents no threats to the flooding regime of the river, although it does pose a significant potential hazard to the perennial flows in the channel.
Historical streamflow data indicate that, with few exceptions, constant but low flows were present in the river channel. The quantity of this low flow averages 0.03 to 0.06 m3 per second (1 to 2 cfs). From the mid-1950s to the present, summer flows at the Highway 68 bridge have stabilized at a relatively constant level due to the Alisal treatment plant discharges. Daily average flow ranged consistently from 0.03 to 0.08 m3 per second (1 to 3 cfs) during the July to September period. Sustained summer flows are important for maintaining standing water in the upper stream channel and probably for contributing to adequate soil moisture levels in adjacent riparian areas. Treatment plant flows have partially compensated for reductions in the annual streamflows caused by upstream impoundments.
The major environmental changes resulting from the proposed effluent removal project are summarized below by ecosystem. All anticipated significant impacts would result from manipulation of the existing hydrologic regime. The greatest effects would occur in the riparian woodland and river/lagoon systems, which are directly susceptible to flow reductions. The most significant effects would be caused by substantial lowering of the groundwater table beneath major sections of the nearby riparian woodland. In addition, in the upper stretches of the river, stream dewatering would eliminate the aquatic biota where the streambed dries out. Where wastewater flows provided major sources of water for freshwater marshes, there would be a moderate loss of wetland habitat and its associated wildlife benefits. The fact that most of this habitat-type is located downstream of other incoming water sources reduces the overall significance of this potential change.
All other environmental effects are generally expected to be of relatively small significance. Expected reductions in nutrient and detrital transport pathways were considered insignificant because other detrital sources are available, and the expected diversions would occur during minor transport periods. Major imports probably occur during winter and spring months. Specific ecosystem effects are summarized below.
Salt Marsh
No adverse or beneficial environmental impacts are anticipated for the salt marsh ecosystem. This system is apparently isolated hydrologically from the ecological processes which would be affected by the proposed project. The source of system energetics and critical regulatory processes is not controlled by the influences of wastewater flow reductions.
Freshwater Marsh
The freshwater marsh complex is a small system composed of discontinuous units of limited distribution. An assessment of the project effects on the entire ecosystem was complicated by its distributional characteristics. Some freshwater marsh areas are dependent upon wastewater treatment plant flows, while others are dependent upon agricultural return flows. Stands entirely dependent on agricultural return water would remain unchanged. Stands supported by treatment plant effluent would disappear. The ratio of these two types is unknown.
The total freshwater marsh ecosystem constitutes only about 0.5% of the entire study area. The proportion of this system which would be lost because of project activities represents an incremental decrease in overall habitat diversity, reduction in biological productivity, and loss of habitat for wetland-associated wildlife species, particularly waterfowl and wading birds. From the standpoint of the total freshwater marsh in the study area, the anticipated changes represent low to moderately significant changes. From the standpoint of the total ecosystem integrity of the study area, the anticipted changes would be of low significance.
Riparian Woodland
The greatest potential for significant adverse terrestrial impacts would occur in this ecosystem. Figure 4 shows a typical section of river with bordering riparian vegetation. Analysis of the best available hydrologic information suggested that the current treatment plant discharges constitute the major source of soil moisture for the riparian woodland. During the summer growing season, availability and abundance of adequate soil moisture is of paramount importance to the maintenance of system integrity. Removal of the water source could be expected to lead to the elimination or degradation of up to about 90% of the existing riparian woodland. It is essential that the existing water table not be lowered beyond the root zone (depths greater than 3.3 m. [10 ft.]) of the willows and cottonwoods. Given the degree of uncertainty associated with conclusively identifying the precise mechanism maintaining the present level of the water table, it was recommended that at least 0.042 m3 per second (1.5 cfs), and preferably up to 0.28 m3 per second (10 cfs) be maintained during the summer from the Alisal treatment plant downstream.
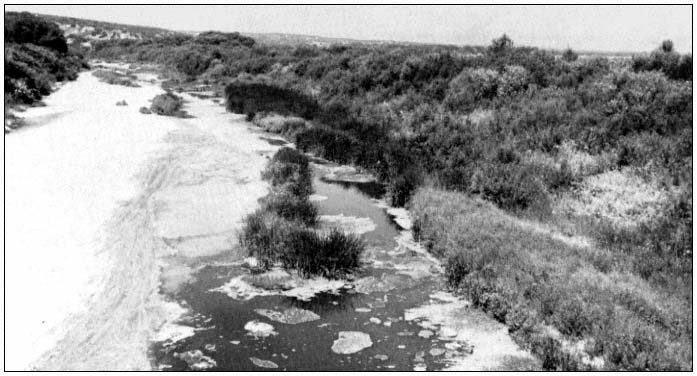
Figure 4.
Typical section of the Salinas River with bordering riparian vegetation.
One important mitigating consideration involved determining where the present water table is located within the riparian corridor and identifying its primary sources of recharge. If it could be conclusively shown that the primary source of soil moisture was either subsurface agricultural return water and/or shallow subsurface flows from upchannel recharge operations instead of existing surface flows from the treatment plants, the need for replacement surface flows would be less critical. However, this would not affect the adverse impacts on aquatic life from stream dewatering.
Lowering the water table would cause longterm, ecosystem-wide changes that would include major shifts in plant composition from cottonwood and willow probably to more drought-resistant brush and oak species; reduced ecosystem productivity; reduced quantities of riparian woodland; and reduced quality of riparian wildlife habitats, particularly for breeding bird species. The importance of riparian woodland to breeding birds is widely recognized. Local replacement breeding areas are not readily available; this impact could not be mitigated.
River/Lagoon
The greatest potential for significant adverse aquatic impacts exists in this ecosystem of flowing and standing water. The proposed project would remove a major source of summertime streamflow and initiate environmental changes ranging from complete dewatering in the upper stream reaches to little or no change at the extreme lower end of the lagoon. The magnitude of this change at any point would vary according to supplemental sources of stream inflows from agricultural return flows. The range of associated fish and wildlife impacts would vary accordingly. The most significant impacts would occur where dewatering was the most severe. Aquatic productivity would be completely eliminated in dewatered stretches. Available stream habitats and refuge areas for freshwater fishes would be significantly reduced, and the quality of the remaining fishery would be degraded by reduced flows and possibly by poorer water quality. Reduced streamflows might lead to higher concentrations of TDS and agricultural pesticides entering the lagoon system. This would be offset by lower dissolved nutrient and ammonia concentrations, and by the occasional DO depletion produced by treatment plant effluents. The resultant cumulative effect on the lagoon fish species is uncertain. The composition of fish species remaining after the project would be expected to consist of more stresstolerant species, such as carp. In the longterm, the ratio of salt-tolerant species to freshwater species would probably increase, because of the reduction in upstream freshwater refuge areas.
Because the freshwater fishery in the upstream reaches of the study area is not substantial, and elimination of the discharges would improve a number of water quality parameters, this impact was considered less important than the potential impact on the riparian vegetation.
Proposed Mitigation Measures
The results of the impact analysis indicated that the effect of the project on the lagoon would be minimal, but that serious adverse effects on the upstream riparian vegetation, which has value as a wildlife habitat, could occur. An adverse impact on the freshwater fishery would definitely occur, but since this fishery is not extensive and is considered of low value in the upstream reaches, this impact was not considered severe. It was concluded that to mitigate the known and potential impacts, some or all of the water lost due to removal of the wastewater treatment discharges should be replaced from another source.
Potential Water Sources
Seven alternatives were considered, and six possible sources of replacement water were identified. These alternatives were:
1. no action, allowing all flows to be diverted to the regional wastewater treatment plant with no Salinas River augmentation;
2. retaining and upgrading the quality of one or both of the City of Salinas treatment plants;
3. upgrading and pumping a portion of the effluent from the regional treatment plant back to Salinas and discharging it into the river during the summer;
4. developing a perched water aquifer wellfield and diverting pumped groundwater to the river;
5. developing a deep aquifer wellfield and diverting pumped groundwater to the river;
6. releasing additional quantities of water from the Nacimiento or San Antonio reservoirs; and
7. pumping effluent from the City of Salinas industrial waste lagoons to the Alisal discharge point.
Initial screening of the six flow replacement alternatives eliminated all but Alternative 4 from further consideration. Alternative 2 was prohibitively expensive due to the high level of treatment required. The net cost, assuming almost complete nitrogen and phosphorus removal, biochemical oxygen demand (BOD) and suspended solids limits of 5 mg. per l., and almost complete coliform kill, was estimated to be $1.7 million to retain just the Alisal plant, and $7.8 million to retain both plants.
Alternative 3 was also prohibitively expensive, costing $4.1 million to return 0.04 m3 per second (1.5 cfs), and $12.7 million to return 0.28 m3 per second (10 cfs) to the point of the Alisal plant discharge. Alternative 5 was also relatively expensive and had the additional drawback of being an uncertain source of supply and a potential future source of municipal and irrigation water. Alternative 6 was not feasible because water rights for this purpose could not be obtained. Alternative 7 was rejected because of concerns about industrial pond effluent quality, and because of the likelihood that flow was already seeping from the ponds into the river. Alternative 4 was therefore the only feasible flow replacement alternative. However, there remained the question of whether or not sufficient water was indeed available from the aquifer. Water from this aquifer was too high in TDS for agricultural or municipal use, but was suitable for flow replacement. Developing wells and transporting it to the river would be relatively inexpensive because existing treatment plant outfalls could be used, and the annual operational cost would be low.
Consequently, in January 1981 several wells into the perched aquifer were dug and tested for their yields. It was found that insufficient water was available to make well development worthwhile. This eliminated the last potential source of inexpensive replacement water, and left the no action alternative as the only remaining choice.
Selected Alternative
At the August 5, 1981 meeting of the task force, it was agreed that because no easily developed replacement water was available, the precise effects of reducing or removing the effluent flow should be determined. A further study of the effects of flow removal on the riparian vegetation was proposed. It was the consensus of the group that if significant deterioration of the riparian vegetation should occur, replacement water should be obtained. If no significant harm to this vegetation occurred, stream dewatering would be permitted. A four- to six-year monitoring study would be conducted to determine what, if any, would be the effects on the riparian vegetation if some or all of the flow was removed.
The proposed study is to monitor depth to groundwater table across the river channel, and vegetation vigor, growth, and reproduction at five stations along the river. The first two years of the study will provide baseline data before any flow is removed. The following two years the 0.24 m3 per second (8 cfs) flow from the Salinas main plant will be removed; the, only effluent flow left will be the 0.04 m3 per second (1.5 cfs) from the Alisal plant. If no effects are observed at this flow level, the Alisal plant flow will be removed for the last two years of the study. Criteria for determining what constitutes a "significant effect" will be set before the study begins. If a significant effect does occur due to the flow removal, some form of flow augmentation must then be developed by the MRWPCA.
Conclusions and Recommendations
Although the monitoring program will be designed to answer specific questions about flow reduction in the Salinas River, the data and results generated should be widely applicable to other riparian systems. A better understanding of the dynamics of riparian systems should be gained from this effort.
The results of this study have made it clear that a regional project such as this can have a number of beneficial as well as adverse impacts which may not be perceived at the outset. Although the EIR/EIS process should identify most of the impacts, it is often impossible to accurately predict effects on complex hydrological and biological systems such as riparian systems. It is therefore critical that study of potential effects on complex systems begin very early in the planning stages of any project which may affect them.
Literature Cited
Bureau of Sanitary Engineering. 1971. Sanitary engineering investigation of Salinas River, Reclamation Ditch and Blanco Drain. 23 p. California Department of Public Health.
Crouch, G.L. 1979. Changes in the vegetation complex of a cottonwood ecosystem on the South Platte River. In : Riparian and wetland habitats of the Great Plains: proceedings of the thirty-first annual meeting. Great Plains Agricultural Council, Fort Collins, Colorado.
Engineering-Science, Inc. 1978. Final facilities plan for North Monterey County (California). 283 p. Monterey Peninsula Water Pollution Control Agency, Monterey, Calif.
Engineering-Science, Inc., 1980. Lower Salinas River flow reduction impact report prepared for Monterey Regional Water Pollution Control Agency. 175 p. Monterey Regional Water Pollution Control Agency, Seaside, Calif.
Greenfield, H.R., and C.D. Grunt. 1978. Fish die-off in the Salinas River. Northern Salinas Valley Mosquito Abatement District.
Irwin, T. 1976. USDI Geological Survey, water quality investigation, Salinas River. California Water Resources Investigation (November) 76– 100.
Johnson, W.D., R.L. Burgess, and W.R. Keammerer. 1976. Forest overstory vegetation and environment on the Missouri River floodplain in North Dakota. Ecology Monograph.
Keller, E.A. 1977. The fluvial system: selected observations. p. 39– 46. In : A. Sands (ed.). Riparian forests in California: their ecology and conservation. Institute of Ecology Pub. No. 15. 122 p. University of California, Davis.
Muckel, D.C., K. Dyer, and J. Behnke. 1964. Report on salinity problems at the mouth of the Salinas River. U.S.D.A. Soil and Water Conservation Research Division, Agricultural Research Service.
Sands, A. 1979. Public involvement in riparian habitat protection: a California case history. p. 216– 227. In : R.R. Johnson and J.F. McCormick (tech. coord.). Strategies for protection and management of floodplain wetlands and other riparian ecosystems. USDA Forest Service GTR-WO-12. 410 p. Washington, D.C.
State Water Resources Control Board and Regional Water Quality Control Board, Central Coast Region. 1975. Regional water quality control plan, Central Coastal Basin (3). State Water Resources Control Board and Regional Water Quality Control Board, Coastal Region, Sacramento, Calif.
US Environmental Protection Agency and Monterey Regional Water Pollution Control Agency. 1978. Final environmental impact statement and report, North Monterey County facilities plan. US Environmental Protection Agency and Monterey Water Pollution Control Agency, Monterey, Calif.
Willingham, W.T. 1976. Ammonia Toxicity, Control Tech. Branch, Water Division, US Environmental Protection Agency, Washington, D.C.
Sofar
A Small-Town Water Diversion Project on the South Fork, American River[1]
Russell D. Langley[2]
Abstract.—As designed, the SOFAR project would provide consumers with 30,000 acre-feet of water annually and a 1.2% increase in peak load capacity at 5 to 7 times the current price of power. Timberland, riparian and meadow communities, trout habitat, and a deer herd would be lost or jeopardized. Mitigation measures are few, and alternatives to the project have not been objectively considered. The author questions probable impact on future generations whose options such projects will have foreclosed.
Introduction
In its entirety, the South Fork American River (SOFAR) Project is described as the ultimate development of the South Fork of the American River. If built, it would consist of a series of powerhouses, reservoirs, and diversion dams extending from 66 km. (41 mi.) above Placerville to approximately 32 km. (20 mi.) below Placerville. Proponents advocate that the project is needed because of its ability to provide water for El Dorado County, to aid in this country's goal of energy self-sufficiency, and to provide recreational facilities.
A similar project was considered in 1969 by Ebasco Engineering Firm but was found to be not economically feasible at the time. In 1975, the project was re-evaluated by Tudor Engineering Company and shown to be feasible. Upon this finding, it was recommended to the El Dorado County Board of Supervisors, acting in their capacity as the County Water Agency, to seek a potential power purchaser.
General Description
The SOFAR Project consists of two sections located entirely within El Dorado County. The Lower Mountain Project is that section located below Placerville, while the Upper Mountain Project lies above Placerville.
The Upper Mountain Project would begin with two river diversions: the Forni Diversion Dam on the South Fork of the American River and the Sherman Diversion Dam on the Silver Fork of the American River. Water would be diverted from these rivers to the proposed Alder Reservoir which is to be the primary storage reservoir. A major portion of seven small tributaries would also be diverted to the Alder Reservoir. Water released from Alder Reservoir would pass through two powerhouses, after which 30,000 acre-feet (AF) per year would flow through a third powerhouse and then be released into the South Fork of the American River, approximately 45 km. (28 mi.) below the Forni Diversion Dam. Water diverted to the Texas Hill Reservoir would be added to the El Dorado Irrigation District (EID) distribution system.
The Lower Mountain Project would be located solely along the South Fork American River and would be composed of two reservoirs. The Coloma Reservoir would be located above the gold discovery town of Coloma, while the Salmon Falls Reservoir would lie above Folsom Reservoir. Powerhouses would accompany both reservoirs.
Project Alternatives
From 1975 to 1977 a total of 21 alternative plans for the development of the South Fork of the American River were reviewed and put into a summary by Frank B. Viller for EID. In 1977 a Technical Advisory Committee was formed to screen and evaluate the alternatives. The committee was given the following five criteria by the County Water Agency and EID to be used in their review:
1. control of sufficient water for storage and carryover;
2. control of sufficient water for consumptive use;
3. amount of power revenue required to construct, maintain, and operate the powerplant, and amortize their costs;
[1] Paper presented at the California Riparian Systems Conference. [University of California, Davis, September 17–19, 1981].
[2] Russell D. Langley is Chairman of Environmental Planning and Information Council of El Dorado County, Placerville, Calif.
4. amount of power revenue plus water revenue required on the less cost-effective plans; and
5. use only information from studies already made by engineers, updating to current costs (EDAW, Inc. 1979).
Thus, the evaluation and screening process was based both on cost effectiveness and on the amount of water made available to EID. New alternatives and the amount of environmental degradation caused by each alternative were not considered.
The Technical Advisory Committee recommended three alternatives which were ranked in order of their cost effectiveness. The preferred project design was the entire SOFAR Project. The second choice consisted of the Upper Mountain Project with the Salmon Falls Reservoir and powerhouse included. Ranking third in selection was the Upper Mountain Project. All three alternatives would provide the same amount of water for consumptive use.
On 12 August 1979 EID and the County Water Agency passed a joint resolution to undertake the Upper Mountain Project. Their decision to undertake the least preferred of the three alternatives rested on the knowledge that including any portion of the Lower Mountain area would interfere with a 32-km. (20-mi.) stretch of heavily used white-water. Thus, fearing strong opposition which promised to become statewide, advocates of SOFAR decided to pursue the Upper Mountain Project first and reserve the Lower Mountain Project for later.
Once the project design was chosen, environmental consultants were called upon to steer the project through the requirements of the California Environmental Quality Act and the National Environmental Policy Act. According to the draft Environmental Impact Report (EIR) the following concepts outline all options available to EID for additional water:
1. build a project for water supply only;
2. build a project for water supply and power generation;
3. buy an existing project and operate it for water and power generation (such as PG&E El Dorado Project, FERC 184);
4. purchase water from another agency (e.g., Sacramento Municipal Utilities District White Rock);
5. conserve existing water supplies (i.e., don't build a new project, but conserve the water supply, improve the present system, and control the demand for water instead); and
6. take no action (ibid .).
Taking no action was rejected because it was not considered realistic. Ideas involving building a project for water only, purchasing an existing project, or purchasing water from another agency were considered not economically feasible because the cost of the water would be too high.
The concept of improving the existing water distribution system was shelved. Currently, 40–46% of the water diverted for both domestic and irrigation purposes is lost from the EID distribution system (table 1). Most of this loss is due to leakage and evaporation; relining ditches or installing pipelines to reduce this loss would be expensive. System improvements could provide all needed water until approximately 1995, even taking into consideration projected growth rates. However, the expense of the improvements would have to be borne by the water consumers; no additional revenues would be generated by such an undertaking.
| ||||||||||||||||||||||||||||||||||||||||
With such high system losses, the actual need for the water to be delivered by the SOFAR project comes into question. If EID were to develop all of its existing water rights and reduce system losses to a reasonable level of 10%, the system could yield approximately 80,000 AF of water. In 1979, EID sold only 18,689 AF of water. Therefore, EID could easily double its water connections within the existing service area using currently available supplies. However, without system improvements, additional water would be needed to expand service into areas which are presently served by private wells.
Controlling the demand for water as an alternative was also shelved. According to the draft EIR, EID has determined its function is to ". . . furnish water for any beneficial purpose, not to discourage the use of water" (ibid .).
The only viable alternative remaining was the already decided upon concept of a project which produces power and, thus, subsidized water.
One alternative not given adequate consideration in the draft EIR was the Sly Park proposal. The original proposal was to enlarge the existing main water storage reservoir and to augment stream flows to the reservoir. Because this suggestion did not originally include a powerhouse,
the proponents of SOFAR did not consider the expansion economically feasible.
It would seem feasibility is limited to a project which would generate sufficient revenues to pay for construction and maintenance of the facilities, deliver additional water for consumptive purposes, and possibly supply the county with additional income from power generation. This would put the cost of EID water on the consumers of the utility company which purchases the power. Current negotiations are with Sacramento Municipal Utility District (SMUD). The amount of power to be delivered to this purchaser by the SOFAR Upper Mountain Project is expected to be 1.2% of its summer peak load capacity, at a cost estimated to be five to seven times the present cost of power. Alternatives for this power exist.
Even without additional power, peak load demand could be reduced through electrical load management. A load management program could include shifting swimming pool filter pump use to periods of lower demand and installing remote load switches on air conditioners and water heaters. This would allow the utility company to turn off these appliances for a short period every hour during peak demand. Electrical load management does not reduce the overall demand for electricity, it just redistributes it.
Power consumption could be reduced by the use of solar water heaters, the application of additional house insulation, the reduction of transmission voltage levels, and requiring more efficient air conditioner and refrigerator motors. All of these improvements would not only save power but would also reduce peak load demand.
Additional power could be generated with small wind and solar units, but this type of development has been rejected:
. . . small decentralized solar and small decentralized wind generating systems have also been suggested. It is clearly not feasible for a utility to install, operate, and maintain such a vast array of scattered systems. (Federal Energy Regulatory Commission 1981).
But perhaps feasibility is not the real issue here. According to the final Environmental Impact Statement (EIS) issued by the Federal Energy Regulatory Commission (FERC) (ibid .), small wind and solar units would have to be owned and operated by private individuals. This is, for obvious reasons, simply not in the best interest of utility companies.
If SMUD contracts to purchase the power from the Upper Mountain Project to provide its consumers with the additional 1.2% peak load power, the cost will be between $560,000,000 and $750,000,000, not including interest on the bonds. The estimated cost of supplying and installing enough air conditioner remote control devices to save the same amount of peak load power would cost approximately 2% of that amount.
Political Aspects
Support for the SOFAR Project comes mainly from real estate development interests and others who stand to benefit immediately. To help foster the project, the SOFAR Council was formed. Membership donations provided for road signs, news releases, public information meetings, petitions, and advertising in local newspapers (fig. 1). Political support was gained from the area's Assemblyman Norm Waters.
Opposition to the project comes from rafting companies which fear that flow reductions in the white-water sections of the South Fork American River will inhibit river travel. They also fear that upon completion of the Upper Mountain Project, the Lower Mountain Project will be actively pursued; its completion would put an end to their livelihood.
Others who question or oppose the project include the Maidu Group of the Sierra Club, Friends of the River, the Environmental Planning and Information Council of El Dorado County (EPIC), Water and Power Resource Service, Pacific Gas and Electric, Sierra Kayak School, American River Canyon Association of West Sacramento, El Dorado Wine Grape Growers, California Department of Fish and Game (DFG), Concerned Citizens for Rural Resources, Environmental Council of Sacramento (ECOS), Central Valley Regional Water Quality Control Board, the owners of homes that would be inundated by the proposed project, and other concerned individuals and groups.

Figure 1.
One of three signs erected by proponents of the SOFAR
projet. (Photo by Cheryl Lemming Langley.)
Public input meetings began in 1977, after the Technical Advisory Committee had made its recommendations. However, to those who raised questions and concerns, the project seemed set; they often found their questions ignored.
One concern repeatedly raised was that neither El Dorado County nor EID had comprehensive master plans to aid in deciding how much water would be needed and where growth should be directed. Many claimed the projected water needs shown in SOFAR's initial studies were too high. This claim was substantiated in 1981 when James Montgomery, Consulting Engineers, projected water needs for the year 2020 which were 46,000 AF less than the SOFAR-projected high and 16,000 AF less than the SOFAR-projected low water needs (fig. 2).
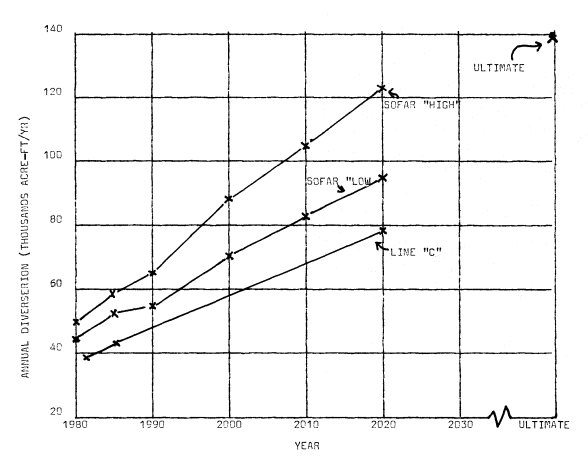
Figure 2.
EID's projected annual required water diversions for consumptive use from 1981 to ultimate. Lines
for the SOFAR "High" and SOFAR "Low" represent the maximum and minimum projected
requiremens as given by the applicants in the EIR. Line "C" represents new diversion
requirements as projected by James Montgomery, Consulting Engineers, Inc.
Other concerns voiced were that the SOFAR Upper Mountain Project would be growth inducing and public services would be further strained. The response by the SOFAR advisors was that water in itself does not ensure growth. Meanwhile, the paperwork for the project continued and a bond election for $560,000,000 was set for June 1980.
Fearing the bond would not pass by the required two-thirds majority, the SOFAR Council petitioned to bind EID to the bond if the measure was passed by a simple majority. As the election neared, the Council stirred up memories of the recent drought and predicted growth-related water shortages and building moratoria. They also implied that Los Angeles would obtain the water rights if the bond were not passed. As an added inducement it was promised the project would not
cost the people of the county one cent in tax money. Only those within the EID service district were allowed to vote on the measure.
The bond election was a point of contention by some who felt the Upper Mountain Project was a county-wide concern. The reason for restricting the vote to EID's service district was reported in a local newspaper:
Both the EID directors and the county Board of Supervisors discussed the issue of whether the election should be held within EID or county-wide at length last December . . . one of the main reasons for restricting the vote to the EID boundaries was that EID customers would have the greatest immediate benefit from the project.[3]
The bond measure for the Upper Mountain Project was approved by 65% of the voters.
Approximately six months after the bond was approved, the EIR was accepted by both the County Water Agency and EID. However, threats of a law suit by state agencies and the American River Recreation Association (ARRA) prompted them to withdraw the EIR for minor adjustments. The EIR was again approved in March 1981 and was again challenged, but this time only by ARRA, which brought suit. This action was countered by Assemblyman Norm Waters who introduced a resolution in the Assembly (Assembly Concurrent Resolution Number 6, 1981, Waters) directing the State Water Resources Control Board (SWRCB) to expedite the project and to consider "public interest" paramount for its consideration in granting water rights for the Upper Mountain Project.
Following filing of the law suit, the county Board of Supervisors came upon another stumbling block; the SWRCB requested the Sly Park alternative be thoroughly studied. The request was based on a letter from the Maidu Group of the Sierra Club and information in the final EIS which suggested that, in addition to expanding the capacity of Sly Park, a powerhouse could be added. According to the local newspaper, the Board of Supervisors approved funds begrudgingly:
County officials decided Monday to spend another $19,000 on the South Fork of the American River project to deal with "people who are not rational" according to Supervisor Dub Walker.
"How can they give credit to a completely irresponsible proposal?" asked Water Agency chairman Joe Flynn. SOFAR officials must now spend taxpayers' money to disprove the Maidu Group's suggestion, but the Sierra Club did not have to provide any study to show that the alternative was feasible, he complained.[4]
The comments made by the supervisors cut into the heart of the problem. The SOFAR advocates have not been able to objectively consider alternatives to the 1975 proposal and feel they must disprove other proposals.
The first strong demonstration of public disapproval of this project was made at a SMUD Board of Directors meeting in April 1981. The SMUD board was considering advancing $6.2 million to begin the final engineering studies for the Upper Mountain Project. Those opposing the project brought in their concerns regarding the effects of this project on public services, agriculture, power rates, and the environment. The opposition asked SMUD not to grant any advances until the FERC had granted its license for power generation and the SWRCB had given EID the water rights. No funds were advanced.
Following the SMUD board meeting the SOFAR Council begin a mass media campaign for the project. People within the county were urged to write the SWRCB and then-Governor Brown to demonstrate their support for the project. A petition to the governor was circulated at the county fair. The petition was the subject of a press release written for the area's major newspaper:
The SOFAR Council is circulating a petition to ask Governor Jerry Brown to "assist" the Water Control Board in processing the application for the proposed South Fork of the American River water and power project.
The SOFAR Council will attempt to reach Governor Brown with the petitions in the near future, Combellack said, "in the hope that he will acknowledge our need and influence his agencies to recognize our rights."
"We are a small county fighting for rights against the state bureaucracy," Flynn said. "It's a David and Goliath situation and all we have in our sling is the facts. We hope the governor realizes this is no medfly crisis—you can't spray to cure a drought."[5]
Besides the petition, the SOFAR Council used the county fair to pass out a pamphlet on the Upper Mountain Project. This pamphlet emphasized the drought of 1976–1977 and labelled those who
[3] Meyer, Marganne. 1980. Angry about SOFAR vote. Mountain Democrat, Placerville, California. 6 June 1980. p. A-14.
[4] Meyer, Marganne. 1981. Supervisors lament extra SOFAR costs. Mountain Democrat, Placerville, California. 15 April 1981. p. A-7.
[5] Press release. 1981. SOFAR Council circulates petition for governor. Mountain Democrat, Placerville, California. 23 August 1981. p. A-13.
opposed the project as self-interested "enviroobstructionists."
At the time of writing, FERC has issued the Final EIS but has not granted a license for power generation. The water rights hearings are scheduled for early 1982 and the suit between ARRA and the project applicants has not been settled.
Environmental Concessions
With completion of the Upper Mountain Project, approximately 1,154 ha. (2,850 ac.) of timber production land would be lost. This represents an estimated forest productivity loss of approximately 2.4 million board feet per year, with area losses evenly divided between the El Dorado National Forest and private lands. Additional timberland may be affected in the long term as recreational facilities are developed. Mitigation for the lost timberland will come with implementation of improved forest management techniques.
If the proposed recreational facilities for the project are fully developed, they would provide use for 4,118 people at one time. However, there would be a loss of existing recreational uses. Stream-flow reductions would eliminate kayaking along the South Fork American River from Kyburz to Riverton. Wild trout stream fishing would be reduced by 10.6 km. (6.6 mi.), and day users along Alder Creek would find their sites inundated. Eleven recreational residences would also be lost. SOFAR applicants have vowed to help provide relocation for the displaced residences and have proposed improving access and flows to three streams to mitigate for the loss in wild-stream fishing.
Air quality is also expected to suffer from the implementation of this project. The expected degradation would come from increased vehicular travel to recreational areas, campfires at new recreational facilities, and expected area population growth. Violations of state and federal air quality standards for ozone/oxidants and particulates are expected. No mitigation measures are offered.
The impacts of the construction of 24 km. (15 mi.) of tunnels, the deposition of tunnel sludge and rock, along with the erosion and sedimentation of topsoil from the construction of roads and conduit corridors, are potentially significant. Care in deposition of these materials and revegatation of stripped areas with fast-growing grasses and native plants are offered as mitigation.
Flows on the South Fork American River and Silver Fork American River would be reduced substantially once the project is under operation. Present flows in the South Fork show an average spring runoff of approximately 1,250 cubic feet per second (cfs) at a gauging station just below the proposed Forni Diversion Dam (fig. 3). The flow would be reduced to approximately 450 cfs, with summer flows being reduced 30–37%. For the South Fork just below the point of the proposed reentry, the average peak spring flow would be reduced from the present 2,200 cfs to an average peak of 1,700 cfs. However, due to water storage and release for power generation, the average late summer flow would be increased by approximately 25%.
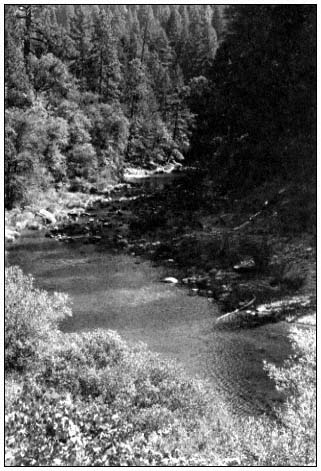
Figure 3.
The South Fork of the American River in an area which
will experience flow reductions between 30–37% during
the summer. (Photo by Cheryl Lemming Langley.)
For the Silver Fork of the American River, the average peak spring runoff would be reduced from the present 650 cfs to an average of 100 cfs, and summer flows would be reduced by 50%. All seven small tributaries would have summer flows of 1 cfs or less. There is no anticipated effect on water quality due to the reduction of the flows. However, the reduced peak spring streamflows would result in decreased streambed scouring, changes in riparian vegetation, increased water temperatures, and an alteration of streambed substrate materials; the quality of the aquatic habitat would be compromised. Mitigation for the reduced flows is to increase streamflow
in three creeks which would become part of the SOFAR distribution system.
Because the project occurs within streamcourses and involves their inundation, the most significant vegetative communities affected will be riparian. It is estimated by the DFG that there would be a direct loss of 41.9 ha. (103.5 ac.) of riparian system. This estimate includes a small amount of wet-meadow land, but does not take into account potential losses which will occur due to stream flow reduction.
The riparian vegetation within the proposed Alder Reservoir and along Alder and North creeks are of particular interest. Vegetation along Alder Creek (fig. 4) consists of dense stands of lodgepole pine (Pinusmurrayana ) with patches of willow, alder, dogwood, and Sierra sweet-bay (Myrica hartwegii ). Along North Creek are meadows of corn lily or skunk cabbage (Veratrumcalifornicum ), sedges, and grasses which alternate with stands of large black cottonwoods (Populustrichocarpa ). These stands are unique within the El Dorado National Forest. Near Alder Creek is a lush wet meadow of grasses, rushes, perennial herbs, and sedges. This meadow provides important foraging for a number of wildlife species.
Figure 4.
Alder Creek at a site to be inundated by the proposed
project. (Photo by Cheryl Lemming Langley.)
The riparian vegetation in the vicinity of the proposed Texas Hill Reservoir is typical for the area and includes Fremont cottonwood, willow, Oregon ash (Fraxinuslatifolia ), wild grape (Vituscalifornica ), and blackverry (Rubus spp.). There is also a population of California holly fern (Polystichumlonchitis ) within the riparian system of Texas Hill.
Riparian vegetation provides an extremely important habitat for wildlife. The DFG estimates less than 0.1% of E1 Dorado County is riparian system, with much of this being in private ownership. Considering that riparian systems are in critically short supply, and loss is to be considered significant. The joint applicants for the SOFAR Project consider the loss of riparian system a cost of the project and largely impossible to mitigate. However, they have proposed creation of artifical riparian systems and a wet-meadow community to help offset this loss. The procedure for creating such systems is considered experimental and unpredictable, without guarantee of any measure of success.
In addition to the impact to the riparian communities, there are, within the Upper Mountain Project construction area, six plant species which are considered rare. Two species are located within the Alder area, two within the Texas Hill area, and two within the Sherman and Forni areas. None of these species are considered endangered however, the loss of the populations would represent a substantial impact to the species. The draft EIR states that while the SOFAR Project would limit their range, the loss of these populations would not significantly threaten the species' survival.
Both the Forni Diversion and the Sherman Diversion areas provide habitat for Bolandracalifornica and Juncuschlorocephalus . Though both are considered rare, they are relatively common at this elevation in the Sierra Nevada. The construction of the diversion dams is thought to simply limit the range of these plants; no mitigation measures are offered.
Within the Alder area are found woolly violet (Viola tomentosa ) and Sierra sweet-bay. The Sierra sweet-bay is a riparian type found along the banks of Alder Creek. The greatest impact to this species would occur at the dam site where the shrubs are most abundant. The woolly violet occurs at several locations within the proposed Alder Reservoir site, its habitat being among rock bluffs and in gravelly areas. The draft EIR states that the importance of the potential losses of the populations of both Sierra sweet-bay and woolly violet are "not well understood". Mitigation measures include seeking and protecting stands both above and below the proposed reservoir. If other populations are not found, then their loss would be considered impossible to mitigate.
Also within the Alder area are several species normally found at higher elevations. While
none of these are considered rare, their presence at the Alder site "may represent their low altitude limits, and loss of these populations may reduce their range" according to the draft EIR. No mitigtion measures for their loss are offered.
Layne's butterweed (Seneciolayneae ) and California holly fern are two rare plant species found within the Texas Hill area. The California holly fern is uncommon in the Sierra Nevada as it is normally found within the mixed evergreen and redwood forests of the Coast Ranges. Because of its restricted range it is considered rare, but no mitigation for its loss is offered. Layne's butterweed is an endemic species found almost entirely within El Dorado County. Since two other populations exist and are being offered protection, the inundation of this species at the Texas Hill site is not considered threatening to its existence (fig. 5).
Figure 5.
Weber Creek at a point of inundation by the Texas Hill Reservoir. (Photo by Cheryl Lemming Langley.)
Not within the project's construction area, but just north of the South Fork of the American River, is a population of serrate-leaved Lewisia (Lewisiaserrata ), which is considered rare and endangered by the California Native Plant Society. The construction and immediate operation of the Upper Mountain Project is not expected to disturb this population. However, secondary effects such as the influx of people for recreational activity and its impact on this species were not considered in the EIS.
In addition to the project's impact on sensitive plant species, approximately 797 ha. (1,968 ac.) of pine/oak, mixed conifer, oak/grass, and oak brush land, considered critical wildlife habitat, would be lost. Mitigation offered for this loss is replacement of wildlife habitat at a ratio of two acres replaced for every acre lost.
Three deer herds within the immediate project area also may experience losses. These herds include the Placerville herd, the Pacific herd, and the Grizzly Flat herd. The Grizzly Flat herd would be the most significantly disturbed because of the construction of Alder Creek Reservoir. The Alder area not only serves as a spring holding site for this herd, but also provides an abundance of highly nutritious annual vegetation which is important for the survival of new fawns. Further, the proposed Alder Reservoir would cut through and inundate a major portion of the migratory path for this herd. Since deer will not deviate from their old migratory paths even though they are inundated, the danger of drowning and hypothermia from immersion in the cold reservoir exists. As a mitigation measure it was suggested that a deer fence surround the Alder Reservoir. However, applicants are reluctant to comply with this because the cost would be great and it would interfere with the ultimate development of Alder Reservoir as a recreational facility. Instead, the SOFAR proponents will work with the DFG to monitor the migration pattern of the Grizzly Flat herd and propose future
mitigation measures if they are found necessary. Also, a no hunting strip 183 m. (200 yd. wide) will be "encouraged" around the Alder Reservoir.
Further mitigation for the project's impact on wildlife comes in the form of implementation of a raptor program. The joint agencies for this project have proposed to introduce a pair of bald eagles in the Alder area. This program would be monitored by the DFG. If the program were successful, recreationoal development at Alder Creek would be held to a low use level, but if the raptor program were not successful, recreational facilities at Alder Reservoir would be expanded.
Socioeconomic Factors
Primary and secondary impacts of the SOFAR Project are not limited to wildlife and plant communities. The socioeconomic structure of El Dorado County would also be altered. There is a faction of the community which would benefit from the growth associated with the provision of additional water. The condensed summary for the Upper Mountain Project (El Dorado Irrigation District and El Dorado County Water Agency 1980) states: "This growth will be economically beneficial to some private sector groups in El Dorado County such as land owners, building contractors, real estate brokers, title insurance companies, and wholesale and retail businesses." However, this benefit would come at the expense of declining public services and decreased agricultural activity and open space.
El Dorado County's public services are presently experiencing severe problems. According to the final EIS:
All public services in the West Slope are experiencing some strain because of the massive population expansion that has occurred in the last decade. Most of the schools in the West Slope are near or over capacity, with 12 elementary and three high schools in the West Slope now officially impacted. Six of the special fire districts in unincorporated areas have been officially declared impacted by the county.
Also, county police are requesting more manpower, and maintenance of less travelled roads is falling increasingly behind schedule. The development of the SOFAR Upper Mountain Project would further impact public services.
The migration of people working and looking for work on the project would also have an immediate adverse impact on public services offered by the county. More pressure would be placed on the rental market as competition increased for low-cost rentals. Currently the rental market is experiencing a vacancy factor of 1.2%; a healthy rate is considered 5%. The increased competition for rentals would not only lower the current vacancy factor, making rentals almost impossible to find, but would cause rents to rise substantially. People on fixed and low incomes could possibly be forced out of their rented homes.
Secondary effects of the project would come from accelerated growth caused by new water distribution systems. As water distribution is expanded into areas of very low density, presently served by wells, new subdivisions of higher density would follow. This type of growth has already had an adverse effect on agriculture and open space in El Dorado County. Growth could be controlled by the county, but the present Board of Supervisors' philosophy is to not control growth. Consider, for example, a recent request made by the County Planning Department to implement interim zoning of a 40-acre minimum which would stop speculative land splits and medium density subdivision until the Somerset/Fairplay Area Plan (part of El Dorado County's Master Plan) is revised. The request was denied, and one of the board members is quoted by a local newspaper as saying: "This county was created on private enterprise . . . This is shooting holes right through the private plans of those who live in the area."[6] As more parcels are split and new subdivisions are developed, more water and services will be demanded. More open space will be consumed and increased pressure will be placed on agriculture, due to lack of buffer zones.
An example of the type of pressure felt in the agricultural community comes from a recent request for immediate cancellation of a Williamson Act contract for an 324-ha. (800-ac) agricultural preserve. The preserve is adjacent to a large subdivision, and the rancher complains of people cutting his fences and dogs chasing his cattle; he feels his agricultural preserve is no longer profitable. Once the Williamson contract is cancelled, either through immediate cancellation or through normal roll-out, a subdivision will follow.
Sofar and Future Water
If future water distribution systems are added to EID's service area, then consumptive water gained by the Upper Mountain Project would be quickly committed. It is conceivable that additional water will be needed to fulfill the accelerated demand which would follow the construction of new systems. EID would not be able to draw this additional water from the Upper Mountain Project because the cost of purchasing the water would be greater than the cost of constructing a new project. The reason for this, as presented by James Montgomery, Consulting Engineers, is that with an 8% inflation factor figured onto the price of energy, water used for energy produc-
[6] Bowker, Michael. 1981. Board clashes over south county zoning—no freeze. Mountain Democrat, Placerville, California. 129(59):A-1, A-11.
tion will have more value than water used for consumptive purposes (table 2). Because EID would only be able to afford 30,000 of the 200,000+ AF of water which would flow each year through the Alder Reservoir, the manager of EID claims two or three projects like the Upper Mountain plan would be required to satisfy EID's projected ultimate needs.[7]
| ||||||||||||||
Conclusions
Whenever a project is considered, there should always be a high dose of public input. This input should be allowed to begin early in project formation and follow the project all the way to completion. Input should be given objective consideration at all times. To aid in public response, all facts and data should be clearly presented.
When the present water distribution system was thought to be inadequate, EID should have brought in consultants to develop a water master plan. Then, while working with the county master plan and the public, the consultants could have helped determine where new water distribution systems could be located and how much additional water would be needed for the next 20–40 years. Ideally, a plan could then be developed to meet this anticipated need with first consideration given to system improvements and effective use of the existing facilities.
If, after a thorough evaluation, it was determined additional water supplies would be needed and a project would be in the best interest of the district and county, then a proposal based on the very least amount of environmental degradation could be considered. There is nothing wrong with maximizing a water project with powerhouses, but environmental considerations should supersede economic feasibility.
State and federal requirements regarding water projects should emphasize decentralization of power production, conservation, system improvements, and modification of present facilities before considering any new project. The EIR and EIS should be a joint full-disclosure document prepared by experts without bias. The political games played by the proponents of SOFAR, the changing of the requirements of the bond election, the creation of the SOFAR Resolution, and the petition to Governor Brown should have no part in the process.
Once the EIR/EIS has been prepared, the public should be given 90 days for unresolved concerns to be considered. The hearing for water rights and the granting of any licenses would then be a simple weighing and balancing of a project's gains versus its losses.
Unfortunately, governmental policy with respect to water development is not directed in a manner which works toward the ultimate good of the people. Current policy favors large, complex water and electrical companies over small power-producing units and individually owned wells or small service districts. When large projects are thoughtlessly undertaken, both the environment and the people are made to suffer in the long run. This writer questions why the people of this generation should consistently obtain lowcost water and high power production at the expense of the environment, and asks whether future generations will despise us for the way we have handled our resources.
Literature Cited
EDAW, Inc. 1979. Applicants' environmental report and draft environmental impact report. 165 p. EDAW, Inc., San Francisco, Calif.
EDAW, Inc. 1980. Response to comments: final environmental impact report. 298 p. EDAW, Inc., San Francisco, Calif.
El Dorado Irrigation District, and El Dorado County Water Agency. 1980. Upper Mountain Project, condensed summary of license application exhibits. 44 p. Pioneer Press, El Dorado County, Calif.
Federal Energy Regulatory Commission. 1980. South Fork American River development: Upper Mountain Project, no. 2761. Draft environmental impact statement. Washington, D.C.
Federal Energy Regulatory Commission. 1981. South Fork American River development: Upper Mountain Project, No. 2761. Final environmental impact statement. Washington, D.C.
[7] Meyer, Marganne. 1981. Visiting SOFAR land two years later. Mountain Democrat, Placerville, California. 29 July 1981. p. C-3, C-8.
The Effects of Groundwater Pumping on Natural Spring Communities in Owens Valley[1]
Deborah J. Perkins, Bruce N. Carlsen, Mike Fredstrom, Richard H. Miller, Cindy M. Rofer, Gregory T. Ruggerone, and Carolyn S. Zimmerman[2]
Abstract.—Attempts to return the marsh at Little Black Rock Spring to its pre-pumping condition have been unsuccessful. Runoff water does not adequately replace spring water in nutrient and groundwater levels. The lack of mitigation for water loss due to pumping the Springfield and Fish Springs Lake has resulted in the total loss of marsh habitats.
General Introduction
The purpose of this study was to determine the changes in water chemistry and plant and rodent distribution as a result of groundwater pumping at three historical spring sites. Since none of the affected sites were studied before pumping began, comparisons between affected and unaffected sites were made to estimate the extent of change that had occurred. The first section deals with Little Black Rock Spring as the subject of a mitigation effort to reestablish the marsh community lost as a result of nearby pumping. Water diverted from mountain runoff was introduced to the area to serve as a replacement for natural spring water. In this section, the water chemistries of a nearby well and two natural springs are compared with that of the diversion channel in an attempt to determine the differences between natural spring water and diverted water. The distributions of aquatic and marsh plants and rodents are included in the comparison. The second section compares the plant community structure in two former springs that have dried up due to water removal with that of a natural, free-flowing spring. The importance of vegetation structure to rodent distribution is also discussed.
Study Sites
Little Black Rock Spring
Little Black Rock Spring is located in Inyo County, California, approximately 14.5 km. (9 mi.) north of Independence and 1.6 km. (1 mi.) east of US 395. Prior to groundwater pumping, the spring flowed from the base of a fractured basaltic lava flow down a hill to a basin containing several ponds. Percolation from the ponds was minimal because the natural water table was high, approximately 1.0–2.4 m. (3–8 ft.) below ground level [Lee 1912]. The aquifer that supplied the spring was assumed to supply a nearby well, #351, water from which was used to estimate the chemical properties of the natural spring water at Little Black Rock Spring.
Groundwater pumping began in the early 1970s to supply water to the Little Black Rock Springs Fish Hatchery, because the volume of spring water was declining. Soon after pumping began, the spring ceased to flow. Water was then supplied to the spring area by Black Rock Ditch (fig. 1) which received water from two sources. The major source was Division Creek, a system of concretelined ditches and natural channels which receives water from Scotty Spring at the base of the Sierras. The second source was water diverted from Goodale Creek. Black Rock Ditch received water from the creek only when the damming action above the ditch intake caused an overflow; this seldom occurred.
Black Rock Ditch (site 1 for water chemistry) was a natural channel roughly 3–5 m. (10–15 ft.) wide and 0.6–0.9 m. (2–3 ft.) deep; it was
[1] Paper presented at the California Riparian Systems Conference. [University of California, Davis, September 17–19, 1981.]
[2] Deborah J. Perkins is Master's Candidate, California State University, San Diego. Bruce N. Carlsen received his B.S. from the University of California, Santa Barbara. Mike Fredstrom will receive his B.S. from California State University, Fullerton. Richard H. Miller is Master's Candidate, University of Utah, Salt Lake City. Cindy M. Rofer is Master's Candidate, Humboldt State University, Arcata, Calif. Gregory T. Ruggerone is Master's Candidate, University of Washington, Seattle. Carolyn S. Zimmerman is attending Arizona State University, Tempe.
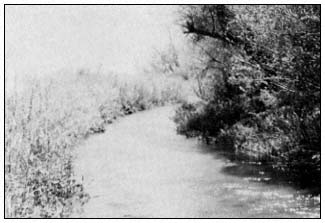
Figure 1.
Black Rock Ditch which supplies water
to the Little Black Rock Spring area.
lined with willows and other woody and herbaceous plants. Water flowed from the channel to the main pond (site 3) through a 12-in. diameter pipe. The main pond averaged 15 cm. in depth, contained at least three species of green algae, and was surrounded by three-square rush (Scirpusamericanus ) and the cat-tail Typhadomingensis . A loose rock dam below the intake maintained a water level high enough to allow flow into the pipe. From the pipe, water flowed through a small channel and into the pond system (fig. 2). On occasion the rock dam deteriorated to the point that water could not reach the intake pipe. This situation occurred during our study and resulted in a significant drop in water level in the ponds from evaporation and percolation. During our study, the water table was measured at 11.3–11.5 m. (37–38 ft.) in a nearby observation well.
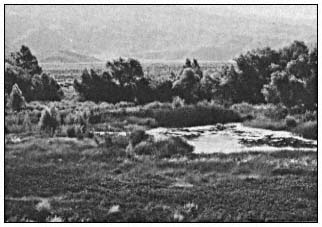
Figure 2.
Main pond and marsh area at Little Black Rock Spring
with Anemopsis californica in the immediate foreground.
Fish Springs Lake
Fish Springs is located 8 km. (5 mi.) south of Big Pine (Inyo County) and 0.4 km (0.25 mi.) west of US 395. It is the site of a fish hatchery run by the California Department of Fish and Game (DFG). Fish Springs Lake, the study site, is located several hundred meters south of the hatchery. The lake once occupied a depression below the face of a vesicular basaltic lava flow. Caliche deposits at the site suggest that the water level may have been 0.6–0.9 m. (2–3 ft.) deep at one time (fig. 3). Pumping at the fish hatchery was increased in 1971 to replace the dropping volume of spring flow. Flow from Fish Springs ceased in 1971 (Williams 1978), which corresponded with the increase in pumping at the hatchery. It is likely that the lake and the spring received water from the aquifer associated with the fractured lava flow. This source is not established due to lack of data at the study site. The lake has been noted as having water some years and being dry in others. The amount of water in recent years may be attributed to the accumulation of runoff.
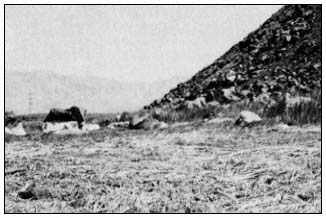
Figure 3.
Fish Springs Lake, a dry bed covered with
dead reeds. Note caliche deposits on rocks.
The Springfield
The Springfield is located 2.4 km. (1.5 mi.) east of Independence. The topography is essentially flat with the exception of broad, shallow
Figure 4.
Rabbit-brush (Chrysothamnus nauseosus ),
the dominant plant at the Springfield.
depressions. The spring area had been invaded by the desert shrub rabbit-brush (fig. 4). The five wells adjacent to the site pumped water from several different levels of a complex layering of sand, clay, and gravel. The deepest well pumped from 143 m. (468 ft.). Another well had artesian flow until 1971, after which the depth was approximately 4.6–7.6 m. (15–25 ft.). Pumping began in the early 1900s, which made this area the study site with the longest pumping history. A brush fire passed through the area in 1971 and destroyed most trees and marsh vegetation.
Fish Slough
Fish Slough is located 8 km. (5 mi.) north of Bishop in the southernmost extension of the volcanic tablelands. The slough is a marsh and pond area that extends 6.4 km. (4 mi.) back toward Bishop and empties into the Owens River. There are three primary springs within the slough, the northernmost of which is site 1. This spring issues near the base of a steep slope of volcanic tuff inside a circular pool constructed of rocks and cement. Overflow continues south through a system of channels and ponds into which the other springs flow. Site 3 was a pond located 4 km. (2.4 mi.) south of site 1. The pond was surrounded by three-square rush, and the bottom covered with a thick mat of macrophytes. The slough is bounded on the east by a faulted block of Bishop Tuff. Spring flow at the slough might have been caused by the impoundment of water from the drainage basin at the fault adjacent to it. If this was the case, then agricultural drainage and precipitation in the basin were major sources of spring flow at the slough.
Collins Warm Springs
Collins Warm Springs is located 13 km. (8 mi.) north of Big Pine and 8.6 km. (5.5 mi.) east of US 395 at the base of the Inyo/White Mountains. It has been designated part of the Owens Valley Pupfish Sanctuary. Springs issue from several sources at the base of a weathered and fractured marble outcrop that was probably exposed by faulting. The main group of springs (site 1) flows into a man-made pond (site 2), which was dammed to support the pupfish population. The pond was 0.9 m. (3 ft.) deep, and the bottom was partially covered with Oscillatoria sp. Water flowed from the pond through a pipe down to an extensive marsh area. Except for the building of the dam, the area had been undisturbed for some time.
Analysis of Mitigation Success
Introduction
The purpose of this section is to analyze the success of mitigation at Little Black Rock Spring. The spring area has undergone significant biological changes since the natural spring flow ceased. Before cessation of spring flow, flatworms (Dugesia or Planaria ) were observed living near the spring source; other native aquatic organisms that require flowing spring water were also present.[3] The wetland plant yerba mansa (Anemopsiscalifornica ), which is known to thrive in unstable water conditions, was not a dominant plant in the basin.[4] When well #351 was drilled in the early 1970s, the water table dropped to the point that spring flow ceased. During the period when no water entered the basin, both aquatic and riparian plants were affected. The basin which lay directly beneath the spring lost large sections of vegetation, so that only bush stumps and dry grass clumps remained. In comparison to a 1947 aerial photograph of the area, the marsh was roughly one-third of its pre-pumping size. Yerba mansa became a dominant plant in the remaining marsh area.
No data were available on the pre-pumping condition of Little Black Rock Spring. In lieu of a direct comparison between pre- and postpumping conditions, an indirect comparison was made. The water chemistry of well #351 was considered the closest to that of the original spring water. Well #351 and two natural springs, Fish Slough and Warm Springs, were used for the water chemistry comparison. Plant and rodent distributions at Little Black Rock Spring and Fish Slough were compared in an attempt to estimate the magnitude of changes that had occurred at Little Black Rock Spring since its source of water had changed.
Four aquatic plants were considered indicator species for dissolved ion levels. By comparing the ion levels at well #351 and Fish Slough, the potential for certain aquatic plants at the old Little Black Rock Spring could be established. The key word is "potential" since the composition of the pre-pumping plant community was unknown. Three assumptions were made regarding the plant species found at Little Black Rock Springs. 1) The plant species present following the transition were those able to tolerate the changes in water chemistry and availability. 2) New species had probably not had the time or the means to invade the area. 3) The absence of certain species could be explained either by their recent disappearance or by their never having been introduced.
Potamogetoncrispus , a rooted vascular plant, showed optimal growth at 50 m g nitrogen per l. and 50 m g phosphorus per l. when grown in greenhouses (Mulligan and Baranowski 1969). More recently Mulligan etal . (1976) found that Potamogeton sp. grew well under conditions of high fertility (75,000 m g nitrogen per l. and 75,000 m g phosphorus per l.) in pond experiments. P . pectinatus cannot tolerate waters with a conductivity below 200 m mhos (Seddon
[3] Larson, E. 1977. Personal conversation. High school biology teacher, Bishop, Calif.
[4] DeDecker, M. 1977. Personal conversation. Local field botanist, Independence, Calif.
1972). Another rooted plant, aquatic buttercup (Ranunculusaquatilis ), has a tolerance to low conductivity and can be found in waters as low as 60 m mhos.
Lemna is a genus of floating plants which must absorb all of its nutrients from the water. In the laboratory, Hicks (1932) studied the growth of Lemnaceae in buffered media lacking trace metals and set the pH range at from 4.5 to 8.0. McLay (1976) broadened the pH range for Lemna spp. to from 4 to 10, with optimal growth at pH 6.2 He used these results to support his findings in the field that the growth of Lemna perpusilla was poor at pH 8.23 (McLay 1974).
Littlefield and Forsberg (1965) found that Chara sp. absorbed phosphorus equally well through all of its parts, which indicates that water nutrients could have a profound effect on the distribution of Chara sp. It has been found that Chara sp. exists in waters that contain 20 m g total phosphorus per l. or less, of which dissolved orthophosphates constitute a very small portion. A tolerance limit of Chara sp. to orthophosphates was reported by Forsberg (1965) to be 1 m g PO4 phosphorus per l. or less. The exclusion of Chara sp. was observed by Mulligan etal . (1976) by fertilizing experimental observation ponds. Chara succession was described by Wood (1950) and Crawford (1977), where three species of Chara and some Najasflexilis succeeded to a community of Najas , Potamogeton , and Typha in three years. The average alkalinity of waters in which Chara spp. are found was 2.55 milliequivalents per liter (Forsberg 1965), but some species were ubiquitous (Spence 1967).
According to Smith (1974), the alteration of one component in an ecosystem, such as lowered groundwater levels, often leads to changes in the community as a whole. Several ecological indices were used to estimate the degree of change in the distribution of marsh plants at Little Black Rock Spring. Species diversity, which combined the density and relative importance of all species found in a given area, was compared between sites. The assumption in this comparison was that undisturbed marshes in the area were expected to have comparable diversities, such that changes in the plant community at Little Black Rock Spring would be reflected in the species diversity of the site. Smith states that a greater number of vegetative life forms indicates a more complex ecosystem and that the biomass of total plant cover largely determines food resource availability. The number of life forms, as well as total plant cover, were compared between sites in an attempt to further delineate differences in the plant community and potential animal community between sites.
Within a freshwater marsh ecosystem, very slight alterations in environmental parameters often result in major changes in the riparian flora (Mason 1957). Typha domingensis , the common cattail, is classified as an early successional species (ibid .) and typically will invade newly flooded areas. Low salinity levels provide an advantage to the germination of Typha seeds over those of rushes (Scirpus spp.). Water salinity is a major determinant in the distribution of marsh vegetation (ibid .). The accumulation of organic matter is also important to distributions in that it is a necessary factor in the succession to other species (Spence 1967), such as those in the rush family.
Changes in food and water availability (Meserve 1974) and vegetation structure (Rosenzweig 1973; Beatley 1976) have been found to affect rodent populations. When a perturbation of water availability causes local habitats to change, the abundance of rodents, which are habitat specialists, is likely to change. Many rodent species seem to prefer one microhabitat over another (Price 1978). It has been suggested that body size and morphology determine which microhabitat is appropriate to maximize the seed collecting efficiency of a heteromyid (ibid ). Each species is most dense where its preferred microhabitat is abundant (ibid .). Experimental augmentation of one microhabitat led to the increase in density of the appropriate microhabitat specialist. Thus, the availability of an appropriate microhabitat determines species abundance on a local scale (ibid .).
However, physical adaptation is not the only means of allocating separate microhabitats. Interspecific competition within a foraging habitat (ibid .) allows different species to coexist in the same area. Price has shown that removal or addition of a competitor results in a predictable shift in resource use by other species. For example, when Dipodomysmerriami was removed from its open habitat, Perognathusamplus shifted its distribution to the open habitat (Wondolleck 1978). D . microps (a leaf eater) was replaced by D . merriami (a seed eater) when a disturbance reduced the amount of vegetation cover (Beatley 1976). Schroder and Rosenzweig (1975) found that two species of Dipodomys avoided competition by habitat selection. Cricetid rodents also compete for space (Crowell and Pimm 1976). Cricetid species with similar nutritional requirements also appear to coexist through the use of habitat selection (M'Closkey and Fieldwick 1975).
The reasons for selecting one microhabitat over another have been a subject of controversy for years. Originally, rodents were believed to partition food resources by seed size selection. More recently, rodents have been shown to collect different sizes of seeds whether they forage in the same habitat or not (M'Closkey 1980). M'Closkey went on to state that the seed sizes collected by one species of rodent are determined by the preferred microhabitat of that species, such that two of the elements involved in allowing heteromyid coexistence are reduced to one dimension—microhabitat selection. In addition, Rosenzweig and Winakur (1969) found that plant density, soil type, and bush height are all important para-
meters in habitat selection by Dipodomys spp. Coexistence is probably maintained by a balance between habitat selection with its many parameters and interspecific competition.
Methods
Water Chemistry
Water samples were collected from Fish Slough, Little Black Rock Spring, well #351, and Warm Springs using a horizontal Van Dorn bottle. All filters and sample bottles were acid washed and rinsed with 10 megaohm water. In the field, concentrated sulfuric acid was added to the nitrate samples until pH 2 was reached. Then the nitrate, nitrite, and phosphorus samples were put into a deep freeze until analyzed. Nitrite, reactive phosphorus, and dissolved oxygen were analyzed using methods from Strickland and Parsons (1972). Nitrate was determined by the brucine method (American Public Health Association 1965). Field pH and alkalinity measurements were made with a Perkin-Elmer model Coleman 37A pH meter. Lab measurements were made with a Corning model 10 pH meter. Alkalinity titrations were done with concentrated HC1 to a pH of 4.5. Specific conductance, which is directly proportional to the concentration of dissolved salts, was measured with a Lab-Line Lectro Mho-meter model MC-1 Mark IV.
Vegetation Sampling
The marshes were quite patchy in distribution and the methods employed in this study produced data that could be used only to approximate plant distributions. The line transect method (Smith 1966) was used to describe the plant community inhabiting the dried marsh at Little Black Rock Spring. Sixteen lines, 25 m. long, were placed at 10-m. intervals parallel to the old spring source. A random quadrat system was used in the area adjacent to standing water at Little Black Rock Spring and Fish Slough. Mean cover and species importance were calculated using techniques described by Mueller-Dombois and Ellenberg (1974). Species diversity was calculated using the Shannon-Wiener index (Krebs 1972). Plant species were divided into the following five life form categories: aquatic sedge; alkali grass and reed; alkali herb; shrub; and tree. The plant community within standing water was described from observations. Vegetation and terrain were characterized at Fish Slough by recording the three to five most dominant plant species and percent plant cover.
The effects of water table depth and some soil variables were estimated from the data gathered at 21 random grid points at each site. The grids were of equal area (100 m. × 70 m.) and were placed adjacent to the water channel at each site. The grid points were placed at 10-m. intervals and served as the loci of 1 sq. m. quadrats where soil was sampled. A water extraction pressure plate was used to determine soil moistureholding capacity. Soil filtrates were measured for conductivity with a Yellow Springs model 31 Conductivity Bridge and pH with Hyrion pH paper.
Rodent Sampling
Rodents were captured in Sherman live-traps. Each study site was trapped for four consecutive nights and later for two consecutive nights. Trapping was adjusted to the lunar cycle so that each site had the same approximate amount of moonlight during its trapping period (Lochard and Owings 1974). The traps were placed on line transects with the traps 10 m. apart, 20–30 traps per transect, and three to five transects per site. The transects were arranged radially from the spring site.
Results
The water chemistry data presented in this paper were limited to those sites in each area that were located at the spring source (site 1) and the first major pond (sites 2 or 3). The natural spring waters at Fish Slough and Warm Springs had a higher alkalinity and specific conductivity than Little Black Rock Spring (table 1). Orthophosphates and nitrates were much higher at Fish Slough and well #351 than at Little Black Rock Spring (table 2). The data from Warm Springs showed that each spring had unique characteristics. However, the significant comparison lay between well #351 and Little Black Rock Spring. The water which originally supplied the spring was very different from the water that came from Black Rock Ditch. Orthophosphates had increased at site 3 in Fish Slough from <.004 m g PO4 , phosphorus per l. in 1973 to 4.70 to 10.23 m g PO4 phosphorus per l. during the summer of 1978.[4]
| |||||||||||||||||||||||||||||||||||||||||||||
Figure 5 shows that diurnal water temperatures were more constant at the water source, which corresponded to site 1 at Fish Slough and Little Black Rock Spring. In both cases, site 3 was a pond where the flow rate had decreased; the
| ||||||||||||||||||||||||||||||||||||
water temperature increased during the day. The temperature change at Little Black Rock Spring was more drastic and required a greater range of tolerance from all aquatic organisms.
At Little Black Rock Spring and Fish Slough, site 1 showed little fluctuation in oxygen saturation (fig. 6 and 7). This indicated that the oxygen input from the water source was constant and there was little photosynthetic activity. In both cases, site 3 had a larger fluctuation due to the large standing crop of primary producers associated with each pond. Site 3 also had the largest change in pH, presumably due to the higher photosynthetic rate. The primary productivity of Fish Slough was higher at its peak than Little Black Rock Spring (185% versus 132% saturation). The slight increase in saturated oxygen in Black Rock Ditch (site 1) came from the macrophytes that lined the ditch.
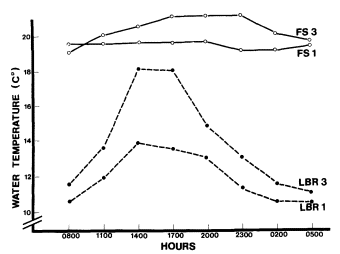
Figure 5.
Diurnal water temperature (°C) for sites 1 and
3 at Fish Slough and Little Black Rock Spring.
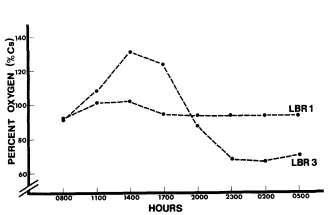
Figure 6.
Little Black Rock Spring diel oxygen study.
(Note that the drop in oxygen before sunset
resulted from a sudden cloud cover.)
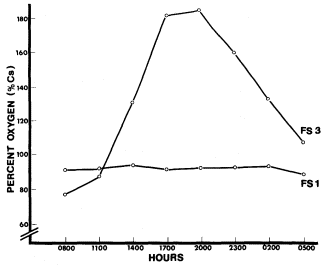
Figure 7.
Fish Slough diel oxygen study.
According to all of the community indices that were calculated, the dried marsh of Little Black Rock Spring has undergone marked changes (table 3). The number of species present, species diversity, total cover, and number of life form categories were much lower. The marsh that survived the transition was slightly different than the Fish Slough marsh in that fewer species were present at Little Black Rock Spring, causing species diversity to decrease slightly.
| |||||||||||||||||||||||||
In comparing marsh areas, the dominant species were found to be quite different (table 4). The dominant plant at Fish Slough was a sedge, Eleocharisparishii . The most abundant herb was Glycyrrhizalepidota , which covered less than half of the area of E . parishii . At Little Black Rock Spring, the most dominant plant was the invading herb Anemopsiscalifornica , while E . parishii covered one-third of the area of A . californica . Another species of interest was wire grass (Juncus balticus ), which had the same approximate cover area at both sites. Both Scirpusamericana and Typha domingensis were present in the marsh at Little Black Rock Spring, but not at Fish Slough.
| ||||||||||||||||||||||||||||||||||||||||||||||||||||||||||||||||||||||||||||||||||||||||||||||||
Unquantified observations of the entire marsh and pond areas revealed stands of marsh plants that were not sampled by the grids. Most of the waterways at Fish Slough were lined with dense stands of Scirpusamericana , while Typha domingensis was sparse. In contrast, pure stands of T . domingensis were mixed with stands of S . americana at Little Black Rock Spring. The pond (site 3) at Fish Slough contained several macrophytes that had formed a mat on the floor of the pond. Of those species, the ones that were considered to be indicative of certain water characteristics were Najas marina, Potamogetonpectinatus , and Chara sp. At Little Black Rock Spring, the little channel that carried water from the source to the ponds contained Ranunculusaquatilis and Lemna sp. The main pond at Little Black Rock Spring (site 3) did not contain the same species as did site 3 at Fish Slough.
Some of the soil parameters were averaged for each site. Mean soil conductivity at Little Black Rock Spring was 616 mmhos, while Fish Slough had 2,717 mmhos. Mean soil pH was 6.6 at Little Black Rock Spring and 5.7 at Fish Slough. Soil moisture-holding capacity decreased linearly with increasing distance from the channel at Little Black Rock Spring (fig. 8). At Fish Slough, soil moisture-holding capacity was not dependent on distance from the channel. Depth to the water table at Fish Slough varied from 0.5 to 1.0 m. at a distance of 0–50 m. from the water channel. At Little Black Rock Spring, where the natural water table was at approximately 11.5 m., the artificial water table from the pond dropped off quickly. At the edge of the pond, the depth to water had dropped to the lowest limit of the soil auger, 1.8 m. At 20–50 m. from the channel, the water table was below 1.8 m.
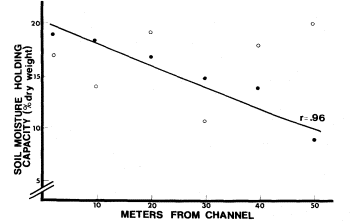
Figure 8.
Soil moisture-holding capacity as it varies with distance from the
water channel. o—Fish Slough, o—Little Black Rock Spring.
The plant species present on the soil sample grids reflected the water table depth. On the line closest to the channel at Little Black Rock Spring, wire grass was abundant. Twenty meters away from the channel, drought-tolerant plants like rabbit-brush, Sporobolusairoides , and salt grass (Distichlisspicata ) were present. At 50 m., Little Black Rock Spring had sparse vegetation cover consisting of rabbit-brush and
annual weeds. At Fish Slough the plants found 20 m. from the channel were Eleocharisparishii , Juncus balticus , and Glycyrrhizalepidota . At 50 m. the marsh plants were still abundant.
The rodent species common to both areas were the Heteromyids Dipodomysmicrops , D . ordii , and Perognathusformosus , and the Cricetids Neotomalepida , Peromyscusmaniculatus , P . boylii , P . crinitus , and Reithrodontomysmegalotis . The additional species found at Fish Slough was D . merriami , for a total of nine species. Little Black Rock Spring had three additional species, Neotomafuscipes , Onychomystorridus , and Peromyscustruei , for a total of eleven species.
Five hundred sixty-eight trap nights were used to calculate the rodent-habitat associations. These were considered preliminary results, since many more trap nights would be needed to make conclusive correlations. Positive associations were made with each rodent species and, in several cases, habitat overlaps existed between species (table 5). One of the patterns that emerged from these data was that none of the Peromyscus spp. overlapped. R . megalotis was found only in closed habitats where grass and tall plants were intermixed. Dipodomys merriami and D . ordii were found in different habitats, while D . microps shared the habitats of the other Dipodomys species.
| ||||||||||||||||||||||||||||||||||||||||||||||||||||||||||||||||||||||||||||||||||||
Discussion
A comparison of the chemical aspects of Fish Slough, Little Black Rock Spring, well #351, and Warm Springs showed that the water supporting the post-pumping marsh at Little Black Rock Spring was quite different from the water in the local aquifer and other natural springs. Alkalinity, salinity, and nutrients needed for primary production were all lower in the water supplied to the Little Black Rock Spring marsh from Black Rock Ditch. The low conductivity enabled Ranunculusaquatilis to survive there. The low orthophosphate level would be suitable for Chara sp., though it was not found at Little Black Rock Spring. Since the orthophosphate content of well #351 was extremely high, it is likely that Chara was not present before pumping began. Chara was not abundant at Fish Slough and might have been on the decline due to the recent increase in orthophosphates. The work done by Mulligan etal . (1976) showed that Chara could be excluded with the addition of fertilizer. The successional pattern where a Chara -Najas community changed to a Najas -Potamogeton -Typha community observed by Woods (1950) and Crawford (1977) appeared to be in progress also. The increased agriculture in the drainage basin of Fish Slough could be affecting the ecological system of the slough.
The absence of Lemna sp. in the ponds (both site 3s) was predictable because of the high daytime pH. Lemna sp. was found in the intake channel at Little Black Rock Spring, which was well protected by tall brush, and probably survived there because shading prevented a high photosynthetic rate and the accompanying increase in pH. The absence of Potamogetonpectinatus at Little Black Rock Spring was also predictable because of the low conductivity there. P . pectinatus was found at Fish Slough where the conductivity was above the lower limit found by Seddon (1972). The conductivity of well #351 was probably above its lower limit too, since the alkalinity of well #351 and Fish Slough was similar. Considering these facts, P . pectinatus may have been present before pumping and eliminated when the water source changed.
Primary production was higher at Fish Slough as demonstrated by the percent saturation of oxygen. The combination of more constant diurnal temperatures, a more constant water source, and higher nutrient concentrations probably supported more photosynthesis at Fish Slough than at Little Black Rock Spring.
The distribution of two major marsh plants, Scirpus americana and Typhadomingensis , was considerably different between the two areas and was probably due to the decrease in salinity at Little Black Rock Spring. Since T . domingensis had been classified as an early successional species which germinates easily and thrives in water of low salinity, its high abundance at Little Black Rock Spring was predictable. S . americana dominated the marsh at Fish Slough, a well-established marsh with a higher organic content in the soil and more saline water.
The marsh area at Little Black Rock Spring appeared to have sustained significant losses in area and, possibly, species richness. Before pumping, the water table was close to the surface and supported an extensive marsh. After pumping, the marsh ended abruptly at the edge of the pond where the water table dropped. Alkali deposits, remains of dead vegetation, and aerial photo-
graphy supported the theory that the marsh once extended into the area later occupied by xeric vegetation. Species richness, diversity, and life form categories were lower in the desert area, which indicates that the losses occurred during the transition and that the surviving species were forced to retreat to the remaining marsh. Actual losses and gains in species composition at Little Black Rock Spring could not be estimated from our data. However, Little Black Rock Spring supported seven fewer species than Fish Slough within the sample grids. It was concluded that either species richness had always been lower there or species were actually lost during the transition.
The rodents at Fish Slough appeared to prefer different microhabitats and demonstrated possible rodent-habitat associations. For those species that appeared to be using the same microhabitat, other resource partitioning mechanisms might have been operating, although these mechanisms were not pursued further. Habitat preferences were determined only at Fish Slough, but were considered applicable to both sites.
More specifically, Dipodomysmerriami and D . microps demonstrated the type of coexistence described in the literature. Within their common habitat, coexistence was possible because of their different food preferences. Another Heteromyid, Perognathusformosus , preferred a different habitat from the other Heteromyids. Each of the three Peromyscus species appeared to prefer a different habitat. Reithrodontomysmegalotis was found only in wet places. Each species preferred one or two habitats. It has not been determined whether these habitats were preferred as a result of competitive exclusion or a physiological need to associate with that habitat.
It is clear, however, that changes in the number and type of habitats would influence the rodents that depend on them. In the case of Little Black Rock Spring, the mitigation to replace lost water maintained a set of moist habitats which probably supported most of the original species. The differences in species between the two areas could not be linked directly to the transition to ditch water since a similar census was not performed before pumping began. The differences in species present and species richness was attributed to artificial juxtaposition of desert and marsh, such that a transect that spanned the two major habitats produced a higher species composition than a transect that crossed the more homogeneous area of Fish Slough.
Conclusion
The water diverted into Little Black Rock Spring contained significantly lower concentrations of the components that influenced the structure of the biological community. The original spring probably had higher concentrations, as indicated by a nearby well. Comparison of the post-pumping marsh to an unaffected marsh showed definite differences in the water chemistries and biological community. The low salinity at Little Black Rock Spring probably was the cause of the early successional marsh and the absence of certain aquatic plants. Low orthophosphate and nitrogen levels were probably the cause of the comparatively low primary productivity rates. The drop in groundwater and sharp percolation rate from the ponds caused an extensive marsh to evolve into a markedly dichotomous plant community. The most dominant plant species in the marsh were not the same as those in Fish Slough and were probably typical of the new habitat created after pumping began. The rodent community reflected some of the overall change, but the presence of water and moist habitats appeared to maintain a comparatively diverse population.
Estimation of Biological Changes
Introduction
The purpose of this section is to estimate some of the biological changes that resulted from unmitigated pumping in the vicinity of two natural spring areas. Fish Slough was used again as a source of comparison for changes in vegetation and rodent distributions. Warm Springs was also used for one comparison. The Springfield, once an artesian spring field and marsh, had been pumped for many years. Drought-tolerant shrubs and annuals had invaded the entire area. The observation that patches of these shrubs were dying indicated the need for a water stress study to determine whether these plants were mesic and would be affected by further reductions in the water table. Fish Springs Lake was considered an intermediate point between Fish Slough and the Springfield. The lake had dried out only a few years before the study, and the depression still caught surface runoff from time to time. More plant species were present there than at the Springfield, although they were mostly xeric species.
As in the previous section, the vegetation was sampled in order to estimate species richness and diversity, life form richness, and total cover. These indices were compared between the three areas to determine the vegetative differences produced by the pumping.
Plant water potential, according to Slatyer (1967) and Kramer (1969), is one of the best expressions of water deficit. Plants develop a water deficit as the soil water potential decreases (Slatyer 1967). Soil water potential was estimated from the pre-dawn measurement of plant water potential (Slatyer 1967; Merino etal . 1976). A plant was considered to be in equilibrium with the soil before it began to transpire during the day. The amount of transpiration was estimated by subtracting the pre-dawn water potential from the highest reading of the day. Pearcy (1974) found that excess water loss due to transpiration is controlled in some desert plants by stomatal closure. A decrease in water potential during the midday heat could indicate that stomatal closure has decreased the transpiration rate.
Atriplextorreyi was used to compare the water stress of plants at the Springfield and Warm Springs. In Owens Valley, it is found on the valley floor but not on the alluvial fans. The combination of this distribution and the close relation of this species to A . lentiformis , a mesophyte (ibid .), led to the hypothesis that A . torreyi is also a mesophyte. Since Merino etal . (1976) found that the annual range of plant water potential was directly associated with the annual water table depth, a mesophyte such as A . torreyi could be monitored to indicate changes in groundwater depth.
The absence of riparian systems and those defined by a more diverse vegetation structure was considered in relation to the rodent population. The first section presented the discussion on habitat preferences in rodents. Rodent homerange size and density were also considered in this study since the literature describes the dependence of those factors on vegetation density. Stickel (1960) found that Peromyscusleucopus had larger home ranges when the population density was small. She suggested that this relationship existed as a result of sparse vegetation. In a temporal study of desert rodent populations, Whitford (1976) found that most rodent species responded to fluctuations in rainfall and primary production by reductions in density during drought periods. Both Peromyscus spp. and Musmusculus responded to an increase in plant production with a relatively large population increase.
The comparison of affected and unaffected spring areas was the only method available to estimate the changes that had occurred as a result of pumping. The comparison should not be considered a statement of actual change involving a given species, but a statement of the potential change in magnitude of the physical and biological resources.
Methods
The vegetation at the Springfield and Fish Springs Lake was sampled with the line transect method (Smith 1966). At the Springfield, 10 lines 25 m. long were spaced at 10-m. intervals parallel to the spring source. Sixteen lines of similar length and orientation were placed at Fish Springs Lake. At Fish Slough, 24 random 4-sq. m. quadrats were sampled from a grid. From the data collected, mean cover, species importance (Mueller-Dombois and Ellenberg 1974), species diversity (Krebs 1972), species richness, and life form number were calculated.
The individual plants of Atriplextorreyi were sampled at the Springfield and Warm Springs by choosing those nearest to a center point on radial transects. At each reading, three twigs were cleanly severed from each of five to 10 plants. A Scholander Pressure Bomb was used to determine the xylem sap tension during three parts of the day: pre-dawn, mid-morning, and midday. Each plant was sampled on two different days at each site. The results were averaged from each time period at each site.
Rodent species lists for the Springfield, Fish Springs Lake, and Fish Slough, and habitat associations at Fish Slough were determined by the same methods described in the first section. Home range data were collected at the three sites from a 10 m. × 10 m. grid on which each intersection was a trapping station. Two Sherman live traps were set at alternate stations every evening, using mixed birdseed as bait. Traps were inspected early the next morning, and captured rodents were identified and tagged by toe clipping. Rodents were released at the station where they were captured. Traps were set for 12 nights at Fish Springs Lake and 11 nights at Fish Slough and the Springfield. The first visit consisted of four consecutive nights, and thereafter each visit was two consecutive nights. Visits to each site were alternated so that each site was trapped during each phase of the moon. During the last two trapping sessions at each site, additional traps were added to the periphery of the grid. Home range areas were calculated using the exclusive boundary method (Stickel 1954). Rodents trapped only on the periphery were not used unless their home range area was equal to or larger than those inside the grid.
Since the number of trap nights was not sufficient to establish a constant home range size, a home range rate was developed. The relative home range rate was estimated by regressing the cumulative home range area against the number of recaptures, which should give the rate at which the home range size increases with each successive capture. The logic behind this technique is that a species with a larger home range will cover more area each successive night than a species with a smaller home range. Thus, the rate of increase or the home range rate should reflect the actual home range size. The null hypothesis H ; = 0 was tested for each slope at the 5% significance level. Slopes were then compared by using the Student t-test at the 5% significance level (Zar 1974).
Results
The structure of the plant communities at the Springfield and Fish Springs Lake was quite different from that of Fish Slough (table 6). Species richness, total cover, and life form number were all lower at the pumped sites. Diversity at Fish Springs Lake was still relatively high, because all of the species were accounted for even though the majority of the individuals were dead. Diversity at the Springfield was very low because the transect lines only touched one perennial. A couple of other perennials were present nearby and the annual Chenopodiumberlandieri var. sinuatum was heavily intermixed with Chrysothamnusnauseosus , the dominant perennial. There was an obvious shift from marsh vegetation at Fish Slough (table 4) to droughttolerant species at Fish Springs Lake and the Springfield (table 7).
| |||||||||||||||||||||||||
| ||||||||||||||||||||||||||||||
The xylem sap tensions mesured on August 10 and 11 reflected the high ambient temperature, ranging from 13–45°C at the Springfield and 16–41°C at Warm Springs, respectively. The predawn measurement, which reflected the soil water potential, was quite different between the sites (fig. 9). The water potential increased as the temperature rose, but dropped off in the afternoon. On August 24 and 25, the temperatures ranged from 10–31ºC at Warm Springs and 13–35°C at the Springfield, respectively. The soil water potential was lower for both sites, although the Springfield maintained a higher potential. The diurnal changes in water potential showed the same pattern as those on August 10 and 11.
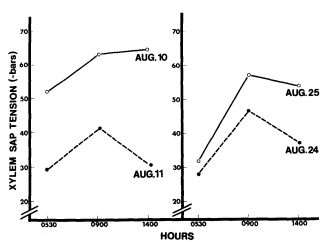
Figure 9.
Xylem sap tension at Warm Springs · and the Springfield o.
Fish Slough had nine species of rodents, while Fish Springs Lake had seven species, and the Springfield had six species. The three sites had only four species in common: Dipodomys merriami ; D . microps ; Neotoma lepida ; and Peromyscusmaniculatus . The other species found at Fish Slough are listed in the first section. Fish Springs Lake had Perognathusformosus , Peromyscusboylii , and P . crinitus . The Springfield had D . ordii and Onychomys torridus .
Habitat preferences were calculated only at Fish Slough. Those results are presented in the first section. Habitat comparisons were possible between sites because the pumped sites had such distinct differences in vegetation structure. Fish Springs Lake had only one life form category, that is, alkali grass and reed, while the Springfield had only the shrub category. Fish Slough, on the other hand, had five categories, including aquatic sedge, alkali grass and reed, alkali herb, shrub, and tree.
Peromyscusmaniculatus was the only species out of the four species in common with all three sites that had a home range rate that was significantly higher at the pumped sites (fig. 10). The lack of significance for the other species may have resulted from low capture rates.
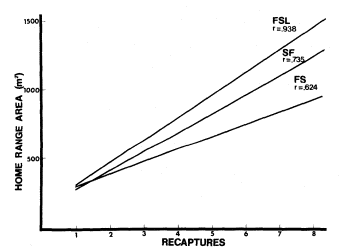
Figure 10.
Home range rates of Peromyscus manicultus at Fish Springs
Lake (FSL), the Springfield (SF), and Fish Slough (FS).
(Rejected H0 : b = 0, b1 = b2 , b2 = b 3 at p<.05).
Discussion and Conclusion
The obvious effects of unmitigated groundwater pumping on marsh vegetation are a drop in the groundwater table and a loss of surface water. Marsh vegetation was lost entirely from
Fish Spring Lake and the Springfield, and plant diversity was ultimately reduced to include only those plants that could survive on ephemeral water or deep groundwater. A mesophyte such as Atriplextorreyi was subjected to further drops in the groundwater table, such that water could become inaccessible even to long tap roots. Areas which have been pumped to that extent and beyond can be expected to lose perennial vegetation and only support those annuals that grow as a result of precipitation accumulation. Rodents that lived in pumped areas such as the Springfield could not depend on free water except that which was contained within the leaves of annuals and perennials.
Water-dependent species did not remain in an area that was pumped to the extent of losing its marsh vegetation and standing water. Rodent species that depend on seeds are most adapted to the conditions prevailing at pumped sites. Those species that are physiologically adapted to such an environment would be further limited by the low diversity of vegetation structure which is necessary for the coexistence of some species. Those individuals that do inhabit the pumped sites must finally maintain a larger home range in order to gather enough food to exist. But home range size cannot be extended indefinitely because the energy budget of each species requires a balance between the energy expended and the energy gained in foraging.
General Conclusion
The attempts to mitigate the effects of pumping at Little Black Rock Spring have resulted in a marsh community that is probably quite different from the original marsh. The combination of nutrient-poor water and a lower water table have resulted in a smaller marsh area dominated by early successional marsh species. The area once inhabited by marsh vegetation has been invaded by more drought-tolerant perennials. The rodent community is still rather diverse, but the reduced marsh and encroaching desert have probably changed the overall structure of the rodent community.
Despite the serious loss of environmental quality at sites where water removal occurred, mitigation proved better than no mitigation at all. This was demonstrated in the cases of the Springfield and Fish Springs Lake. Both the plant and rodent communities were much less diverse than those found at natural spring sites. The reduction in plant diversity and the increase in water stress at the dewatered Springfield indicated that even the desert mesophytes that live there could be endangered if the water table drops further.
Acknowledgments
This study was possible through the cooperative effort of eight people assembled by a National Science Foundation grant (SDI78-03663) in the Student Originated Studies program. The study was conducted during the summer of 1978 after seven of the participants had earned their bachelor degrees. Each participant was responsible for the experimental design and write-up of a particular subject. Bruce N. Carlsen handled the limnology section, while Mike Fredstrom wrote the hydrology section. Carolyn S. Zimmerman and Cindy M. Rofer were responsible for the vegetation sections. The rodent sections were handled by Gregory T. Ruggerone and Richard H. Miller. J. Michael Sanders assisted Deborah Perkins with a section on water stress which was not used in this report. Each person was indebted to the others for three months of assistance in his or her field research.
Dr. Richard E. MacMillen, our faculty advisor, gave us much needed advice and the room to experience the successes and pitfalls of such a study. Several residents of Owens Valley and the employees of the Los Angeles Department of Water and Power, the Caifornia Department of Fish and Game, and the Bureau of Land Management supplied important information about pre-pumping situations without which we could not have had a clear picture of the pumping issue.
Literature Cited
American Public Health Association. 1965. Standard methods for the examination of water and wastewater (twelfth edition). 769 p. American Public Health Association, New York, N.Y.
Beatley, J.C. 1976. Environments of kangaroo rats (Dipodomys ) and effects of environmental change on populations in southern Nevada. J. Mamm. 57:67–93.
Crawford, S.A. 1977. Chemical, physical, and biological changes associated with Chara succession in farm ponds. Hydrobiologica 55:209–217.
Crowell, K.L., and S.L. Pimm. 1976. Competition and niche shifts of mice introduced onto small islands. Oikos 27:251–258.
Forsberg, C. 1965. Environmental conditions for Swedish charophytes. Symbolae Botanicae Upsaliens 18:5–62.
Hicks, L.E. 1932. Ranges of pH-tolerance of the Lemnaceae. Ohio J. Sci. 32:115–131.
Kramer, P.J. 1969. Plant and soil water relationships. 482 p. McGraw-Hill, New York, N.Y.
Krebs, C.J. 1972. Ecology: the experimental analysis of distribution and abundance. 694 p. Harper and Row, New York, N.Y.
Lee, C. H. 1912. An intensive study of the water resources of a part of Owens Valley. USDI Geological Survey Water Supply Paper 294.
Littlefield, L., and C. Forsberg. 1965. Absorption and translocation of phosphorus-32 by Chara globularis Thuill. Physiol. Plantarum 18:291–296.
Lochard, R.B., and D.H. Owings. 1974. Moonrelated activities of bannertail (Dipodomys spectabilis ) and fresho (D . nitratoides ) kangaroo rats. Anim. Behav. 22:262–273.
Mason, H.L. 1957. A flora of the marshes of California. 878 p. University of California Press, Berkeley.
McLay, C.L. 1974. The distribution of duckweed (Lemnaperpusilla ) in a small southern California lake: an experimental approach. Ecology 55:262–276.
McLay, C.L. 1976. The effect of pH on the population growth of three species of duckweed: Spirodelaoligorrhiza , Lemnaminor , and Wolffiaarrhiza . Freshwater Biol. 6:125–136.
M'Closkey, R.T. 1980. Spatial patterns in sizes of seeds collected by four species of heteromyid rodents. Ecology 61:486–489.
M'Closkey, R.T., and B. Fieldwick. 1975. Ecological separation of sympatric rodents (Peromyscus and Microtus ). J. Mamm. 56: 119–129.
Merino, J., F. Garcia Nova, and M. Sanchez Diaz. 1976. Annual fluctuation of water potential in the xerophytic shrubs of the Donana Biological Reserve (Spain). Oecol. Plant. 11:1–11.
Meserve, P.L. 1974. Ecological relationships of two sympatric woodrats in a California coastal sage community. J. Mamm. 55:442–447.
Mueller-Dombois, D., and H. Ellenberg. 1974. Aims and methods of vegetation ecology. 547 p. John Wiley and Sons, New York, N.Y.
Mulligan, H.F., and A. Baranowski. 1969. Growth of phytoplankton and vascular aquatic plants at different nutrient levels. Vehr. Intern. Verein. Limn. 17:802–810.
Mulligan, H.F., A. Baranowski, and R. Johnson. 1976. Nitrogen and phosphorus fertilization of aquatic vascular plants and algae in replicated ponds. I. Initial response to fertilization. Hydrobiol. 48:109–116.
Pearcy, R.W. 1974. Comparative photosynthetic and respiratory gas characteristics of Atriplexlentiformis (Torr.) Wats. in coastal and desert habitats. Ecology 55:1104–1111.
Price, M.V. 1978. The role of microhabitat in structuring desert rodent communities. Ecology 59:910–921.
Rosenzweig, M.L. 1973. Habitat selection experiments with a pair of coexisting heteromyid rodent species. Ecology 54:111–117.
Rosenzweig, M.L., and J. Winakur. 1969. Population biology of a desert rodent community: habitat and environmental complexity. Ecology 50:558–572.
Schroder, G.E., and M.L. Rosenzweig. 1975. Perturbation analysis of competition and overlap in habitat utilizations between D . ordii and D . merriami . Oecol. 19:9–28.
Seddon, B. 1972. Aquatic macrophytes as limnological indicators. Freshwater Biol. 2:107–130.
Slatyer, R.O. 1967. Plant-water relationships. 366 p. Academic Press Inc., New York, N.Y.
Smith, R.L. 1966. Ecology and field biology. 686 p. Harper and Row, New York, N.Y.
Smith, R.L. 1974. Ecology and field biology. 850 p. Harper and Row, New York, N.Y.
Spence, D.H.N. 1967. Factors controlling the distribution of freshwater macrophytes with particular reference to the lochs of Scotland. J. Ecology 55:147–170.
Stickel, L.F. 1954. A comparison of certain methods of measuring ranges of small mammals. J. Mamm. 35:1–15.
Stickel, L.J. 1960. Peromyscus ranges at high and low population densities. J. Mamm. 41: 433–441.
Strickland, J.D., and T.R. Parsons. 1972. A manual of seawater analysis (second edition). 310 p. Bull. Fish. Res. Bd. Canada No. 167.
Whitford, W.G. 1976. Temporal fluctuations in density and diversity of desert rodent populations. J. Mamm. 57:351–369.
Williams, P.B. 1978. Changes in the Owens Valley shallow groundwater levels from 1970 to 1978. Inyo County Board of Supervisors.
Wondolleck, J.T. 1978. Forage-area separation and overlap in Heteromyid rodents. J. Mamm. 59:510–518.
Wood, R.D. 1950. Stability and zonation of Characeae. Ecology 31:642–647.
Zar, J.H. 1974. Biostatistical analysis. 620 p. Prentice-Hall, Inc., Englewood Cliffs, N.J.
Destruction of Riparian Systems Due to Water Development in the Mono Lake Watershed[1]
Scott Stine, David Gaines, and Peter Vorster[2]
Abstract.—During the early decades of this century over 320 ha. (800 ac.) of marsh, wet meadow, and riparian woodland covered the Grant and Waugh Lake depressions and lined the banks of lower Rush, Parker, Walker, and Lee Vining Creeks. Construction of reservoirs and diversion of streams have destroyed virtually all of this wetland vegetation. Streamside riparian systems could be restored by allowing moderate amounts of water to flow down the creeks.
Introduction
Prior to the large-scale manipulation of streamflow in the Mono Basin, the lower reaches of Parker, Walker, Rush, and Lee Vining Creeks were bordered by riparian woodland, wet meadow, and marsh vegetation. The depressions now occupied by Waugh Lake and Grant Lake Reservoir supported extensive stands of marsh and wet meadow. This paper briefly describes the former extent of this wetland vegetation, and documents its destruction due to water impoundment and diversion.
Flow Regime Under Natural Conditions
Rush, Parker, Walker, and Lee Vining Creeks head at the 3,200- to 3,960-m. (10,500- to 13,000-ft.) crest of the Sierra Nevada east of Yosemite National Park (fig. 1). The streams debouch from their bedrock canyons on the east side of the Sierra at elevations ranging from 2,130 to 2,440 m. (7,000 to 8,000 ft.), then flow 11 to 16 km. (7 to 10 mi.) across alluvial, lacustrine, and aeolian sediments on the floor of the Mono Basin to the shores of Mono Lake.
These streams, which under natural conditions account for approximately 75% of the surface inflow to Mono Lake, are fed primarily by snowmelt from the Sierra Nevada. Peak flows are usually attained in May, June, and July. By September of the average year, flows in the bedrock reaches of the streams have declined significantly. Along the basin floor, however, groundwater from the loose, unconsolidated sediments continues to feed the creeks.
The streams themselves constitute the main source of this groundwater. As they cross their alluvial fans and piedmont slopes, a substantial amount of flow percolates through the coarse sediments. The water is then slowly returned to the streams in their lower reaches. Streamflow in these basin reaches thus remains substantial during the dry months of late summer and fall. Even during prolonged (5- to 10-year) periods of drought, groundwater keeps the lower creek reaches flowing.
Riparian Systems Prior to Water Development
It was along these perennially flowing, lower reaches of Rush, Walker, Parker, and Lee Vining Creeks and in the Grant and Waugh Lake depressions that the most luxuriant wetland vegetation in the Mono Basin was found (fig. 2). Dense groves of aspen (Populustremuloides ), black cottonwood (P . trichocarpa ), willow (Salixexigua , S . lutea , and probably others), Jeffrey pine (Pinusjeffreyi ), and probably mountain alder (Alnus tenuifolia ), interspersed with meadows and cattail marshes, formed riparian corridors that followed the streams practically to the shores of Mono Lake (fig. 3 and 4). Over 243 ha. (600 ac.) of this wetland mosaic laced 13 to 16 km. (8 to 10 mi.) of the river course. Early maps indicate that the Grant and Waugh Lake depressions supported 200 ha. (500 ac.) or more of wet meadow and marshland.
These riparian systems had considerable esthetic, recreational, and wildlife values.
[1] Paper presented at the California Riparian Systems Conference. [University of California, Davis, September 17–19, 1981].
[2] Scott Stine is a Graduate Student and Lecturer in the Department of Geography, University of California, Berkeley. David Gaines is an Independent Researcher and Author (P.O. Box 29, Lee Vining, Calif. 93541). Peter Vorster is a Consulting Hydrologist with Philip Williams and Associates, San Francisco, Calif.
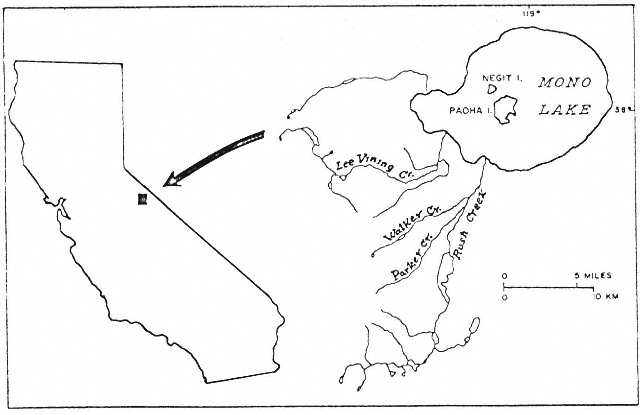
Figure 1.
Index map of Mono Lake (ca. 1953).
John Muir wrote glowingly of lower Rush Creek in 1894 (Muir 1894). In 1924 Joseph Grinnell pointed out the importance of the basin's cattail marshes to birds such as the Least Bittern (Grinnell and Storer 1924). The alluvial reaches of Rush Creek are said to have supported the finest brown trout fishery in the eastern Sierra.[3] And until recently the riparian areas were used extensively by picnickers, hikers, and duck hunters.[4]
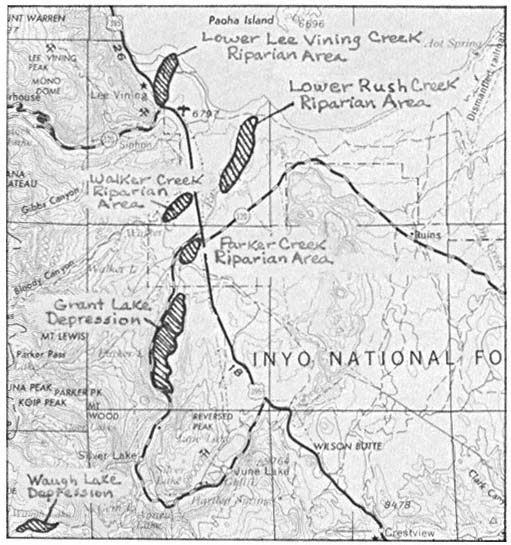
Figure 2.
A portion of the USDI Geological Survey Mariposa
1:250,000 sheet (1957) showing major riparian areas.
Water Development in the Mono Basin
While small-scale stream diversions for irrigation, mining, and milling occurred in the Mono Basin as early as the 1850's, it was not until the early years of the twentieth century that water development escalated to significantly impact the region's riparian vegetation. Around 1915 a dam was constructed by the Cain Irrigation District to impound water in the Grant Lake depression. This small reservoir was enlarged in 1926. The Waugh Lake depression underwent similar modification in 1925 when the Southern Sierra Power Company built a small dam across upper Rush Creek.
In 1930 Los Angeles voters approved a $38-million bond issue to finance the extension of the City's aqueduct northward from the Owens Valley into the Mono Basin. By 1934 Los Angeles
[3] Johnson, Wes. 1981. Personal communication.
[4] Mathieu, Lily. 1981. Personal communication.
Figure 3.
1930 aerial photograph of lower Rush Creek, Mono Lake at top. This
was the most extensive area of riparian vegetation in the Mono Basin.
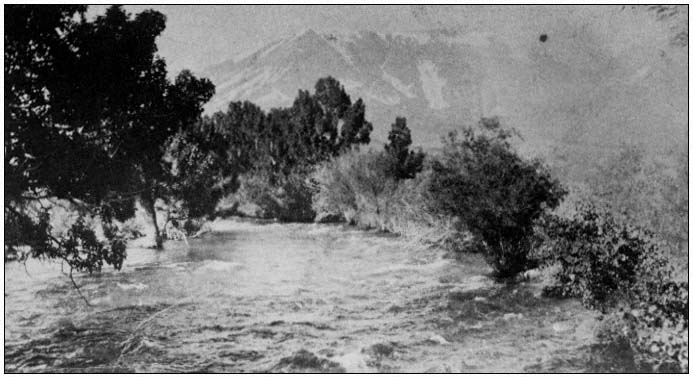
Figure 4.
Rush Creek about 0.16 km. (0.1 mi.) southwest of Highway 395, ca. 1920. (Courtesy of Enid Larson.)
had consolidated its rights to the basin's principal streams. Six years later workers completed a network of pipelines and impoundments; this included the further enlargement of Grant Lake Reservoir. The following year, in 1941, the first diversions of water from Mono Basin began (Gaines 1981).
During the next 30 years an average of 55,000 acre-feet (AF) of Mono Basin water per year was turned southward. An average of 40,000 AF per year, however, continued to flow down the creeks on an irregular basis (Los Angeles Department of Water and Power 1974).
In 1970, with the completion of a second Owens Valley aqueduct, the Los Angeles Department of Water and Power (LADWP) substantially increased its take of Mono Basin water (ibid .; Gaines 1981). During the past decade nearly the entire flows of Rush, Parker, Walker, and Lee Vining Creeks have been diverted southward. Effective groundwater replenishment has ceased. Except for brief periods in 1978 and 1980 the streams have remained essentially dry below the diversion dams (fig. 5).
Figure 5.
Map of Mono Lake showing the major tributary streams and points of diversion. Since diversions began in 1941
the lower stretches of Rush, Parker, Walker, and Lee Vining Creeks have been transformed from perennial streams
into abandoned washes. Mono Lake has fallen 13.7 vertical meters (45 vertical feet), its volume has been halved,
its salinity has doubled, and Negit Island has become connected to the mainland.
Impact of Water Diversions on Riparian Systems
The early impoundment of water behind the Grant and Waugh Lake dams led to the immediate loss of some 140 ha. (350 ac.) of riparian system. Later enlargement of the Grant Lake reservoir by the LADWP flooded an additional 61 ha. (150 ac.) of marshland and meadow.
The destruction of streamside wetlands occurred more gradually. By the early 1950's the riparian vegetation along Lee Vining Creek was so desiccated that fire was able to consume some 40 ha. (100 ac.) of woodland.[5] During the early 1970's the arboreal vegetation along the lower creek reaches is said to have been brown and withered.[6] Photographs from 1978 show that little live vegetaton remained along the once-extensive Rush Creek wetlands (fig. 6 and 7).
Today the marshes and wet meadows that once lined the basin stretches of the streams have vanished entirely. Most of the deciduous trees have died (fig. 8). The few Jeffrey pines that remain are not establishing seedlings. Streambanks that were once clothed with mesic vegetation have been colonized by Great Basin xerophytes such as sagebrush (Artemisiatridentata ) and rabbitbrush (Chrysothamnusnauseosus ).
[5] Banta, Don 1981. Personal communication.
[6] Mathieu, Lily 1981. Personal communication.
Figure 6.
1978 aerial photograph of lower Rush Creek. Virtually no live riparian vegetation remains.
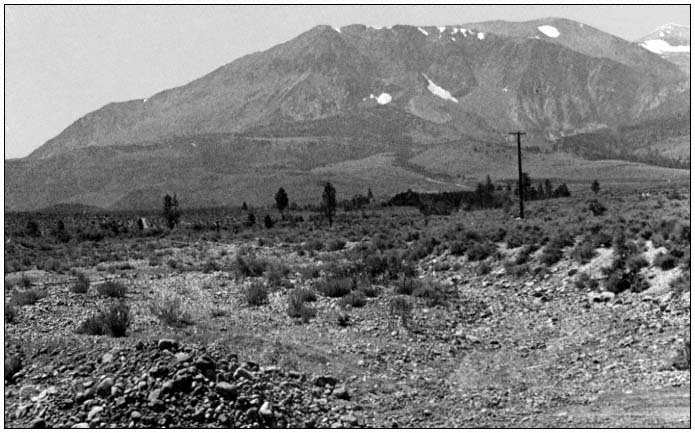
Figure 7.
The abandoned channel of lower Rush Creek in 1981. This photo was taken from the same point as figure 4.
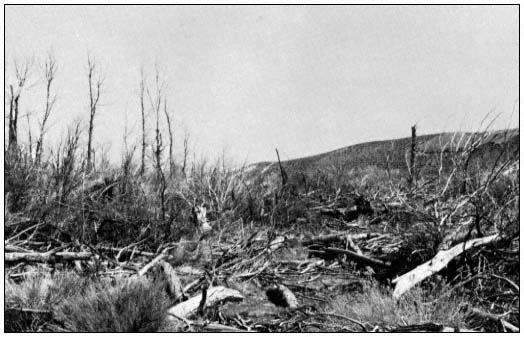
Figure 8.
All that remains of the once-extensive riparian woodland along lower Rush Creek.
Restoration Potential
Restoration of riparian vegetation along lower Rush, Parker, Walker, and Lee Vining Creeks would require a reduction in present diversions and maintenance of minimum streamflows throughout the year. Under these conditions it is thought that riparian vegetation would reestablish itself relatively rapidly.
The prospects for curtailing water diversions hinge on the outcome of current efforts to stabilize the level of Mono Lake. This unusual body of chloro-carbonate-sulfate water is shrinking and increasing in salinity due to the diversions, endangering a unique ecosystem and hundreds of thousands of nesting and migrating birds. Environmentalists and residents are attempting to preserve Mono Lake through legislation and litigation. They are opposed by the LADWP, which argues that diversions are critical to the City (Los Angeles Department of Water and Power 1974, Gaines 1981).
In December, 1979, an Interagency Task Force on Mono Lake, chaired by the California Department of Water Resources and consisting of representatives from Federal, State, and local agencies, recommended that Los Angeles reduce its diversions from the Mono Basin from an average of 100,000 AF to an average of 15,000 AF per year. The Task Force documented how the City could replace this water through an expanded program of conservation and waste-water reclamation (California Department of Water Resources 1979). Implementation of the Task Force Plan would also restore riparian vegetation along lower Rush and Lee Vining Creeks. To date, however, the opposi-of the LADWP has blocked the Task Force Plan and prevented any reduction in diversions (Gaines 1981).
Acknowledgments
We are indebted to Adreinne Morgan and Sharon Johnson for cartographic assistance, and to Mono Basin residents Don Banta, Lily Mathieu, and Wes Johnson for historical information.
Literature Cited
California Department of Water Resources, Southern District. 1979. Report of the Interagency Task Force on Mono Lake. 140 p.
Gaines, David. 1981. Mono Lake guidebook. 113 p. Mono Lake Committee-Kutsavi Books, Lee Vining, Calif.
Grinnell, Joseph and Tracy I. Storer. 1924. Animal life in Yosemite. University of California Press, Berkeley, Calif.
Los Angeles Department of Water and Power. 1974. Los Angeles water rights in the Mono Basin and the impact of the Department's operations on Mono Lake.
Muir, John. 1894. The mountains of California. 381 p. T. Fisher Unwin, London.
Influencing Future Effects of Water Development on Riparian Systems[1]
D. W. Kelley[2]
Abstract.—Making water development compatible with the protection of instream and riparian resources will require: a) more technical knowledge of the factors affecting those systems and how they are related; b) opportunities to use that knowledge in formulating or changing policy; c) project concept design and operation; and finally, d) public support. All are necessary; without one, the others are unlikely to succeed.
Introduction
A number of participants in the California Riparian Systems Conference reported on serious damage done to riparian systems by water development projects. The damage was caused by drowning underneath reservoirs, by elimination of streamflows, and by lowering groundwater tables through pumping. Despite the fact that the best damsites have been built upon and costs have risen, water development in California is expected to continue. It is driven by increasing population growth, much of it in coastal and foothill communities with limited water supplies; by the revitalized potential of hydropower generation; by economies that were developed by and are now threatened by overdrafting groundwater supplies; and by the momentum of a large water development industry that includes both private and government sectors of our society. Pumping from shallow groundwater basins and their increased use as reservoirs, to be emptied and filled like surface reservoirs, is especially important to the future of riparian systems and is sure to increase with escalating costs of surface water projects.
The essence of the California Riparian Systems Conference is that riparian systems are important and should be protected from these and other manmade and man-caused changes in our environment. But how? We have three basic needs.
1. Technical knowledge.
2. The opportunity to use it.
3. Public support.
All three are necessary to influence water development.
Technical Knowledge
Understanding Riparian Systems
Consider the simple conceptual model in figure 1. Riparian vegetation is influenced directly by groundwater levels; by changes in the size, shape, and stability of the channel; and by the volume, frequency, and duration of the various streamflows throughout the year. Many groundwater levels are influenced by streamflow, and most are influenced by pumping from wells. As groundwater levels in alluvium decline, so, in many cases, do streamflows. In nearly all cases where groundwater levels decline, there is an increased demand for storage dams and diversions. These, of course, have a major impact on streamflows. Changes in streamflow affect channel size, shape, and stability. This in turn increases the demand for levees, channelization, and other kinds of flood control, including upstream storage reservoirs. The levees themselves encourage additional development in the floodplain which is often disastrous for riparian vegetation.
This model is much like one describing the factors influencing steelhead or most salmonid fishes, and steelhead have been added to it. Like riparian vegetation, steelhead are influenced primarily by streamflows and channel size, shape, and stability. Their third requirement is riparian vegetation to shade the stream and keep it cool. Steelhead are low-elevation salmonids, and in California they have a difficult time surviving the freshwater rearing period if long reaches are not about one-half (50%) shaded.
Steelhead, and many other fisheries resources, have been seriously damaged in California because biologists ignored the fact that all these variables are related. For instance, most
[1] Paper presented at the California Riparian Systems Conference. [University of California, Davis, September 17–19, 1981].
[2] Don W. Kelly is Aquatic Biology Consultant, D.W. Kelley and Associates, Newcastle, Calif.
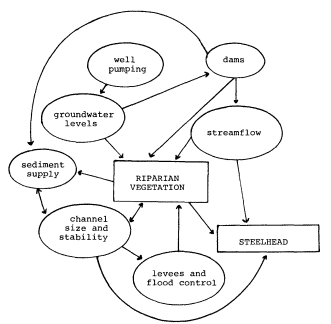
Figure 1.
Simple conceptual model of how water development
affects riparian vegetation and steelhead.
"methodologies" for determining how much flow should remain in streams below dams are based on the erroneous assumption that the channels downstream will not change (Stalnaker and Arnett 1976; Stalnaker 1980). Yet it is well known that unless the dam is very small, all bedload sediment coming from erosion above the dam will be trapped in the reservoir and the frequency, magnitude, and duration of flows that have historically shaped the channel and affected its substrate will be very different after the project is built. A host of approaches have been used to "mitigate" the losses of fisheries resources caused by dams and diversions—instream flows, fish ladders, hatcheries, etc. They have not always worked well because few have been based upon a good understanding of even these simple variables.
Examining the model and thinking about various streams, fish populations, and riparian systems leads one to the obvious conclusion that no two systems are going to be alike. The relationship between riparian vegetation and streamflow, groundwater, fish habitat, and channel size, shape, and stability must be newly investigated on every project. Those investigations would, of course, be greatly expedited if principles and processes were understood as a result of basic research and objective review of past experience.
While that may seem obvious, agencies that regulate water development are under severe time constraints when making decisions. On instream flow matters they usually rely on reports and testimony from the California Department of Fish and Game (DFG) and the USDI Fish and Wildlife Service (FWS). Neither agency has adequate funds or staff to do the kind of thorough investigation needed on every water project. They should not have to. Applicants who propose a project should be required to conduct those studies; the fish and wildlife agencies should critique the results. More agency funds and energy should be devoted to basic investigations leading toward improved understanding of stream ecology and the effect of water development on it. Most project sponsors would prefer this approach.
Opportunities to Influence Water Diversion Projects
Unlike most people in the world, Americans have many opportunities to influence how much water development will occur, as well as where and when. We can influence our population size; our life styles; the drought risks we are willing to accept; what should and should not be subsidized; the philosophy and integrity of our decision-makers; and, ultimately, how much water development will occur, where, to what use it will be put, and who should pay for it. There are plenty of opportunities, but great lack of interest.
All individuals and organizations concerned with resource conservation, with protecting riparian corridors, streamflows, and fisheries resources in California should ask their elected representatives for written federal, state, and local government policies on water development. If no policies are available, the need should be pointed out, and constituents should urge their development and participate in their change or development.
In addition to influencing policy, we need to influence the concept, design, and operation of specific projects. In California, each water diversion project requires an application to the State Water Resources Control Board (SWRCB) in Sacramento, or, in the case of hydroelectric power projects, to the Federal Energy Regulatory Commission (FERC) in Washington, D.C. Copies of the applications are sent to all of the agencies responsible for environmental protection along with invitations to protest or intervene. Protesting an application to the SWRCB is easy and is not considered an hostile act. It simply opens the legal and institutional door to: a) discussions with the applicant; b) access to his various plans; and finally, c) to a public hearing in which all parties have their say and are subject to cross-examination. Intervening in a FERC licensing or relicensing is somewhat more complex, but not difficult.
The present administrative and legal system has evolved in the last decade to allow a more thorough consideration of environmental matters and is excellent if properly used. At best, it requires the project applicant to provide solid evidence that the proposed project has been carefully designed to avoid significant harm to instream resources. At worst, an inadequate agreement on streamflows is negotiated and accepted on the basis of "expert testimony." Post-project changes are rarely monitored or evaluated.
Making better use of the present system means requiring that it rely more on evidence and less on "experts"; and that post-project evaluations be made and "mitigation" features be modified if they are not working.
Public Support
The third requirement for making a water development project compatible with aquatic resources is public support. We need public support for better definition of goals and policies, more open planning and decision-making, more rigorous review of project plans, fairer pricing policies, and research on the geomorphology and ecology of streams and on groundwater basins.
In recent years, local groups and citizens concerned with the environment, with slowing growth, or with reducing taxes have become more involved in governmental processes. The present system encourages their serious involvement. Their critical evaluation of technical reports, and of what they may consider to be inappropriate conclusions of experts, is valuable. We need more of that. Public support for the protection of instream and riparian resources should not be limited to opposition. A project well conceived and designed to protect the environment should result in environmentalists supporting the project—not fading away once their concerns have been agreed to.
All government agencies are responsive to public input. Without it, knowledge and the opportunity to use it is of little value. Protection of public resources has not and will not be accomplished unless the public shows its concern.
Public support does not always require a lot of people. When I review the history of resources saved or destroyed there always seems to be one or two individuals—champions of the cause—who made the difference. As in most matters, it is persistence that counts. You must develop one or more champions for every riparian system you cherish. Identify them, cultivate them, educate them, support them, prepare them, and participate with them. They will make the difference.
Literature Cited
Stalnaker, C.B., and J.L. Arnett (ed.). 1976. Methdologies for the determination of streamflow requirements: an assessment. Prepared for USDI Fish and Wildlife Service by Utah State University, Logan, Utah. 199 p.
Stalnaker, Clair B. 1980. The use of habitat structure preference for establishing flow regimes necessary for maintenance of fish habitat. p. 321–337. In : J.V. Ward and J.A. Stanford. The ecology of regulated streams. 398 p. Plenum Publishing Corp, New York, N.Y.

