Volcanic Hydrofractures
The concept of hydraulic fracturing (hydrofracture ) was introduced to the petroleum industry as a technique to increase the fracture permeability of oil and natural gas reservoirs (Clark, 1949). Because of its successful application in the increasingly important secondary petroleum recovery from tight formation rocks, Hubbert and Willis (1957) cited the technique as a major development in petroleum engineering. Although hydrofracture is historically an artificial means of stimulating a well, there is growing geological evidence that essentially the same process happens naturally in certain geologic situations where fluid over-pressures at depth are sufficient to cause either the widening of preexisting fractures or the failure of rock in the direction of greatest principal stress. These geologic conditions can occur near sites of magma intrusion and extrusion. Such a volcanic hydrofracture is geothermally significant where it increases the effective permeability of host rocks near a heat source and thus allows significant hydrothermal circulation (Knapp and Knight, 1977; Norton, 1984).
Numerous publications have suggested that hydrofracture occurs naturally during some magma intrusions in the earth's crust. Fehler (1983), Julian and Simpkin (1985), Chouet and Julian (1985), and Chouet (1986, 1988) attributed long-period seismic events and harmonic tremor to fluid-driven fracturing. Foulger and Long (1984) observed tensile crack formation in geothermal areas of
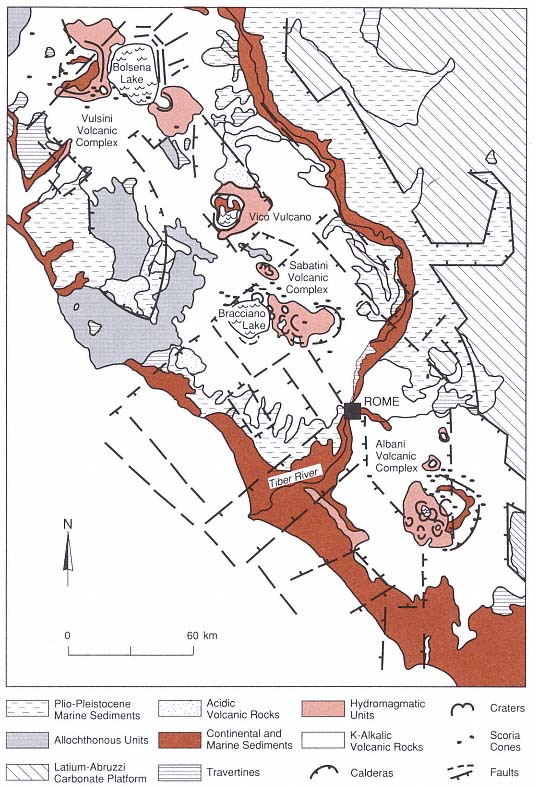
Fig. 2.49
Sketch geological map of the Latium volcanic area in central Italy. The sedimentary basement rocks
consist of the Latium-Abruzzi carbonate platform rocks, the Umbria-Sabina successions and Tuscan
Nappe, and the allochthonous Liguridi and Subliguridi complexes. The volcanic section includes
acidic and K-alkalic volcanic rock units and the major caldera associations of the Alban Hills,
Sabatini, Vico, and Vulsini areas. Widespread hydrovolcanic units are found in each of
these caldera areas.
(Adapted from De Rita et al ., 1983.)
Iceland, and West et al . (1978) attributed ground tilt around La Soufrière de Guadeloupe in 1976 to hydrofracturing by pressurized phreatic fluids. Leet (1988) modeled harmonic tremor caused by the hydrothermal boiling—a source mechanism that does not require movement of magma. Thus, some geophysical evidence strongly supports the concept of volcanic hydrofracture.
Theoretical Background
Hubbert and Willis (1957) discussed the mechanism of hydraulic fracture and emphasized the importance of regional stress. Failure that results in faulting occurs at a critical relationship between the greatest and least principal stresses (s1 and s3 , respectively), where
s is the normal stress and ts is the shear stress acting across a plane perpendicular to the s1 and s3 planes at some angle a s to s 3 . Using a Mohr diagram, one can then determine a combination of s and ts at which failure occurs. Mohr envelopes of rock failure (Jaeger and Cook, 1976), given by ts /s = tan ff , where ff = the internal angle of friction, must be experimentally determined; however, at lower pressures, brittle failure envelopes are approximated by
where t o = the zero normal-stress shearing strength of the rock. Where rock pores are occupied by fluids, the effective normal stress (s eff ) is decreased so that seff = s - pp , where pp = the pore-fluid pressure. Hubbert and Willis (1957) noted that under normal hydrostatic conditions the effective vertical stress (sz ) is slightly more than one-half the overburden pressure (Sz = r gh). In regions experiencing normal faulting, s 1 is nearly vertical and equal to sz ; s3 is horizontal and probably between one-half and one-third sz (s3 = n /(1-n ), where n = Poisson's ratio for rock. On the other hand, in compressed regions that are characterized by thrust faulting and folding, s3 is vertical and equal to sz ; s1 is horizontal and between two and three times sz . Hydraulic fractures generally propagate in the direction of greatest principal stress. Horizontally oriented fractures will form only where the fluid injection pressure (ppi ) is greater than the effective vertical stress (sz ); vertical hydrofractures can form in regions of extension where ppi@ (Sz + 2pp )/3.
Zoback et al . (1977) conducted laboratory experiments on hydraulic fracturing of rocks to find the breakdown pressure (pb ) of various rocks:
The tensile strength of rock (Ts ) should equal pb - 2s3 for nonporous rocks, but in fact, pb must be corrected for viscous hydrodynamic losses controlled by pressurization, flow, and leakage rates (along preexisting fractures). For example, Zoback et al . measured pb in triaxial experiments that ranged from 27 to 54 MPa for gabbros and 20 to 34 MPa for
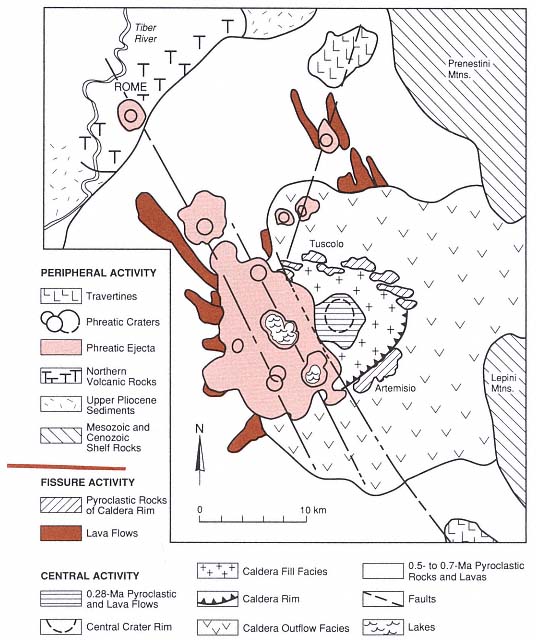
Fig. 2.50
Sketch geologic map of the Alban Hills volcanic group and the Tuscolano-Artemisio caldera.
The oldest volcanic rocks are associated with a composite cone, dated at 0.5 to 0.7 Ma, which
overlies upper Pliocene to Recent sedimentary rocks, Mesozoic and Cenozoic shelf-to-basin
successions, and Mesozoic shelf-edge facies rocks. Of major interest to geothermal studies
are the phreatic craters and ejecta (peperini), which contain lithic fragments that
reveal the basement structure. The youngest volcanic rocks are lavas and
pyroclastic rocks in the caldera center, dated at 0.28 Ma.
(Adapted from Funiciello et al ., 1976.)
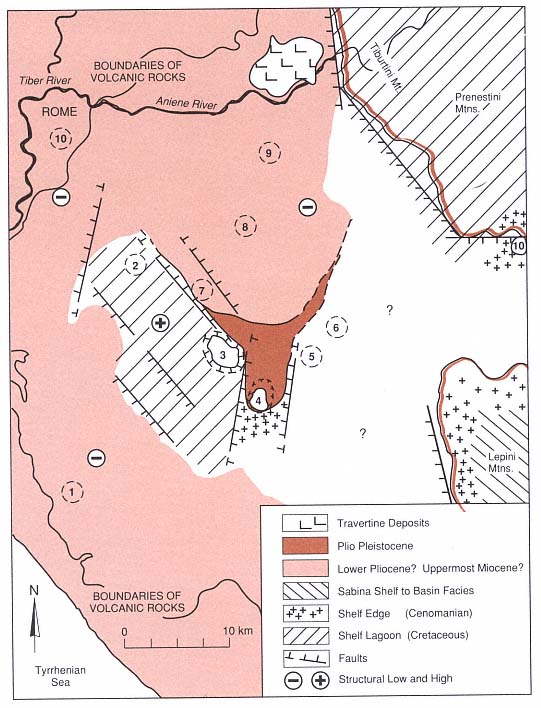
Fig. 2.51
Alban Hills sedimentary basement geology was reconstructed from the distribution of sedimentary
lithic fragments observed in hydroclastic tephra. This reconstruction was useful in siting geothermal
exploration wells, which located a permeable, saturated rock strata that could contain a hydrothermal
system. Numbers refer to volcanic centers: (1) Procula-Pomezia, (2) Ciampino, (3) Albano, (4) Nemi,
(5) Vivaro, (6) Doganella, (7) Valle Marciana, (8) Prata Porci, (9) Gabi, and (10) Campidoglio.
(Adapted from Funiciello et al ., 1976.)
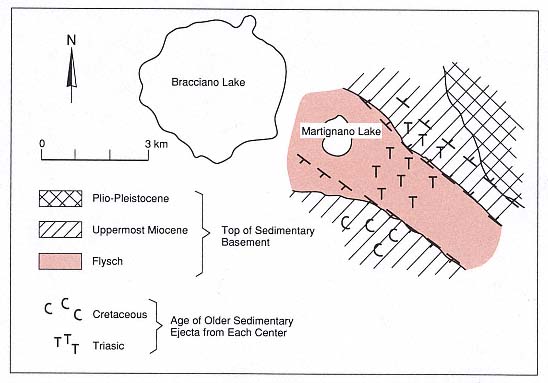
Fig. 2.52
Schematic of Sabatini basement geology reconstructed from distribution of lithic fragments in
hydroclastic ejecta. The map shows a northwest-southwest-trending horst (outlined by strike and
dip symbols) of Triassic flysch bounded on both sides by Miocene sedimentary rocks.
(Adapted from Funiciello et al ., 1976.)
sandstones when the pressurization rate was varied from 0.2 to 3 MPa/s, respectively. For the sandstones, pb increased to a range of 33 to 55 MPa when the rock was prefractured, which demonstrated the effect of fracture leaks. In all cases, fracture initiation pressures, which were measured at the onset of rock acoustic emissions, were less than pb (Fig. 2.54).
Howard and Fast (1970) reviewed other theories of hydraulic fracture and the results of oil-field studies, including the effects of fluid viscosity and pressure, pressurization time, and injection rate on the fracture width and area around well bores (Figs. 2.55 and 2.56). Solid materials such as sand and organic materials—called proppants —are added to fracturing fluids to increase viscosity and to hold fractures open. By tunneling into fractured areas, Warpinski et al . (1981) observed the effects of proppants on hydrofractures. Contrary to theory, the fractures were neither restricted nor terminated by rock interfaces, even where Young's modulus varied by a factor of 15 for a rock contact. However, fractures did propagate away from regions of high in-situ stress such as layers of tuff that were more highly compacted and altered. When different colors of sand proppants were used in sequences of hydraulic fractures, some fractures showed bedding and cross stratification. Kern et al . (1958) experimented with the movement of sand as a proppant in fractures. They found that beds are formed as sand accumulates by cohesion on the fracture surfaces. The nature of the bedding depends on the changes in fluid velocity with time, in a manner similar to that of
sedimentation in flume studies. Bedding sets at various orientations to the fracture wall are evidence of multiple pulses of fluid. These observations have been supported by geological studies of intrusive fracture fillings (Heiken et al ., 1988) and pyroclastic dikes (Curtis, 1954).
Knapp and Knight (1977) considered the effect of a temperature rise in saturated, porous rock around a hot pluton. Pore fluids change volume with varying temperature and pressure:

where a = the isobaric coefficient of thermal expansion and b = the isothermal coefficient of compressibility. Because the a for fluids is much greater than the a for rocks, these authors studied the effects of differential thermal expansion between pore fluids and enclosing rocks. For pores of fixed volume, the derivative of fluid pressure with respect to temperature is
a /b , termed the pressure coefficient , ranges between 1 and 3 MPa/°C for water in the earth's crust; it reaches a maximum at temperatures between 100 and 300°C at lithostatic pressures <800 MPa (Fig. 2.57). By plotting pore fluid pressure vs depth for various geothermal gradients (Fig. 2.58), one finds that seff may fall to values less than zero; fracturing of rock is expected if seff is less than the tensile strength of rock [from Eq. (2-23)]. In regions near a cooling intrusion, a zero effective pressure front will propagate away from the intrusion, which results in fracture of the host rock, increased rock permeability, and increased convective heat transport. This zone of fracturing and strong convection moves upward because of buoyancy forces, as was explained by Williams (1936) and McBirney (1959; 1963) for occurrences of breccias and tuff-breccias in and around volcanic necks and intrusions. Knapp and Knight (1977) used this
Fig. 2.53
Geophysical structure of the Sabatini area is
reflected by heat flow, gravity, and electrical
resistivity maps (Baldi et al ., 1975). These maps
demonstrate similar structural interpretations,
which support those obtained by studying
the lithic ejecta (Fig. 2.52).
(Adapted from Funiciello et al ., 1976.)
Fig. 2.54
Graph of pressure vs time for sample deformation
measurements during triaxial loading experiments
in which rock specimens were hydraulically
fractured. Sample deformation and acoustic
emission activity begins when the borehole
pressure reaches pi , the initial fracture pressure;
sample breakdown occurs when the borehole
pressure reaches pb . Acoustic emissions in
fluids correspond to the seismicity typical
during hydraulic fracturing events in the earth.
(Adapted from Zoback et al ., 1977.)
model to show how thermally induced hydraulic fracturing can produce micro-earthquakes—a characteristic feature of geothermal areas and active volcanoes.
Norton (1984), in his theory of hydrothermal systems and related rock fracturing, showed how variations in the transport properties of water can result in apparent discontinuities in the physical state of convection and secondary mineral deposition. For example, in Fig. 2.59, rapid changes are visible in the water's heat capacity, kinematic viscosity, and coefficient of thermal expansion near its critical point. Heating at this range of temperatures might result in (a) rapid solution and precipitation of various minerals, (b) oscillations in fluid heat and mass transport, and (c) rapid rock failure. Where hydrofractures occur around intrusions, as described in the theory above, convective heat transfer is augmented by the fracturing. If the fracturing front propagates away from the intrusion with time, convective hydrothermal systems manifested at or near the earth's surface may not indicate hotter, more active systems at depth. As we pointed out earlier in our discussion of heat flow, it is not possible to project to depth with confidence the thermal gradients affected by convection. Norton (1984) pointed out that behind the fracturing front/convective zone, which migrates away from the intrusion, thermal decline is accompanied by secondary mineral deposition that seals fractures. As a result of these hydrothermal processes, the last vestige of hydrothermal activity is close to the earth's surface and there is only minor activity near the intrusion.
The above discussions about pore-water pressurization and heating around an intrusion cover the long-term effects of rock fracture and subsequent development of a hydrothermal system. In contrast, when Delaney (1982) modeled the short-term effects of heat transfer to porous saturated rock, he found that pore water is not heated along a constant-volume pressure path because water diffuses more rapidly than heat does. He tabulated solutions for pore-pressure increases as a function of porosity and permeability. He also considered situations in which magma intrudes into near-surface rocks (Table 2.9); phase transitions from water to steam generally occur, the pressure increases exceed lithostatic pressure, and host rock failure is likely. Figure 2.60 depicts a case in which the magma is more permeable than the host rock. Where the magma volatile overpressure is low, the pressure gradient near the intrusion is negative and water mixes into the magma—a situation that leads to intrusion brecciation and hydrovolcanism.
Fig. 2.55
Graph of fracture area vs fluid viscosity
predicted for an assumed set of reservoir and
hydraulic fracturing conditions, where
permeability (k ) = 10 mD, porosity (fp ) = 20%,
pumping rate (Qf ) = 25 BPM, total
volume = 20,000 gal. @ 75.7 m3 , fracture
clearance (W) = 0.2 in. (» 5.1 mm). Two curves
show the effects of differential pressures (D p) of
1000 psi (Curve 1) and 500 psi (Curve 2). The
fracturing fluid coefficient (Cf ) is the fluid's
temporal variation in velocity divided by the
square root of time and is a function of viscosity
and relative permeability. The use of English
units is common to petroleum literature.
(Adapted from Howard and Fast, 1970.)
Fig. 2.56
Effect of pumping rate and fracturing fluid coefficient (Cf ), as defined in Fig. 2.55, on fracture
radius. Solid curves show observed fracture radius at volume fluxes of 2.5 and 25.0 BPM
(0.0066 m3 /s and 0.066 m3 /s, respectively). Dashed curves show the percentage of fluid volume
lost to the formation. Fracturing conditions are constant for total volume of 20,000 gal. (75.7 m3 )
and fracture clearance (W) of 0.2 in. (5.1 mm).
(Adapted from Howard and Fast, 1970.)
Fig. 2.57
Plots of pressure coefficient [a /b = (dp/dt)v ]
(a) over a range of water temperatures and
pressures and (b) as a function of geothermal
gradients and depth. The

the critical point of water and its attached
line going to lower temperatures is the two-
phase boundary curve. In (b) an + marks the
depths at which the critical value of a /b is
reached and where effective pressure vanishes.
(Adapted from Knapp and Knight, 1977.)
In addition to brecciation and rock fracture, surface ground tilt is a well-documented phenomena in hydrofractured well bores. Studying the size of hydraulic fractures, Sun (1969) showed the relationship between surface uplift and the thickness of a grout sheet that was injected into a horizontal hydraulic fracture at depth around a well bore (Fig. 2.61). Pollard et al . (1983) examined surface deformation above near-surface intrusions and modeled the rock displacement. In Fig. 2.62, their model is compared to measured data from the Kilauea rift zone in Hawaii. The topographic expression of magma injected as dikes at depth is a surface uplift with an axial depression. Calculated contours of maximum principal stress around a buried dike (Fig. 2.63) show that the regional stress field is perturbed in such a way that s1 is horizontally directed near the sides of the dike. This prediction explains why hydrofractures can extend horizontally from some intrusions even though the regional s1 is vertical.
Fig. 2.58
Pore-fluid pressure vs depth for several
geothermal gradients; the lithostatic pressure
gradient for a rock density of 2.75 Mg/m3 is
indicated by the dashed line.
(Adapted from Knapp and Knight, 1977.)
Fig. 2.59
Variation of physical properties of water at (a) 30 MPa (300 Bars) and (b) 60 MPa (600 Bars) pressure
as a function of temperature; sharp inflections and discontinuities appear near critical temperatures.
Vertical axis is nondimensional; units of measure are shown for each curve. Cp = heat capacity at
constant pressure, µ = kinematic viscosity, a = isobaric coefficient of expansion, b = isothermal
coefficient of compressibility, and a /b = pressure coefficient [(dp/dt)v ].
(Adapted from Norton, 1984.)
Size of Hydraulic Fractures
Using the assumption that rocks deform as linear elastic bodies, several theories have evolved for predicting the width and length of hydraulic fractures. Figure 2.64 is a schematic representation of a hydrofracture propagating from a fluid reservoir such as a well bore or a magma body. Two important aspects of fracture calculations are (a) the pressure required to overcome rock compressive stresses and rock strength and (b) the pressure losses resulting from viscous fluid flow in the fracture.
Geertsma and Haafkens (1979) calculated a simple relationship of fracture size [width (W) and length (L)] from fracturing fluid pressure (ppi ), based on the theory of England and Green (1963):
for which W is a function of distance (x), the point where the fracture narrows into a tip at a distance L [L - x = the length of the fracture tip; a measure of fracture tip asperity is included in the last term on the right-hand
Fig. 2.60
Solutions to transient heat flow from magma to wet sediments. Top: Illustration of fluid flow lines
(arrows) as well as thermal, pore pressure, and water density gradients for (a) a short-term thermal
pressurization flow that occurs shortly after initiation of heat transfer (a); and (b) a long-term
buoyancy flow that occurs when pressure gradients caused by gravitational forces are dominant.
Bottom: (c) pressure; and (d) normalized pressure gradients for three possible boundary conditions
between the magma and the host rock. p = pressure, p¥ = pressure at infinite distance,
pi = initial pressure, am = magnitude of thermal expansion, Dd = ratio of penetration depths for
thermal (kt ) to hydraulic (w ) diffusivities, h = Boltzmann variable, and x = distance.
(Adapted from Delaney, 1982.)
Fig. 2.61
Map and cross section showing vertical and aerial extent of experimental hydrofracture around well
bore. (a) Plot shows surveyed data and curve calculated by Sun (1969).

northwest-southeast traverse,


southwest traverse. (b) Plan view of surface uplift shows contours in millimeters (dashed lines),
the extent of grout sheet injected during hydrofracturing (solid line, survey traverse points (

and core hole locations (
(Adapted from Sun, 1969.)
Fig. 2.62
Calculated and measured surface deformation over buried dikes on Kilauea summit and southwest
zone. (a) Data (
results of theoretical vertical uplift. (b) Plot of theoretical horizontal stress vs distance
shows regions of compression and tension. (c) Data from Duffield et al. (1976) for intrusive
event of May 15-16, 1970, showing measured stations (
are projected on a trend of N37°W (solid line). Duffield calculated that the intruded
dike is 3000 m long, 0.8 m thick, 400 m high, and 400 m below the Earth's surface.
(Adapted from Pollard et al ., 1983.)
Fig. 2.63
Calculated contours of maximum principal
stress around a vertical dike that cuts a vertical
plane. The dike is 100 m high and its center is
at -75 m; it is subjected to a driving pressure
of 1 MPa under a lithostatic gradient of
0.025 MPa/m intrusion. Dashed curves are
trajectories of minimum principal stress along
which secondary fracturing might occur. At
depth, hydrofractures extending out from the
dike would propagate perpendicular to
the principal stress contours.
(Adapted from Pollard et al ., 1983.)
side of Eq. (2-26)]. v = Poisson's ratio; µs = the shear modulus; and D p = ppi - seff . Although this formulation is designed for vertical fractures, it also applies to horizontal fractures where s1 is horizontally directed. However, this solution does not account for viscous losses of fluid flow in the fracture and fluid losses to the host rock—problems that require complex treatments and yield relatively small dimensional differences.
Sun (1969) solved for fracture dimensions by calculating ground surface uplift caused by hydraulically induced fractures around well bores. By assuming a thin, disk-shaped fracture and an equilibrium distribution of stresses and displacements in a semi-infinite medium, he built on Green's (1949) analysis of fracturing in an infinite medium. Using an image method to represent the boundary conditions at the free (ground) surface, Sun (1969) calculated displacements—and therefore, fracture dimensions—from general equations of equilibrium for an isotropic elastic body (Love, 1939). The resulting solutions for the relationships among fracture dimensions, fluid pressure, and host rock elastic properties are
In these equations, E = Young's modulus; v = Poisson's ratio; and Q = the fracture volume. In the analysis of fracture volumes, four unknowns (pf , x, L, and Q) can be found by simultaneous solution of Eqs. (2-26) through (2-29), providing one can obtain the host rock properties and depth at which fractures are found (h).
Spence and Turcotte (1985) provided a more rigorous solution to a fluid-driven fracture. They considered fracture of an elastic medium, which is sensitive to the critical stress intensity at the fracture tip, as well as viscous losses of fluid flow in the fracture (approximated by lubrication theory), where the fluid viscosity is sufficiently large and the flow is laminar (Schlicting, 1979). The spatial and temporal fluid pressure distribution pf (x,t) must be such that the faces of the fracture close smoothly at its tip (Barenblatt, 1962):
where µs = the shear modulus; v = Poisson's ratio; Wh = the crack half-thickness; s = a point on the crack surface a small distance from the crack's end; and

Stress intensity factors have been tabulated for various rocks (for example, Clifton et al ., 1976, and Schmidt and Huddle, 1977). Combining expressions for fluid flux and mass conservation produces the Reynold's equation for flow in the crack:
where µ = the fluid viscosity. Spence and Sharp (1983) found solutions by using a numerical similarity technique to model the combined effects of elastic behavior and fluid flux. Spence and Turcotte (1985) found two sets of solutions, depending upon whether a nondimensional stress intensity factor (gk ) is large or small:
where Qf (the fluid volume flux) is expressed for two dimensions rather than three.
Fig. 2.64
Schematic illustration of a hydrofracture includes dimensions important to hydrofracture calculations:
depth in well bore (h), well-bore radius (rw ), fracture width as function of distance and time
[W(x,t)], fracturing fluid velocity (vx ), and total length of fracture (L).
(Adapted from Geertsma and Haafkens, 1979.)
Figure 2.65 illustrates the fracture-tip asperity as required by specification of gk . Large gk corresponds to situations in which the rock's fracture resistance is large compared to the viscous resistance to fluid flow—as it is in the case of a wide elliptical crack profile. Small gk is generally applicable to geologic systems in which the fracture resistance is negligible compared to viscous resistances—as is the case if viscous fluids are forced through a narrow crack with a sharp tip that can easily split the rock. The solutions for this latter situation, in which Af expresses the two-dimensional, fracture-fluid flux, are
Fig. 2.65
Fracture tip asperity as a function of the
nondimensional stress intensity factor (gk )
depends on whether fracture resistance of the
host rock is large (gk >> 1) or small (gk <<1)
compared to viscous resistance of fluid flow
(Spence and Turcotte, 1985).
Results obtained by using the above equation set show good agreement with those obtained from Eqs. (2-26) through (2-29).
Field Examples
The relationships between hydrofracture features discussed above have been used to interpret tephra-filled fractures surrounding a buried dike that was cored near Obsidian Dome in California (Heiken et al ., 1988). Hulen and Nielson (1988) studied hydrothermal brecciation encountered in a well that was cored on the southern margin of the Valles caldera in New Mexico. These examples illustrate two different approaches to understanding volcanic/hydrothermal fracturing.
The Inyo Domes are a recent chain of rhyolitic tuff rings, phreatic pits, and domes on the edge of Long Valley caldera in eastern California (Miller, 1985). The US Continental Scientific Drilling Program explored the possibility that two of the domes, Obsidian Dome and Glass Creek flow, are connected by a buried dike. In addition to proving the dike hypothesis, the core hole intersected several sets of fractures containing juvenile magmatic fragments at various lateral distances up to 130 m from the dike (Figs. 2.66 and 2.67). The fractures, found in quartz monzonitic country rock, were filled with as much as 20% poorly vesiculated, rhyolitic shards, most of which were <1 mm in diameter. The rest of the fillings were mineral clasts and fragments of the quartz monzonite. The fractures ranged in width from millimeters to 8 cm; 0.4 cm was the average width. The ubiquitous cross bedding of clasts, the likelihood of preexisting sheet fractures, and similarly filled fractures found in bedded basalt intersected by a core hole under Obsidian Dome suggest that these fractures are horizontally oriented (Fig. 2.68).
Heiken et al . (1988) used the analysis of a stress field around a dike (Fig. 2.63), as presented by Pollard et al . (1983), and Eqs. (2-26) through (2-36) to calculate hydrofracture conditions at Obsidian Dome (Fig. 2.69). The calculated overpressures of 5 to 10 MPa and fluid viscosities of 0.20 to 0.8 Pa-s correlate with either phreatomagmatic or magmatic fragmentations that produce slurries of steam, water, and solid-particle mixtures. The overall blocky, poorly vesicular textures of the pyroclasts, their dominantly rhyolitic composition, and surface alteration features strongly support the phreatomagmatic origin: late-stage phreatomagmatic eruptions that preceded dome lava extrusion.
Hulen and Nielson (1988) found breccias at a depth of 826 to 856 m in VC-1 core hole, which is located along the intersection of the Jemez fault zone and the ring-fracture zone of the Valles caldera. The tectonic
breccias are contorted, crushed, and sheared, unlike the hydrothermal breccias, which lack frictional textures but show matrix flow foliation and clast rounding—features characteristic of fluidization (Wolfe, 1980; Kents, 1964)—as well as intense alteration. Evidence of five stages of secondary mineral paragenesis to a quartz-illite-phengite-pyrite assemblage (typical of temperatures in excess of 200°C) and a fluid inclusion homogenization temperature of 189 to 283°C were used to model the hydrothermal brecciation.
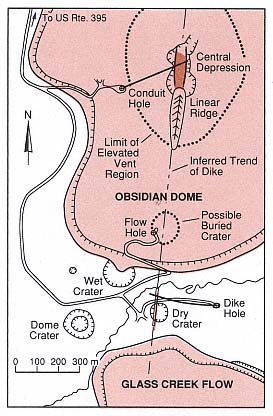
Fig. 2.66
Map of Obsidian Dome scientific drilling project.
Rhyolite lava domes of Obsidian Dome and
Glass Creek Flow are shown in shaded pattern;
lava flow front scarps are designated by
hachured line. The dashed line connecting the
two lava domes is the projection of the dike
found by drilling to pass at depth between
the domes. Core samples and hydrofracture
calculations discussed in the text are for the
(1) dike core hole that is located between the
two domes and slanted down to intersect the
dike at depth, and (2) the conduit core hole
that is slanted down to intersect below
Obsidian Dome's central depression.
(Adapted from Heiken et al ., 1988.)
An extensional state of stress can be inferred for the formation of the VC-1 core hole breccias found along the well-studied Jemez fault zone (Aldrich and Laughlin, 1984; Dey and Kranz, 1988). Hydraulic rupture in such a case is expected where pp exceeds s3 by an amount equal to the rock's tensile strength, as was discussed earlier. Hubbert and Willis (1957) show that this situation can be approximated by
Assuming that ph (hydrostatic pressure) approximates that of the boiling point at depth and that pp = pb (the formation break-down pressure), Hulen and Nielson (1988) estimated pb at 7.5 MPa, which is similar to the fluid injection pressure (ppi ) used in the hot dry rock hydraulic fracturing experiments recently conducted at nearby Fenton Hill (Murphy et al ., 1983). Figure 2.70 shows the results of this model in a plot of depth vs temperature for boiling under hydrostatic and lithostatic loads; this plot also contains the homogenization temperature of fluid inclusions. Either fluid temperature increases or a transient confining pressure decrease during fault movement might cause fluids to reach pb .
Summary: Volcanological Interpretation
Several different but naturally related processes might stimulate fracturing of potential geothermal reservoir rocks: (a) magma intrusion, (b) hydrothermal circulation, (c) magma degassing, and (d) hydrovolcanic processes. For the hydrovolcanic (phreatomagmatic) case, the series of schematic illustrations in Fig. 2.71 depicts the formation of a hypothetical fractured geothermal reservoir underneath a volcano.
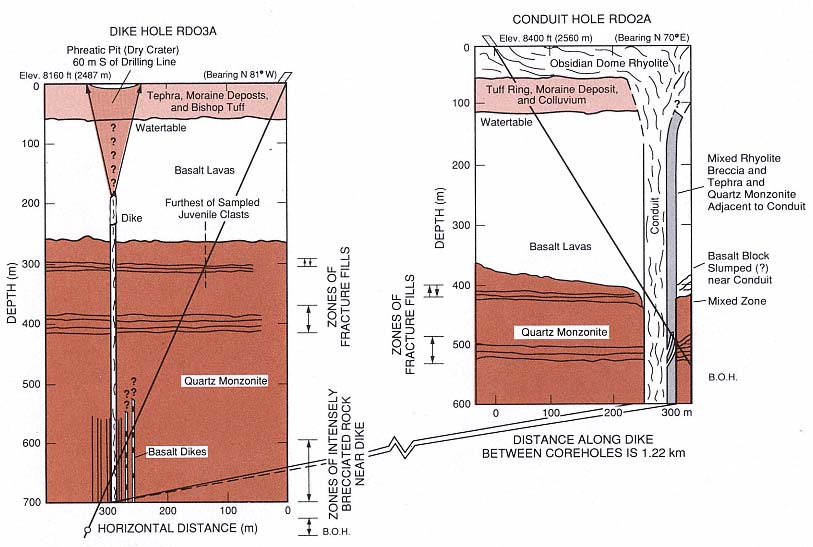
Fig. 2.67
Cross section of dike and conduit core holes showing natural hydrofractures as wavy horizontal lines at depths of 300 to 500 m.
(Adapted from Heiken et al ., 1988.)
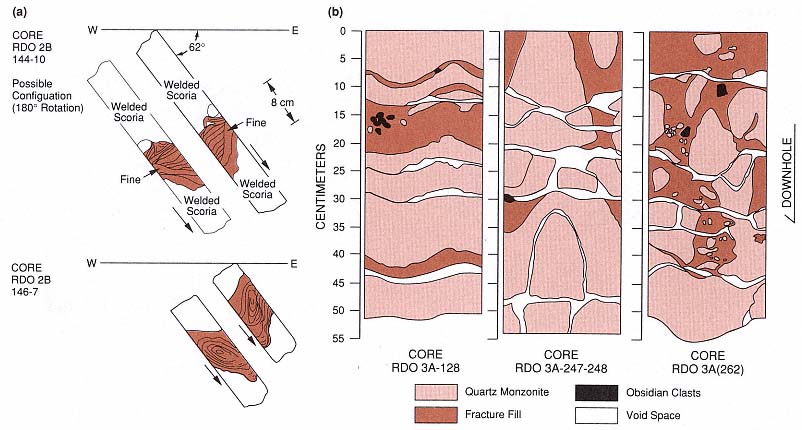
Fig. 2.68
These sketches of cores containing clastic fracture fillings were made by mapping core surfaces on velum wrapped around
the core.(a) Orientation of core segments taken 5 and 1 m west of the conduit that was intersected by the conduit core hole.
The gray, cross- and convolute-bedding fillings range in thickness from 7 to 40 cm. Of the two possible orientations shown,
the lower of each set best fits the bedding texture. (b) Core maps showing fracture fill,
host quartz monzonite, obsidian clasts, and void space.
(Adapted from Heiken et al ., 1988.)
This scenario combines aspects of all four processes listed above. The initial intrusion of a gas-rich magma moves upward along a fracture, opening the fracture with its fluid-rich top. This slow mechanism of crack propagation (termed "stress corrosion" by Anderson and Grew, 1977) is related to rock breakdown by the corrosive crack-tip fluids and rapidly varying pressure brought on by nucleate boiling along the crack walls. At some point, degassing of the magma might drive a hydrofracture into near-surface, poorly competent aquifer strata. The initial Plinian eruptions are driven by exsolving gases under high pressure. With increased fracturing, the aquifer rock fails catastrophically and allows water to mix with the magma, which results in dry phreatomagmatic eruptions. The eruptions gradually become wetter as more water is supplied by the increasingly fractured aquifer. At some stage, the extrusion of magma ceases—perhaps in response to chilling by the aquifer. By this time, hydrothermal circulation is well developed, and fluid from the aquifer continues to transfer heat from the intrusion below the volcano.
The geothermal potential of such a system has only been tested in a few areas (for example, Funiciello et al ., 1976; Barberi, 1985), and its overall importance depends upon a number of geologic controls:
· age and size of the subvolcanic intrusion,
· presence of a sufficient aquifer,
· porosity and permeability of basement rocks,
· fracture strength of basement rocks,
· tectonic regime and location of preexisting fracture systems, and
· clay content of host rocks and the degree of hydrothermal alteration.
In conclusion, we offer the simple model illustrated in Fig. 2.71 as an example of one of several different volcanic processes that develop fracture permeability in basement rocks and promote hydrothermal circulation.
Fig. 2.69
Solutions for hydrofracture at Obsidian Dome, illustrating a model for volcanic hydraulic fracturing.
(a) Hypothetical contours of maximum principal stress (Pollard et al ., 1983; see Fig. 2.63) indicate
the horizontal propagation of hydrofractures from the dike as they intrude into the granodiorite
(quartz monzonite) host rock. (b) Calculated values of fluid overpressure required to form
hydrofractures as a function of depth for the upper and lower set of fractures observed in the dike
core hole. (c) Calculated fracture dimensions and average observed fracture widths for several
different depths. (d) Calculated fluid viscosities required to form the observed fractures.
(e) Calculated fracture formation velocities. Fracturing may have occurred in spurts, causing the
fractures to propagate several meters at a time.
Fig. 2.70
Hydrothermal brecciation model of Hulen and Nielson (1988). This depth vs temperature plot shows
the boiling point curves under hydrostatic (ph ) and lithostatic (pl) pressure, as well as that
required for hydrofracture (pb ). For hydrofracturing that begins at 515 m, path AB follows
pressure buildup and subsequent fracturing as a response to increased temperature; path AC
represents hydraulic rock rupture in response to a rapid pressure release.
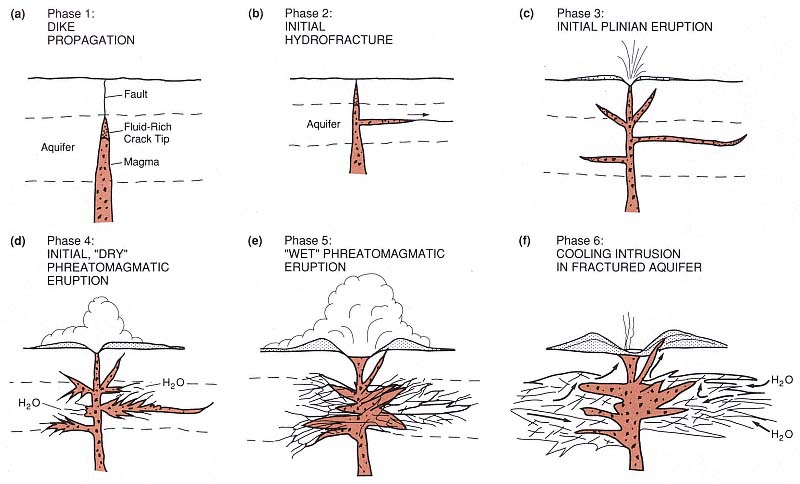
Fig. 2.71
Schematic sequence illustrating the six-phase development of a fractured geothermal reservoir under a phreatomagmatic volcano.
Phases 1 through 3 are hypothesized from the studies of Obsidian Dome discussed in the text (Heiken et al ., 1988).
Phases 4 and 5 reflect the findings of Barberi (1985) for phreatomagmatic eruptions through a deep aquifer;
the tephra deposits record increasing water interaction as the eruption progresses, presumably as a response to the
increased fracture permeability of aquifer rocks induced by hydrofracturing. Phase 6 illustrates posteruptive
cooling of magma intruded below the volcano. Hydrothermal circulation in the aquifer around the intrusion,
greatly enhanced by the magma-induced hydrofracturing, may develop a geothermal reservoir.