Chapter 4—
Chloroplasts—Structure and Photosynthesis
4.1—
Introduction
Chapter 3 dealt with the ultrastructure of the higher plant chloroplast and the differentiation of the chloroplast's internal membrane system into grana and stroma thylakoids. It outlined the structure of the etioplast and examined the sequence of structural and biochemical changes during the maturation of an etioplast into a chloroplast. This chapter examines the thylakoid membrane at the molecular level in relation to its prime function of converting light energy into chemical energy in the form of NADPH and ATP. The formation of a functional thylakoid from the prolamellar body membranes of the etioplast during the greening process will also be considered at the molecular level. Finally, we briefly examine the relationship of the chloroplast to cytoplasm in terms of energy metabolism.
4.2—
Thylakoid Structure
4.2.1—
Thin Sectioning and Heavy Metal Shadowing
When thin sections of fixed and stained leaf material are examined in the electron microscope, the chloroplast thylakoid membrane appears as a single electron dense line or as a tripartite structure (two dense lines with an intermediate light line) characteristic of the unit membrane (chapter 2). In high resolution electron micrographs of thin sections, fixed in permanganate, the thylakoid membranes give the appearance of containing globular subunits, 9 nm in diameter. It is possible, however, that these are an artefact since it is difficult to understand how several layers of overlapping 9 nm particles can be clearly resolved in a section thicker than 40 nm (Branton, 1968).
Some of the earliest electron micrographs of thylakoid membranes were obtained simply by drying isolated chloroplast fragments of Spirogyra and Mougeotia on an electron microscope grid and shadowing the preparations with chromium (Steinmann, 1952). The membranes showed a granular or particulate structure. Similar observations were made subsequently with spinach thylakoid membranes (Park & Pon, 1961). The particles usually existed in a random array but sometimes they were seen in highly ordered arrays. Their dimensions were 15 × 18 × 10 nm and they appeared to contain subunits. Park (1962) suggested
that the particle, which he termed quantasome, might be the morphological expression of the so-called photosynthetic unit, defined as the minimum number of chlorophyll molecules needed to fix one molecule of carbon dioxide per intense flash of light (Emerson & Arnold, 1932). The quantasomes were seen on the inner surface of the thylakoid membrane, suggesting that there was some distortion of the thylakoid membrane during drying.
4.2.2—
Freeze-Etching
The freeze-etch technique is a different approach to the study of the substructure of the thylakoid membrane, because chemical fixatives are not used. Leaf material or isolated chloroplasts are frozen and fractured (Moor et al., 1961). The fracture plane in the frozen sample occurs along hydrophobic regions within the thylakoid membrane exposing complementary faces. Platinum-carbon replicas of the fracture planes are made and examined in the electron microscope.
Two major sizes of particles are seen when mature plant chloroplasts are freeze-fractured; large particles of average diameter, 17.5 nm and small particles of average diameter, 11 nm (Fig. 4.1a). The small and large particles occur on different fracture faces (Fig. 4.1b). Fracture face C, which is towards the stroma
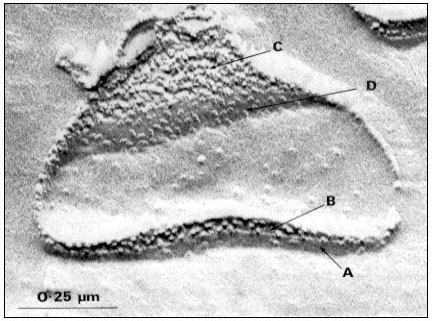
Figure 4.1a
Freeze-fracture electron micrograph of a spinach grana thylakoid, showing
the large and small particle fracture faces, B and C, and the surfaces, A' and D.
(By courtesy of Dr. D.J. Goodchild.)
of the chloroplast contains tightly packed small particles, and the complementary fracture face B contains the large particles at about half the density per µm2 . The large particles are only observed within grana stacks, where the adjacent thylakoid membranes are in close contact, while the small particles are observed in grana and stroma thylakoids. In the unstacked stroma thylakoids the complementary fracture face (designated Bu ) is relatively smooth and shows only a few small particles (Park & Sane, 1971).
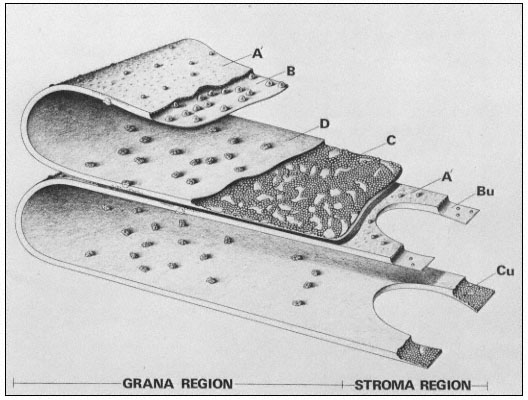
Figure 4.1b
Model of the thylakoid membrane, showing grana and stroma regions.
The particles on the A' surface represent the coupling factor (CF1 ).
(By courtesy of Dr. D. J. Goodchild.)
The exterior thylakoid surface, A', and the interior surface, D, are observable by the deep etch technique, in which the ice covering the surfaces is sublimed off before the replica is made. In well-washed thylakoids the A' surface shows little surface relief, but is covered with proteins in unwashed lamellae. The interior surface is covered with particles about 18.5 × 15.5 nm in size which show slight surface relief. These particles on the D surface contain 3 or 4 subunits and they may correspond to the quantasomes as seen by metal shadowing.
The freeze-etch data suggest that the particles within the thylakoid membrane are arranged somewhat asymmetrically. The larger particles are located towards the inner surface and partly protrude into the intrathylakoid space, and the smaller particles are near the outer surface. The model of the thylakoid membrane shown in Fig. 4.2 appears to be consistent with the freeze-etching results and also with X-ray diffraction studies of thylakoid membranes (Sadler et al., 1973). The membrane is viewed as a lipid bilayer in which the particles are embedded, in accordance with the fluid mosaic model for biological membranes (Singer & Nicolson, 1972; see chapter 2).
Figure 4.2
Structural model of the thylakoid membrane showing an asymmetric
distribution of large and small particles. The two membranes belong to
one thylakoid. The lipid molecules are indicated as a bilayer, the circles
representing the polar head groups. Lipid asymmetry is indicated by the
shading of the head groups. The model appears to be consistent with freeze
-etch electron microscopy and X-ray diffraction of thylakoid membranes.
(From Sadler et al., 1973.)
4.2.3—
Negative Staining
Two sizes of particles are observed on the surface of unwashed thylakoids by negative staining with phosphotungstic acid. The larger particles (11 nm in diameter) are removed by water washing the thylakoids and correspond to the CO2 -fixing enzyme, ribulose bisphosphate carboxylase. The smaller particles (9 nm) are removed by washing with the chelating agent, ethylenediamine tetraacetate, and are identical with the coupling factor (CF1 ) which catalyses the terminal steps in the energy coupling process of ATP formation. These surface particles are not related to the membrane particles seen by freeze-etching (Park & Sane, 1971).
4.3—
Thylakoid Composition
4.3.1—
Lipids
The thylakoid membrane consists of 50% protein and 50% lipid. The feature of its lipid composition is the high percentage of the neutral galactolipids, digalactosyl diglyceride (27%) and monogalactosyl diglyceride (13%), compared with the phospholipids (9%) (Table 4.1). Chlorophyll a plus chlorophyll b account for 21% of the lipids. The thylakoid membrane also contains an anionic sulpholipid. The other unique feature of the thylakoid lipids is their high content of the polyunsaturated fatty acid, linolenic acid (18:3) (Table 4.2).
| |||||||||||||||||||||||||||||||||||||||
| ||||||||||||||||||||||||||||||||||||||||||||||||||||||||||||||||||||||||||||||||
In spinach thylakoids, trans-D3 -hexadecenoic acid is a major constituent of phosphatidylglycerol. Lipophilic quinones, of which PQA9 (2, 3 dimethyl-p -benzoquinine with a 45-carbon side chain at the 5-position) is the major constituent, account for 3 % of the thylakoid lipids.
4.3.2—
Chlorophyll-Proteins
The proteins of the thylakoid membrane include the carriers of the photosynthetic electron transport chain, but these account for only a relatively small percentage. When a thylakoid preparation, from which the coupling factor, lipids and pigments have been removed, is solubilized by the anionic detergent, sodium dodecyl sulphate (SDS), and the extract examined by SDS-polyacrylamide gel electrophoresis, at least 20 polypeptides are obtained (Anderson & Levine, 1974). These range in size from 10,000 to 100,000 daltons. A major fraction of the proteins appear in the region of 25,000 daltons. If the thylakoids are extracted with SDS without prior removal of pigments, two chlorophyllprotein complexes (termed complex I and complex II) are separated by SDS polyacrylamide gel electrophoresis (Thornber, 1975). Complex I which is derived from photosystem 1 (see section 4.4) has a chlorophyll a /chlorophyll b ratio of 12:1 and accounts for about 20% of the thylakoid membrane protein. It has an apparent molecular weight of 110,000 daltons and contains 14 moles chlorophyll a per mole of protein. Complex 11, which accounts for 40–50% of the thylakoid membrane proteins has an apparent molecular weight of 32,000 daltons and contains one mole chlorophyll a and one mole of chlorophyll b per mole of protein.
4.3.3—
Electron Carrier Proteins
The thylakoid membrane contains four spectroscopically distinguishable cytochromes: cytochrome f (a c -type) with an a -band at 554 nm and a midpoint potential of + 0.36 at pH 7, cytochrome b6 (alternate name b– 563) with an a -band at 563 nm and a mid-point potential below - 0.1V, cytochrome b– 559HP (high potential form) with an a -band at 559 nm and a mid-point potential (+ 0.37V) close to that of cytochrome f and cytochrome b – 559LP (low potential form) with an a -band at 559 nm and a mid-point potential of 0.06V (Bendall et al., 1971). The thylakoid cytochromes are not extracted by aqueous solvents. Cytochrome ¦ is extracted into ammoniacal ethanol (Bendall et al., 1971), but the b cytochromes are tightly associated with the thylakoid membranes and are released on extraction of the membranes with detergent (Boardman, 1975).
Plastocyanin is a copper-containing protein with a mid-point potential of + 0.37V at pH 7. It is extracted by sonication of the thylakoid membranes or by detergent treatment. Its molecular weight is 10,500 with 1 gm atom of Cu per mole. The oxidized form of plastocyanin is intensely blue with a main absorption band at 597 nm.
Figure 4.3
Structure of iron-sulphur group in ferredoxin
(from Hall et al., 1972).
The ferredoxins are stable iron-sulphur proteins in which Fe is coordinated to the sulphur atoms of cysteine and inorganic sulphur (Fig. 4.3). Chloroplasts contain a soluble ferredoxin (E0 ' = –0.43V at pH 7.5), which is readily released in aqueous media, and one or more membrane-bound ferredoxins. Soluble ferredoxin has a molecular weight of 12,000 and contains 2 gm atoms of Fe and 2 gm atoms of inorganic sulphur per mole. Bound ferredoxin has also been extracted and purified (Malkin et al., 1974). It has a molecular weight of 8,000 and 4 gm atoms of Fe and 4 gm atoms of inorganic sulphur per mole. Its mid-point potential is 0.1V more negative than that of soluble ferredoxin.
The thylakoid membrane contains a flavoprotein, ferred oxin-NADP+ reductase, which is extractable with detergents. It has a molecular weight of 40,000.
4.4—
Photosynthesis
In the process of photosynthesis in green plants, light energy is absorbed by the pigments of the chloroplast and converted into chemical free energy in the form of ATP and NADPH, which are then used for the reduction of carbon dioxide and the synthesis of plant materials. The major organic products of photosynthesis are carbohydrate and the overall equation of photosynthesis is:

The oxygen which is evolved is derived from water. Carbon dioxide is converted to carbohydrate via the Calvin cycle of reactions (Calvin & Bassham, 1962). In the carbon reduction cycle, one molecule of ribulose bisphosphate (RBP or RuDP) reacts with CO2 to form two molecules of 3-phosphoglyceric acid (PGA), which are converted into phosphoglyceraldehyde (triose phosphate) in a reaction which needs two molecules of NADPH and two molecules of ATP. The regeneration of the CO2 acceptor (RBP) involves a complex series of reactions and requires one molecule of ATP. The overall requirement of the Calvin cycle is 3 molecules of ATP and 2 molecules of NADPH for each molecule of CO2 reduced to carbohydrate. In the C4 -dicarboxylic acid pathway of photosynthesis, in which CO2 reacts initially with phosphopyruvate, 5 molecules of ATP and 2 molecules of NADPH are needed for each molecule of CO2 reduced (Hatch & Slack, 1970).
The light reactions of photosynthesis and the formation of NADPH and ATP are performed by the thylakoids, and the carbon reduction cycle occurs in the stroma or soluble phase of the chloroplast.
4.4.1—
The Photosynthetic Unit and Energy Transfer
The light absorbing molecules, i.e. the chlorophylls and carotenoids, are organized into units in the thylakoid membrane. Quanta absorbed by a large number of pigment molecules are transferred by an efficient resonance mechanism to a special molecule of chlorophyll a , called the trap or reaction centre chlorophyll, where the primary conversion of light energy into chemical free energy takes place. This is the concept of the photosynthetic unit which was first proposed to account for the observation that the maximum yield of CO2 fixed, or O2 evolved, per single flash of intense light was one mole per 2,500 moles of chlorophyll. The absorption band of the reaction centre chlorophyll a is at a longer wavelength than the absorption bands of the light-harvesting pigments to ensure efficient trapping of the energy at the reaction centre.
The reaction centre chlorophyll is in close association with an electron acceptor molecule (A) and an electron donor molecule (D) in the thylakoid membrane. On excitation of the reaction centre chlorophyll (Chl*) by transfer of energy from the 'antenna' pigments, an electron is donated to A giving A– and leaving the chlorophyll molecule deficient in an electron (eq. 4.1). The positively charged chlorophyll then receives an electron from the donor D, and is restored to its ground state energy level (eq. 4.2). The net result is that the energy of a photon is used to transfer an electron from D to A, and thus the primary photochemical event of photosynthesis is an oxidation-reduction process.
4.4.2—
Two Photosystems and the Z-Scheme of Electron Transport
Investigations in the 1950's and early 1960's established that the thylakoid membrane contains two types of photosynthetic units, designated photosystem 1 (PS–1)and photosystem 2 (PS–2), which cooperate in a sequential manner to transfer electrons from water to NADP+ (Boardman, 1968). Figure 4.4 depicts the electron transport pathway known as the Z-scheme first put forward by Hill and Bendall (1960). Both photosystems contain chlorophyll a , chlorophyll b and the four carotenoids, but in different proportions. Each unit of PS–1 or PS–2 contains 200 light-harvesting chlorophylls and one reaction centre.
Quanta of light absorbed by PS–2 are transferred to a form of chlorophyll absorbing at 682 nm and termed chl a– 682. Excitation of chl a– 682 catalyses
the transfer of an electron from Y to Q, giving a strong oxidant, Y+ , and a weak reductant, Q– . Oxidation of water and the release of a molecule of O2 requires the sequential absorption of four quanta and the accumulation of four oxidizing equivalents (Cheniae, 1970). The mechanism of water oxidation is unknown, although it is established that manganese, probably in the form of a manganeseprotein complex, and Cl– are required (Boardman, 1975). The primary acceptor of PS–2, (Q), has a redox potential around zero volts, and is incapable of reducing NADP+ , without an imput of energy into PS–1. Quanta absorbed by PS–1 are transferred to P–700, a form of chlorophyll a absorbing at 700 nm. On excitation, P–700 donates an electron to an acceptor Z, resulting in the formation of P–700+ , a weak oxidant with a mid-point potential of + 0.43V, and Z– , a strong reductant with a redox potential in the vicinity of –0.6V. P–700+ interacts with the weak reductant, Q– , generated by PS–2 via an electron transport chain, which includes plastoquinone A, cytochrome ¦ and plastocyanin. The reduction of NADP+ by Z– is mediated by soluble ferredoxin and ferredoxin-NADP reductase. It seems possible that the primary acceptor of PS–1, Z, is identical to bound ferredoxin, since the latter is photoreduced at very low temperatures (25°K) (Bearden & Malkin, 1974).
Cytochrome b6 appears to function on a cyclic electron transport pathway around PS–1 and it may play a role in cyclic phosphorylation. There is conflicting evidence concerning the role of cytochrome b– 559HP (Boardman, 1975). This cytochrome is oxidized by PS–2 at liquid nitrogen temperature and under certain conditions at room temperature, but at high light intensity it can also be reduced by PS–2. The function of cytochrome b– 559LP is unknown at present.
Much evidence for the scheme of photosynthetic electron transport depicted in Fig. 4.4 has come from difference spectroscopy of chloroplasts. In this method, the change in the absorbance of various chloroplast components is measured on illumination of the chloroplasts with monochromatic light of various wavelengths. By following the change in the spectrum of individual components e.g. cytochrome ¦ or P–700, the role of these components can be deduced. For example, if chloroplasts are illuminated with far-red light of wavelength 720 nm, which is only absorbed by PS–1, there is a decrease in the absorbance of the chloroplasts in the region of 554 nm, due to the oxidation of cytochrome ¦ . If the chloroplasts are then illuminated with 650 nm light, absorbed by PS–2 (as well as by PS–1)there is an increase in absorbance due to the reduction of cytochrome ¦ . The oxidation of P–700 is followed by a decrease in absorption at 700 nm.
Electron transport from water to NADP+ in isolated chloroplasts may be intercepted by the addition of artificial electron acceptors (oxidants), which accept electrons from Z– in PS–1 or from PQ in PS–2. For example, methyl viologen accepts electrons at PS–1 while p -phenylenediamine intercepts the chain at PQ. Ferricyanide or dichlorophenolindophenol can interact at either PS–1 or PS–2, depending on the experimental conditions (Trebst, 1974).
Figure 4.4
Z-scheme for photosynthetic electron transport and photophosphorylation. The
number beside a component indicates the number of molecules of that component per
photosynthetic unit of 400 chlorophyll molecules. Two sites of ATP formation are located
on the pathway between water and PS–1 (see text); one between water and plastoquinone
(PQ) and the other between PQ and PS–1. A scale of redox potentials is shown on the left.
Photosynthetic electron transport is readily monitored by illuminating isolated chloroplasts in the presence of an electron acceptor, and measuring either the oxygen evolved or the amount of acceptor reduced (Hall & Rao, 1972). This reaction is known as the Hill reaction (Hill, 1939).
The herbicides 3(3,4-dichlorophenyl) 1,1-dimethylurea (DCMU) and 3(p -chlorophenyl)-1,-1-dimethylurea (CMU) inhibit electron transport between
Q and PQ. Photoreduction of NADP+ can be restored in the inhibited chloroplasts by the addition of an artificial electron donor such as reduced 2,6-dichlorophenolindophenol. Electrons from the artificial donor enter the electron transport chain between the light reactions, and photoreduction of NADP+ is then driven by PS–1.
PS–1 is known as the far-red system because its absorption spectrum extends to longer wavelengths than that of PS– 2. At wavelengths beyond 700 nm, PS– 1 receives a high fraction of the quanta absorbed by chloroplasts. Chloroplasts contain one molecule of cytochrome ¦ and one molecule of P–700 per 430 chlorophyll molecules, from which it is concluded that the photosynthetic unit contains about 400 chlorophyll molecules. As shown in Fig. 4.4 the chlorophyll molecules appear to be distributed about equally between the two photosystems.
4.4.3—
Photosynthetic Phosphorlation
Electron flow from water to NADP+ is coupled to the formation of ATP. Until recently it was uncertain whether there is one or two energy conserving sites, where ATP is formed. This arose because of the conflicting experimental determinations of the amount of ATP formed during the transfer of 2 electrons from water to NADP (the P/e2 ratio). Earlier measurements gave a P/e2 ratio of one (Arnon et al., 1958), suggesting one energy conserving site, but more recent determinations indicate P/e2 ratios between 1.2 and 1.8 (Trebst, 1974). One energy conserving site is associated with the reoxidation of plastoquinone by cytochrome f, and the second (not shown on Fig. 4.4) is associated with the electron transfer from water to plastoquinone. However, the two sites do not necessarily yield two ATP per 2 electrons transferred from water to NADP+ , as indicated by the experimental P/e2 ratios. A P/e2 ratio of at least 1.5 is needed to provide enough ATP to drive the Calvin cycle, and more ATP is required for the C4 -pathway.
Another type of phosphorylation has been observed with isolated chloroplasts. Known as cyclic phosphorylation, it requires an exogenous cofactor such as phenazine methosulphate, pyocyanin or ferredoxin. Unlike non-cyclic phosphorylation, cyclic phosphorylation is not accompanied by any net change in oxidation or reduction and it is not inhibited by DCMU. The process is driven by light absorbed by PS–1. Chloroplasts exhibit very low rates of cyclic phosphorylation in the absence of an exogenous electron carrier. It is uncertain, therefore, whether cyclic phosphorylation in vivo contributes a significant amount of ATP. Recent work suggests that oxygen may act as an alternative electron acceptor at PS–1 when NADP is fully reduced, and provide extra ATP during electron flow from water to O2 (Heber, 1975). The relative amounts of ATP formed by noncyclic electron flow to NADP+ or O2 could be regulated by the demands of the cell for NADPH and ATP.
4.4.4—
Phosphorylation and Thylakoid Structure
Three main hypotheses have been proposed for the mechanism of ATP formation in mitochondria and chloroplasts (Slater, 1971), but here we will briefly consider only one of these, the Mitchell chemiosmotic hypothesis (Mitchell, 1966; see also chapter 5). The fundamental concept of the chemiosmotic hypothesis is that of vectorial flow of protons across the mitochondrial inner membrane or the thylakoid membrane. Mitchell proposed that the electron transport chains of mitochondria and chloroplasts consist of alternate electron and hydrogen carriers, organized in a vectorial fashion across the membrane. Transport of electrons through the chain of carriers results in the net transfer of protons across the membrane. For the thylakoid membrane, protons are transported from the outside (stroma or matrix) to the inside intrathylakoid space. This is depicted in Fig. 4.5 (Trebst, 1974). In this scheme, reduction of plastoquinone by Q
Figure 4.5
Photosynthetic electron flow, showing vectorial arrangement of carriers and the
movement of protons from outside to inside of the thylakoid. (From Trebst, 1974.)
occurs on the outside of the thylakoid and oxidation by cytochrome ¦ on the inside, resulting in the transfer of 2 protons for each 2 electrons transported from water to NADP+ . Water oxidation is considered to take place on the inside to produce 2 protons per 1/2O2 . According to the Mitchell hypothesis, the protons move back through the membrane through special channels which contain the coupling factor or ATPase, and result in formation of ATP from ADP and inorganic phosphate. As already discussed, part of the ATPase (CF1 ) is on the outside of the thylakoid membrane, and part (CF0 ) is embedded in the membrane. It is not yet established whether the proton gradient across the thylakoid membrane is an essential intermediate in the process of ATP formation during photosynthetic electron flow. However, with thylakoid membranes it has been shown
that ATP formation can be driven by a pH gradient created artificially (Jagendorf & Uribe, 1966). Chloroplasts are suspended in a buffer of low pH (pH < 5) and then transferred to a buffer of pH 8, containing ADP and inorganic phosphate.
According to the Mitchell hypothesis, the energy-conserving sites are identified with the proton-releasing sites on the inside of the thylakoid. Substances such as ammonia which uncouple ATP formation from electron transport in the thylakoid membrane (termed uncouplers) are considered to destroy the proton gradient by transporting the protons across the membrane.
4.5—
Subchloroplast Fragments and the Fractionation of the Photosystems
4.5.1—
Digitonin Method
Methods of isolation of chloroplasts were outlined in chapter 3. In this chapter, we will consider the fragmentation of the thylakoid membrane and the isolation of subchloroplast fragments enriched in PS–1 and PS–2 respectively. The thylakoid membrane is fragmented by a number of treatments including sonication, incubation with detergents, or mechanical shearing on passage through the valve of a French pressure cell (Boardman, 1970). Here, we will outline the digitonin method for obtaining subchloroplast fragments (Boardman, 1971).
Chloroplasts are isolated in a sucrose-phosphate buffer medium and resuspended in 50 mM phosphate buffer + 10 mM KC1. Digitonin., a nonionic detergent is added to a final concentration of 0.5% and the mixture incubated for 30 minutes at 0°C. The resulting subchloroplast fragments are sedimented by differential centrifugation. The first centrifugation is at 1,000 g for 10 minutes, followed by successive centrifugations at 10,000 g for 30 minutes, 50,000 g for 30 minutes and 144,000 g for 60 minutes. The larger fragments which sediment at 1,000 g (D–1) and 10,000 g (D–10) have a lower chl a /chl b ratio than chloroplasts, whereas the smaller fragments (D–50 and D–144) have much higher ratios (Table 4.3). The D–10 fractions accounts for about one-half of the chlorophyll of the chloroplast, while approximately one-third of the chlorophyll is divided about equally between D–50, D–144 and the 144,000 g supernatant.
The smaller fragments (D–144) are highly enriched in PS–1; for example, they have a chl/P–700 ratio of 205, compared with 440 for chloroplast, a low level of manganese and they lack cytochrome b– 559HP . They contain cytochromes ¦ , b 6 and b– 559LP , and show the photochemical reactions of PS–1, including cyclic phosphorylation, but little or no PS–2 activity. The larger fragments (D–10) are enriched in cytochrome b –559HP and manganese and they have less P–700 and cytochrome f on a chlorophyll basis than do chloroplasts. Thus the small fragments have the photochemical properties of PS–1,
| ||||||||||||||||||||||||
and the large fragments are enriched in PS–2. The non-ionic detergent Triton X–100, produces a more complete fractionation of the chloroplasts than does digitonin, but it has the disadvantage that the resulting PS–2 subchloroplast fragments are unable to evolve oxygen.
4.5.2—
Mechanical Disruption of Chloroplasts
Mechanical treatment of chloroplasts by passage through the French Press or by brief sonication disintegrates the chloroplasts into grana thylakoids and small vesicular structures derived from the stroma thylakoids (Park & Sane, 1971). The grana thylakoids are separated from the smaller vesicles by differential centrifugation. The composition and photochemical properties of the vesicles are similar to those of the D–144 subchloroplast fragments, i.e. they are highly enriched in PS–1. This led to the conclusion that stroma thylakoids contain only PS–1, whereas grana thylakoids contain both PS–1 and PS–2 (Park & Sane, 1971), gut an alternate explanation is that the PS–1 containing vesicles are derived from stroma thylakoids.
When chloroplasts are incubated with digitonin, PS–1 containing vesicles are first released from the stroma, but digitonin (and Triton X–100) also releases PS–1 fragments from grana thylakoids.
4.6—
Thylakoid Structure in Relation to the Photosystems
Attempts have been made to isolate individual quantasome particles, active in electron transport from water to NADP+ or ferricyanide. However, disruption of the thylakoid membrane into fragments comparable in size to the quantasome results in the complete loss of the ability to photo-oxidize water, although the small particles retain PS–1 activity, i.e. the small particles are capable of photoreducing NADP+ or methyl viologen with reduced indophenol dye as the electron donor. Biochemical evidence is lacking for the existence in the thylakoid mem-
brane of a quantasome particle (containing one reaction centre of PS–1 and one of PS–2 and the associated light harvesting pigments and electron transfer components) which functions as a discrete unit independent of neighbouring reaction centres and electron transport chains. On the contrary, there is evidence for interaction between reaction centres and between electron transfer chains (Siggel et al., 1972; Boardman et al., 1974).
Studies with chlorophyll-deficient mutants of higher plants and with plants grown under different light intensities do not support the view that PS–2 is confined to grana thylakoids in the higher plant chloroplast (Boardman et al., 1974). Growth at low light results in greater development of grana, but the quantum efficiency for CO2 fixation by leaves or for the reduction of 2:6 dichlorophenolindophernol by isolated chloroplasts is the same, irrespective of the light intensity during growth. If PS–2 were confined to grana, then the plants grown at high light intensity should be less efficient than those grown at low intensity. Some chlorophyll-deficient mutants show poor development of grana, but they exhibit good PS–2 activity. Studies on chloroplast development also support the conclusion that grana are not essential for PS–2 activity (section 4.7).
We have already noted that the large particles seen in freeze-etching of mature chloroplasts are confined to the grana thylakoids. The large particles are not seen in developing chloroplasts prior to grana formation. The large particles seem to be related in some way to membrane stacking and to the presence of chlorophyll b, and do not correlate with functional photosystems, either PS–1 or PS–2.
4.7—
Assembly of the Thylakoid Membrane
4.7.1—
Protochlorophyllide
The structural events of chloroplast development were covered in chapter 3. In this chapter we will consider the net synthesis of chlorophyll and the formation of photosystems 1 and 2 on illumination of dark-grown seedlings. The small amount of protochlorophyllide (Mg-2-vinyl pheoporphyrin a5 ) which is accumulated by the etioplasts of dark-grown seedlings is localized in the prolammelar bodies. Three spectoscopic forms of protochlorophyllide with slightly different absorption maxima (at 628 nm, 637 nm and 650 nm) can be distinguished. Two of these (Pchl-637 and Pchl-650) are converted rapidly to chlorophyllide a on illumination, while Pchl-628 is photo-inactive. The molecular basis for the difference in spectroscopic properties of the protochlorophyllides is not established. Different states of aggregation of the pigment or different modes of binding to protein have been suggested. In the photo-reduction of protochlorophyllide to chlorophyllide a , two hydrogen atoms are added to the 7,8 positions of the porphyrin ring and this requires that the protochlorophyllide
is bound to a protein, termed holochrome (Boardman, 1966). The photoactive protochlorophyllide holochrome can be isolated from bean and barley seedlings. The origin of the hydrogen atoms for the photo-reduction is not known. In the membranes of the prolamellar body, the protochlorophyllide molecules appear to be organized into small units consisting of at least 4 protochlorophyllides, and there is some evidence that the units may contain as many as 20 chromophores.
4.7.2—
Chlorophyll Accumulation
Chlorophyll accumulation on the illumination of 6-day-old dark-grown barley seedlings with white light is shown in Fig. 4.6. On turning on the light a rapid conversion of protochlorophyllide to chlorophyllide a occurs, followed by a lag of about 30 minutes before additional chlorophyll is formed. During the lag phase, the esterification of chlorophyllide a with phytyl alcohol to chlorophyll a takes place. Rapid chlorophyll synthesis occurs after about 2.5 hours. The ratio of chlorophyll a to chlorophyll b is shown by the broken line. Chlorophyll b cannot be detected immediately after the photo-conversion of protochlorophyllide, but it is formed during the lag phase and the ratio of chlorophyll a /chlorophyll b falls rapidly. It takes four hours of illumination, however, before the chlorophyll a /chlorophyll b ratio approaches that of the mature chloroplast. The enzymic steps in the formation of chlorophyll b are not known although radiotracer studies suggest that chlorophyll b is formed from chlorophyll a (Shlyk, 1971).
4.7.3—
Development of the Photosystems
In the greening barley seedling, photosynthetic oxygen evolution is detected after 30 minutes of illumination. After 2 hours, the rate of oxygen evolution per gm fresh weight of leaf is as high as that in the greened leaf at 45 hours. However, when the photosynthetic rate of O2 evolution is related to chlorophyll content of the leaf, it is 80-fold greater after 90 minutes than after 45 hours. The photosynthetic units of PS–1 and PS–2 are functional at an early stage of greening, but the size of the units are small compared with the photosynthetic units in the mature thylakoid membrane. During the greening process, chlorophyll a and chlorophyll b are synthesized and incorporated into the light harvesting units of the photosystems.
PS–1 is active ahead of PS–2. In isolated plastids from greening barley seedlings, appreciable PS–1 activity, including cyclic phosphorylation is observed as early as 15 minutes after turning on the light (Henningsen & Boardman, 1973; Plesnicar & Bendall, 1972).
The cytochromes which are localized in photosystem 1 in the mature chloroplast (cytochrome ¦ , cytochrome b6 and cytochrome b–559LP ) are already present in the etioplasts of dark-grown seedlings but cytochrome b–559HP is
Figure 4.6
Chlorophyll accumulation during the greening of dark-grown
barley seedlings. The solid line indicates total chlorophyll ( a+b )
and the broken line the ratio of chlorophyll a /chlorophyll b.
(From Henningsen & Boardman, 1973.)
formed during greening (Table 4.4). However the synthesis of cytochrome b– 559HP does not correlate with the onset of oxygen evolution and this cytochrome does not appear to be essential for photosystem 2 activity (Henningsen & Boardman, 1973). In greening pea seedlings, the photo-oxidation of cytochrome ¦ , and the photo-reduction of cytochrome b6 which require an active photosystem 1, could be detected after 20 minutes of greening.
There are no significant changes in the amounts of the phospholipids or galactolipids of greening pea leaves during the first 5 hours of greening, but the
| ||||||||||||||||||||||||||||||||
galactolipids increase after that time during grana formation. The fatty acid composition is also constant for 5 hours after illumination.
This constancy of the lipid and fatty acid compositions supports the electron microscope evidence that the membranes of the etioplast are the precursors of the first thylakoids. It is apparent that the etioplasts already contain many of the components which are required for functional photosystems (see also chapter 3).
4.7.4—
Thylakoid Structure During Greening
Earlier studies with isolated plastids from bean and pea seedlings suggested that there was a correlation between the onset of grana formation and an active PS–2, but more recent work shows that grana are not essential for photosynthetic oxygen evolution. Grana formation occurs during the phase of rapid chlorophyll synthesis, which suggets that the degree of grana development may be related to the chlorophyll content of the plastid. This view is supported by work on plants grown at different intensities (section 4.6). If dark-grown seedlings are greened in intermittent illumination (2 minute light periods separated by 15 minute dark periods) grana are not formed, but the plastids exhibit good photochemical oxygen evolution.
4.8—
Relationship of Chloroplast to Cytoplasm
Chloroplasts are surrounded by an envelope which consists of two membranes, the outer and inner membranes. The inner membrane is a permeability barrier to the diffusion of many metabolites from the chloroplast to the cytoplasm and vice versa. For example, the inner membrane is practically impermeable to sucrose, which is a major product of photosynthesis. It is very slowly permeable to ATP and impermeable to pyridine nucleotides and hexosephosphates (Heber, 1974). How then are reduced carbon compounds transported into the cyto-
plasm and how is photosynthetic ATP made available for many other cell processes, such as protein synthesis?
Heldt and his colleagues (1975) have postulated that specific carriers or translocators are involved in the transfer of certain metabolites across the inner membrane of the chloroplast envelope (Heber, 1974). For example, the so-called phosphate trarnslocator facilitates the transfer of 3-phosphoglycerate (PGA), dihydroxyacetone phosphate (DHAP), glyceraldehyde-3-phosphate (GAP) and inorganic phosphate across the inner membrane in a competitive fashion. Figure 4.7 depicts the transfer of carbon and phosphate from the
Figure 4.7
Movement of carbon and phosphate energy from the chloroplasts to
the cytoplasm. ATP is formed in the cytoplasm as the result of
the transfer of dihydroxyacetone phosphate (DHAP) and
oxaloacetate (OAA). Sucrose is formed from DHAP.
(From Heber, 1974.)
chloroplast. It seems likely that sucrose is formed outside the chloroplast although this is not established. ATP and NADPH produced inside the chloroplast by photosynthetic electron flow are used in the conversion of PGA to DHAP. DHAP is exported from the chloroplast to the cytoplasm, where it is converted into sucrose or used for the generation of reducing power and ATP. The PGA can then re-enter the chloroplast.
Reducing power is transported across the inner membrane by a counter exchange of malate and oxaloacetate. NAD-dependent malate dehydrogenase occurs both in the cytoplasm and the chloroplast, while NADP-dependent dehydrogenase occurs in the chloroplast and is activated by light. Heldt et al., (1975) have postulated that the counter exchange of malate and oxaloacetate is facilitated by a dicarboxylate translocator.
Rapid transfer of metabolites between chloroplast and cytoplasm is crucial for the operation of the C4 -dicarboxylic pathway of photosynthesis. In plants
with the C4 -pathway, CO2 is fixed initially by reaction with phosphoenolpyruvate in the mesophyll cells. The resulting oxaloacetate is reduced to malate or transaminated to aspartate. Depending on the species of C4 plant, one or other of these acids is transported to the bundle sheath cells, where the C4 -acid is decarboxylated to give CO2 and a 3-carbon compound. The CO2 is then refixed by the Calvin carboxylation cycle (Hatch & Slack, 1970).
Further Reading
Arntzen C.J. & Briantais J.M. (1975) Chloroplast structure and function. In Bioenergetics of Photosynthesis, (ed. Govindjee). Academic Press, New York, pp. 52–113.
Boardman N.K. (1968). The photochemical systems of photosynthesis Adv. Enzymology,30, 1–79.
Boardman N.K. (1970) Physical separation of the photosynthetic photochemical systems. Ann. Rev. Plant Physiol.21, 115–40.
Branton D. (1968) Structure of the photosynthetic apparatus. In: Photophysiology Vol. III, (ed. A.C. Giese). Academic Press, New York. pp. 197–224.
Calvin M. & Bassham J.A. (1962) The Photosynthesis of Carbon Compounds, Benjamin, New York.
Heber U. (1974). Metabolite exchange between chloroplasts and cytoplasm. Ann. Rev. Plant Physiol.25, 393–421.
Kirk J.T.O. & Tilney-Basset R.A.E. (1967) The Plastids, Freeman, London and San Francisco.
Mitchell P. (1966) Chemiosmotic coupling in oxidative and photosynthetic phosphorylation. Biol. Rev. Cambridge Phil. Soc.41, 445–502.
Park R.B. & Sane P.V. (1971) Distribution of function and structure in chloropalst lamellae. Ann. Rev. Plant Physiol.22, 395–430.
Trebst A. (1974) Energy conservation in photosynthetic electron transport of chloroplasts. Ann. Rev. Plant Physiol.25, 423–58.