PART ONE—
ADDRESSES
One—
The Development of Global Earthquake Recording
R. D. Adams
The Purpose of Seismological Recording
Seismological observatories and networks have to provide the raw information on which seismology is based. The obvious aim of seismological recording is the location of earthquakes, but there is a duality in observational seismology between the determinations of earthquake positions and of earth structure, for to find each, we need the other. Jeffreys and Bullen (1935) were faced with this problem in the determination of their travel-time tables and refined both tables and locations together, and this process of refinement continues.
Earthquake location in time and space is needed for a variety of reasons, for example, seismic hazard assessments for the engineering and insurance industries and to help local authorities in civil protection planning and preparedness endeavors. The position of earthquakes is also of scientific importance in delineating the Earth's tectonic activity, to show the broad pattern of its major zones and also to give details of occurrence in particular areas for scientific understanding of earthquake processes. An obvious example is the early mapping of the midoceanic ridges by earthquake locations before their bathymetric continuity was established.
Once the positions of earthquakes are known we can use the energy recorded from them to establish the properties of earth structure, including near-surface inhomogeneities and deeper structure and discontinuities, as in recent detailed studies of the core-mantle boundary (Morelli and Dziewonski, 1987). As well as velocity structure, we find the attenuative properties of the Earth from decay of body waves, surface waves, and free oscillations.
The final type of information available from seismograms helps reveal the mechanism of the earthquake source itself. This type of information has obvious scientific interest and often has a practical bearing on questions of
seismic hazard assessment. Source mechanism studies have developed from early work that depended only on the directions of the first motion of P-waves to a modeling of P-wave shape and to analysis of the entire waveform to give additional parameters such as the rupture-time history. It is satisfying that such determinations of source parameters are now closely linked, through techniques such as centroid-moment tensor solutions, with earthquake location, giving another example of a unified approach to seismological problems.
Our seismological observatories must provide the raw information necessary to solve these problems. Little, however, can be achieved by one station alone. Cooperation is the key to success, cooperation among countries, among agencies, and among individual stations to form networks on national, regional, and global scales.
Historical Development of Earthquake Location
Pre-Instrumental
In considering the development of earthquake location, we must not neglect the contributions made by noninstrumental seismology. The reporting of earthquake effects is still a major part of observational seismology and a useful adjunct to instrumental recording, but until a century ago it was the only method of studying earthquakes and their distribution. One of the earliest attempts at a global earthquake plot was a catalog produced by the Irish scientist Robert Mallet (1858). This was based entirely on felt reports, thus missing the details of major seismic features of the oceanic ridges, and showed a combination of population and earthquake distributions. Nevertheless, it was a creditable first approximation to a world seismicity map.
Among others prominent in early studies of global seismicity was the French observer Montessus de Ballore (1896), who published a paper with the impressive title "Seismic Phenomena in the British Empire" and realized the need to distinguish between places where earthquakes were reported felt and actual centers of vibration. He also produced early hazard maps, including one for the British Isles (fig. 1).
Good pre-instrumental information may still be subjected to analysis techniques developed later. An example is Eiby's (1980) analysis from the diaries of a clergyman in Wellington who meticulously noted the time and characteristics of aftershocks of the large 1848 earthquake in the north of the South Island of New Zealand. This provided good estimates of the relative numbers of large and small earthquakes (magnitude-frequency parameter b ) and rate of decrease with time of the numbers of aftershocks (decay parameter p ).
Figure 1
Hazard map of Britain (Montessus de Ballore, 1896). Distances
given in kilometers are an arbitrary measure of seismicity inversely
related to the number of earthquakes in a given region.
Early Instrumental Seismology on a Global Scale
World networks of seismographs, such as the Worldwide Standardized Seismographic Network (WWSSN), the Global Digital Seismographic Network (GDSN), and the Incorporated Research Institutions for Seismology (IRIS), are not new. Early outstations were set up by European countries, such as the German station at Apia in Samoa in 1902, but the first serious attempt at global coverage was the network of the British Association for the Advancement of Science (BAAS) established by Prof. John Milne on his return to Britain from Japan in the late 1890s. The Milne network at its peak had about ten stations in the British Isles and nearly thirty elsewhere throughout the world. The network comprised instruments of standard manufacture from which Milne collected readings at his home in the Isle of Wight in the first systematic analysis of global seismicity. From this enterprise, whose results were published as the Shide Circulars of the BAAS, there developed the International Seismological Summary (ISS) and, later, the International Seismological Centre (ISC). Under Milne, for the first time the true pattern of instrumentally determined global seismicity began to emerge, as shown in his earthquake map for 1899, which also shows the distribution of Milne seismographs (fig. 2; Milne, 1900).
We must remember that the knowledge of earth structure at that time was very elementary, and the instruments low in magnification (about 12), long in period (about 12 s natural period), and undamped, with surface waves as the main recordings. The general accuracy of location was surprisingly good, but naturally mistakes are apparent in the light of modern knowledge. One great strength of the network was its uniformity, which has helped in a recent reevaluation of Milne's locations of early events in West Africa (Ambraseys and Adams, 1986). Irrespective of details, it was often possible to establish by a similarity of reporting that certain stations were nearly equidistant from a given earthquake. We found that consistent locations could be found by using the reported time of the maximum oscillation, M , assuming it to be an Airey phase of velocity 2.8 to 3.0 km/s. In this way we could confirm the location of many early events, but some we found to be grossly misplaced. An example is the event of May 21, 1910, originally placed in Niger in Central Africa but found by us to be in Turkey, where there was confirmatory felt information (fig. 3).
Damped instruments of greater sensitivity were developed after about 1910, and fuller details of P and S phases were recorded but at the expense of uniformity of recording. By 1930 the number of recording stations had grown, and a map (fig. 4) compiled by Miss Bellamy (1936) of ISS shows well the main features of global seismicity, but with the details blurred by scatter. The stations at that time are shown in figure 5.
The number of stations grew steadily, and by 1951 about 600 were listed with their direction cosines in an ISS publication. The distribution of sta-
Figure 2
Global earthquakes and seismograph stations in 1899 (Milne, 1900). Epicenters
are approximately indicated by numbers that refer to events in Milne's catalog.
Figure 3
Relocation to Turkey of an event originally placed in Niger (Ambraseys
and Adams, 1986). Arrival times are given for stations with reinterpretation
of phases and derived distances in degrees.
Figure 4
Global earthquakes 1913–1930, showing scatter of features now better defined (Bellamy, 1936).
Figure 5
Seismograph stations in 1936 (Bellamy, 1936).
tions, however, remained very uneven, with strong concentrations in North America and particularly in Europe. At the time the New Zealand station Roxburgh was installed in 1957, at latitude about 45°S, it was the most southerly regularly operated station in the world, still leaving the southernmost thirty percent of the world's surface with no station. The advent of the International Geophysical Year, and the installation of about 120 WWSSN stations in the late 1950s and early 1960s, changed the picture enormously; since then the coverage of recording stations has significantly improved.
Felt Reporting
The contribution to observatory seismology of felt information, even in present times, must not be underestimated. Properly documented felt reports can add valuable information, and in some parts of the world they still provide the most accurate locations. Felt reports of a small earthquake often give a more reliable location than can be determined from readings at a few stations, and a well-determined felt pattern for a large event will define the center of energy release, which may be closer to the centroid-moment tensor solution than to the less significant point of initation of rupture that is given by the instrumental hypocenter. Ambraseys and his co-workers (for example, Ambraseys and Adams, 1986) have developed formulae for estimating surface wave magnitude, Ms from isoseismal radii. These estimates have been shown to agree well with instrumentally determined values.
Global Earthquake Location at the Present Time
The precision of earthquake location continues to improve. A recent example from the North Sea (Engell-Sørensen and Havskov, 1987) shows a much clearer pattern for 1985, when an improved station network was operating, compared with earlier years (fig. 6). On a global scale many small-scale tectonic features are now apparent in careful plotting of ISC data. Examples of these have recently been produced by Young et al. (1987) of the Ministry of Defence Seismological Unit in Britain (figs. 7, 8).
Despite these advances, some difficulties remain in global earthquake location, and some improvements could still be made.
In 1985, the period on which ISC is now working, about 1,400 stations reported each month, the largest events being reported by about 700 stations. For accurate location, however, it is the distribution of stations, rather than their number, that is important. More stations in seismically quiet, well-developed countries add little to location accuracy. It is true that a few strategically placed sensitive stations, particularly if they are arrays, can detect all major earthquakes, but give poor accuracy of location. Simple array locations of teleseisms are often many degrees in error and can have
Figure 6a , b
Earthquakes in the North Sea, showing better-defined seismicity for the later
period during which more stations operated (Engell-Sørensen and Havskov, 1987).
compensating errors of up to 600 km in depth and one minute in origin time.
A few currently active stations in remote areas are still of immense value in effective global earthquake coverage. Examples are stations in the Antarctic and those like Raoul Island in the Kermadecs, which is still visited by ships only two or three times a year. Such stations are valuable even if local variations from a spherically symmetric velocity model are ignored.
Let me summarize the present-day status of global earthquake location as seen from ISC. Large major earthquakes are now well controlled in position, including depth, and mechanism. At the other end of the scale, in areas with
close local networks such as California, Japan, and New Zealand, small local earthquakes can be detected and accurately located down to microearthquake levels. Many uncertainties remain, however, for small to moderate events in remote regions, including oceanic areas and sparsely inhabited continents.
The main difficulty in global earthquake location at the ISC is the "association" of individual readings into events. ISC locates about 25,000 events a year, or about one every twenty minutes. Therefore, it is not surprising that considerable ambiguity often arises as to which event a particular arrival belongs. This task is even more difficult at ISC because the analyst has to rely on reported times only, with no additional information on the character of the arrival to help discriminate between phases from teleseisms and local
Figure 7
Detailed seismicity plot of ISC locations (Young et al., 1987).
events. Sometimes the inclusion or exclusion of a particular observation makes two solutions widely separated in position or depth equally plausible.
In addition to uncertainty of station association, detection is still poor in a surprisingly large area of the world. In 1983, for example, ISC found more than 2200 previously undetected new events (about 6 a day) of which 57 (about one a week) had a body-wave magnitudes, mb , of 5.0 or greater. Most of the new events were found in remote areas around the Pacific, such as the Kermadec Islands, Sunda Arc, and New Guinea, but many also are found in highly active areas such as Turkey and South America, and a surprising number appear in well-developed countries where the national networks cannot locate events by themselves. An example of this is found in Europe, where new events tend to cluster near national boundaries where no one
country has enough information to locate an event, but the combined readings collected at ISC give a satisfactory solution (fig. 9; Adams, 1981). Other new earthquakes have been found in areas previously thought to be aseismic or of very low seismicity, such as Antarctica (Adams and Akoto, 1986).
Another emerging difficulty is analysis that is too automated. In particular, readings of distant events across small, dense networks can be interpreted as local events, either inside or very close to the network, if the records are not carefully scanned for clues of character, for duration, and for later phases. One example occurred on May 23, 1985, when the procedures used at the U.S. National Earthquake Information Center (NEIC) found enough readings from Fijian stations to produce a solution giving a shallow local event, whereas incorporation of readings from more distant stations showed that the earthquake was 500 km deep and nearly 1000 km away (fig. 10). Perhaps the worst recent example is the misinterpretation at the Large Aperature Seismic Array in Montana (LASA) of steeply arriving core phases as P arrivals from the limit of P-wave distance. This results in a spurious "ring of fire" at a distance of about 100° from LASA. In particular, such arrivals from Pacific events form a fictitious zone of activity through Central Africa (fig. 11), which could easily be mistaken for a manifestation of the Cameroon Volcanic Line (Ambraseys and Adams, 1986).
The other great uncertainty in earthquake location that persists is due to the large-scale regional departures in velocity from the accepted models. In particular, the main subduction zones have velocity anomalies of ten percent or more that are ignored in standard processing. For large events located with many teleseismic readings, the errors are minimal, but close stations can exhibit very large residuals. At the other end of the scale, very small events located only by very close stations cannot be greatly mislocated. Intermediate-magnitude events located by a few regional stations can be grossly mislocated, with small residuals arising not from accurate location but from accommodation of inappropriate velocities by the least-squares procedure. An example of this is a 1975 New Zealand earthquake, with a solution from twenty local stations, which by a special study was shown to be mislocated in both position and depth by about 50 km (fig. 12; Adams and Ware, 1977).
Ideally, a complete three-dimensional velocity model of the Earth is needed to ensure good earthquake location. Simple time corrections for stations and sources near areas of velocity anomalies are not enough without considering azimuthal effects. For a first approximation, a "path correction" for each source-receiver pair would give significant improvement.
The reliability of global earthquake location is steadily increasing, but remaining uncertainties are not always appreciated by nonspecialists. Any poorly recorded event in an unusual position should be carefully examined.
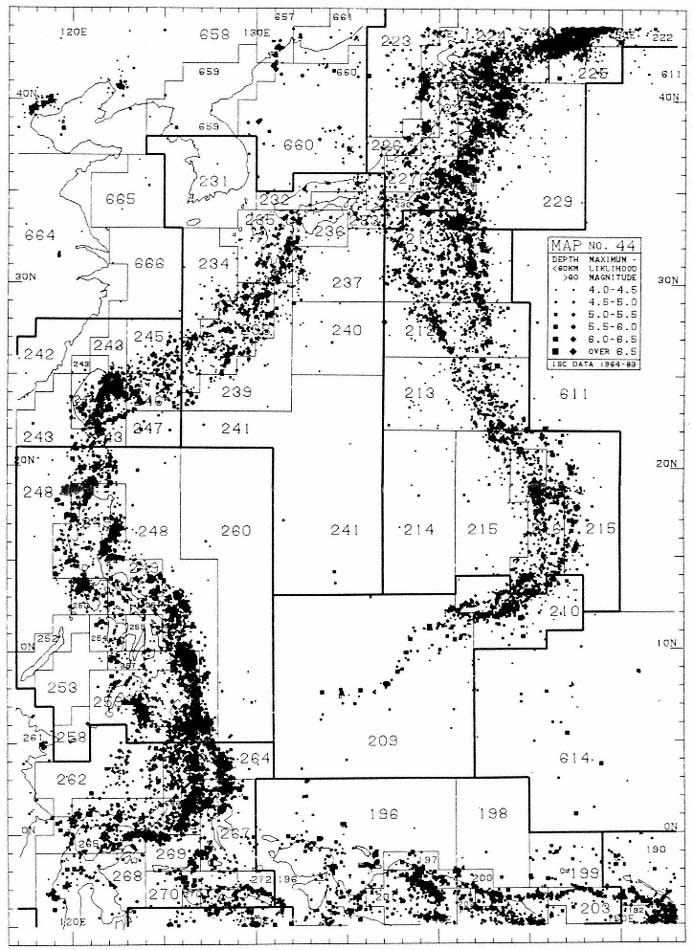
Figure 8
Detailed seismicity plot of ISC locations for the Philippine Sea area (Young et al., 1987).
Figure 9
Previously undetected earthquakes in Western Europe found by the
ISC "search" procedure. Note the clustering near international boundaries.
Open symbols represent subcrustal earthquakes (Adams, 1981).
Future Developments
The world network can now adequately locate major earthquakes, and plans of organizations such as IRIS will ensure that detailed studies of their mechanisms can be carried out. It is the smaller events that need closer study, with better velocity models and readings from more and closer stations. The full global seismicity pattern can never be adequately monitored by one hundred or so well-placed sensitive stations. Whereas such a network might detect a large number of events, its accuracy of location would be poor. For example, the locations during a trial experiment in 1984 by stations con-
| ||||||||||||||||||||||||||||||||||||||||
|
Figure 10
The ISC computer solution for the earthquake of May 23, 1985. Note the false position found by the U.S. National Earthquake
Information Center because its automatic location procedure misinterpreted readings at stations of a dense local network in Fiji.
tributing to the network sponsored by the Committee on Disarmament, Geneva, were significantly fewer and poorer than those found later by ISC for the same period. The greatest uncertainty in geometric location procedures is still in the determination of depth, and it is here that waveform modeling can make an important contribution.
What developments should be seen by the end of this century? Obviously, there will be an established global network of digital broadband stations, with a dynamic range high enough to record ground noise at the quietest sites but not subject to overload when recording strong motion from major earthquakes. We should also see more close networks in active areas and, in particular, many more stations in remote and oceanic regions, with a great
Figure 11
Spurious earthquake locations in Central Africa derived from misinterpretation of core phases on Pacific earthquakes recorded at
the LASA array in Montana. Figures are assigned magnitudes, and underlining implies more than one event at the same location.
Figure 12
Mislocation of an intermediate-depth New Zealand earthquake. The position indicated
by k = 1.0 is that found from the local network with a standard velocity model. The
position marked "USGS" is that derived by the U.S. Geological Survey PDE service.
That marked k = 0.9 is found by special study using a laterally changing velocity
model, and is believed to be closer to the true position (Adams and Ware, 1977).
increase in the number of ocean-bottom seismographs. It has even been suggested that a succession of recording hydrophones be allowed to drift along the major ocean currents. Telemetry by land line, radio, or satellite will bring information for more rapid determination of earthquake parameters, but later, more refined processing will still be needed, as now, with careful monitoring by trained seismologists. The later analysis will include not only refinement of location, but modeling for depth and mechanism.
Observational seismology has come far in the last hundred years. There is every prospect that it will continue to develop and prosper.
Acknowledgments
I thank Dr. P. W. Burton of the British Geological Survey for supplying early seismicity maps, and Mr. J. B. Young of the Ministry of Defence Seismological Unit, Blacknest, for permission to use previously unpublished plots of ISC earthquakes.
References
Adams, R. D. (1981). ISC determinations of previously unreported earthquakes in Europe. In V. Schenk, ed. Proceedings of the 2d International Symposium on the Analysis of Seismicity and on Seismic Hazard, Czechoslovak Academy of Sciences, Prague, 132–139.
Adams, R. D., and A. M. Akoto (1986). Earthquakes in continental Antarctica. In G. L. Johnson and K. Kaminuma, eds., Polar Geophysics. J. Geodynamics 6: 263–270.
Adams, R. D. and D. E. Ware (1977). Sub-crustal earthquakes beneath New Zealand; locations determined with a laterally inhomogeneous velocity model. N. Z. J. Geol. Geophys., 20: 59–83.
Ambraseys, N. N., and R. D. Adams (1986). Seismicity of West Africa. Ann. Geophysicae, 4B; 679–702.
Bellamy, E. F. (1936). Index Catalogue of Epicentres for 1913–1930. County Press, Newport, Isle of Wight. United Kingdom, 36 pp.
Eiby, G. A. (1980). The Marlborough earthquakes of 1848. New Zealand DSIR Bulletin 225, 82 pp.
Engell-Sørensen, L., and J. Havskov (1987). Recent North Sea seismicity studies. Phys. Earth Planet. Inter., 45: 37–44.
International Seismological Summary (1951). The geocentric direction cosines of seismological observatories. County Press, Newport, Isle of Wight, United Kingdom, 18 pp.
Jeffreys, H., and K. E. Bullen (1935). Times of transmission of earthquake waves. Bureau Central Séismologique International, Travaux Scientifiques, Strasbourg, 11.
Mallet, R. (1858). Fourth report upon the facts and theory of earthquake phenomena. Report of 28th meeting of British Association for the Advancement of Science. John Murray, London, 1–136. (Plate XI).
Milne, J. (1900). Fifth Report of the Committee on Seismological Investigations Plate II,. British Association for the Advancement of Science, London.
Montessus de Ballore, F. de. (1896). Seismic phenomena in the British Empire. Q. J. Geol. Soc. Lond., 52: 651–668.
Morelli A., and A. M. Dziewonski (1987). Topography of the core-mantle boundary and lateral homogeneity of the liquid core. Nature, 325: 678–683.
Young, J. R., R. C. Lilwall, and A. Douglas (1987). World seismicity maps suitable for the study of seismic and geographical regionalisation. AWRE Report 07/87. Her Majesty's Stationery Office, London.
Two—
One Hundred Years of Contributions of the University of California Seismographic Stations
Bruce A. Bolt
The first seismographs in the Western Hemisphere were installed at Lick Observatory and at the Berkeley campus of the University of California in 1887. Seismographs have recorded at these sites without serious interruption during the subsequent 100 years, making them the oldest continuously operating seismographic stations in the Western Hemisphere. This period coincided with vigorous growth in the physical knowledge of earthquakes and their sources and the application of seismic waves to geophysical problems. Earthquake recordings and associated analyses at Berkeley have made major contributions to these scientific advances.
Valuable measurements of many significant earthquakes in the United States and abroad have been made by the California stations, including seismograms from major regional earthquakes such as those in 1906 (San Francisco), 1927 (Lompoc), 1957 (San Francisco), 1966 (Parkfield), 1971 (San Fernando), and 1987 (Whittier Narrows). Crustal studies in Northern California were first carried out using recordings of local earthquakes. The Byerly fault-plane inverse method led to quantitative global analysis of earthquake mechanisms. Readings of arrival times and amplitudes of seismic phases, of great value for studies of deep Earth structure, were reported in Station Bulletins, U.S. Coast and Geodetic Survey (USCGS) and U.S. Geological Survey (USGS) catalogs, and the International Seismological Summary and International Seismological Centre lists. In particular, identification of exotic phases such as PnKP , ṔṔ , PdP , SH diff , and others have been of special inferential value. Developments in seismometry include the testing of the first regional network of stations (1960–61) in earthquake country using telephone telemetry; the introduction of broadband recording (1963 at Berkeley, followed by regional stations); the design (1980) of portable auto-
matic seismic wave processors; and the development (1985–87) of a regional digital seismographic system based on inexpensive PC microcomputers.
Recordings of both regional earthquakes and actual ground motions from nuclear tests in Nevada have played a significant role in discriminating between seismic wave patterns produced by underground nuclear explosions and natural earthquakes. The uninterrupted record of regional earthquakes (1910 to present) published in Station Bulletins permitted, for example, the detection of an approximately 22-year cycle in the occurrence of characteristic earthquakes near Parkfield along the San Andreas fault; currently this is the only official earthquake prediction (for 1988 ± 5 years) yet released in the United States. Finally, new ideas on the application of strong-motion seismology to engineering have emerged at the Seismographic Stations.
The Age of Astronomers
In his thorough history of the Stations[*] operated out of the University of California at Berkeley, Louderback (1942) makes the point that the installation of seismographs at Lick Observatory (Mount Hamilton) and the Students' Observatory on the Berkeley campus were organized under the same plan, with fundamentally identical instrumentation (fig. 1). At the instigation of E. S. Holden, who was President of the University in 1885, the best instruments available at the time, designed by Prof. J. A. Ewing, arrived from England in 1887. The official inauguration of Lick Observatory was not until June 1888, a circumstance that sometimes causes confusion in relation to the date of start-up of the seismographs. In fact, Holden had the Ewing pendulums installed at Lick Observatory the previous year, and the first record reported was of a local earthquake on April 24, 1887. At Berkeley, the first indicated record (on the Ewing Duplex Pendulum) was of an explosion at a powder works in North Berkeley on August 11, 1887; the first earthquake to be recorded was on August 19, 1887, at 1:02 A.M.
The early seismological developments at Lick and Berkeley were due largely to the interest of astronomers. Holden became the Director of Lick Observatory after its completion in 1888. Initially, he was concerned primarily with astronomical aspects, stating that the seismographs were required "to keep a register of all earthquake shocks in order to be able to control the positions of astronomical instruments." Evidently, his interests broadened in that he published a catalog of Pacific Coast earthquakes (1897–
[*] In the following discussion, "Stations" will be used to refer to the Seismographic Stations of the University of California at Berkeley. Originally, the designation was simply University of California. Thus, the Stations are arguably the oldest organized research unit, both of the University of California and of the Berkeley campus.
Figure 1
Map of central and northern California showing various seismographic
stations of the University of California at Berkeley network that operated
for a year or more since 1887 through 1987. The stations at Reno (REN)
and Mina (MNV), Nevada were also part of the UCB network for a period.
Figure 2
Ground-motion recording of the 1906 San Francisco earthquake made at Lick
Observatory, Mt. Hamilton, California, by the Ewing three-component seismograph.
1906), later incorporated into the famous Townley-Allen Earthquake Catalog (1939). Holden's catalog, although not the first in the world, was perhaps the first in the United States. By the turn of the century, a coordinated group of nine seismographic stations in Northern California and Nevada had been established at local astronomical observatories, such as that at Carson City, Nevada. These instruments, including the original Ewing seismographs, were therefore in place to record the great 1906 earthquake, but their ground-motion response was too limited to play an incisive role in the studies of the mechanism of that earthquake. The only seismogram (see fig. 2) that has had much scientific consequence was from the conical pendulum.
The 1906 Earthquake
The occurrence of this destructive earthquake began a new era in seismology in the United States and especially at the University of California at Berkeley. The Seismological Society of America was organized in San Francisco in 1906 with George Davidson as President and Prof. G. D. Louderback of Berkeley as the first Secretary. The period saw fresh impetus to observational seismology, and new instruments were installed at the University's Seismographic Stations. For example, Prof. F. Omori of Tokyo University provided in 1906 a two-component horizontal seismograph from Japan. Later, two Bosch-Omori pendulum instruments were operated by the University of California, one at Berkeley (1910 to 1961) and a less massive one with two horizontal components at the subsidiary station at Ferndale (1933 to 1962). The latter was transferred[*] from the Seismographic Stations on "permanent loan" in 1963 to that city, where it is now on display in a special earthquake museum (see fig. 1). By 1910, an 80-kg Wiechert vertical seismograph had arrived at Berkeley from Germany, and the next year a 160-kg horizontal and an 80-kg Weichert vertical component seismograph were installed at Lick due to a generous gift from W. R. Hearst. Up until the 1950s, the station at Mt. Hamilton continued to be operated by the astronomical staff, whereas the Berkeley instruments were tended initially by the Engineering Department and from 1910 by members of the Department of Geological Sciences (then called the Department of Geology and Mineralogy).
It is appropriate to stress here the importance of some of the figures associated with the Seismographic Stations in the first two decades of the century. H. O. Wood was on the academic staff at Berkeley and was associated with the earthquake recordings there until his departure for the Volcano Observatory in Hawaii in 1912. (It is unfortunate that Wood seems to have taken with him to Hawaii, either then or later, a selection of seismograms of key earthquakes from the Berkeley collection. Despite my attempts to find them, these seismograms have never been recovered.) Wood later played an extremely important role in the development of the Southern California network beginning at the California Institute of Technology in Pasadena in 1932. While at the University of California, Wood gave a course in seismology (Geology 114) in 1911 and 1912, which may have been the first in the subject in the United States. The course was continued from 1912 to 1921 by E. F. Davis, subsequently chief geologist and vice-president with Shell Oil. J. P. Buwalda inherited it in 1922, after which he became chairman of the Department of Geology at the California Institute of Technology. In 1923, J. B. Macelwane, who obtained a Ph.D. in physics at Berkeley, was appointed Assistant Professor by Andrew C. Lawson. He was responsible for
[*] My action led to a Resolution by the California Assembly asking me not to close this earthquake station.
the seismographs and taught seismology, including a graduate course, until he went to St. Louis in 1925.
There is no evidence that Lawson either taught seismology or was directly associated with the seismographs. Nevertheless, the interest of such a figure, with powerful influence both in U.S. geological circles and in the University, ensured the continuous operation of the Seismographic Stations and the strengthening of seismology within the Department of Geological Sciences. Lawson's seminal contribution to the field was the Report of the State Earthquake Investigation Commission (1908), which he contributed to and edited. In this report, H. F. Reid proposed the elastic rebound theory of earthquake generation by sudden fault slip. This model was adopted as realistic by subsequent seismologists at Berkeley.
The Directorship of Perry Byerly, 1925–1962
The period during which direction came from Perry Byerly coincided with striking advances in the science of seismology, many of which depended on contributions from the Berkeley Stations. Their operation during these thirty-eight years provided the first reliable and homogeneous catalog of earthquakes in Northern California and surrounding areas. The Bulletin of the Seismographic Stations (of direct value to California citizens) began in 1910 and has continued until the present. It is the primary source of information on earthquakes and locations (and locally assessed magnitudes, after 1942) and is consulted often for both research and practical seismic hazard evaluation.
Some details of Byerly's incumbency up to 1942 are set out in Louderback's history (1942). For an assessment of his main contributions to seismology the reader is referred to Bolt (1979). During his tenure, Byerly worked as a professor in the Department of Geological Sciences, which became the Department of Geology and Geophysics in 1947. In the postwar period, the Stations were affected by the general reorganization of research groups at the University of California at Berkeley with the creation of a formal scheme of Organized Research Units (ORUs). These units were and are meant to act as interdepartmental research centers where graduate student training and faculty research can be concentrated on a broad subject in a profitable way.
After World War II, the staff remained small until the first significant increase in 1956, with the appointment of a professional research seismologist as assistant to Byerly, who was under unusual pressure in maintaining the work of the Stations along with a full teaching and research load. The first research seismologist to be appointed on the Station budget was Dr. D. Tocher (1956–1964). Tocher, a Ph.D. student of Byerly's, returned from Harvard to fill the position. Although the budget increased little in the 1950s,
more modern instrumentation was introduced at Berkeley and Mount Hamilton. The number of stations, with a considerable variety of seismographs, increased to fifteen by 1960, including cooperating stations in Nevada (at Fallon, Reno, Ruth, and Yerington) and Oregon (at Corvallis). Of special research importance was the early operation of Wood-Anderson instruments. For a considerable time the Berkeley Station was also responsible for the Reno Station (1948–1963) and the Branner Station (1947–1968) at Stanford University. Byerly cleverly managed the expansion by using facilities generously offered by colleges like Fresno and Humboldt State College. A full listing of the growth of the Stations and their instrumentation is given in Bolt and Miller (1975). Special credit must be given during these years to the instrumental, organization, and diplomatic skills of W. C. Marion, chief technician at the Stations from 1953 to 1975.
Another major step forward was taken with the Observatory work in 1961. This growth was a direct result of the upgrading of seismology nationally as part of the scientific effort stimulated by negotiations for a testban treaty for underground nuclear explosions. It was quickly realized during early discussions with the Soviet Union and Great Britain (Byerly was a U.S. advisor at the test-ban treaty talks in Geneva in 1958) that observational seismology had not kept up with available technology. From the very beginning of surface and underground testing, the Berkeley Stations recorded ground motions from some of the largest explosions. For example, Prof. Edward Teller tells of confirming the detonation of the nuclear device "Mike" at Eniwetok atoll, Marshall Islands, by watching the galvanometer light spot of a seismograph move "wildly" in the seismological vault in Haviland Hall. Some details of these Berkeley contributions can be found in Bolt (1976).
Two important steps were taken at this time using research grants from Project VELA UNIFORM of the Advanced Research Project Agency of the Department of Defense. One was the tunnel driven into the Berkeley Hills above the campus to create a less noisy recording vault, subsequently called the Berkeley Byerly station (BKS). This vault became the site in 1959 of newly designed seismographs that were part of the Worldwide Standard Seismographic Network (WWSSN). The second step, largely under the supervision of D. Tocher, W. C. Marion and R. Sell, was installation in northern California of the first regional network of seismographic stations telemetered by commercial telephone lines (see "Seismicity" below).
The Directorship of Bruce A. Bolt, 1963–1989
The author of this historical account was appointed Director to succeed Byerly in February 1963. His directorship continued until June 30, 1989.
Major changes in observational power and research breadth took place
during this quarter century (see "Seismological Contributions" below). The network was consolidated to allow continuous operation, largely with state funds included in the University budget. These state research funds came under considerable pressure at various times during these twenty-five years, and battles had to be fought to maintain the budget at adequate levels. Some older stations, such as Fresno and San Francisco, had to be closed for reasons of economy. A major success was the special addition by the state of $80,000 per year to the operating budget after the 1971 San Fernando earthquake. The University subsequently incorporated these funds into the regular budget.
In 1964, the seismological strength of the Department of Geology and Geophysics was increased by the appointment of Dr. T. V. McEvilly from St. Louis University, where first Macelwane and later a distinguished alumnus from the Seismographic Stations, Prof. W. Stauder, had gone to teach. McEvilly was appointed Assistant Director of the Seismographic Stations in 1968. Also in 1968, L. R. Johnson came from the California Institute of Technology as a Professor in the Department of Geology and Geophysics and became an Associate at the Stations. Other Associates appointed have been D. Tocher, M. Niazi, D. R. Brillinger, J. Penzien, and E. Majer. The key position of Research Associate at the Stations changed occupants several times during the period: Dr. C. Lomnitz (1964–1968), Dr. M. Niazi (1968–69), Dr. U. Chandra (1969–1970), Dr. R. D. Adams (1970–1971), Mr. W. K. Cloud (1971–1976), and Dr. R. A. Uhrhammer (1976–present). Dr. Tocher left the staff in 1965 for earthquake research at the USCGS (later to become the National Oceanographic and Atmospheric Agency—NOAA). A second Research Seismologist, Dr. R. Clymer, was appointed in 1981, using federal research funds.
At the beginning of 1963, there were sixteen stations in the network (fig. 1): the central station on the Berkeley campus now had four vaults (in Haviland Hall, the Main Library, the Earth Sciences Building, and an adit in Strawberry Canyon). The stations at Ferndale, the University of San Francisco, and Fresno were closed and new stations opened at other more suitable sites. The important Wilip-Galitzin seismographs, which had operated at Berkeley from 1930, were also shut down in 1965 because of redundancy with the WWSSN recordings (details can be found in Bolt and Miller, 1975). The Bosch-Omori instruments at Berkeley were removed for public display at the J. D. Randall, Jr., Museum, San Francisco, and at the Lawrence Hall of Science, Berkeley.
A major new research direction instituted at the Stations during the early part of this period was marked by the construction of a specialized field observatory on the San Andreas fault near Hollister. This station, built on land deeded to the University by Mr. and Mrs. Howard Harris and called the San Andreas Geophysical Observatory (SAGO), was designed as a multi-
purpose geophysical observatory that would measure basic aspects of crustal strain fields and near-field shaking associated with local earthquakes. It was inaugurated in 1968 after construction by the staff and graduate students, funded largely by private donations. SAGO continues operation at the present time in a reduced mode. It was perhaps before its time. In retrospect, before the research grant support of the Federal Earthquake Hazard Reduction Programs of the 1970s, the Seismographic Stations had neither the resources nor manpower to maintain such an ambitious and novel field observatory at the necessary high scientific level. Even today, there are still few such monitoring installations in the world. (In the 1980s a broadly similar concentration of field sensors was installed in the Parkfield area in response to an earthquake prediction. See "Prediction" below).
Another priority at the Stations was development of seismographs recording both period and amplitude over broader dynamic ranges than the WWSSN system. The first very-long-period seismographs (systems whose pendulum and galvonometer free periods are T0 = 45 s, Tg = 300 s) commenced operation at Berkeley in 1964, and continuous magnetic-tape analog recording also began in that year. This project culminated in 1987 with the development of a digital broadband system of stations including Berkeley, Mt. Hamilton, SAGO, Oroville, Whiskeytown, and a new permanent station (CMB) at Columbia College, Tuolumne County, in the Mother Lode country.
Seismological Contributions at Berkeley
The main contributions to knowledge of earthquakes by staff and students working at the Seismographic Stations may be grouped under five headings: continuous earthquake observations, teaching, research, public information, and consulting.
It it hard to overemphasize the value of maintaining continuity of earthquake recording. Many historically important seismological observatories around the world have, to the detriment of the science, succumbed to attack on the grounds of the slowness of short-term scientific return. In fact, it is not difficult to show that long-term observation of earthquakes is crucial for many key purposes. Earthquakes are not well-controlled experiments whose time, size, and place can be chosen. Mechanisms differ, wave trains through the complicated structure of the Earth's interior vary, and the vital statistical basis for seismological hazard assessment often accumulates slowly.
As mentioned earlier, this paper does not treat the gamut of seismological research work at the University of California at Berkeley but rather the much more limited aspects related to the existence of the Seismographic Stations. The former subject is much broader than the latter but, of course, the two overlap and interrelate. An early assessment is given by Byerly in a 1958
lecture in which he referred to "The cradle of seismology in the United States." Indeed, a great many seismologists have been trained and worked on earthquake problems at Berkeley in the last century. Most, but by no means all, were associated significantly with the Seismographic Stations. Others carried out their research almost entirely within the Department of Geology and Geophysics (under its various titles), the College of Engineering, the Department of Statistics, and elsewhere.
As part of the preparation for this paper, several seismological alumni who took part in graduate studies at the Seismographic Stations were asked to provide a list of the main scientific contributions of the Stations. All those canvassed emphasized the role of the Stations, its staff, and its students in teaching and public service. The facilities of the Stations have been long used for demonstrations of observatory practice and analysis to undergraduates in various geology and geophysics classes. Also, for many years, seismograms and other materials from the Stations have been incorporated in laboratory work for undergraduates and graduates studying earthquakes. Even when not using directly measurements made at the Stations, most students who have taken degrees in seismology at Berkeley have familiarized themselves with the earthquake observational program at the Stations and participated in the systematic and routine reading of seismograms, particularly from the WWSSN instruments at BKS. For this reason, Perry Byerly (1958) used the term "cradle of seismology" when referring to the Berkeley program. On the public service side, the Stations receive hundreds of visits from the public each year, particularly groups of schoolchildren. On request, staff at the Stations also frequently provide as a public service information on past records of earthquakes and current earthquake activity.
As part of its public involvement, the Stations' past two directors, assistant director, and senior staff have acted as consultants to a greater or lesser extent to many public and private projects involving earthquake hazard assessment. This consulting work has ranged from membership (Bolt) on the State Seismic Safety Commission, to advice to public utilities on seismic questions related to power-generating plants and dam safety, to overseas studies on ground-motion inputs for engineered design such as for the Jamuna Bridge project of the World Bank in Bangladesh and the High Aswan Dam in Egypt.
Seismicity
The distribution of past and present stations, operated as part of the University of California at Berkeley network for more than one year up to December, 1987, is shown in figure 1[*] . The network has evolved as oppor-
[*] A temporary near-field network of seismographs was operated in Bear Valley, along the San Andreas fault (see Section on "Strong Motion Seismology").
tunities and restraints changed over the years, but the original stations at Berkeley and Mount Hamilton have always been maintained. Based on the recordings at the Stations, the Bulletin of the Seismographic Stations has been produced each year since 1912 (for example, Uhrhammer et al., 1985) to tabulate recorded local earthquakes (above a magnitude threshold of about 2.5). It is an uninterrupted record of seismicity containing over 150,000 earthquakes and is the primary source for earthquake epicenter maps for northern California. It is used for earthquake risk assessments and statistical predictions of future earthquakes. For example, the Bulletins permit the calculation that the odds of an earthquake of magnitude 6 or greater in the central and northern part of the state are, on average, 1 in 5 per year. A map of epicenters from 1985 to 1986 above Richter magnitude 4 is shown in figure 3.
Measurements of the main seismic phases of all significant local, regional, and teleseismic earthquakes are distributed to appropriate scientific centers throughout the world. Each week, measured arrival times and amplitudes are sent to the National Earthquake Information Center (USGS) in Boulder, Colorado, and each month, a listing of the main phases from major earthquakes is published. Each six months, magnetic tapes are sent to the international center (the ISS up to 1960 and subsequently the ISC in Newbury, England). There are on file at the Stations over 300,000 paper seismograms and over 500 magnetic tapes containing earthquake recordings. The guiding philosophy has been to record continuously rather than only during intervals triggered by seismic events so that research workers can have access to complete ground motions. Nevertheless, with the shift to tape recordings, more and more continuous records have eventually been "dubbed," with significant events saved on library tapes (now compact disks).
Research at the Stations has concentrated on special studies of local earthquakes. This policy is based on an early recommendation of H. O. Wood that California seismographic networks should be used to study local earthquakes in detail. The great Report of the 1906 San Francisco earthquake by the State Earthquake Investigation Commission (Lawson, 1908) reproduces seismograms from stations of the local network, including records from Lick Observatory and Berkeley (fig. 2).
Many analyses of aftershock sequences within the northern California area have been made over the years. Perhaps the first detailed study in the United States was that of the Nevada sequence of 1932 by the late Prof. James T. Wilson, then a Ph.D. student of Perry Byerly's and that of Parkfield in 1934. The analysis of sequences was later extended by Prof. A. Udias and others working at the Stations.
Observatory requirements have led to an emphasis on improved ways to estimate the parameters of earthquakes. In 1963, one of the first computer-based programs to calculate local earthquake hypocenters by least-squares
Figure 3
Plot of epicenters of earthquakes (ML > 4.0) located in northern California (1935–1986)
by reduction of recordings at the UCB Seismographic Stations. (By 1935 the basic pre-
World War II UCB network was more or less complete (Louderback, 1942).)
adjustments was placed into routine use at Berkeley. The program, called LOCAL, became a basis for computer codes using more detailed procedures developed at the USGS and elsewhere. Similarly, the group-location method for joint location of earthquakes was developed at the Stations by Dr. J. Dewey for teleseisms and by staff for local earthquakes. In 1980, the Berkeley network became the first in the United States to publish routinely seismic moments (M0 ) of earthquakes estimated directly from measurements of Wood-Anderson seismograms.
As mentioned before, the first telemetry network of regional extent in the world began operating at Berkeley in 1961. At its maximum density, the network in the Coast Ranges consisted of nine stations with short-period Benioff seismographs all telemetered by commercial telephone lines to the central campus station. Recordings on 16-mm continuously processed film ("develocorders") and paper helical strips ("helicorders") of sixteen telemetry stations continue in 1989 to be read daily. The uniform recording and precise timing of this network soon demonstrated an order of magnitude increase in the precision of local hypocenter estimation. It was established that the depth of earthquakes in central California was shallower than had been thought—ranging mainly between 5 and 10 km, with the base of the seismogenic zone at about 15 km. This result corrected an assumption, based on an earlier inference from experience in Europe, that most earthquake foci occur at depths of about 15 km (near the "Conrad discontinuity"). In addition, the severe location bias from lateral crustal heterogeneity (up to 5–10 km) was demonstrated. Nevertheless, with appropriate adjustments it was shown that the hypocenters of earthquakes in the California Coast Ranges concentrated along main active faults such as the San Andreas, Hayward, and Calaveras. These results led to great improvements in the technique of mapping active faults, including submarine transform faults, using epicenter locations. (The association between surface faults and foci in southern California proved later to be somewhat less definite.)
Crustal Studies
Early work by Byerly and his students, using both local earthquakes and gratuitous explosions in the area, defined in a general way the structure of the central California crust. By 1963, the depth of the Mohorovicic[*] discontinuity under the Central Coast Ranges was determined to be about 22 km, a figure not much revised since. Later work concentrated on structural variations across the San Andreas fault (see McEvilly and Feng, 1983).
A major step in crustal tectonics was the discovery of seismological evidence for a root under the Sierra Nevada. A. C. Lawson, had predicted such a root on the basis of isostasy, and in 1938 Byerly reacted by comparing the arrival time of P waves at the Fresno station on the west side of the Sierra with the arrival time at the Tinemaha station (run by the California Institute of Technology) on the east side of the Sierra Nevada. Byerly found a delay of
several seconds at Tinemaha from earthquake sources in the northeast Pacific, thus indicating lower than normal seismic velocities under the range. Research on this subject has continued, using special field profiling and ray tracing.
Work has also used surface-wave observations. A major concept was introduced into seismology in 1953 by J. F. Evernden, who used Wood-Anderson instruments around the Bay area as an early seismic array. Cross-correlation enabled direct measurement of phase velocities of Rayleigh waves and hence the inference of crustal structure. Previously, single-station methods had been limited to comparisons of group velocity. Later work by Dr. T. Mikumo with surface waves involved the structure of the Sierra Nevada.
In the last decade, field investigations from the Seismographic Stations have used artificial sources. In 1974 a Vibroseis reflection survey was used for the first time, to study the structure of the San Andreas fault zone; measurements yielded very precise differences in travel times useful in calculating strain in the crust. These studies were aimed at detecting precursors to large earthquakes (McEvilly and Clymer, 1981).
Earthquake Mechanisms
The first inversion of first motions using teleseisms was carried out by Byerly in the period 1928–1938, based on ideas developed in Japan by H. Nakano for local earthquakes. The scheme involved the use of polarities of P-waves to define patterns of compressions and dilations arising from fault geometries of various kinds. After some resistance from other seismologists (such methods were not used, for example, at the Seismological Laboratory at the California Institute of Technology until 1952) they have become an essential part of the seismologist's tool kit.
By 1958 Byerly's P-wave methods had been extended by W. Stauder and others to S-wave polarizations. Use and extension of this inversion algorithm has continued at the Stations (see, for example, Dehlinger and Bolt, 1987). The other two tools of most importance to observational seismology are epicenter-location methods and magnitude estimation. The former was discussed in the previous section. The latter, developed largely at the California Institute of Technology by C. F. Richter, B. Gutenberg, H. Kanamori, and others, has not been the subject of much work at Berkeley, but the continuous estimation of magnitudes at the Stations using the network Wood-Anderson seismographs has been important in establishing a calibrated estimation basis.
With the introduction of three-component sets of long-period instruments at Berkeley in 1964, many records of waveforms of earthquakes and underground nuclear explosions accumulated. Various papers were published based on fits of theoretical seismic motions to these forms and on comparisons between the characteristics of earthquake and explosion sources
(McEvilly and Peppin, 1972). More recently, the application of pattern recognition theory is being tried, exploiting digital three-component recordings over a wide frequency band and interactive computer graphics displays.
After the 1966 Parkfield earthquake, the U.S. Geological Survey began to build up an experimental telemetry network of short-period vertical-component stations in California along the San Andreas fault system between Parkfield and Santa Rosa. Partly in response to the destructive 1971 San Fernando earthquake, this network was rapidly expanded to over 300 stations in northern California; extensive data on microearthquakes down to unit magnitude have now accumulated. This detailed information complements the monitoring of the larger earthquakes (M L > 3.0) by the Berkeley network. The multitude of such stations has also permitted more extensive use of fault-plane solutions of small local earthquakes to study the tectonics of California. Indeed, the first check of the plate tectonics paradigm in California was the validation of the San Andreas system as a transform fault using recordings from the Berkeley telemetry network (Bolt et al., 1968).
One of the unique contributions of the Seismographic Stations has been the study of fault creep (Tocher, 1960). Not only were quantitative slip measurements made over many years at the Cienega Winery near Hollister (fig. 4) but a long time series of displacements on the Hayward fault has been recorded with a differential slip meter installed in a water diversion tunnel under Memorial Stadium on the Berkeley campus. The latter consistently show a right-lateral slip rate of approximately 2 mm per year.
The introduction of broadband recording has also led to seminal publications on earthquake generation mechanisms. For example, one of the earliest studies of directivity due to the rupture of a fault was carried out on the 1966 Parkfield earthquake (Filson and McEvilly, 1967) using Love waves recorded at Berkeley by long-period seismographs.
Deeper Structure
From the beginning, data from the Stations have been used for the study of the structure of the deep Earth. Investigators have used Berkeley network seismograms directly or readings reported in the Bulletin of the Stations and the International Seismological Summary (ISS) and its successor, the International Seismological Centre (ISC) catalog.
One of the first major contributions was isolation of the "20° discontinuity" in P travel times, interpreted as a first-order discontinuity in the Earth at a depth of about 400 km. This result arose from Byerly's analysis of travel times from the large Montana earthquake in 1925. The 1960s saw a flourishing of work on the fine structure of the Earth's interior. Mention can be made of the location and definition of such phases as PdP (P -waves reflected from the top of structure in the upper mantle); P diff (long-period P-waves diffracted along the boundary of the Earth's core); SH diff , PnKP
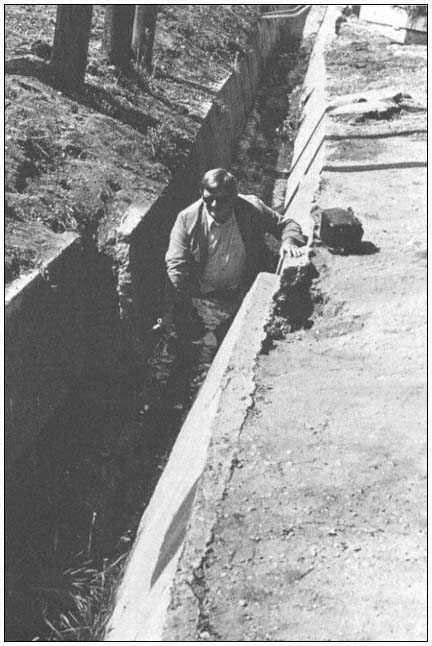
Figure 4
Photograph of D. Tocher at the offset culvert at the Cienega Winery
(about 1970) near Hollister, where it is intersected by the San Andreas
fault. The first systematic measurements of fault creep were set up here
by Tocher while at the Seismographic Stations.
Figure 5
Portions of seismograms recorded by the short-period vertical-component
seismograph at the Jamestown station of the UCB network (see fig. 1).
The wave packet A is the core phase P4KP , and B is P7KP.
(multiple reflections within the liquid core of the Earth); ṔṔ and ṔdṔ (core waves reflected near the antipodes); and PKiKP. Inferences and theoretical work have been stimulated substantially by exotic observations of such types, many of which have now been reproduced in textbooks (see Bolt, 1982).
Consider one illustration of the care and completeness with which phases on seismograms have been read and cataloged over the years by staff and students. The phase P7KP, which is reflected seven times within the core at the mantle boundary, was identified (fig. 5) on seismograms from the Jamestown station in 1970. Two years later Dr. G. Buchbinder in Canada independently found that the even rarer phase P13KP had been listed among the unrelated phases in the Bulletin of the Berkeley Stations.
Other pioneer work on Earth structure involved use of the Berkeley telemetry regional network in the California Coast Ranges in the 1960s. Azimuthal anomalies in travel times were associated (Nuttli and Bolt, 1966) with undulations of the low-velocity zone in the lithosphere. It later became standard practice to incorporate such anomalies in all constructions of global seismic travel times.
The work at the Stations has been influential in other ways in the development of global and regional travel-time tables. For example, the 1968-PKP times of Bolt are still used as a standard by the USGS (NEIC) for the preliminary determination of epicenters, and the statistical work of H. Freedman helped lay a probability basis for the development of the 1968 P travel times.
A major effort has also been carried out on measurement and interpretation of free oscillations of the Earth (Bolt and Brillinger, 1979). Work began with measurements by Dr. A. Nowroozi of ground amplitudes and frequency spectra of spheroidal and torsional modes after the 1964 Alaskan earthquake using long-period pendulums of the Berkeley station. This was followed up by theoretical studies using finite-element models and complex demodulation methods. The growth of the regional broadband system provided comparisons of spectral estimates from stations a few hundred kilometers apart (Hansen, 1982). The Hansen study yielded some of the best-resolved estimates of the Q attenuation factor in the Earth.
Seismometry
As mentioned above, the early history of the Stations saw the development of the first cooperating seismographic network in the United States (Louderback, 1942). In later years, new cooperative arrangements were established with many centers and organizations. The California Department of Water Resources, motivated by a need to monitor the seismic safety of dams and aqueducts, assisted with the stations JAS, ORV, and now with CMB, at Columbia Community College (see fig. 1). The National Park Service assisted within Lassen National Park with MIN and MLC and at Whiskeytown (WDC). The Bureau of Reclamation had established the Shasta Dam (SH) station in 1942 with reservoir-induced seismicity in mind; its operation was transferred to Berkeley in 1952. The most sustained federal support has been first from the USCGS and since 1975 from the USGS (especially with the WWSSN station at BKS and the DWWSSN station at JAS and CMB).
The theory of the seismograph has also been developed over the years at the Stations by Byerly, J. Eaton, P. Rodgers, and others. An often-referenced paper on the history of seismometry to 1900 was published by Dewey and Byerly (1969).
At the San Andreas Geophysical Observatory (SAGO), described in a previous section, many new types of sensors were designed and deployed. In addition to seismographs and accelerometers, equipment included telluric current meters, strain meters, and microbarographs. The first special microbarograph had been designed by the engineering staff and installed at BKS in 1963. Its successes include recordings of atmospheric oscillations from the 1964 Great Alaskan earthquake and the 1980 eruption of Mount St. Helens.
A major design effort (McEvilly and Majer, 1982) at the Stations was an automated seismic processor (ASP) for microearthquakes, based on microchip technology. The prototype portable instrument was a sixteen-channel system. This development, later the basis for larger commercial instruments, won an award as one of the top technological innovations of 1984.
A major development in the last several years had been the design of a
Figure 6
Seismic waves from an underground nuclear explosion at the Nevada Test Site recorded
by the broadband digital seismographs at Mt. Hamilton on August 13, 1987.
Figure 7
Seismic ground displacements recorded by two of the new (1987) generation of regional seismographic
stations. The stations have broadband (10 mHz < f < 10 Hz) digital recording based on low-cost PC
computers and use Streckeisen seismometers. The earthquake was centered at Whittier Narrows,
Southern California, on October 1, 1987, with M = 6.0 (BKS), M = 1.3 × 1025 dyne-cm (BKS).
Underground Explosion Discrimination
A number of graduate students who studied at the Seismographic Stations have become leading figures in research on discrimination between natural earthquakes and underground nuclear explosions. Specially sustained work on this subject (carried out away from the Stations) is due to C. Romney and J. F. Evernden. One of the major contributions of the Stations has been the continued seismographic recording of underground nuclear explosions fired at the Nevada Test Site and elsewhere. Analog tape recordings of these events began at Berkeley in 1964 and have continued in analog and digital form to the present time. This library is one of the most extensive sets of intermediate- and broadband recordings of such explosions in the world (see fig. 6).
From early in the VELA UNIFORM program (see Bolt, 1976), a series of investigations on related problems has been carried out at the Stations. The program was begun by Tocher and Byerly (1960–1963), continued by Bolt (1963–1965), and subsequently pursued as a major research enterprise by McEvilly and Johnson. Many publications have resulted from the work; a recent account of some of the main results associated with the latter two seismologists and research assistants is given in Johnson and McEvilly (1985).
In summary, these results include the validation of short period Pg discriminants, using recordings at the Jamestown station, and tests of the effectiveness of Ms /mb discriminants for ML < 4.0, made possible through recordings of local earthquakes by the broadband Berkeley system. The same data base has allowed various types of modeling of small earthquakes. An extensive set of observations in the near field of small to moderate earthquakes was made in the 1970s at Stone Canyon and Bear Valley, south of SAGO, and later by operating portable seismographs near the Nevada Test Site (see also "Strong Motion Seismology" below).
Prediction
Earthquake prediction in time and place has been approached with caution at the Seismographic Stations. It was felt that early claims of imminent and almost universal success were extravagant, given the great geological complexities involved.[*] Because, however, prediction in a testable form is the mark of a quantitative science, the subject has by no means been neglected.
Two aspects have been stressed: the uncertainties in tempo-spatial forecasts, and the estimation of seismic hazard. The standardized operation of
[*] See, for example, testimony of T. V. McEvilly at Field Hearings on S.B. 1473 and S.B. 1474, 27 April 1973, Senate Commerce Committee, Subcommittee on Oceans and Atmosphere, San Francisco, California.
both the Berkeley telemetry short-period network and the broadband systems was recognized as allowing the estimation of practical sensitivity levels. Such threshold levels are essential if certain hypothesized earthquake precursors are to be credible. One of the first results was deflation of the claims of precursory travel-time anomalies. Studies using quarry blasts and Nevada Test Site explosions as known sources of seismic waves showed that any variations are well within the scatter of the measurement errors common at the time. No systematic effect could be detected with confidence by routine methods.
One prediction that has gained recent notoriety is based on a demonstration of past periodicity of moderate characteristic earthquakes near the town of Parkfield (Bakun and McEvilly, 1984) in earthquake recordings by the Berkeley network over its hundred-year history. Parkfield lies near the San Andreas fault in a rural region remote from populated centers. The San Andreas fault trace is clearly visible in bedrock just north of Parkfield. The seismographic record established that moderate-sized earthquakes (ML 5.5 to 6.0) occurred near Parkfield in 1901, 1922, 1934, and 1966. (See the 1922 Parkfield seismogram written at Berkeley in fig. 8.) There was also evidence from felt reports of similar earthquakes in 1857 and 1881. In addition, available seismograms permitted quantitative estimates of size and location for the earthquakes of March 10, 1922, June 8, 1934, and June 28, 1966. These dates predict an almost constant recurrence time of about twenty-two years (with the exception of the 1934 fault slip). Repetition of this cyclic pattern makes the next Parkfield earthquakes expected about 1988, with appropriate allowance for statistical variation. Work on characteristic earthquakes, postulated to be typical of various parts of active faults, can be done only in regions where calibrated seismograms over long periods are available.
On a different aspect of earthquake prediction, estimations of hazard recurrence statistics in northern California have been developed at the Stations over the years by researchers C. Lomnitz, R. A. Uhrhammer, L. Knopoff, and many others, using the basic seismicity information published in Station Bulletins.
Strong Motion Seismology
Finally, it should be mentioned that earthquake prediction relates not only to time, size, and place, but also to the forecasting of the strong ground motions that constitute an earthquake. Considerable work has been done by W. D. Smith, L. Drake, and others on the development of finite-element programs and algorithms for seismic wave propagation in realistic geologic structures such as continental boundaries, mountain roots, and alluvial valleys.
The testing of such numerical predictions of seismic shaking at the surface of complex structures depends on appropriate recordings of strong ground
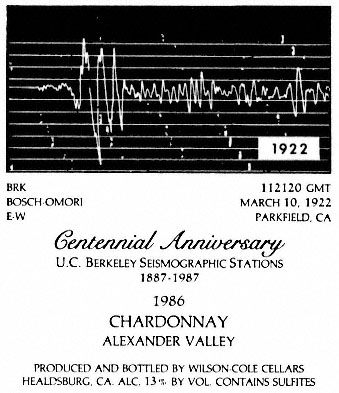
Figure 8
The east-west component of ground motion at the Berkeley
station recorded by the Bosch-Omori seismograph on March
10, 1922, from an earthquake source near Parkfield, California.
The recording is part of the basis of the "Parkfield Prediction
Experiment" (1988 ± 5 years). Reproduced on a wine label
printed for the Centennial Symposium, May 28–30, 1987.
relatively inexpensive digital broadband network (BDBN) for the UCB network. The design philosophy was to use off-the-shelf items and PC computers of the XT/AT type. The operation at the Mt. Hamilton station (MHC) commenced in May 1987 and at Berkeley in June 1987. Records from this new system (ultimately to consist of ten digitally recording stations in central California) are shown in figures 6 and 7.
A recent innovation in microearthquake monitoring, achieved jointly with the Earth Sciences Division, Lawrence Berkeley Laboratory, has been the installation and operation of an array at Parkfield with digital telemetry recording 500 samples per second for each component. The ten stations, each with three components, are capable of being triggered by earthquakes as well as recording waves from controlled artificial sources.
motions. To this end, a program of instrumentation with strong motion accelerographs was commenced in 1967 and later strengthened with the appointment of W. K. Cloud, formerly head of the USCGS Field Investigation Office, as Research Seismologist at the Stations. In 1968, a cased bore-hole 500 feet deep was drilled in the gouge zone of the Hayward fault on the Berkeley campus for various instrumention. In 1976, downhole strong-motion accelerometers were installed in a hole bored in bay mud at the University's Richmond Field Station. This facility has yielded important new information on the depth variation of seismic ground motion (Johnson and Silva, 1981).
Background moderate seismicity along the Bear Valley segment of the San Andreas fault provided valuable measurements of near-field ground motions in an intensive study using a special network of strong-motion seismographs. In this "Near Field Project," funded under VELA UNIFORM, nine three-component broadband seismographs were operational from 1973 to early 1977 and resulted in improved methods for resolving hypocenters and fault mechanisms (see Johnson and McEvilly, 1985).
In 1979 a digital accelerometer system for a dense strong-motion array was designed and tested by the staff at the Seismographic Stations. The array, called the Strong Motion Array Taiwan-One (SMART 1), was installed in northeast Taiwan, which is currently much more seismically active than California. The project has been carried out in close cooperation with scientists at the Institute of Earth Sciences of the National Research Council in Taiwan. The results have been gratifying, with a substantial number (over fifty) of earthquakes triggering the array of thirty-seven digital instruments in seven years. Numerous research papers of both seismological interest and engineering applicability have been published to date (see Loh et al., 1982), and work on this important array is continuing.
Strong-motion field seismographs have also been used in the context of seismic source discrimination in an extended experimental program of near-source recordings at the Nevada Test Site, begun in 1969. Concomitant wave-propagation and moment-tensor modeling have resulted, and the work continues (Stump and Johnson, 1984).
Conclusions
This history of the development of the first seismographic observatories in the United States commenced by discussing "the Age of Astronomers." By 1970, seismological observational work had greatly expanded and become more diversified. "The Age of Prediction" began in response to major programs of research on earthquake forecasting in the United States and many other earthquake-prone countries, notably Japan, China, and the Soviet Union. This new research focus, as well as growing public concern about seismic hazards, led to increased federal and state research funds and the
establishment of many complementary networks of seismographs in North America. In California, as described earlier, the most notable network, consisting of telemetered short-period instruments to record microearthquakes, was developed and operated by the USGS. Other special seismographic networks in the region were operated by the Department of Water Resources near large water-storage facilities, by the Lawrence Livermore National Laboratory in the vicinity of Livermore Valley, and by the Pacific Gas and Electric Company, in both the northern part of the state around Humboldt Bay and, since 1986, the vicinity of the Diablo Canyon nuclear electric generating plant.
The addition of other modern special-purpose seismographic networks in central and northern California requires reevaluation of the earlier justifications for the continuation of the Berkeley network. My own view is that the University of California should not engage in merely routine recording; justification must depend on nonredundant observations (fig. 7), related fundamental research, support for teaching of undergraduates and graduates, and essential public education and information.
Future observational developments at the Stations are likely to be influenced by newly announced plans for a national network of broadband seismographic observatories under the auspices of the USGS. The scheme includes real-time transmission of digital data from each network station by satellite links to the regional central Stations (for example, Berkeley) and a National Earthquake Center. The provision at permanent observatories for continuity of earthquake surveillance, comprehensive seismic-wave recording, and cataloging of both small and great earthquakes at all distances remains a very worthwhile scientific enterprise. It is fundamental both to seismic-hazard evaluation and to a deeper understanding of geophysical processes and Earth properties.
The final question is: What have been the major scientific contributions of the Berkeley Stations? The answer must start with the continuous uniform recording of earthquakes from their beginning, with measurements of local, regional, and distant earthquakes. Such integration is still rare at other earthquake observatories around the world. The resulting precise measurements of earthquakes have been incorporated into innumerable studies of seismicity and Earth structure. The early goal of advancing seismology through an observational program has been achieved. The Stations have been consistently supported by the University of California from state funds over the years, although the level of fiscal support has fluctuated, particularly when state budgetary restrictions have affected all Organized Research Units. The Stations have provided key information in the international quest for adequate means to verify a nuclear weapons test-ban treaty. Many productive U.S. and foreign seismologists have received their observational training and insights as participants in research programs at the Stations.
Overall, both the seismological profession and the general community can be grateful to the University of California for a century of continuous commitment to earthquake studies.
Acknowledgments
I am most grateful to numerous colleagues and seismological alumni of the Seismographic Stations for comments and insights on the historical record. Especially, I benefited from many hours of conversation and philosophizing on earthquake studies with the late Perry Byerly, who became not only a mentor but a close friend. A draft of this paper was much improved by the generous scrutiny of W. Bakun, J. Eaton, J. Filson, T. V. McEvilly, W. C. Marion, M. Niazi, G. Oakeshott, W. Stauder, and R. A. Uhrhammer, although my emphases and judgments do not always coincide with their views.
It should be made clear that cases quoted in the text represent only a small sample of the published research performed at the Seismographic Stations by associated faculty, visiting scholars, and graduate students over the last 100 years. The history is given, of course, from my own perspective and emphasizes observatory-related work. Details on publications can be found in the Annual Reports of the Organized Research Unit, on file at the Stations. More technical material is contained in the introductory section of the Bulletins of the Seismographic Stations (1910–1987). Not all studies mentioned in the text are specifically referred to in the list of references. Many supporting publications can be found under the mentioned author's name in the Bulletin of the Seismological Society of America.
References
Bakun, W. H., and T. V. McEvilly (1984). Recurrence models and Parkfield, California, earthquakes. Geophys. Res., 89: 3051–3058.
Bolt, B. A. (1976). Nuclear Explosions and Earthquakes. W. H. Freeman, New York.
———. (1979). Perry Byerly—A memorial. Bull. Seism. Soc. Am. 69: 928–945.
———. (1982). Inside the Earth. W. H. Freeman, New York.
———. (1985). The development of earthquake seismology in the western United States. In Centennial Special Volume 1, Geol. Soc. Am., 471–480.
Bolt, B. A., and D. R. Brillinger (1979). Estimation of uncertainties in eigenspectral estimates from decaying geophysical time series. Geophys. J. R. Astr. Soc., 59: 593–603.
Bolt, B. A., T. V. McEvilly, and C. Lomnitz (1968). Seismological evidence on the tectonics of central and northern California and the Mendocino escarpment. Bull. Seism. Soc. Am., 58: 1725–1767.
Bolt, B. A., and Roy D. Miller (1975). Catalog of Earthquakes in Northern California and Adjoining Areas: 1 January 1910–31 December 1972. Seismographic Stations, University of California, Berkeley, 1–567.
Bolt, B. A., R. A. Uhrhammer, and J. E. Friday (1988). A PC-based broadband digital seismograph network. Geophys. J. R. Astr. Soc., 93: 565–573.
Bullen, K. E., and B. A. Bolt (1985). Introduction to the Theory of Seismology. Cambridge University Press, New York.
Byerly, P. (1958). The beginnings of seismology in America. Symposium on Physical and Earth Sciences. University of California, Berkeley.
Dehlinger, P., and B. A. Bolt (1987). Earthquakes and associated tectonics in a part of coastal central California. Bull. Seism. Soc. Am., 77: 2056–2073.
Dewey, J. W., and P. Byerly (1969). The early history of seismometry (to 1900). Bull. Seism. Soc. Am. 59: 183–227.
Filson, J., and T. V. McEvilly (1967). Love wave spectra and the mechanism of the 1966 Parkfield sequence. Bull. Seism. Soc. Am., 57: 1245–1259.
Hansen, R. A. (1982). Simultaneous estimation of terrestrial eigenvibrations. Geophys. J. R. Astr. Soc., 70: 155–172.
Johnson, L. R., and T. V. McEvilly (1985). Regional studies with broadband data. In The VELA Program, a Twenty-five Year Review of Basic Research. Defense Advanced Research Projects Agency, Rosslyn, Virginia, 146–182.
Johnson, L. R., and W. Silva (1981). The effects of unconsolidated sediments upon the ground motion during local earthquakes. Bull. Seism. Soc. Am., 71: 127–142.
Lawson, A. C. (1908). The California Earthquake of April 18, 1906: Report of the State Earthquake Investigation Commission. Carnegie Institution, Washington, D.C.
Loh, C. H., J. Penzien, and Y. B. Tsai (1982). Engineering analysis of SMART 1 array accelerograms. EESD, 10: 575–591.
Louderback, G. D. (1942). History of the University of California Seismographic Stations and related activities. Bull. Seism. Soc. Am., 32: 205–229.
McEvilly, T. V. (1980). Memorial to Don Tocher. Bull. Seism. Soc. Am., 70: 400–402.
McEvilly, T. V., and R. Clymer (1981). Travel-time monitoring with Vibroseis. Bull. Seism. Soc. Am., 71: 1903–1927.
McEvilly, T. V., and R. Feng (1983). Interpretation of seismic reflection profiling data for the structure of the San Andreas fault zone. Bull. Seism. Soc. Am., 73: 1701–1720.
McEvilly, T. V., and E. L. Majer (1982). ASP: An automated seismic processor for microearthquake networks. Bull. Seism. Soc. Am., 72: 303–325.
McEvilly, T. V., and W. Peppin (1972). Source characteristics of earthquakes, explosions, and afterevents. Geophys. J. R. Astr. Soc., 31: 67–82.
Nuttli, O., and B. A. Bolt (1966). P wave residuals as a function of azimuth. J. Geophys. Res., 71: 5977–5985.
Rodgers, P. (1968). The response of the horizontal pendulum seismometer to Rayleigh and Love waves, tilt, and the free oscillation of the Earth. Bull. Seism. Soc. Am., 58: 1384–1406.
Stump, B. W., and L. R. Johnson (1984). Near-field source characterization of contained nuclear explosions in tuff. Bull. Seism. Soc. Am., 74: 1–26.
Tanimoto, T., and B. A. Bolt (1983). Coupling of torsional modes in the Earth. Geophys. J. R. Astr. Soc., 74: 83–95.
Tocher, D. (1960). Creep on the San Andreas fault. Bull. Seism. Soc. Am., 50: 396–403.
Uhrhammer, R. A., A. J. Lomax, and R. McKenzie (1985). Bulletin of the Seismographic Stations, University of California, Berkeley, 54: 1–88.