Riparian Vegetation
Background Observations
The physical and biological makeup of any vegetation may be thought of in several ways. "Components" of morphological structure, floristics, spatial patterning, and intravegetation or "plant" diversity are the design determinants of any vegetation, whether our interest is in its value as timber, wildlife habitat, biomass, livestock forage, nature preserve, or any of a host of other attributes.
These site-specific components are in turn dependent upon other "factors" for their presence and expression. Climate, parent soil material, topography, accessibility of the site to potential inhabitants, length of time the site has
been habitable, ecology of the plant species inhabitants (e.g., community interactions), external influences (primarily human-use impacts), and other factors all influence the floristics, structure, and spatial patterns of any plant association or community. Both Major (1951) and Mueller-Dombois and Ellenberg (1974) have developed vegetation-formation functions to describe this complex of factors. Major provides the following function for plant community.

|
Mueller-Dombois and Ellenberg offered a plant community formation function which is similar but has somewhat different emphases.

|
However, many vegetations no longer have the "luxury" of untrammeled formation functions. Riparian vegetation especially has been subjected to violent human-use pressures which in many places all but obscure those factors responsible for their initial formation. Long-term livestock grazing can convert a forest to a grassland or a desert, as can damming and diversion of the water supply. Conversion to cultivated agriculture can efface entire vegetations.
Definition of Terms
To understand how structure, floristics, and spatial patterns relate to plant diversity and to vegetation formation factors, it is necessary first to define terms as used here. "Vegetation" is the plant life or total plant cover of an area. "Morphological structure" is the internal physical design of the vegetation—the brush, trunks, branches, canopies, and other vegetative materials that physically form its substance. "Floristics" is the biological component contributed by the different species of plants (the flora) making up that vegetation. "Spatial pattern" is the manner in which plants are aggregated. "Plant associations," where species are aggregated nonrandomly due to environmental factors, is one type of spatial pattern. "Plant diversity" is the internal heterogeneity of a vegetation created by structural and floristic nonuniformities in the plants which comprise it.
The term "plant diversity" was used deliberately to distinguish it from "species diversity" (a function of the number of species and their population sizes) and "vegetation diversity" (differences between vegetations). Plant diversity includes species richness, population density, population demography, life form, spatial pattern, association (aggregation), and community (interacting association) components. For the present study the term was enlarged further to include certain human-use perturbations (e.g., roads) and absence of plants (e.g., bareground) as components because the frame of reference was the entire riparian system.
Thus—using one's own front lawn as an example—the vegetation is a simple one: a) composed of a single species of bermuda grass (its floristics); b) growing as a thin, dense, unbroken mat on the ground (its structure); and c) because of its uniformity and simplicity, having low plant diversity. In contrast, a gallery riparian forest may have: a) a luxuriant internal morphological structure, including up to four structural layers (groundcover, shrubcover, understory, canopy); b) be comprised of 50 or more species (i.e., have complex floristics); and c) have the entire array of species mixed heterogeneously, with gaps in the shrubcover and openings in the canopy so as to have a very high plant diversity.
Riparian Vegetations and the California Riparian Study Program
No two vegetations have the same structure, floristics, and plant diversity because each has a unique history and grows on a unique substrate (i.e., each has a unique formation function, in Major, and Mueller-Dombois and Ellenberg terminologies). Riparian vegetations, for example, are subject to being torn up and rearranged by floods. Each riparian system has a unique set of hydrologic conditions determining the amount and timing of the water it receives (hydroperiod), imposing site-specific conditions on presence/absence and growth rate of the various species comprising the vegetation. And each vegetation is growing on a substrate, whether a rocky streamside or an alluvial floodplain, that is in itself unique. Each, in addition, has an individual history of human-use impact. Some have been grazed by livestock, which alters the rates and patterns of plant reproduction and regrowth. Some have been selectively logged for timber or fuelwood, grossly changing both structure and floristics. Others may have at some time in the past been cleared for cultivation agriculture or burned and are at one stage or another of regrowth.
The study of these three major determinants of any vegetation—structure, floristics, and plant diversity—can thus tell us a great deal about the condition and condition trends of a vegetation (one might consider this the "health" of the vegetation) and provide useful insights into its human-use values and the best means of productive management.
Groundcover
"Groundcover" may be thought of as that layer of vegetation which actually covers the ground, for example grass, forbs (herbs other than grasses), leafy litter, etc. It is distinguished from "shrubs," the next higher layer, by the latter's having woody stems which hold the vegetation above the ground surface. In the present study, we have included "bare ground" and "road" as groundcover categories for practical reasons. Table 1 lists the principal groundcover-types occurring in the 51 ground-study sites for the entire Central Valley.
The data presented in table 1 are instructive in several ways. First, the major groundcover-types are indicated. Together with their frequencies of occurrence, they provide a quantitative picture of the nature of Central Valley riparian system groundcover-types. Second, the large ranges and standard deviations indicate that even though a groundcover-type may occur on several or many sites, the amount present varies widely between sites. Third, the large, highly varying coefficients of variation suggest that the factors responsible for the present groundcover-type patterns at any site are independent, that is each site probably has a unique vegetational history. This pattern of site individuality will be seen throughout, reinforcing the general observation that each riparian system is indeed unique, owing to the many independent variables discussed above, which create and modify them.
To give some idea of how these variables relate to any given riparian system, several sites are presented for comparative purposes. These are Caswell State Park (site no. 12, fig. 3), Kaweah River (site no. 24), Cantua Creek (site no. 16, fig. 4), and San Joaquin River at Frewert Road (site no. 4). Caswell State Park is a relatively intact, bottomland floodplain ripar-
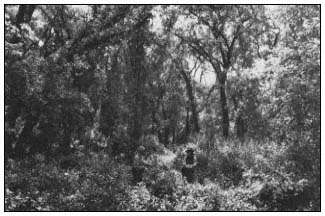
Figure 3.
Floodplain riparian system at Caswell State Park.
This area has been protected from disturbance
for several decades. (Photograph by R.E. Warner.)
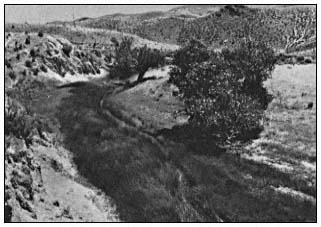
Figure 4.
Cantua Creek, a small perennial stream system in the Coast
Ranges. Note the heavy growth of sedges and the scattered
mature cottonwoods. (Photograph by R.E. Warner.)
| ||||||||||||||||||||||||||||||||||||||||||||||||||||||||||||||||||||||||||||||||||||
ian system on the lower Stanislaus River, San Joaquin County; Kaweah River is a well-wooded, formerly grazed Sierra foothill stream near the town of Three Rivers, Tulare County; Cantua Creek is a heavily grazed, secondarily simplified system in the Coast Range foothills west of Fresno, Fresno County; and the San Joaquin River site is a vegetated levee on the floodplain near Stockton. Table 2 summarizes groundcover data for the four sites in terms of percent occurrence and mean height in decimeters, by groundcover-type.
Each site, as demonstrated here, had a unique set of groundcover characteristics reflecting its location, geophysical and hydrologic circumstances, land-use history, and present land-use patterns. Note, for example, the great difference in grass groundcover between Caswell (21.5%) and Cantua (70.6%) (table 2). Mean percent grass groundcover for all Central Valley sites combined was 41%; thus, Caswell was demonstrably below (19.5%) and Cantua well above (29.6%) the valley-wide average. Similarly, note the great disparity in forbs (non-grass herbs), where San Joaquin (25.0%) has over 16 times as many as Cantua (1.5%). The mean value for all Central Valley sites was 14%. Thus San Joaquin was well above the average value for forbs while Cantua was well below average. The high grass/low forb groundcover scores for Cantua reflect the long history of open-range grazing that particular riparian system has experienced. It also is linked to the reduced amount of tree canopy at that site, similarly the result of long-term open-range grazing. These figures can change very markedly over time for any site, depending upon overall land-use practices, and can be used as quantitative elements to monitor the systems, if desired. Information on canopy structure and floristics is presented below to further illustrate the high degree of intersite diversity.
Groundcover Floristics
Conspicuously absent from this portion of the inventory are data on the plant species comprising the groundcover. The decision was made during project design to preclude collecting locational and floristics data on the many groundcover species because of the limited time available both for developing the inventory procedures and for acquiring field data. Grasses, forbs, herbs, mosses, ferns, lichens, and other groundcover plant species are important components of riparian system structure and plant diversity, and ideally should be included in riparian inventory and monitoring programs. They present special problems of location and taxonomy because of the intense seasonality of growth and flowering. Where time and resources permit, their inclusion into riparian inventory design is recommended.
Shrubcover, Understory, and Canopy
Each of these vegetation strata are potential structural components of riparian vegetations. In this study, plants were considered "shrubs" if they had woody stems supporting leafy
| |||||||||||||||||||||||||||||||||||||||||||||||||||||||||||||||||||||||||||||||||||||||||||||||||||||||||||||||||||||||||||||||||||||||||||||||||||||||||||||||||||||||||||
vegetation above ground level, but were no taller than 6 m. "Canopy" was the leafy vegetation produced by trees, and "understory" was that (rare, as it turned out) vegetation layer below and in the shade of an over-arching canopy, residing between it and the underlying shrubcover stratum. Normally, each vegetation stratum should be treated individually, as each contributes separately to the morphological structure, floristics, and spatial patterning of a vegetation. For reasons of space in this paper, these three vegetative components are not analyzed separately. Table 3 summarizes, by plant species and relative frequency of occurrence, the patterns of shrubcover, understory, and canopy for all 51 Central Valley sites studied on the ground.
A total of 50 plant species was recorded for the entire Central Valley. This does not, of course, mean that this is the total number of riparian species in the Central Valley, as the total sample size and sampling procedures did not permit identification of rarer species. However, the table clearly demonstrates the relative frequency and abundance of those species which are of major structural and ecological significance for riparian systems within the study area. Some are detailed below.
| ||||||||||||||||||||||||||||||||||||||||||||||||||||||||||||||||||||||||||||||||||||||||||||||||||||||||||||||||||||||||||||||||||||||||||||||||||||||||||||||||||||||||||||||||||||||||||||||||||||||||||||||||||||||||||||||||||||||||||||||||||||||||||||||||||||||||||||||||||||||||||||||||
| ||||||||||||||||||||||||||||||||||||||||||||||||||||||||||||||||||||||||||||||||||||||||||||||||||||||||||||||||||||||||||||||||||||||||||||||||||||||||||||||||||||||||||||||||||||||||||||||||||||||||||||||||||||||||||||||||||||||||||||||||||||||||||||||||||||||||||||||||||||||||||||||||||||||||||||||||
Major Species
Shrubcover
As indicated in table 3, willow, poison oak, box elder, oak, elderberry, and coyote bush were the principal shrubcover plants, although at least 22 shrubcover species were identified.
Understory
Wild grape, box elder, and willow were the main constituents of understory, which was overall surprisingly scarce. For those sites where it did occur, it averaged only 2.9% occurrence, calling into question its ecological role (and indeed, its structural reality) in most Central Valley riparian systems.
Canopy
Again referring to table 3, various willow species (35, 36.9%), Fremont cottonwood (28, 31.2%), valley oak (20, 21.2%), Oregon ash (18, 7.7%), black walnut (13, 15.2%), and white alder (10, 10.6%) constitute the dominant riparian canopy species. The transect procedure scored as present at a transect point any canopy species which was either on or overhanging the transect point. Thus, for example, a valley oak whose trunk was 4 m. from the transect point was counted if some portion of its canopy was directly above the transect point. These figures can be treated as rough approximations of percent canopy cover by the different tree species.
There is a direct (though not linear) relationship between stem diameter and canopy size of most trees. Stem diameter data gathered from the 6-m. wide belt transects can thus be used to compute percent canopy cover by species once the stem:canopy diameter function has been determined. It is not reported here but mentioned to call attention to yet another analysis available with this methodology.
Reproduction and Size-Class Patterns
Stem diameter (also called diameter-at-breast-height or DBH) data obtained by the 6-m. wide belt transects for the most frequently encountered riparian tree species were aggregated into 50 mm. size-classes. Figures 5 and 6 depict the resulting DBH size-frequency curves for six Central Valley riparian tree species. Figure 7, the DBH size-frequency curve for the giant sequoia (Sequoiagigantea ) of the Sierra Nevada, is provided for comparative purposes. This population has been protected for many years from severe human-use impacts such as logging and grazing.
Figure 5 clearly shows the DBH size-frequency pattern differences between Oregon ash, on the one hand, and Fremont cottonwood and California sycamore on the other. These latter two species are clearly experiencing long-term perturbations to reproduction. Size(age)-classes smaller than about 40 cm. (16.3 in.) DBH are progressively less well represented. The decrement in the two smallest size-classes of Oregon ash is not yet understood. It may be real or may be an artifact of inadequate field procedures, where the smallest stems were undersampled.
Figure 5.
DBH size-class curves (three-point moving means) for three species
of Central Valley riparian trees, based on data from 51 sites.
Figure 6, DBH size-frequency curves for Hind's walnut, willow (species), and valley oak, again demonstrate a severe perturbation or disruption in the reproduction of valley oak. The Central Valley population of this species is clearly not maintaining itself. If one overlays the valley oak, Fremont cottonwood, and California sycamore DBH size-frequency curves, a strikingly similar curve shape will be noted. While it is not possible to deduce from these data what is causing the serious declines of these three species; it does appear that their patterns of decline are similar.
These size-frequency data also corroborate a similar inference which can be drawn from table 3 (discussion above), where these species were present in very low numbers as seedlings and saplings in the shrubcover and understory components of the vegetation.
The lack of continued recruitment into the riparian vegetation of these previously important canopy species indicates that: a) over time, as existing adult trees age and die (fig. 8), the systems are experiencing large structural and floristic shifts; b) the ecological values of the vegetations (e.g., their ability to support native riparian-dependent birds and other wildlife) are being progressively impaired; and c) suppression of riparian tree reproduction is a widespread phenomenon throughout the Central Valley.
Field studies have clearly demonstrated that open-range grazing of livestock and the lack of fencing protection for riparian systems within fenced pastures both result in selective removal of seedlings and saplings of broad-leaf deciduous riparian vegetation (fig. 9). Dams and water diversions are known to produce significant downstream changes in flow regimes, in the levels
Figure 6.
DBH size-frequency curves (three-point moving means) for three
species of Central Valley riparian trees, based on data from 51 sites.
Figure 7.
DBH size-frequency curve for the giant
sequoia (Sequoia gigantea ) in the Sierra
Nevada. (From Harvey et al . 1980.)
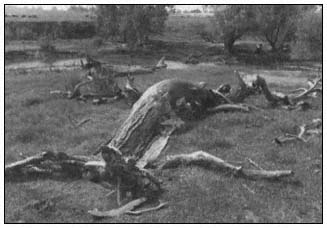
Figure 8.
Senescent cottonwood/willow riparian woodland on Dry Creek,
near Academy, Fresno County. Note lack of reproduction.
of winter floodwaters, and in dry season flow rates (and riparian zone soil moisture) and thus to impact native vegetation reproduction. Cottonwoods and willows, for example, release their seeds in the spring during spring runoff. Both species germinate best in recently deposited, fine, moist silts, a trait of obvious adaptive value for riparian species, but one at risk if flow regimes are modified.
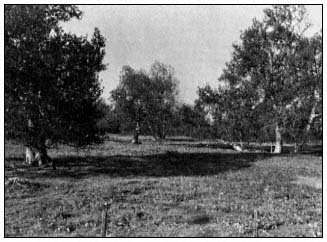
Figure 9.
Floodplain sycamore woodland by Orestimba
Creek subjected to long-term fenced livestock
grazing. Note complete absence of sycamore
regeneration and lack of plant diversity.
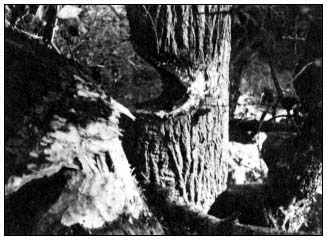
Figure 10.
Young cottonwood trees (15–18 years old) along Arcade Creek,
Arcade Park, Sacramento County, being cut down by beaver.
In addition to being suppressed as seedlings and saplings by livestock browsing and other human-use pressures, cottonwoods of all sizes are a preferred food of the beaver (Castor canadensis ), whose population density has increased in recent decades (fig. 10). Pocket gophers (Thomomysbottae ) and ground squirrels (Citellus spp.) have been reported to feed on valley oak acorns and seedlings. Gopher and ground squirrel population densities are known to be greatly affected by land-use practices, increasing if ground- and shrubcover is removed through grazing, burning, or other means.
Floristics
Plant Species Richness
"Species richness" may be defined as the number of species in a plant association, in this case in a site of riparian vegetation. A cumulative total of 50 plant species was recorded by the ground study at 51 Central Valley riparian sites. Most are listed in table 3. As indicated earlier, there are considerably more than 50 riparian plant species in the Central Valley. The survey was not, however, designed to locate the rarer ones, nor any, common or rare, that were groundcover species.
There is no way of knowing with certainty what plant species were present, or in what numbers, during earlier periods, for measurements are lacking. One of the few comparative approaches presently available is to utilize species richness counts from the most intact of the remaining riparian systems. The selection of non-random sites in the study design was a conscious attempt to provide this quasi-natural kind of baseline information.
Caswell State Park (site 12), San Joaquin County, and Sweetwater Creek (site 36), El Dorado County, both yielded 19 woody plant species using study procedures, the largest number. These were both relatively intact riparian systems with very high plant diversity indices and high riparian bird species richness. Wyman Ravine at Lower Wyandotte Road (site 41), Butte County, produced 18 species of woody plants. This site is a perennial stream floodplain that had been dredged for gold and is now vegetatively recovering. Its high species richness appeared to derive from the highly diverse nature of the substrate, where the floodplain and its ponds, swales, and dredge tailings are all watered by a small perennial stream. It also had one of the highest plant diversity indices.
Space does not permit a full discussion of species richness by site, although much can be learned from such evidence. There was a wide range of species richness between sites, indicating, as do the data on vegetation diversity, that there was very little similarity between the different riparian systems. The numbers of species (or species richness) in shrubcover, understory, and canopy of different sites are listed in table 4. The four "vegetation" columns list the number of sites where a given number of plant species (left column) occurs. The three sites where no (0) species occur had only a groundcover stratum.
Again the interesting fact emerges that on 35 sites there were no understory species at all (i.e., understory was absent). Where understory did occur, it was comprised of very few species. The wide range in species richness for canopy is also noteworthy.
| ||||||||||||||||||||||||||||||||||||||||||||||||||||||||||||||||||||||||||||||||||||||||||||||||||||||||||||||
Plant Diversity
"Plant diversity," as used here, is the total structural and floristic heterogeneity within a vegetation. In nature, plant diversity has many components, more than we can count and probably more than we can identify. For purposes of the present study, the following protocol for measuring plant diversity was used.
It will be recalled that four structural strata were identified by the inventory: groundcover, shrubcover, understory, and canopy. In the site transect surveys where a transect sample-point was established every 3 m., each sample-point yielded information on the taxon, or structural type (when present), for each stratum. This taxon could be a species or a more general descriptor such as "grass." A vegetation such as a closed-canopy forest may have all four strata present; in this case there would be four scores—one for each stratum—at that transect sample-point. Thus groundcover, shrubcover, understory, and canopy taxa were recorded wherever present at each sequential sample-point along a transect, the aggregate of several transects providing a three-dimensional structural matrix.
For the purposes of the study, plant diversity resulted when one transect-point stratum reading was followed by a dissimilar one on either the vertical axis (vertical diversity component) or the horizontal axis (horizontal diversity component). For example, if for the groundcover stratum a transect sequentially recorded: "grass - grass - forb - woody litter – berryvine – berryvine," the horizontal diversity score would be 1 (grass-forb) + 1 (forb-woody litter) + 1 (woody litter-berryvine) = 3 horizontal diversity points. If the vertical readings were: "grass – poison oak – elderberry – Fremont cottonwood," the vertical diversity score would be 1 (grass-poison oak) + 1 (poison oak-elderberry) + 1 (elderberry-Fremont cottonwood) = 3 vertical diversity points. This procedure, while a simplification of the real world complexity of natural vegetations, permits the development of a quantitative structural and floristic index of plant diversity in both horizontal and vertical axes.
The results of an analysis of plant diversity for the 51 ground-study sites are presented in figure 11. This is actually a scatter diagram, where the vertical diversity component is plotted on the vertical axis of the graph and the horizontal component plotted on the horizontal axis. The further to the right a point is, the greater the horizontal plant diversity component at that site; the higher on the y axis, the greater the site's vertical plant diversity component. Thus the higher and to the right that a point is, the larger that site's total plant diversity score.
Clearly, there is great variation in plant diversity between sites. Systems range in structural and floristic design (and hence plant diversity) from moist, grassy swales with a few sedges and no shrubs or trees, to narrow linear stringers of riparian vegetation along small spring-fed
Figure 11.
Plant diversity scores for 51 Central Valley riparian sites.
creeks, to closed-canopy gallery forests. Surprisingly, the narrow stringer system often exhibited a high total plant diversity. This resulted from the intermixing of riparian and upland plant species. Another way of describing these narrow, perennial and intermittent stream riparian corridors or stringers is to say that they are almost pure ecotone; that is, they are so narrow that there is no inner core or "interior" of strictly riparian vegetation. Preliminary studies of riparian birds associated with these stringers suggests that despite this high plant diversity, narrow ecotonal riparian stringers do not support the greatest bird species richness. That is found in the larger systems having a combination of greater amounts of core or interior and more purely riparian vegetation conditions.
The great array of riparian system plant diversity illustrated in figure 11 reflects both the local geophysical and biogeographic circumstances of the systems and their individual histories of human-use impact. The three sites of highest plant diversity were: 1) Ladd Creek at Road 200 (site 26), Madera County, a small but complex perennial stream system below a small earthfill dam in the Sierra foothills; 2) Wyman Ravine at Lower Wyandotte Road (site 41), Butte County, a small perennial stream system on a broad floodplain with a partially closed canopy and well along in recovering from gold dredging, again in the Sierra foothills; and 3) Mooney Island on the Sacramento River (site 52), Tehama County, a mature cottonwood grove on the bank of
the river. The two sites of lowest plant diversity were Dry Creek Swale at Academy (site 10), Fresno County, a grassy swale with perennial seepage and no woody vegetation; and Sandy Mush Road at Healy Road (site 5), Madera County, a small valley floor stream that has been channelized to carry runoff (and possibly agricultural) water.
At the Sandy Mush Road site, the cottonwood/willow stringer vegetation had been largely removed for channel clearance and other less obvious reasons. The Dry Creek Swale site has been exposed to livestock grazing since the latter 1800s, suppressing all but grazing-resistant groundcover plants such as grass, clover, and sedges.