Structural, Floristic, and Condition Inventory of Central Valley Riparian Systems[1]
Richard E. Warner[2]
Abstract.—At the time of European settlement of the Central Valley in the mid-1800s, between two and three million acres of seasonally inundated floodplain supported vast areas of both aquatic and riparian wetlands. Over 90% of the valley's riparian systems are now gone. This paper reports a ground-based inventory of 51 riparian sites, some randomly selected, others chosen for their special structural or ecological values. Morphological structure, floristics, plant diversity, and site condition were quantified using an inventory methodology designed for that purpose. Stem diameter size-frequency curves for major canopy species indicate major reproductive problems in several species. Condition trends are assessed, and human-use impacts are discussed.
Introduction
History of the Problem
Since the first establishment of Spanish land grants in the early 1800s, the riparian systems of California's Central Valley have experienced an unremitting assault from cultivated agriculture, pasture and open-range grazing, dams and water diversions, groundwater pumping, flood control engineering, fuel wood cutting, and other consumptive uses and development activities.
Little note was taken of the cumulative impacts of these activities until the mid-1970s, when conservationists belatedly realized: a) the immense ecological importance of riparian systems; and b) the magnitude of their loss. In California, field studies of human-use impacts (e.g., McGill 1975, 1979) and riparian conferences in 1976 and 1977 (Sands 1977) brought these values and the extent of the loss into some perspective. During the same period, authoritative reports and the proceedings of important riparian conferences were emerging across the land, documenting the unusual importance of riparian systems as wildlife habitats, as protectors of the hydrologic and ecologic integrity of streams, as major recreation sites, and potentially as major forest product resources (e.g., Anderson and Ohmart 1977; Carothers et al . 1974; Gaines 1977; Hubbard 1977; Jain 1976; Johnson etal . 1977; Johnson and Jones 1977; Korte and Frederickson 1977).
California Riparian Study Program
In 1978, goaded by now-alarmed conservationists, the California Legislature enacted legislation (AB 3147, Fazio) mandating and funding a study of Central Valley and California Desert riparian resources by the California Department of Fish and Game (DFG). The stated goal of DFG in mounting its California Riparian Study Program (CRSP) was: "to protect, improve, and restore the riparian resources of the state." Specific objectives were:
1. To determine the historical extent of the riparian resource in the Central Valley and California Desert and the causes of its destruction;
2. To determine the present status of the riparian resource;
3. To identify problems and threats to resource maintenance;
4. To recommend measures for riparian resource protection, improvement, and restoration."
The above goal and objectives were essentially the same as those which guided the Department's successful coastal wetland program. (Warner 1979)
[1] Paper presented at the California Riparian Systems Conference. [University of California, Davis, September 17–19, 1981.]
[2] Richard E. Warner is Director, Field Studies Center, Davis, Calif.
The CRSP studies began in 1979. The first, a riparian vegetation mapping project of Central Valley depositional bottomland, using California Department of Water Resources (DWR) 35mm. aerial photographs, was undertaken jointly by the Departments of Geography at California State University, Chico, and California State University, Fresno (Central Valley Riparian Mapping Project 1979). The second project was a problem analysis and research planning effort undertaken by the Field Studies Center, Davis (Warner 1979). The third project, a riparian mapping and inventory design study, was undertaken by the Remote Sensing Research Program, Department of Forestry and Resource Management, University of California, Berkeley (Bonner etal . 1979). These were followed in 1980 by a two-part, collaborative field inventory and condition assessment. Two research teams—Remote Sensing Research Program, University of California, Berkeley, and Field Studies Center, Davis—undertook, respectively, remote-sensing and ground-based inventories of selected Central Valley riparian systems. This paper reports some of the findings of the ground-based inventory component of the CRSP.
Objectives and Constraints
It was recognized at the outset that a definitive ground-based study was not possible, owing to: a) the vast size of the study area (8.3 million hectares); b) limited resources ($20,000, of which $15,000 was provided by the Denver Wildlife Research Center, USDI Fish and Wildlife Service [FWS]); c) limited time (four months field time for ground-based studies); and perhaps most important, d) lack of prior studies of Central Valley riparian systems. With the exception of Conard etal . (1977) and Roberts etal . (1977), virtually no quantitative studies of the morphological structure of riparian vegetation and its floristics had yet been undertaken. No quantitative information on regional differences had been developed. California riparian plant associations and communities were only partly defined. No riparian classification system had been developed. And no standardized field procedures specific to riparian systems had yet been developed.
Limited time and the need to develop and test quantitative procedures precluded extensive preliminary sampling to determine study site stratification possibilities. Thus, the CRSP ground-based study of the Central Valley was designed as a first, broad-brush effort, where the objectives were to:
1) develop, test, and deploy a quantitative riparian inventory methodology;
2) describe and quantify the diversity of riparian system morphological structure, floristics, and condition; and
3) determine the major causes of condition decline and recent overt loss of riparian systems throughout the study area.
Structural, floristic, and other riparian system variables were selected based on what appeared to be real intra-system relationships and which were at the same time universal; that is, they were common to many kinds of riparian systems in many places. Randomized sampling procedures, other than site selection, were not attempted owing to the complete absence of quantitative information on intra-site and inter-site variance. It seemed more naive to make the pretense of known normal distributions and variances of as yet undefined plant association types, than to admit our ignorance and start at "square one" with the most rudimentary quantitations. The present study thus lays the groundwork for later stratification and randomization in sampling procedures.
The Study Area
Physiography
The Central Valley of California is an immense, flat-bottomed trough averaging 160 km. wide and comprised of two principal subunits, the San Joaquin Valley south of, and the Sacramento Valley north of the Delta. It extends in a northwesterly direction from its southern end near Bakersfield, Kern County, for some 830 km. It is bounded by four landform provinces: on the east by the Sierra Nevada; the south and west by the Coast Ranges; and on the north and northeast by the Klamath Mountains and Cascade Range (Durrenburger and Johnson 1976).
The Fazio legislation prescribed that the boundary of the Central Valley study area be at the upper edge of the blue oak/digger pine zone of Küchler (1977). This vegetation boundary lies at about 1,060 m. elevation in the south, gradually lowering to about 760 m. elevation in the north. It encompasses an area averaging 110 km. E–W and 750 km. N–S, or a total land area of approximately 82,500 sq. km. (8.25 million hectares or 20.3 million acres). The bottom of the trough, i.e., the valley floor, is comprised largely of unconsolidated sediments, ranging from about 1,000 m. of depth in the north to as much as 17,000 m. of depth in the lower San Joaquin Valley. These sediments provide a permeable matrix for an aquifer or groundwater storage basin which is by far the largest in the state.
Climate
Climate ranges from desert in the south and south-central portion, through steppe in the center, to warm summer Mediterranean in the north. Precipitation on the valley floor is as low as 127 mm. per year in the south, increasing to 760 mm. per year in the north. Precipitation in the surrounding hills and mountains is significantly higher, up to 2,000 mm. per year in certain northerly Sierra and Cascade parts of the watershed (Durrenberger and Johnson 1976).
Temperature patterns are somewhat unusual, in that both the far northern and far southern ends experience 90–120 days per year above 32°C (90°F), while the central portion receives but 60–90 days per year in that temperature range. In contrast, the surrounding foothills have on average but 30–60 days per year above 32°C. Winters tend to be mild throughout the Central Valley, with low clouds and fog ameliorating winter cold. Freezing temperatures occur principally from the influx of cold air from Canada in January and February (ibid .).
Fluvial Systems and Surface Hydrology
The watersheds and their draining streams and rivers on both sides of the Central Valley have common patterns of sediment transport, although those of the east side (the west slope of the Sierra) carry much more water. Eroded materials are transported down in steeply sloped, incised channels from the higher mountains, ultimately to be deposited on the broad, gently sloping alluvial fans comprising the lower termini of the watersheds. These alluvial floodplains, found along both sides of the valley floor at the bases of the mountains, tend to coalesce at their lateral margins with adjacent fans. The valley floor is thus a centrally depressed surface, the center of which is a sink with permanent wetlands, whose topography is in a slow but constant process of change from sequential alluvial depositions and the continued slow subsidence of the valley floor itself. Many Central Valley towns and cities (e.g., Sacramento, Fresno, Marysville, Yuba City, Bakersfield) are built on these alluvial floodplains and have experienced chronic flooding problems as a result. A more thorough treatment of Central Valley hydrology can be found in Katibah (1983) and Warner and Hendrix (in press).
It is difficult to generalize about Central Valley fluvial systems. They vary from small, first-order ephemeral streams to large, mainstem bottomland rivers. Prior to extensive water development, between 0.8 to 1.2 million hectares (2 to 3 million acres) of the valley floor were seasonally flooded, creating vast areas of floodplain riparian forest, woodland, savannah, and meadow. Duration of seasonal flooding varied from a few days to several months, depending on topography and on the timing and magnitude of storms and snowpack (Zeiner unpublished; California Department of Public Works 1931a,b).
In 1850 the U.S. Congress passed the Arkansas Swamp Act, permitting these "swamp and overflow lands" to be turned over to the states. In 1871, after much quarreling over where boundaries should be, the U.S. Secretary of the Interior accepted the State's determination of 887,654 ha. (2,192,500 ac.) of "swamp and overflow lands" (Thompson 1957; Zeiner unpublished). Somewhat later, the then-California Division of Water Resources, in Bulletins 26 and 29 (California Department of Public Works 1931a,b) concluded that in the Central Valley there were some 1,262,753 ha. (3,119,000 ac.) of floodplain bottomland subject to "seasonal or permanent flooding." This figure did not include the extensive riparian zones along tributary streams and rivers, which if included would raise the figure by at least another 300,000 ha. (740,000 ac.).
The significance of this is apparent. First, virtually all these seasonally inundated floodplain bottomlands were riparian wetlands. Second, based on both federal and state determinations, the historical extent of Central Valley riparian wetlands (as of 1871) was far greater than recent estimates based on reviews of early vegetation maps and present vegetation patterns (Roberts etal . 1977; Smith 1977; Katibah, Nedeff, and Dummer 1983; Küchler 1977). The influence of this vast complex of riparian wetlands upon Central Valley ecology was profound.
Surface hydrology and native vegetation patterns of the Central Valley have been greatly and perhaps permanently altered by human activities. Dams now block the flows of most of the larger streams and rivers, and, in so doing have massively altered the hydrologic regimes of the watercourses and associated groundwater basins. In some cases, the water so dammed is diverted out of the watershed altogether. Overbank flooding, siltation, and natural revegetation of the riparian zone have been greatly reduced. Thousands of kilometers of diversion ditches and canals now remove water from the streams, transporting it elsewhere for agricultural and other purposes, reducing groundwater recharge rates in the floodplains. In some areas, especially in the San Joaquin Valley, groundwater pumping from wells has lowered the water table to below root zones, rendering large areas uninhabitable to native trees and shrubs. The construction of thousands of kilometers of levees for flood control purposes has isolated hundreds of thousands of hectares of riverine floodplain from the periodic flows which replenished their soils, nutrients, and soil moisture. And cultivated agriculture and fenced pasturage, both of which do especially well on floodplain soils, have directly replaced (often in concert with the flood control levees) over half a million hectares of former riparian forest, woodland, and floodplain grasslands.
Virtually all the foothill and lower mountain portions of the study area have been continuously or seasonally grazed. The century and a half of open-range and pasture grazing of domestic livestock has greatly altered distributional patterns and species composition of riparian vegetation, as cattle and other range animals are preferentially attracted to the riparian zone for its water and highly palatable mesic vegetation.
Methods
The field team consisted of a senior scientist and a field assistant. The team was equipped with a recreational vehicle which permitted near-site camping the night prior to a riparian
site inventory. Background and pilot studies testing the methodology took place in February and March 1980; full-scale field investigations commenced in April and continued until mid-July 1980. Field activities were broken into 10-day blocks, during which 10 sites were inventoried. After a four- to five-day break, an additional 10-day field period ensued.
A typical daily schedule was as follows:
1. hike to site at first light;
2. inventory until aproximately 13:00;
3. return to vehicles, review data collected, and drive to next site;
4. contact landowner to arrange trespass;
5. briefly survey site and camp for night.
This procedure required on average 12 hours per day. It was found that for complex or logistically difficult systems one day was insufficient. Two to three days per site would permit more detailed and in-depth study, would allow field personnel more time to check data and to rest, and is recommended if the riparian systems are at all complex and/or if additional study parameters are added. Increasing team size to four would permit adequate one-day site inventories for most systems. If sites are stratified into plant associations or other subsets, sampling will of course require additional time.
Data Collection Procedures
A principal objective of the field measurements was to provide a quantitative basis for determining site vegetation structure, floristics, and plant diversity, and for intersite comparisons. A second major objective was to determine the condition and condition trends of the sites with respect to human-use impacts. Groundcover, shrubcover, understory, and canopy components of the vegetation were quantified by height, providing the structural data. Ancillary observations on streambank condition, adjacent land use, etc., augmented structural and taxonomic data. Not enough is yet known about the floristics of riparian systems of the Central Valley to use them either comparatively or definitively as condition estimators. However, the distribution, abundance, size (and age), amount of reproduction (if any), and condition of indigenous riparian trees and other perennial woody vegetation are all useful indicators of cumulative human-use impacts and of the potentials for restoration of the systems.
Four specially designed data entry forms were used for recording measurements of riparian system variables used for quantifying vegetation composition, structure, floristics, size frequency, associated birds, etc. The design of the forms (standard column/row design) and the variables measured are illustrated in figures 1 and 2. The variables (see especially fig. 2) were selected after initial background studies of Central Valley and other riparian systems and a review of relevant literature.
Figure 1.
Vegetation, diameter-at-breast-height
(DBH), and bird data form heading layouts,
indicating the riparian system structural,
floristic, and condition variables measured.
Transverse (cross-sectional) transects were run across the riparian zone, from upland to upland if the watercourse was negotiable, from upland to watercourse if not. Transect endpoint locations were recorded in meters up- or down-stream from a recorded "Site 0 (starting) Point", selected on the basis of permanence (e.g., a bridge) and visibility to aerial photography. A 2-m. pole marked off in decimeters was used locate transect points and to quantify groundcover and shrubcover vegetation height. Vegetation data (groundcover-type, groundcover height, shrubcover-type, shrubcover height, etc.) were recorded outbound; size frequency data were recorded inbound. Vegetation height and floristics were recorded at each 3-m. point along each transect. Size frequency data were recorded in a 6-m. belt along the same transect line. Bird observations were made while moving slowly through the site; species and location was recorded for each observation. Groundcover and shrubcover heights were measured in decimeters; understory (considered present only if a canopy was also present) and canopy bottom and top heights were estimated in meters by triangulation. Unknown species were collected for later identification. Stem size (DBH) of woody species with stems greater than 2 cm. was measured optically by holding a meter rule at arm's length against
Figure 2.
Data entry descriptors and entry
codes for the vegetation form.
the stem and aligning the zero end at the left edge of the stem. The observed stem diameter was recorded in millimeters and later converted to actual diameter by a conversion equation. Very large tree trunks were measured circumferencially with a metal tape and the readings converted to millimeters DBH.
Random Sample Sites
A subset of 35 random sample sites was selected, using a randomized selection protocol based on USDI Geological Survey 1:24,000 quadrangles (quads). All perennial and intermittent watercourses shown on quads were candidate sites, from which the subset selected for study was drawn using stratified randomization procedures. Only 31 of these sites were ultimately used in the analysis. Randomized site selection procedures are described in greater detail in Katibah, Nedeff, and Dummer (1983) and Katibah, Dummer, and Nedeff (1983).
Nonrandom Sample Sites
It was important that selected riparian systems of special technical significance be included in the inventory. These included those known to be unique, to be relatively intact, and/or to be of special ecological importance. A subset of 20 nonrandom sites was selected based on available information and recommendations of field scientists with local knowledge. Because some of the nonrandom sites were relatively intact (there are no pristine riparian systems left in California), they served as quasi-controls and as best-available baselines for comparative purposes.
Riparian Birds
Because of particular interest in the question of riparian system dependency and use by certain bird species, a special set of "bird" transects was run. Lists of "riparian-preferring" and "riparian-frequenting" birds were developed in consultation with the Denver Wildlife Research Center, FWS. While all bird species seen were recorded, a special watch was kept for these species and their precise locations noted when observed. At each such "bird" point, two 39-m. vegetation transects (13 transect points, each 3-m. apart, where point 7 fell at the point of bird observation) were run, one perpendicular (90°) to the other. These data were treated separately from the standard vegetation transect data. In simple and highly degraded riparian systems, bird species richness (i.e., the total number of bird species present) was determined. In large, complex systems, time and field staff limitations precluded such determinations, although many species were located. Findings from this part of the inventory will be reported elsewhere.
Data Processing and Descriptive Statistics
Computerized data management and analysis methods were utilized, with the assistance of the Statistical Resources Group of DFG, Menlo Park, Calif. The Statistical Package for the Social Sciences program (SPSS, Version 8.0, Vogelgack Computing Center, Northwestern University) was used for most data management and analysis needs. Special subroutines were written as necessary. These included data reduction and simple descriptive statistical procedures. Further description of field methodology, including that of the remote-sensing project, can be found in Warner and Katibah (1981) and Katibah etal . (ibid .).
Riparian Vegetation
Background Observations
The physical and biological makeup of any vegetation may be thought of in several ways. "Components" of morphological structure, floristics, spatial patterning, and intravegetation or "plant" diversity are the design determinants of any vegetation, whether our interest is in its value as timber, wildlife habitat, biomass, livestock forage, nature preserve, or any of a host of other attributes.
These site-specific components are in turn dependent upon other "factors" for their presence and expression. Climate, parent soil material, topography, accessibility of the site to potential inhabitants, length of time the site has
been habitable, ecology of the plant species inhabitants (e.g., community interactions), external influences (primarily human-use impacts), and other factors all influence the floristics, structure, and spatial patterns of any plant association or community. Both Major (1951) and Mueller-Dombois and Ellenberg (1974) have developed vegetation-formation functions to describe this complex of factors. Major provides the following function for plant community.

|
Mueller-Dombois and Ellenberg offered a plant community formation function which is similar but has somewhat different emphases.

|
However, many vegetations no longer have the "luxury" of untrammeled formation functions. Riparian vegetation especially has been subjected to violent human-use pressures which in many places all but obscure those factors responsible for their initial formation. Long-term livestock grazing can convert a forest to a grassland or a desert, as can damming and diversion of the water supply. Conversion to cultivated agriculture can efface entire vegetations.
Definition of Terms
To understand how structure, floristics, and spatial patterns relate to plant diversity and to vegetation formation factors, it is necessary first to define terms as used here. "Vegetation" is the plant life or total plant cover of an area. "Morphological structure" is the internal physical design of the vegetation—the brush, trunks, branches, canopies, and other vegetative materials that physically form its substance. "Floristics" is the biological component contributed by the different species of plants (the flora) making up that vegetation. "Spatial pattern" is the manner in which plants are aggregated. "Plant associations," where species are aggregated nonrandomly due to environmental factors, is one type of spatial pattern. "Plant diversity" is the internal heterogeneity of a vegetation created by structural and floristic nonuniformities in the plants which comprise it.
The term "plant diversity" was used deliberately to distinguish it from "species diversity" (a function of the number of species and their population sizes) and "vegetation diversity" (differences between vegetations). Plant diversity includes species richness, population density, population demography, life form, spatial pattern, association (aggregation), and community (interacting association) components. For the present study the term was enlarged further to include certain human-use perturbations (e.g., roads) and absence of plants (e.g., bareground) as components because the frame of reference was the entire riparian system.
Thus—using one's own front lawn as an example—the vegetation is a simple one: a) composed of a single species of bermuda grass (its floristics); b) growing as a thin, dense, unbroken mat on the ground (its structure); and c) because of its uniformity and simplicity, having low plant diversity. In contrast, a gallery riparian forest may have: a) a luxuriant internal morphological structure, including up to four structural layers (groundcover, shrubcover, understory, canopy); b) be comprised of 50 or more species (i.e., have complex floristics); and c) have the entire array of species mixed heterogeneously, with gaps in the shrubcover and openings in the canopy so as to have a very high plant diversity.
Riparian Vegetations and the California Riparian Study Program
No two vegetations have the same structure, floristics, and plant diversity because each has a unique history and grows on a unique substrate (i.e., each has a unique formation function, in Major, and Mueller-Dombois and Ellenberg terminologies). Riparian vegetations, for example, are subject to being torn up and rearranged by floods. Each riparian system has a unique set of hydrologic conditions determining the amount and timing of the water it receives (hydroperiod), imposing site-specific conditions on presence/absence and growth rate of the various species comprising the vegetation. And each vegetation is growing on a substrate, whether a rocky streamside or an alluvial floodplain, that is in itself unique. Each, in addition, has an individual history of human-use impact. Some have been grazed by livestock, which alters the rates and patterns of plant reproduction and regrowth. Some have been selectively logged for timber or fuelwood, grossly changing both structure and floristics. Others may have at some time in the past been cleared for cultivation agriculture or burned and are at one stage or another of regrowth.
The study of these three major determinants of any vegetation—structure, floristics, and plant diversity—can thus tell us a great deal about the condition and condition trends of a vegetation (one might consider this the "health" of the vegetation) and provide useful insights into its human-use values and the best means of productive management.
Groundcover
"Groundcover" may be thought of as that layer of vegetation which actually covers the ground, for example grass, forbs (herbs other than grasses), leafy litter, etc. It is distinguished from "shrubs," the next higher layer, by the latter's having woody stems which hold the vegetation above the ground surface. In the present study, we have included "bare ground" and "road" as groundcover categories for practical reasons. Table 1 lists the principal groundcover-types occurring in the 51 ground-study sites for the entire Central Valley.
The data presented in table 1 are instructive in several ways. First, the major groundcover-types are indicated. Together with their frequencies of occurrence, they provide a quantitative picture of the nature of Central Valley riparian system groundcover-types. Second, the large ranges and standard deviations indicate that even though a groundcover-type may occur on several or many sites, the amount present varies widely between sites. Third, the large, highly varying coefficients of variation suggest that the factors responsible for the present groundcover-type patterns at any site are independent, that is each site probably has a unique vegetational history. This pattern of site individuality will be seen throughout, reinforcing the general observation that each riparian system is indeed unique, owing to the many independent variables discussed above, which create and modify them.
To give some idea of how these variables relate to any given riparian system, several sites are presented for comparative purposes. These are Caswell State Park (site no. 12, fig. 3), Kaweah River (site no. 24), Cantua Creek (site no. 16, fig. 4), and San Joaquin River at Frewert Road (site no. 4). Caswell State Park is a relatively intact, bottomland floodplain ripar-
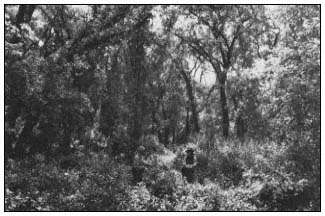
Figure 3.
Floodplain riparian system at Caswell State Park.
This area has been protected from disturbance
for several decades. (Photograph by R.E. Warner.)
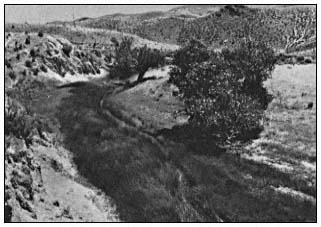
Figure 4.
Cantua Creek, a small perennial stream system in the Coast
Ranges. Note the heavy growth of sedges and the scattered
mature cottonwoods. (Photograph by R.E. Warner.)
| ||||||||||||||||||||||||||||||||||||||||||||||||||||||||||||||||||||||||||||||||||||
ian system on the lower Stanislaus River, San Joaquin County; Kaweah River is a well-wooded, formerly grazed Sierra foothill stream near the town of Three Rivers, Tulare County; Cantua Creek is a heavily grazed, secondarily simplified system in the Coast Range foothills west of Fresno, Fresno County; and the San Joaquin River site is a vegetated levee on the floodplain near Stockton. Table 2 summarizes groundcover data for the four sites in terms of percent occurrence and mean height in decimeters, by groundcover-type.
Each site, as demonstrated here, had a unique set of groundcover characteristics reflecting its location, geophysical and hydrologic circumstances, land-use history, and present land-use patterns. Note, for example, the great difference in grass groundcover between Caswell (21.5%) and Cantua (70.6%) (table 2). Mean percent grass groundcover for all Central Valley sites combined was 41%; thus, Caswell was demonstrably below (19.5%) and Cantua well above (29.6%) the valley-wide average. Similarly, note the great disparity in forbs (non-grass herbs), where San Joaquin (25.0%) has over 16 times as many as Cantua (1.5%). The mean value for all Central Valley sites was 14%. Thus San Joaquin was well above the average value for forbs while Cantua was well below average. The high grass/low forb groundcover scores for Cantua reflect the long history of open-range grazing that particular riparian system has experienced. It also is linked to the reduced amount of tree canopy at that site, similarly the result of long-term open-range grazing. These figures can change very markedly over time for any site, depending upon overall land-use practices, and can be used as quantitative elements to monitor the systems, if desired. Information on canopy structure and floristics is presented below to further illustrate the high degree of intersite diversity.
Groundcover Floristics
Conspicuously absent from this portion of the inventory are data on the plant species comprising the groundcover. The decision was made during project design to preclude collecting locational and floristics data on the many groundcover species because of the limited time available both for developing the inventory procedures and for acquiring field data. Grasses, forbs, herbs, mosses, ferns, lichens, and other groundcover plant species are important components of riparian system structure and plant diversity, and ideally should be included in riparian inventory and monitoring programs. They present special problems of location and taxonomy because of the intense seasonality of growth and flowering. Where time and resources permit, their inclusion into riparian inventory design is recommended.
Shrubcover, Understory, and Canopy
Each of these vegetation strata are potential structural components of riparian vegetations. In this study, plants were considered "shrubs" if they had woody stems supporting leafy
| |||||||||||||||||||||||||||||||||||||||||||||||||||||||||||||||||||||||||||||||||||||||||||||||||||||||||||||||||||||||||||||||||||||||||||||||||||||||||||||||||||||||||||
vegetation above ground level, but were no taller than 6 m. "Canopy" was the leafy vegetation produced by trees, and "understory" was that (rare, as it turned out) vegetation layer below and in the shade of an over-arching canopy, residing between it and the underlying shrubcover stratum. Normally, each vegetation stratum should be treated individually, as each contributes separately to the morphological structure, floristics, and spatial patterning of a vegetation. For reasons of space in this paper, these three vegetative components are not analyzed separately. Table 3 summarizes, by plant species and relative frequency of occurrence, the patterns of shrubcover, understory, and canopy for all 51 Central Valley sites studied on the ground.
A total of 50 plant species was recorded for the entire Central Valley. This does not, of course, mean that this is the total number of riparian species in the Central Valley, as the total sample size and sampling procedures did not permit identification of rarer species. However, the table clearly demonstrates the relative frequency and abundance of those species which are of major structural and ecological significance for riparian systems within the study area. Some are detailed below.
| ||||||||||||||||||||||||||||||||||||||||||||||||||||||||||||||||||||||||||||||||||||||||||||||||||||||||||||||||||||||||||||||||||||||||||||||||||||||||||||||||||||||||||||||||||||||||||||||||||||||||||||||||||||||||||||||||||||||||||||||||||||||||||||||||||||||||||||||||||||||||||||||||
| ||||||||||||||||||||||||||||||||||||||||||||||||||||||||||||||||||||||||||||||||||||||||||||||||||||||||||||||||||||||||||||||||||||||||||||||||||||||||||||||||||||||||||||||||||||||||||||||||||||||||||||||||||||||||||||||||||||||||||||||||||||||||||||||||||||||||||||||||||||||||||||||||||||||||||||||||
Major Species
Shrubcover
As indicated in table 3, willow, poison oak, box elder, oak, elderberry, and coyote bush were the principal shrubcover plants, although at least 22 shrubcover species were identified.
Understory
Wild grape, box elder, and willow were the main constituents of understory, which was overall surprisingly scarce. For those sites where it did occur, it averaged only 2.9% occurrence, calling into question its ecological role (and indeed, its structural reality) in most Central Valley riparian systems.
Canopy
Again referring to table 3, various willow species (35, 36.9%), Fremont cottonwood (28, 31.2%), valley oak (20, 21.2%), Oregon ash (18, 7.7%), black walnut (13, 15.2%), and white alder (10, 10.6%) constitute the dominant riparian canopy species. The transect procedure scored as present at a transect point any canopy species which was either on or overhanging the transect point. Thus, for example, a valley oak whose trunk was 4 m. from the transect point was counted if some portion of its canopy was directly above the transect point. These figures can be treated as rough approximations of percent canopy cover by the different tree species.
There is a direct (though not linear) relationship between stem diameter and canopy size of most trees. Stem diameter data gathered from the 6-m. wide belt transects can thus be used to compute percent canopy cover by species once the stem:canopy diameter function has been determined. It is not reported here but mentioned to call attention to yet another analysis available with this methodology.
Reproduction and Size-Class Patterns
Stem diameter (also called diameter-at-breast-height or DBH) data obtained by the 6-m. wide belt transects for the most frequently encountered riparian tree species were aggregated into 50 mm. size-classes. Figures 5 and 6 depict the resulting DBH size-frequency curves for six Central Valley riparian tree species. Figure 7, the DBH size-frequency curve for the giant sequoia (Sequoiagigantea ) of the Sierra Nevada, is provided for comparative purposes. This population has been protected for many years from severe human-use impacts such as logging and grazing.
Figure 5 clearly shows the DBH size-frequency pattern differences between Oregon ash, on the one hand, and Fremont cottonwood and California sycamore on the other. These latter two species are clearly experiencing long-term perturbations to reproduction. Size(age)-classes smaller than about 40 cm. (16.3 in.) DBH are progressively less well represented. The decrement in the two smallest size-classes of Oregon ash is not yet understood. It may be real or may be an artifact of inadequate field procedures, where the smallest stems were undersampled.
Figure 5.
DBH size-class curves (three-point moving means) for three species
of Central Valley riparian trees, based on data from 51 sites.
Figure 6, DBH size-frequency curves for Hind's walnut, willow (species), and valley oak, again demonstrate a severe perturbation or disruption in the reproduction of valley oak. The Central Valley population of this species is clearly not maintaining itself. If one overlays the valley oak, Fremont cottonwood, and California sycamore DBH size-frequency curves, a strikingly similar curve shape will be noted. While it is not possible to deduce from these data what is causing the serious declines of these three species; it does appear that their patterns of decline are similar.
These size-frequency data also corroborate a similar inference which can be drawn from table 3 (discussion above), where these species were present in very low numbers as seedlings and saplings in the shrubcover and understory components of the vegetation.
The lack of continued recruitment into the riparian vegetation of these previously important canopy species indicates that: a) over time, as existing adult trees age and die (fig. 8), the systems are experiencing large structural and floristic shifts; b) the ecological values of the vegetations (e.g., their ability to support native riparian-dependent birds and other wildlife) are being progressively impaired; and c) suppression of riparian tree reproduction is a widespread phenomenon throughout the Central Valley.
Field studies have clearly demonstrated that open-range grazing of livestock and the lack of fencing protection for riparian systems within fenced pastures both result in selective removal of seedlings and saplings of broad-leaf deciduous riparian vegetation (fig. 9). Dams and water diversions are known to produce significant downstream changes in flow regimes, in the levels
Figure 6.
DBH size-frequency curves (three-point moving means) for three
species of Central Valley riparian trees, based on data from 51 sites.
Figure 7.
DBH size-frequency curve for the giant
sequoia (Sequoia gigantea ) in the Sierra
Nevada. (From Harvey et al . 1980.)
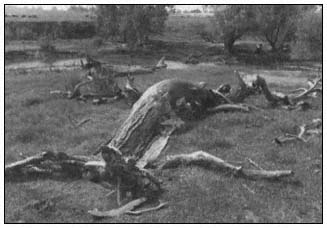
Figure 8.
Senescent cottonwood/willow riparian woodland on Dry Creek,
near Academy, Fresno County. Note lack of reproduction.
of winter floodwaters, and in dry season flow rates (and riparian zone soil moisture) and thus to impact native vegetation reproduction. Cottonwoods and willows, for example, release their seeds in the spring during spring runoff. Both species germinate best in recently deposited, fine, moist silts, a trait of obvious adaptive value for riparian species, but one at risk if flow regimes are modified.
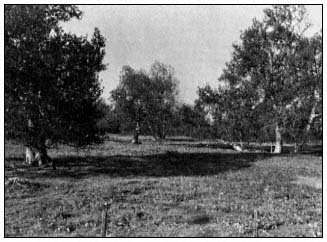
Figure 9.
Floodplain sycamore woodland by Orestimba
Creek subjected to long-term fenced livestock
grazing. Note complete absence of sycamore
regeneration and lack of plant diversity.
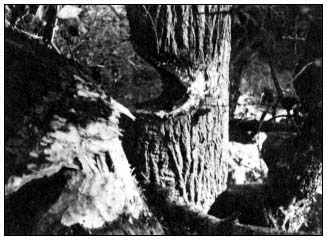
Figure 10.
Young cottonwood trees (15–18 years old) along Arcade Creek,
Arcade Park, Sacramento County, being cut down by beaver.
In addition to being suppressed as seedlings and saplings by livestock browsing and other human-use pressures, cottonwoods of all sizes are a preferred food of the beaver (Castor canadensis ), whose population density has increased in recent decades (fig. 10). Pocket gophers (Thomomysbottae ) and ground squirrels (Citellus spp.) have been reported to feed on valley oak acorns and seedlings. Gopher and ground squirrel population densities are known to be greatly affected by land-use practices, increasing if ground- and shrubcover is removed through grazing, burning, or other means.
Floristics
Plant Species Richness
"Species richness" may be defined as the number of species in a plant association, in this case in a site of riparian vegetation. A cumulative total of 50 plant species was recorded by the ground study at 51 Central Valley riparian sites. Most are listed in table 3. As indicated earlier, there are considerably more than 50 riparian plant species in the Central Valley. The survey was not, however, designed to locate the rarer ones, nor any, common or rare, that were groundcover species.
There is no way of knowing with certainty what plant species were present, or in what numbers, during earlier periods, for measurements are lacking. One of the few comparative approaches presently available is to utilize species richness counts from the most intact of the remaining riparian systems. The selection of non-random sites in the study design was a conscious attempt to provide this quasi-natural kind of baseline information.
Caswell State Park (site 12), San Joaquin County, and Sweetwater Creek (site 36), El Dorado County, both yielded 19 woody plant species using study procedures, the largest number. These were both relatively intact riparian systems with very high plant diversity indices and high riparian bird species richness. Wyman Ravine at Lower Wyandotte Road (site 41), Butte County, produced 18 species of woody plants. This site is a perennial stream floodplain that had been dredged for gold and is now vegetatively recovering. Its high species richness appeared to derive from the highly diverse nature of the substrate, where the floodplain and its ponds, swales, and dredge tailings are all watered by a small perennial stream. It also had one of the highest plant diversity indices.
Space does not permit a full discussion of species richness by site, although much can be learned from such evidence. There was a wide range of species richness between sites, indicating, as do the data on vegetation diversity, that there was very little similarity between the different riparian systems. The numbers of species (or species richness) in shrubcover, understory, and canopy of different sites are listed in table 4. The four "vegetation" columns list the number of sites where a given number of plant species (left column) occurs. The three sites where no (0) species occur had only a groundcover stratum.
Again the interesting fact emerges that on 35 sites there were no understory species at all (i.e., understory was absent). Where understory did occur, it was comprised of very few species. The wide range in species richness for canopy is also noteworthy.
| ||||||||||||||||||||||||||||||||||||||||||||||||||||||||||||||||||||||||||||||||||||||||||||||||||||||||||||||
Plant Diversity
"Plant diversity," as used here, is the total structural and floristic heterogeneity within a vegetation. In nature, plant diversity has many components, more than we can count and probably more than we can identify. For purposes of the present study, the following protocol for measuring plant diversity was used.
It will be recalled that four structural strata were identified by the inventory: groundcover, shrubcover, understory, and canopy. In the site transect surveys where a transect sample-point was established every 3 m., each sample-point yielded information on the taxon, or structural type (when present), for each stratum. This taxon could be a species or a more general descriptor such as "grass." A vegetation such as a closed-canopy forest may have all four strata present; in this case there would be four scores—one for each stratum—at that transect sample-point. Thus groundcover, shrubcover, understory, and canopy taxa were recorded wherever present at each sequential sample-point along a transect, the aggregate of several transects providing a three-dimensional structural matrix.
For the purposes of the study, plant diversity resulted when one transect-point stratum reading was followed by a dissimilar one on either the vertical axis (vertical diversity component) or the horizontal axis (horizontal diversity component). For example, if for the groundcover stratum a transect sequentially recorded: "grass - grass - forb - woody litter – berryvine – berryvine," the horizontal diversity score would be 1 (grass-forb) + 1 (forb-woody litter) + 1 (woody litter-berryvine) = 3 horizontal diversity points. If the vertical readings were: "grass – poison oak – elderberry – Fremont cottonwood," the vertical diversity score would be 1 (grass-poison oak) + 1 (poison oak-elderberry) + 1 (elderberry-Fremont cottonwood) = 3 vertical diversity points. This procedure, while a simplification of the real world complexity of natural vegetations, permits the development of a quantitative structural and floristic index of plant diversity in both horizontal and vertical axes.
The results of an analysis of plant diversity for the 51 ground-study sites are presented in figure 11. This is actually a scatter diagram, where the vertical diversity component is plotted on the vertical axis of the graph and the horizontal component plotted on the horizontal axis. The further to the right a point is, the greater the horizontal plant diversity component at that site; the higher on the y axis, the greater the site's vertical plant diversity component. Thus the higher and to the right that a point is, the larger that site's total plant diversity score.
Clearly, there is great variation in plant diversity between sites. Systems range in structural and floristic design (and hence plant diversity) from moist, grassy swales with a few sedges and no shrubs or trees, to narrow linear stringers of riparian vegetation along small spring-fed
Figure 11.
Plant diversity scores for 51 Central Valley riparian sites.
creeks, to closed-canopy gallery forests. Surprisingly, the narrow stringer system often exhibited a high total plant diversity. This resulted from the intermixing of riparian and upland plant species. Another way of describing these narrow, perennial and intermittent stream riparian corridors or stringers is to say that they are almost pure ecotone; that is, they are so narrow that there is no inner core or "interior" of strictly riparian vegetation. Preliminary studies of riparian birds associated with these stringers suggests that despite this high plant diversity, narrow ecotonal riparian stringers do not support the greatest bird species richness. That is found in the larger systems having a combination of greater amounts of core or interior and more purely riparian vegetation conditions.
The great array of riparian system plant diversity illustrated in figure 11 reflects both the local geophysical and biogeographic circumstances of the systems and their individual histories of human-use impact. The three sites of highest plant diversity were: 1) Ladd Creek at Road 200 (site 26), Madera County, a small but complex perennial stream system below a small earthfill dam in the Sierra foothills; 2) Wyman Ravine at Lower Wyandotte Road (site 41), Butte County, a small perennial stream system on a broad floodplain with a partially closed canopy and well along in recovering from gold dredging, again in the Sierra foothills; and 3) Mooney Island on the Sacramento River (site 52), Tehama County, a mature cottonwood grove on the bank of
the river. The two sites of lowest plant diversity were Dry Creek Swale at Academy (site 10), Fresno County, a grassy swale with perennial seepage and no woody vegetation; and Sandy Mush Road at Healy Road (site 5), Madera County, a small valley floor stream that has been channelized to carry runoff (and possibly agricultural) water.
At the Sandy Mush Road site, the cottonwood/willow stringer vegetation had been largely removed for channel clearance and other less obvious reasons. The Dry Creek Swale site has been exposed to livestock grazing since the latter 1800s, suppressing all but grazing-resistant groundcover plants such as grass, clover, and sedges.
Human-Use Impact
The massive changes in surface hydrology and land-use practices since European settlement of the Central Valley were been briefly discussed earlier in this paper. The large areas of riparian vegetation displaced by cultivated agriculture are now so completely altered from their indigenous form that only the underlying substrate—the moist soil "riparian zone"—remains of the original system. For such grossly modified systems, it is impossible to assign a condition descriptor other than "completely altered." For those remnant systems still retaining riparian vegetation, most exhibited low plant diversity and other symptoms of chronic overuse such as lack of reproduction of woody species, low plant species richness, intrusion of xeric upland species, areas of bare ground, and unstable and eroding streambanks or continuing progressive encroachment of cultivated agriculture.
Condition and Condition Trend
Assessing condition and condition trend for Central Valley riparian systems presented several problems. The first was that of ownership pattern. Many riparian lands in the study area are privately owned. On some watercourses, there may be 10 or more riparian landowners per linear mile. Each parcel has a unique land-use history, and one often sees sharp differences in structure, floristics, plant diversity, and condition on sequential parcels. With such a linear mosaic, it is difficult even to set meaningful study site boundaries.
Second, actual condition trends are determined by human decisions on present and future land-use practices far more than on natural ecological patterns of reproduction and succession. A luxuriant riparian forest may be completely removed and replaced with cultivated agriculture or fenced pasture in a matter of days. Livestock numbers on open range change with market prices and precipitation-controlled forage production. Obtaining such data would require interviews with landowners and assessment of public policies and programs.
Third, surface hydrology changes are still taking place. Dams are still being built, more water being diverted, groundwater levels fluctuating more widely or being drawn down progressively further. For example, construction of the proposed dam on the Cosumnes and Tuolumne rivers would greatly alter the hydrology of thousands of hectares of downstream riparian zone. Flood control projects with their engineering works continue. These and other factors not readily discernible from single-visit field studies render condition-trend predictions from such studies somewhat speculative.
Because of these imponderables, only a simple condition-trend evaluation was undertaken. Study sites were rated for condition on the basis of present kind and intensity of human use, degree of disruption to the natural system, and apparent level of commitment to present land-use practices. Three scores were possible: 1) recovering; 2) stable; and 3) degrading. Table 5 presents the resulting condition scores.
| ||||||||||||||||||||
It must be concluded that on both privately and publicly owned riparian lands, the overall condition pattern is one of continued degradation for most remnant riparian systems. The 20% recovering rating for public lands includes preserves owned by conservation organizations. These were considered public rather than private because of their communal nature. Were this not done, the two sets of scores would be almost identical.
These figures are quite similar to condition assessment values developed independently by Katibah, Dummer, and Nedeff (1983) for a larger set of 178 riparian sites, including the 53 sites reported here, from remote-sensing data. They found that for the CRSP Central Valley study area, 8.1% of riparian sites were recovering, 25.4% were stable, 37.9% were still being degraded, and 28.6% were so severely degraded that no assessment of possible recovery could be made.
Three conclusions concerning condition and condition trend seem inescapable. First, no Central Valley riparian system has escaped the destructive impacts of direct and/or indirect humanuse practices. Over 90% have been so altered as to be unrecognizable as riparian systems, either structurally or ecologically. Second, of those
remnant systems that are still sufficiently intact as to be assessable, all show significant perturbations due to human-use impacts. Third, about 8–11% of the remnant systems are recovering, 17–25% are stable, and 67–72% are still being degraded by ongoing destructive human-use impacts.
Conclusions
Central Valley riparian wetlands once occupied some 0.8–1.2 million hectares (2–3 million acres) of the Central Valley. Direct and indirect human-use impacts have reduced that amount by over 90%. Major causes of this decline have been changes in surface hydrology, displacement by cultivated agriculture, livestock grazing, and physical developments within the riparian zone. An inventory methodology developed for the CRSP demonstrated that quantification of structure, floristics, size-frequency, plant diversity, and other riparian system variables was possible and could be undertaken in a costeffective and time-efficient manner. Some of the findings generated by the methodology as applied to 51 riparian sites are listed below.
1. Each riparian system is hydrologically, structurally and vegetatively unique.
2. This site-specific uniqueness derives from both environmental and human-use impact influences.
3. Groundcover-type and amount varied widely between sites.
4. Understory, as a functional component of Central Valley riparian systems, is uncommon and probably of limited ecological significance.
5. There is extreme variation in plant diversity between systems, with no evidence of natural types or categories of systems readily demonstrable on the basis of structure or plant diversity.
6. 50 species of woody plants were recorded, with willow (species) being the most common (35 sites), followed by Fremont cottonwood (28 sites), valley oak (20 sites), Oregon ash (18 sites), and wild grape, poison oak, and white alder (13 sites each).
7. Of these major riparian species, valley oak, Fremont cottonwood, and California sycamore all showed aberrant size-frequency patterns, indicating impaired reproduction and consequent lack of recruitment into their populations.
8. Observed major causes of these aberrant size-frequency patterns include livestock grazing and modification of surface and groundwater hydrology.
9. Condition trend assessment indicated that of the remnant riparian systems in the Central Valley, 8–11% are recovering, 17–25% are stable, and 67–72% are still being degraded by ongoing destructive human-use impacts.
There is both bad news and good news in this report. The bad news is that we have already lost most of our Central Valley riparian wetlands and the remainder are under heavy and unremitting siege by both private and public entities. The good news is that we: 1) are now finally alerted to the ongoing tragedy of their decimation; 2) are able to quantitatively inventory and monitor their most important variables; and 3) are thus prepared to embark on sound management and restoration programs capable of returning those still-remaining riparian wetlands to ecologic and economic productivity.
Some of the problems, such as the lack of reproduction in major riparian tree species, will require special study. Return to the presettlement landscape, with its vast and prodigiously productive immensity of riparian wetlands is of course neither possible nor desirable. But it is both desirable and possible to stop the continuing slide of this resource, and those species dependent upon it, toward extinction. Indeed, the laudable goal set by the California Legislature for our aquatic wetlands—doubling their size by the year 2000—is equally laudable, and attainable, for our remnant riparian wetlands.
Acknowledgments
I thank Kevin Dummer for his willingness to thrash through poison oak thickets and blackberry brambles in the pursuit of field data. I thank Kathy Hendrix for her generous assistance in preparing this paper. Major support for the study was provided by the Denver Wildlife Research Center, USDI Fish and Wildlife Service; that financial support is gratefully acknowledged. Charlene Hensley, Sara Denzler, and Eda Lim provided valuable data reduction and processing. Philip Law and John Geibel of the Statistical Resources Group, DFG, Menlo Park, provided thoughtful consultation and computer facility support. Michael Barbour, Jack Major, Glen Holstein, and Tom Griggs contributed valuable botanical counsel, although they must not be held accountable for any aspect of this report. Stimulating planning sessions with Robert Colwell, Ed Katibah, Steve DeGloria, and others of the Remote Sensing Research Group, University of California, Berkeley, are remembered with pleasure. Thanks and gratitude to all of those, mentioned or not, who contributed toward this effort.
Literature Cited
Anderson, B.W., and R.D. Ohmart. 1977. Vegetation structure and bird use in the lower Colorado River Valley. p. 23–24. In : R.R. Johnson and D.A. Jones (tech. coord.). Importance, preservation and management of riparian habitat: A symposium. [Tucson, Arizona, July 9, 1977.] USDA Forest Service GTR-RM-43, Rocky Mountain Forest and Range Experiment Station, Fort Collins, Colo. 217 p.
Bonner, K.G., L.D. Bowden, and R.R. Colwell. 1979. Riparian vegetation mapping and inventory design. (Draft.) Final report of work performed for the California Department of Fish and Game, Standard Agreement DFG-S-1729. Remote Sensing Research Program, Department of Forestry and Conservation, College of Natural Resources, University of California, Berkeley. 93 p.
California Department of Public Works. 1931(a). Sacramento Valley basin. Bull. No. 26, Division of Water Resources. California Department of Public Works, Sacramento.
California Department of Public Works. 1931(b). San Joaquin Valley basin. Bull. No. 29, Division of Water Resources. California Department of Public Works, Sacramento.
Carothers, S.W., R.R. Johnson, and S.W. Aitchison. 1974. Population structure and social organization of southwestern riparian birds. Amer. Zool. 14:97–108.
Central Valley Riparian Mapping Project. 1979. Interpretation and mapping systems. Report prepared by the Riparian Mapping Team, Geography Department, California State University, Chico, in cooperation with the Department of Geography, California State University, Fresno. 24 p. Unpublished manuscript on file with the Planning Branch, California Department of Fish and Game, Sacramento.
Conard, S.A., R.L. MacDonald, and R.F. Holland. 1977. Riparian vegetation and flora of the Sacramento Valley. p. 47–55. In : A. Sands (ed.). Riparian forests in California: Their ecology and conservation. Institute of Ecology Pub. No. 15, University of California, Davis. 122 p.
Durrenberger, R.W., and R.R. Johnson. 1976. California: Patterns on the land. 134 p. California Council for Geographic Education, Mayfield Publishing Company, Palo Alto, Calif.
Gaines, D. 1977. The status of selected riparian forest birds in California. A preliminary survey and review. Report to the California Department of Fish and Game, Sacramento. Unpublished manuscript. 72 p.
Harvey, H.T., H.S. Shellhammer, and R.E. Stecker. 1980. Giant sequoia ecology. Fire and reproduction. Scientific monograph Series No. 12, USDI, National Park Service, Washington, D.C. 182 p.
Hubbard, J.P. 1977. Importance of riparian ecosystems: Biotic considerations. p. 14–18. In : R.R. Johnson and D.A. Jones (tech. coord.). Importance, preservation and management of riparian habitat: A symposium. [Tucson, Arizona, July 9, 1977.] USDA Forest Service GTR-RM-43, Rocky Mountain Forest and Range Experiment Station, Fort Collins, Colo. 217 p.
Jain, S. 1976. Vernal pools—their ecology and conservation. Institute of Ecology Pub. No. 9, University of California, Davis. 93 p.
Johnson, R.R., L.T. Haight, and J.M. Simpson. 1977. Endangered species vs. endangered habitats: A concept. p. 68–79. In : R.R. Johnson and D.A. Jones (tech. coord.). Importance, preservation and management of riparian habitat: A symposium. [Tucson, Arizona, July 9, 1977.] USDA Forest Service GTR-RM-43, Rocky Mountain Forest and Range Experiment Station, Fort Collins, Colo. 217 p.
Johnson, R.R., and D.A. Jones (tech coord.) 1977. Importance, preservation and management of riparian habitat: A symposium. [Tucson, Arizona, July 9, 1977.] USDA Forest Service GTR- RM-43, Rocky Mountain Forest and Range Experiment Station, Fort Collins, Colo. 217 p.
Katibah, E.F. 1983. A brief history of riparian forests in the Central Valley of California. In : R.E. Warner and K.M. Hendrix (ed.). California Riparian Systems. [University of California, Davis, September 17–19, 1981.] University of California Press, Berkeley.
Katibah, E.H., K.J. Dummer, and N.E. Nedeff. 1983. Current condition of riparian resources in the Central Valley of California. In : R.E. Warner and K.M. Hendrix (ed.). California Riparian Systems. [University of California, Davis, September 17–19, 1981.] University of California Press, Berkeley.
Katibah, E.F., N.E. Nedeff, and K.J. Dummer. 1983. Summary of riparian vegetation areal and linear extent measurements from the Central Valley riparian mapping project. In : R.E. Warner and K.M. Hendrix (ed.). California Riparian Systems. [University of California, Davis, September 17–19, 1981.] University of California Press, Berkeley.
Korte, P.A., and L.H. Fredrickson. 1977. Loss of Missouri's lowland hardwood ecosystem. Contribution from the Gaylord Memorial Laboratory, University of Missouri, Columbia, and the Missouri Agricultural Experiment Station, Proj. 170. Journal Series No. 7766:1.
Küchler, A.W. 1977. The map of the natural vegetation of California. p. 909–938. In : M.G. Barbour and J. Major (ed.). Terrestrial vegetation of California. John Wiley and Sons, New York, N.Y. 1002 p.
Major, J. 1951. A functional, factorial approach to plant ecology. Ecology 32:392–412.
McGill, R.R., Jr. 1975. Land use changes in the Sacramento River riparian zone, Redding to Colusa. California Department of Water Resources, Northern District Report. 23 p.
McGill, Robert R., Jr. 1979. Land use change in the Sacramento River riparian zone, Redding to Colusa. An update—1972 to 1977. California Department of Water Resources, Northern District. 34 pp.
Mueller-Dombois, M., and H. Ellenberg. 1974. Aims and methods of vegetation ecology. 547 p. John Wiley and Sons, New York, N.Y.
Roberts, W.G., J. G. Howe, and J. Major. 1977. A survey of riparian forest flora and fauna in California: p. 3–19. In : A. Sands (ed.). Riparian forests in California: Their ecology and conservation. Institute of Ecology Pub. No. 15, University of California, Davis. 122 p.
Sands, A. (ed.). 1977. Riparian forests in California. Their ecology and conservation. Institute of Ecology Pub. No. 15, University of California, Davis. 122 pp.
Smith, F. 1977. A short review of the status of riparian forests in California. p. 1–2. In : A. Sands (ed.). Riparian forests in California: Their ecology and conservation. Institute of Ecology Pub. No. 15, University of California, Davis. 122 p.
Thompson, J. 1957. The settlement geography of the Sacramento-San Joaquin Delta, California. Ph.D. Dissertation, Stanford University, Palo Alto, Calif.
Warner, R.E. 1979. California riparian study program. Background information and proposed study design. California Department of Fish and Game, Sacramento. 177 pp.
Warner, R.E., and K.M. Hendrix. In press. Riparian resources of the Central Valley and California Desert: A report on their nature, history, status, and future. California Department of Fish and Game, Sacramento.
Warner, R.E., and Edwin F. Katibah. 1981. Measurement techniques for inventorying riparian systems. p. 487–494. In : H.G. Lund, M. Caballero, R.H. Hamre, R.S. Driscoll, and W. Bonner (ed.). Arid land inventories: Developing cost-effective methods. [La Paz, Mexico, November 30–December 6, 1980.] USDA Forest Service GTR-WO-28, Washington, D.C. 620 p.
Zeiner, D.C. 1983. A plan for protecting, enhancing, and increasing California's wetlands for waterfowl. Unpublished draft manuscript. California Department of Fish and Game, Sacramento. 80 p.