Predictions Based on Theory
It is evident from our experiment results that one can employ theoretical physics to make accurate predictions for hydrovolcanic explosions (for example, Buchanan, 1974). One prediction that is strongly supported by the energy measurements shown in Fig. 1.21 is the relationship of explosive energy to water:magma mass ratios. In Chapter 1, we outlined a method for quantifying explosive energy that is based on thermodynamics: the method assumes that magma and water reach thermal equilibrium before explosive expansion of the water. By using a temperature-entropy diagram (Fig. 2.32), one finds that—depending upon the temperature and entropy of the initial equilibrium point—expansion of water can follow one of several thermodynamic paths. The most complex of these paths occurs during its expansion, when water maintains a temperature similar to that of the hot magma fragments. In this case, the simple isentropic expansion of water is not followed; instead expansion has a strong isothermal component that is determined by the mass ratio of magma fragments entrained and in thermal contact with the water during expansion.
As is shown in Fig. 2.32, expansion of a high-pressure mixture of water and magma may take place in the steam dome, the
Fig. 2.28
Log efficiency (the ratio of steam mechanical energy to melt thermal energy) as a function of the
median grain diameter in fragmented melt. Small-scale (several grams of melt) laboratory
experiments (

and coarser grain sizes than large-scale (100 kg of melt) experiments (hatched) performed
by Wohletz and McQueen (1984). Data fall within theoretical ranges of heat flux to steam from
thermite melts (bold lines). Maximum measured laboratory heat fluxes (Buchanan, 1974) indicate
resulting grain diameters between 0.125 and 0.004 mm.
Fig. 2.29
Log reciprocal cooling time vs grain diameter
and log specific surface area. The shaded area
represents times predicted by conductive cooling
models; the circular fields show ranges of median
grain diameters for common hydrovolcanic
bedforms: F = fallout, P = planar, M = massive,
and S = sandwaves. Median grain diameters for
magmatic eruptions are commonly in the lapilli
range, and the onset of vapor-explosion
decrepitation of grain size is idealized near grain
diameters of 1.0 mm.
(Adapted from Wohletz, 1983.)
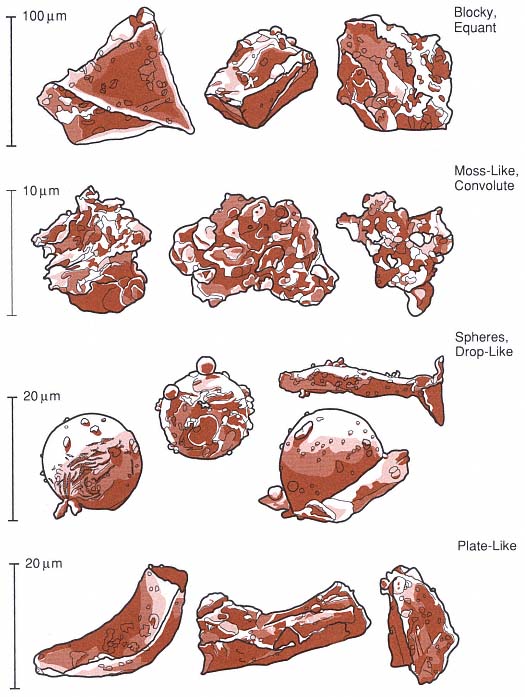
Fig. 2.30
Sketches of four types of grain shapes observed during experiments in hydrovolcanism. Blocky and
plate-like grains are thought to be produced by brittle failure of the melt when it is subjected to
strong stress waves. Moss-like, drop-like, and spherical grains are likely produced by fluid
instabilities at water/melt interfaces:
(Adapted from Wohletz, 1983.)
Fig. 2.31
Oxygen isotopic ratio [Eq. (1-10)] vs Rm
(water:melt ratio) shows the strong depletion
of heavy oxygen (18 O) observed in experimental
products (

with water (

that if the oxygen isotope ratio can be confidentially
measured for hydrovolcanic materials, Rm can be
constrained. However, the effects of
weathering and the temperature at which
isotopes are exchanged in volcanic products
can complicate isotope measurements.
(Adapted from Taylor and Wohletz, 1985.)
superheated steam field, or both. Expansion within the steam dome (saturated) results in wet-steam explosions, which are of lower energy than those in the superheated field. Wohletz (1986) showed that for saturated expansions, the steam fraction (x2 ) of the ejected water in the eruption (which forms eruption columns and pyroclastic flows and surges) is calculated by
where xe = the steam fraction at initial thermal equilibrium, Te = the temperature of that equilibrium [Te = (mw Cvw Tw + mm Cm Tm )/(mw Cvw + mm Cm )], mw and mm = the mass of water and magma, respectively, Cpw and Cvw = water's specific heats at constant pressure and constant volume, respectively, Cm = the magma specific heat, T2 = 373 K (assuming saturated expansion to
Fig. 2.32
Temperature-entropy diagram for vapor expansion in hydrovolcanic eruptions. From
its initial state (

it is in thermal equilibrium with magma. With decompression, the water expands
along one of several paths, maintaining thermal equilibrium with fragmented magma,
to its final state (

liquid, two-phase (2f ), and vapor fields are indicated, as are points a'[where a super-
critical water and tephra mixture expands into the two- phase (steam dome) field] and
b' [where the mixture expands out of the two-phase field into the superheated steam
(vapor) field]. The four expansion paths shown constrain the amount of magma heat
converted to steam expansion work; these paths are determined by the initial water:
magma mass ratio. (Adapted from Wohletz, 1986.)
1 bar), and Hlv = the enthalpy of water vaporization. For superheated expansions, the final temperature (T2 ) is given by
where f = (mw Cpv + mm Cm )/mw R, R = the gas constant, and expansion occurs from the initial pressure of thermal equilibrium (pe ) to p2 = 1 bar (atmospheric) pressure.
In practice, one finds that expansion might proceed from the superheated field into the saturated field—or the reverse—making the calculation more complicated. The conversion efficiency or ratio (ec ) of the magma's thermal energy to explosive kinetic energy (the explosive efficiency) is found by dividing
the change in the water/magma mixture's internal energy (D Umix ) by the magma's initial thermal energy [mm Cm (Tm -298)], where
for superheated expansion, xe = x2 = 0.0 and Vlv = the volume change from liquid to vapor. This calculated value gives the maximum theoretical efficiencies for the semi-isothermal cases (Wohletz, 1986) of water expansion, in which the expanding water maintains the same temperature as the entrained pyroclasts. Figure 2.33 shows a plot of those efficiencies as a function of water:magma mass ratios (logarithmic) in which maximum explosive efficiencies are reached where ratios are between 0.1 and 1.0 (about equal volumes of water and magma). Figure 2.33 also provides a comparison of this efficiency curve in which the mass fraction of water condenses from the expanding mixture (1-x2 ). It is apparent that for eruptions of maximum energy, all water is converted to superheated steam, but with increasing amounts of water, energy gradually decreases and saturated liquid content rises sharply. For mass ratios >2.0, eruptions are very wet and most of the high-pressure vapor condenses to liquid as pressure decreases to atmospheric levels. At that point, the erupted tephra, usually wet and sticky, forms lahars during emplacement.
Building on the theoretical arguments of Colgate and Sigurgeirsson (1973), Wohletz (1986) described how growth of what are termed Rayleigh-Taylor and Kelvin-Helmholtz instabilities controls the heat transfer rates and grain sizes of magma fragments during hydrovolcanic eruptions. The interface between water (liquid and vapor) and magma can be unstable if the lighter fluid accelerates toward or across the heavier one. In the case of Rayleigh-Taylor instabilities, when the interface becomes perturbed, wavelets grow in amplitude (ht ) with time as ht = cosh(na t), where na is a function of acceleration, wave number, fluid densities, surface tensions, and viscosities. This instability growth occurs only when the wavelet size is greater than a critical wavelength (lcrit ; Bellman and Pennington, 1954):
where s s = the surface tension of the magma, a = the acceleration of the water toward the magma surface (imparted by collapse of a vapor film), and rw and rm = the water and magma densities, respectively. If a spectrum of l larger than l crit grows and detaches to form magma fragments, the most abundant fragment sizes are Ö 3 lcrit , and a characteristic bell-shaped size-frequency distribution results.
After an initial period of instability during which water and magma are mixed, vapor explosion may occur by superheat vaporization (Fauske, 1973) or thermal detonation (Fauske, 1977; Board et al ., 1975; Rabie et al ., 1979). Superheated water may remain in a metastable state until it attains its spontaneous nucleation temperature at ~570 K (Reid, 1976). After heat transfer raises the water temperature to that point, homogeneous vaporization causes a spontaneous vapor explosion. In the case of thermal detonation, a shock wave propagating through the coarsely mixed magma and metastable water leaves a fine fragmentation of magma and sudden vapor expansion in its wake; this sequence of events is analogous to classical Chapman-Jouguet detonation (Courant and Friedrichs, 1948).
During thermal detonation, the shock wave differentially accelerates the water and magma phases and fragments the magma in proportion to the relative velocity (urel ) between the two phases. For a particular combination of density, initial magma fragment size, drag coefficient, and surface tension, the differential acceleration causes magma fragmentation in less time than is
Fig. 2.33
Theoretically calculated condensed water fraction and maximum isothermal efficiencies vs Rm .
The fraction of initial water that condenses to liquid after magma/water interaction increases with
Rm,, and at Rm = 3.0, little or no steam remains after interaction with magma and
expansion to atmospheric pressure.
required for the two phases to reach velocity equilibrium. If this situation occurs, the detonation is sustained; however, several factors can mitigate this process, including divergence of the shock wave, mixture inhomogeneities, and reflected waves. Wohletz (1986) approximated final magma fragment sizes (rm ) resulting from thermal detonation during water/magma interaction as
for which urel is predicted by Chapman-Jouguet theory (Landau and Lifshitz, 1959) and D Rm is the absolute value of the difference between the water:magma mass ratio and its optimum explosive ratio (~0.3). In general, both the fluid instability/superheating and thermal detonation theories predict the fine grain sizes observed in hydrovolcanic tephra (Fig. 2.20).
The tephra deposit textures of dry and wet surges, pyroclastic flows, and lahars strongly depend on the wetness of erupted materials. Figure 2.34 is a plot of the water volume fraction of hydroclastic deposits as a function of the initial mass ratio of water interacting with magma during the eruption. The plotted curve is based on the assumption that all condensed steam is emplaced with the tephra. Eppler (1984), Pierson (1986), and Arguden and Rodolfo (1990) recently reviewed lahar formation with specific attention to the tephra deposit water contents required. Where the pore water content of deposits increases beyond 20 to 30% by volume, tephra deposits are very cohesive and can maintain the steep bedding planes typical of wet surge deposits. If deposit water content nears saturation (within a few percent of total pore space—50 to 60% by volume), tephra deposits behave like a Bingham fluid and move as lahars (Eppler, 1984). This behavior is predicted for hydroclastic tephra that are produced by eruptions whose water:magma mass ratio is >1.0. Because a great deal of steam can separate from the tephra in the eruption plume before tephra emplacement, the Rm values on the x-axis of
Fig. 2.34
Volume fraction of liquid water in tephra deposits of hydrovolcanic origin as a function of Rm .
Where Rm is <0.4 deposits are dry; where Rm is >0.4 but <1.0, deposits are wet and very cohesive;
and where Rm is >1.0, tephra deposits can contain enough liquid water to behave like lahars.
Fig. 2.34 are the minimum required for the observed tephra deposit texture.
Because the steam formed during hydrovolcanic eruptions progressively decompresses, cools, and condenses during tephra emplacement, tephra in flows and surges become wetter with increasing runout distance (time) from the vent. Whereas most dry, superheated steam might separate from tephra during emplacement of surges and flows, saturated steam gradually condenses on individual pyroclasts; therefore, tephra emplaced with saturated steam is likely to become wet and sticky—as field observations verify. This hypothesis suggests that some hydroclastic tephra deposits might show facies changes with increasing distance from the vent: dry surges near the vent, wet surges at intermediate distances, and lahars in distal parts of the deposit. This facies distribution and the corresponding runout distance of tephra deposits should be sensitive to the wetness of the eruption and the water:magma mass ratio. At one extreme, dry eruptions are expected to produce surges and flows of dry facies types over the total runout distance; at the other extreme, very wet eruptions, such as those observed at Surtsey, might expel laharic tephra.
To evaluate this wet/dry facies hypothesis, we calculate the temporal change in water vapor density with expansion—from an initial high-pressure, high-temperature state (denoted by the subscript e in above calculations) to saturated or superheated steam at atmospheric pressures. This change in water vapor density is further promoted by the cooling that occurs as surges or flows entrain cold air. From the continuity equation, we write:
for one dimension (r) in which rg = the water (liquid or gas) density, ve = the ejecta
velocity, and t = time. The approach taken to solve Eq. (2-15) is analytical to make use of as much field data as possible. We calculate the first term (the temporal derivative) on the left side of this equation by using the chain rule to evaluate four related derivatives. A solution for mass conservation is achieved when the product of these derivatives is balanced by the value of the second term (the advective derivative) in this equation.
A numerical procedure was written to calculate the solution for various initial mass ratios, erupted volumes, and runout conditions. The runout is based on energy line approximations (Sheridan, 1979; Malin and Sheridan, 1982); initial velocities are constrained by the collapse height of the erupted column or, in the case of blast eruptions, the multiphase sound speed of the steam/tephra mixture (Kieffer and Sturtevant, 1984). The partial derivatives required for the temporal term of Eq. (2-15) include
In the expressions of these derivatives, rb and rp = the bulk density of the pyroclastic flow (or surge) and particle densities, respectively; qp = the particle volume fraction; the gas density = rg = (rb - qprp )/(1 - qp ); a and vo = the flow acceleration and initial velocity, respectively; and rr = the radial runout of the flow (rf = the final runout distance), which is dependent on the flow volume (V). The flow volume is, in turn, temporally dependent upon ideal behavior of the gas, for which pVg = t = constant; g = the isentropic exponent that varies with qp (Kieffer and Sturtevant, 1984); and p is assumed to decrease linearly with time.
Equation (2-16) models the expansion of gas as a function of qp : the gas attains atmospheric pressure as qp increases to a level at which grains are in continuous contact (qp = 0.6). Equation (2-17) models the radial increase of qp , as discussed in Wohletz and Sheridan (1979) and as numerically modeled by Valentine and Wohletz (1989). The radial runout distance of the flow is given as a function of flow volume in Eq. (2-18); rb cannot be greater than 1.5 Mg/m3 . Finally, the flow volume shown in Eq. (2-19) is an expanded differential form of the ideal gas equation.
The product of [Eqs. (2-13) through (2-16)] can be integrated with time for solutions converging to equal -¶rg ve /¶ r (note: ¶rg ve /¶ r = ¶rg /rg¶ r + ¶ ve /ve¶ r) for continuity. The results of such an analysis are considered only semiquantitative, but they provide a conceptual model for water vapor condensation in a pyroclastic flow or surge. Figure 2.35 illustrates the results for pyroclastic flow deposits of 1 and 10 km3 volumes. This model has only been field tested qualitatively, and two important assumptions are implicit in the above analysis: (a) the bulk density of the flow or surge is always dependent upon the local water (liquid/vapor) density, which ignores depositional effects, and (b) qp decreases from a minimum near the vent to a maximum of 0.6 at the distal reaches of the deposit.
Fig. 2.35
Conceptual results of condensation calculations, based upon solution of Eqs. (2-16) through (2-19),
depict the runout distances of tephra deposits of 1- and 10-km3 volume from respective
vents of 0.1- and 0.5-km diameter as a function of Rm . The transitions from dry to wet to laharic
deposits occur at varying distances from the vent, depending on the amount of steam
that cools and condenses within pyroclastic flows and surges.
The preceding discussions have outlined some of the predictions theory provides for water/magma interaction. Water: magma ratios are strongly tied to the energy of hydrovolcanic eruptions and are manifested by volcanic landforms, the degree of tephra dispersal, tephra grain sizes and alteration, and textural features of deposit wetness. Quantification of these manifestations serves to constrain the thermal energy and water abundance in a volcanic system. These factors are fundamental criteria for evaluating the likelihood that a geothermal system has developed within and/or near a volcanic area. The following discussions illustrate geothermal applications of hydrovolcanic theory.