Seven—
Seismographic Recording at Berkeley (1887–1987)
Robert A. Uhrhammer
Introduction
The University of California has operated a seismographic station network since 1887. During the past century the equipment at the stations has evolved from low-magnification mechanically recording instruments to the latest generation of broadband instrumentation utilizing digital telemetry and recording. Currently, the Seismographic Stations house a wide range of instrumentation designed to record various aspects of ground motion from local, regional, and distant events. This is necessary for the timely and routine analysis of recorded earthquakes. On an average day Station personnel analyze fifteen to twenty events, ranging in size from small local earthquakes to major teleseisms.
The first section below describes the instrumentation chronology at Berkeley and Mt. Hamilton in detail, and the current instrumentation and recording at all stations in the network as an overview. The next section covers the evolution of broadband instruments in the Berkeley network, leading up to the current Berkeley Digital Seismograph Network (BDSN) instrumentation. The last section shows examples of records from the BDSN station at Mt. Hamilton and an example of a large teleseism recorded by one vertical-component and five three-component broadband stations in the Berkeley network.
Observatory Instrument Chronology
The Seismographic Stations began operation in April 1887 with the installation of Ewing instruments at Mt. Hamilton and Ewing and Gray-Milne instruments at Berkeley (Louderback, 1942; Dewey and Byerly, 1969). These two stations have operated continuously since then, with improvements in
| |||||||||||||||||||||||||||||||||||||||||||||||||||||||||||||||||||||||||||||||||||||||||||||||||||||||||||||||||||||||||||||||||||||||||||||||||
| ||||||||||||||||||||||||||||||||||||||||
| ||||||||||||||||||||||||||||||||||||||||||||||||||||||||||||
instrumental equipment from time to time (shown in tables 1 and 2) as development of the science and opportunity permitted. During the past century the instruments at Berkeley have been housed in vaults at the Students Observatory, Doe Library, Bacon Hall, Haviland Hall, Earth Sciences Building, Memorial Stadium, and the Byerly Vault (BKS). Currently, the Seismographic Stations operate instruments at eighteen stations in northern and central California, as shown in figure 1 and table 3. For details on the instrumental parameters and response curves, refer to Bolt and Miller (1975) and to the semiannual Bulletin of the Seismographic Stations (e.g., Darragh et al., 1986).
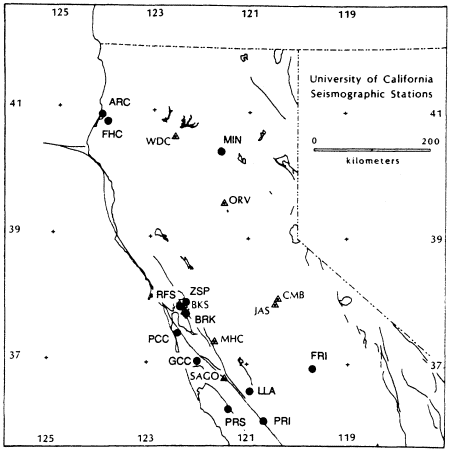
Figure 1
Map showing locations of seismographic stations in the University of
California Berkeley network (1987). Broadband stations are indicated
by triangles. BKS, CMB, and MHC are digitally recorded.
| ||||||||||||||||||||||||||||||||||||||||||||||||||||||||||||||||||||||||||||||||||||||||||||||||||||||||||||||||||||||||
A wide range of instrumentation is operated at the stations, along with several methods of recording, as shown in table 4. Four of the stations (ARC, BKS, MHC, and MIN) house standard Wood-Anderson torsion seismographs, which have operated continuously for fifty to sixty years. Most of the stations have short-period vertical instruments. Five stations house three-component broadband instrumentation, discussed in detail in the next section. Whiskeytown has a vertical-component broadband seismometer with five signals telemetered to Berkeley. The Richmond Field Station houses a unique, continuously telemetered and recording nine-component borehole accelerometer array. The accelerometers are at the surface and at depths of 15 m and 47 m in the Bay mud, with the bottom instruments on the basement shale. They are recorded at 0.01 g and 0.5 g full scale with a 50-Hz bandwidth. Berkeley itself has the widest range of instrumentation, as indicated in table 1.
Several methods are used to record signals from the instruments (table 4). Eleven stations record on helicorders using heat-sensitive paper. These stations are used for the daily listing of events and for routine analysis. The Wood-Anderson, Worldwide Standardized Seismographic Network (WWSSN), and ultralong-period instruments record photographically on paper. The standard Wood-Anderson torsion seismograms are used to determine local magnitude. All analog telemetered signals are continuously recorded on analog tape that can be digitally sampled for analysis on microcomputers. Three stations (BKS, CMB, and MHC) house broadband instruments that are digitally telemetered and recorded. Analog tape and digital signals are dubbed onto tapes and cartridge disks for archiving. Most of the short-period vertical signals are also recorded on develocorder film, which is useful for rapidly timing phase onsets and locating events. In addition, Berkeley has instruments that record ink on paper (a Benioff vertical 100 kg) and on smoked paper (a Wiechert horizontal 160 kg). The Wiechert instrument was originally at MHC (1911–1930). Other instruments operated at Berkeley include a microbarograph (circa January 1963) and a creepmeter across the Hayward fault in Memorial Stadium (since October 7, 1965).
Observatory Broadband Instrument Chronology
Beginning in 1963, a network of broadband seismographs evolved at the Seismographic Stations (University of California, Berkeley) in northern and central California (see semiannual Station Bulletins for response curves). By May 1987 the network of broadband seismographs had expanded to six stations, three with analog telemetry and recording (Oroville—ORV, San Andreas Geophysical Observatory—SAGO, and Whiskeytown—WDC) and three with digital telemetry and recording (Berkeley—BKS, Columbia College—CMB, and Mt. Hamilton—MHC).
| ||||||||||||||||||||||||||||||||||||||||||||||||||||||||||||||||||||||||||||||||||||||||||||||||||||||||||||||||||||||||||||||||||||||||||||||||||||||||||||||||||||||||||||||||||||||||||||||||||||||||||||||||||||||||||||||||||||||||||||||||||||||||||||||||||||||||||||||||||||||||||||||||||||||||||||||||||||
In 1973, installation of a three-component set of ultra-long period (ULP) seismometers in the Byerly Seismographic Vault (BKS) was completed. These Sprengnether S-5100 seismometers (T0 = 100 s) use electronic recentering feedback for long-term stability (plus temperature and barometric feedback for the vertical component). The response of ground-velocity records on photographic paper is equivalent to T0= 100 s, Tg = 300 s, with a magnification of 500 at T0 .
Beginning in September 1975, low-gain (± 2 mm) and high-gain (± 0.02 mm) displacement signals from each of the three components at BKS were recorded on 0.03-inches-per-second, 0–10-Hz, FM magnetic tape. Since 1980, displacement signals from the three ULP seismometers have been digitized at ninty-nine samples per second with a resolution of 16 bits (96 dB), telemetered to the laboratory and recorded on magnetic tape at a density of 5,120 bits per inch. The least significant bit is equivalent to 0.25 micrometers of boom displacement, and the system response is flat to ground displacement from 0.01 Hz to 25 Hz.
The Whiskeytown (WDC) seismograph, installed in January 1973, consists of a Sprengnether S-5100 vertical seismometer in a sealed pressure vessel operating at T 0 = 40 s, and with a damping ratio of 0.70. Five signals (low-gain and high-gain displacement and velocity and filtered short period) are FM telemetered to the Berkeley analog tape recorders.
Equipment was installed at Oroville (ORV) in 1979 to telemeter three-component broadband velocity signals from Geotech 7505 and 8700 seismometers (T0 = 15 s) to Berkeley. In February and March 1986 a three-component set of Streckeisen broadband seismometers was installed.
At the San Andreas Geophysical Observatory (SAGO or SAO), the central vault was instrumented in March 1968 with Sprengnether S-5000 (WWSSN type) three-component long-period (T0 = 30 s) seismometers. Displacement signals (0–10 Hz) were recorded on an on-site 0.06 inches per second magnetic tape recorder with a ± 10 mm full-scale range. The on-site tape recording was discontinued in October 1981. On November 20, 1985, (Z) and June 11, 1986, (NS, EW) Streckeisen broadband seismometers were installed, and their signals are now transmitted via FM telemetry to Berkeley.
A digital seismographic system (part of the USGS Digital Worldwide Standardized Seismographic Network system) was installed at Jamestown (JAS) in September 1980. The filtered outputs of Teledyne SL 210 and SL 200 seismometers are recorded with 16-bit resolution on 1,600-bit-per-inch magnetic tape. As a telemetry experiment on the use of commercial telephone lines, the USGS Albuquerque Seismological Laboratory designed hardware for a 2,400-bit-per-second telemetry link from JAS to Berkeley. In 1982, the control and recording part of the DWWSSN JAS station was installed at Berkeley (150 km west of JAS). In November 1986 the equip-
ment was placed in a new permanent vault at Columbia College (CMB, 11 km NNE of JAS).
In spring 1985 a three-component set of Streckeisen broadband seismometers was installed at the Mt. Hamilton station (MHC) with FM telemetry to Berkeley. In October 1986 the MHC analog recording was converted to the PC-based broadband digital system described by Bolt et al. (1988), and in May 1987 an identical digital system at the BKS vault was connected. The BDSN system flow is shown in figures 2a and 2b. The BDSN was designed to meet a number of requirements. Each remote station provides broadband three-component and a short-period vertical component signals. The recording is continuous and on-scale for moderate local earthquakes (ML< 5), large regional earthquakes (ML < 7), and major teleseisms. Modular construction permits simple incorporation of new components into the system as technology advances. Automatic restart allows unattended operation of the remote station. Most of the hardware is commercially available and relatively inexpensive. The hardware components are integrated by a set of three machine language programs that provide the necessary common interface.
Examples of BDSN Seismograms
The dynamic-range and bandwidth capabilities of BDSN recordings are illustrated in figure 3 where a small (ML = 1.7) local earthquake was recorded simultaneously with the surface waves from a large (Ms = 6.8) teleseism. The events have dominant periods of 0.37 s and 23 s respectively and are thus readily separable by convolution or filtering.
Figure 4 shows the spectrum of a local earthquake (ML = 3.1, D = 12 km) recorded by the MHC broadband digital seismograph. The inset waveform is the transverse-component (clockwise up) displacement time history (10-s record). Note the presence of the near-field ramp commonly observed on broadband displacement seismograms for D less than 20 km. The upper curve is the spectrum of the inset seismogram, and the lower curve is the spectrum of a 10-s noise sample immediately preceding the event. The signal-to-noise ratio is approximately 50 dB (a factor of about 300) in the 1–2-Hz frequency band. The steep slope at 5 Hz is due to the 10-pole low-pass anti-aliasing filter.
Calculation from the asymptotic low-frequency spectrum level of 6,500 nanometer-seconds yields a seismic moment of 1.7 × 10²¹ dyne-cm. This earthquake is a factor of five below full scale on the 16-bit telemetry system in the spectral domain at 1–2 Hz. It follows that the largest events that can be recorded on scale at 18 km are ML

A strong regional earthquake, M L = 5.2, recorded at MHC is shown in figure 5. This earthquake occurred adjacent to the Parkfield segment of the San Andreas fault and serves to indicate the seismic ground-motion ampli-
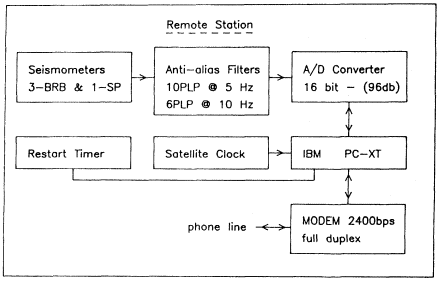
Figure 2a
Remote-station block diagrams showing principal hardware components.
The A/D converter and the restart timer plug into the PC system bus,
while the clock and modem connect to asynchronous serial ports.
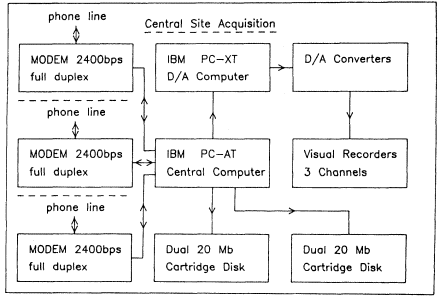
Figure 2b
Central-station block diagram showing principal hardware components.
The D/A converters and the cartridge disk drives plug into the
PC system bus, while the modems attach to asynchronous serial
ports. All components are available commercially.
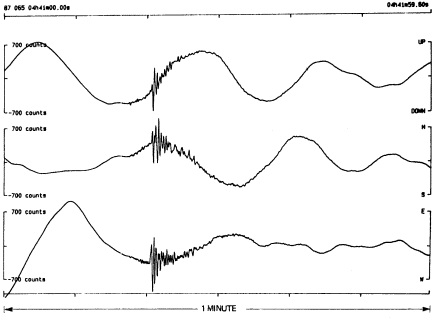
Figure 3
Bandwidth and dynamic range illustrated by a ML = 1.7 local earthquake
(D = 22 km) superimposed on the surface waves from a Ms = 6.8 teleseism
(D = 58°). Full scale (700 counts) corresponds to 18.75 micrometers/second
ground velocity.
tude expected in a characteristic Parkfield earthquake (Ellsworth et al., 1987). The MHC broadband system should remain on scale for earthquakes up to M L = 5.8 in the Parkfield area.
Figure 6 shows the records from a large teleseism (Ms = 7.1 ) that occurred in the Santa Cruz Islands on July 6, 1987. This was the first major earthquake recorded by the Berkeley broadband network since the new BDSN digital equipment has been in operation at BKS and MHC. The MHC, ORV, and SAO traces are from Streckeisen STS-1 instruments (broadband velocity output), the WDC (vertical component only) and BKS traces are from Sprengnether S-5100 series instruments, and the CMB traces are from Teledyne SL 200 and SL 210 instruments. All traces are derived from velocity outputs except for BKS which has displacement outputs. Note the similarity in the body-wave traces and the differences in the surface wave envelopes.
Acknowledgment
The diligence of Seismographic Stations personnel in compiling the tables and preparing the figures is appreciated.
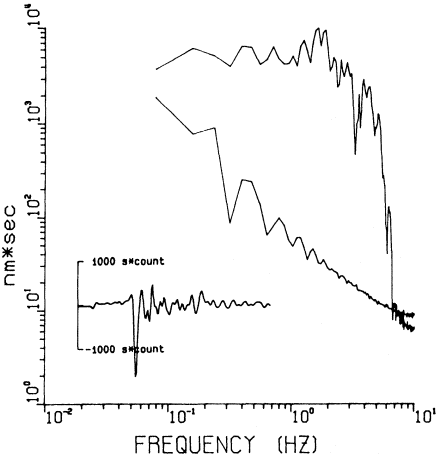
Figure 4
Example of digital waveform recorded at MHC and its associated spectra for a
small local earthquake (ML= 3.1, D = 12 km). The noise spectrum (lower curve)
is from the 10 seconds immediately preceding the event. Full scale (1000
count–seconds) corresponds to 0.54 millimeters ground displacement.
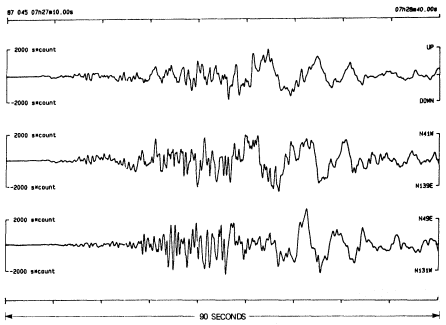
Figure 5
A strong regional earthquake (ML= 5.2, Coalinga area, D = 194 km, 14 Feb 1987)
recorded at MHC. The time series has been integrated and is flat to ground
displacement from 0.05 Hz to 5 Hz. Full scale (2000 count–seconds)
corresponds to 1.07 millimeters ground displacement.
References
Bolt, B. A., J. E. Friday, and R. A. Uhrhammer (1988). A PC-based broadband digital seismograph network. Geophysical Journal, 93: 565–573.
Bolt, B. A., and R. D. Miller (1975). Catalog of Earthquakes in Northern California and Adjoining Areas: 1 January 1910–31 December 1972. Seismographic Stations, University of California, 563 pp.
Darragh, R. B., M. R. McKenzie, and R. A. Uhrhammer (1986). Bulletin of the Seismographic Stations, University of California, 55, 1 & 2: 88.
Dewey, J., and P. Byerly (1969). The early history of seismometry (to 1900). Bull. Seism. Soc. Am., 59: 183–227.
Ellsworth, W. L., L. D. Dietz, J. Frechet, and G. Poupinet (1987). Preliminary results of the temporal stability of coda waves in central California from high-resolution measurements of characteristic earthquakes. In Proceedings of Workshop XXVII, The Physical and Observational Basis for Intermediate-term Earthquake Prediction. U.S. Geol. Surv. Open-file Report 87–591, 440–460.
Louderback, G. D. (1942). History of the University of California Seismographic Stations and related activities. Bull. Seism. Soc. Am., 32: 205–230.
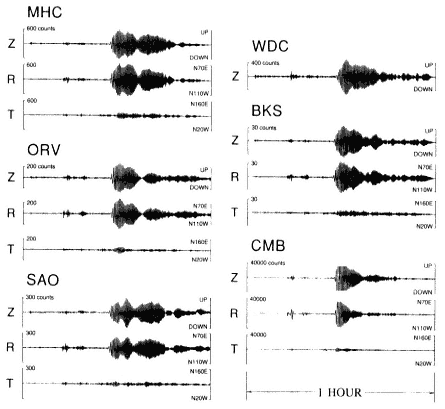
Figure 6
Example of a large teleseism (Ms = 7.1, Santa Cruz Islands, D = 82°, 6 July 1987)
recorded by one vertical-component and five three-component broadband stations
in the Berkeley network. The horizontal components have been rotated to radial
and transverse, and the traces are scaled to the maximum vertical amplitude.