Five—
Large-Scale Processing and Analysis of Digital Waveform Data from the USGS Central California Microearthquake Network
W. H. K. Lee and S. W. Stewart
In 1966 the U.S. Geological Survey (USGS) began to install a microearthquake network along the San Andreas fault system in central California. Its main objective was to develop techniques for mapping microearthquakes in order to study the mechanics of earthquake generation (Eaton, Lee, and Pakiser, 1970). The network was designed to telemeter seismic signals from field stations to a recording and processing center in Menlo Park, California. Its instrumentation has been described by Lee and Stewart (1981).
By 1987, this network had grown to over 350 stations in northern California (fig. 1) and is believed to be the largest local earthquake network in the world. At present, about 500 channels of seismic signals are being monitored in real time as some stations send in one high-gain vertical-component signal and three low-gain three-component signals. We also receive seismic signals from some stations operated by the USGS, Pasadena; University of Nevada (UNV), Reno; Lawrence Livermore Laboratory (LLL); California Division of Mines and Geology (CDMG); California Division of Water Resources (CDWR); and University of California (UC), Berkeley.
The purpose of this paper is to describe briefly the present data acquisition and processing system, and to summarize our current effort in processing and analyzing waveform data. The volume of data we handle is huge and required special attention.
CUSP Data Acquisition and Routine Processing
The CUSP (Caltech-USGS Seismic Processing) system consists of on-line real-time earthquake waveform data acquisition routines, coupled with an off-line set of data reduction, timing, and archiving processes. It is a complete system for processing local earthquake data in that all processing steps fol-
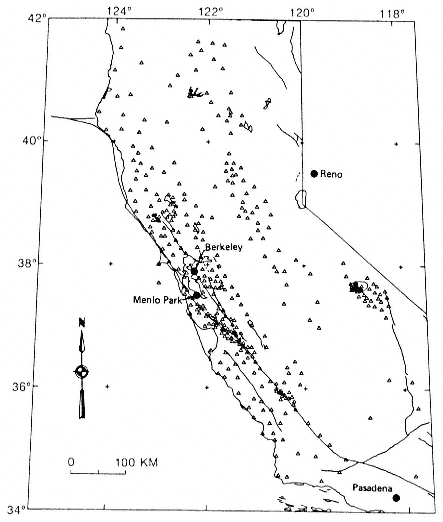
Figure 1
Seismic stations monitored on-line by the CUSP system at the U.S. Geological
Survey, Menlo Park. Some selected stations operated by the California Department
of Water Resources, California Division of Mines and Geology, California
Institute of Technology, Lawrence Livermore National Laboratory, University
of California (Berkeley), and University of Nevada (Reno) are also included.
lowing detection of the seismic event, to final cataloging, archiving, and retrieval of data, are scheduled and verified by the CUSP system.
CUSP is an evolutionary outgrowth of previous systems designed and developed by Carl Johnson while at Caltech and then with the USGS in Pasadena, California (Johnson, 1979 and 1983). Various implementations of CUSP are now operating in southern California (Caltech-USGS, Pasadena), central California (USGS, Menlo Park), and Hawaii (Hawaiian Volcano Observatory). The version running in Menlo Park was modified considerably by Peter Johnson, Sam Stewart, Bob Dollar, and Al Lindh to meet the specific needs of our network. Hardware includes two PDP 11/44 computers made by Digital Equipment Corp. (DEC), two 512-channel analog-to-digital converters, four dual-ported magnetic disk drives, two 6250 BPI magnetic tape drives, a VERSATEC plotter, a line printer, real-time clocks, and several display terminals.
The CUSP system as implemented for the Central California Microearthquake Network was the first of its two DEC PDP 11/44 computers (referred to as 11/44A) for real-time, on-line earthquake detection and data acquisition (fig. 2). The 11/44A monitors up to 512 signals in real time and writes out digitized waveform data to magnetic disk storage for events it interprets to be seismic. Currently, 500 signals are digitized at 100 samples per second. About two or three times a day, the digitized waveform data of detected events are automatically transferred to the second DEC PDP 11/44 (referred to as 11/44B), where initial CUSP processing takes place. Such transfer is made possible by the use of dual-ported magnetic disk drives. While the waveform data are still on disk, earthquake events are timed by means of a CUSP-controlled interactive graphics timing system, and archiving and other functions are performed. The event waveform data are archived on high-density 6250 BPI magnetic tapes, and all data except the digitized waveform data are then transferred to a DEC VAX/750 computer for final data reduction. Thereafter, the complete data sets are available for general use on the DEC VAX/750 computer.
A primary design feature of CUSP is that "all" information known to CUSP about an earthquake is contained in one file, and the digitized traces associated with that earthquake are contained in a separate file. These are known as "MEM" files and "GRM" files, respectively (fig. 2). For reasons of rapid data-base manipulation, MEM files are written in a compact, database-specific format. For compact storage, GRM files are written in DEC integer binary format. MEM files are collected each day on a "Daily Freeze" tape, and GRM files are archived on "Arkive" tape(s). Each local earthquake timed and located on the DEC PDP 11/44B computer has a "TROUT" plot produced on a VERSATEC plotter. These plots are a summary of the hypocenter information along with a plot of the seismic traces that entered into the earthquake location solution. Daily Freeze tapes are
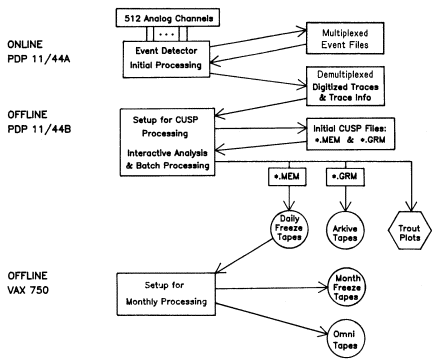
Figure 2
Schematic diagram showing the CUSP system processing steps and products.
combined each month into a "Monthly Freeze" tape. Also for each month, the hypocenter summary and phase data files in HYPO71 format (Lee and Lahr, 1975) and the station coordinate file are written on an "Omni" tape in DEC ASCII format for general use, especially on other computers.
The volume of data processed by the CUSP system is huge. Each year, about 15,000 earthquakes are routinely analyzed, and about 50 gigabytes of digital waveform data are archived. The system is remarkably robust. The off-line 11/44B computer is used as backup for the on-line 11/44A computer in case of emergency or routine hardware maintenance. Data loss occurs rarely and is usually due to electric power fluctuation or failure. System uptime is better than 99.7 percent. Because the station coverage is sparse in places, event coverage is not uniform throughout the network area, especially near the edges. Nevertheless, statistical analysis indicates that records of seismic events occurring within the network are complete for magnitude 1.5 and greater. Figure 3 shows the earthquake epicenters as determined by the CUSP system for 1984–1986. Most earthquake activity is along the San Andreas fault system and in the Coalinga and Long Valley area (due to after-
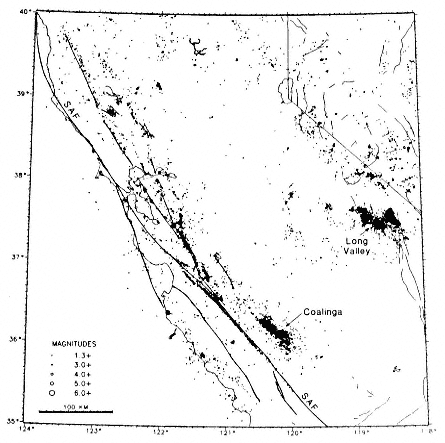
Figure 3
Map showing the earthquake epicenters as determined by the CUSP
system for the period 1984–1986. SAF denotes the San Andreas fault.
shocks of the 1983 Coalinga earthquake and the 1984 Round Valley earthquake). Epicenters are systematically displaced to the west from the San Andreas fault trace because of the simplified crustal model used in the routine location of earthquakes. Systematic bias also may be seen on other faults (not named in fig. 3).
Setting up CUSP Data for External Processing
The CUSP system was designed and is used for the systematic detection, processing, and cataloging of data from earthquakes that occur within a seismic telemetry network. Its configuration is optimized for rapid processing of many local events. In its present form, the CUSP system is not intended for
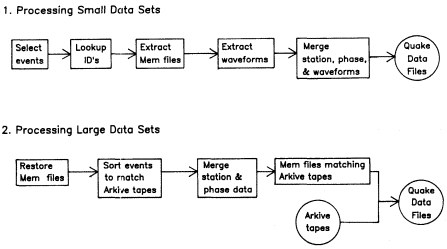
Figure 4
Two schemes for setting up CUSP data for processing
outside the CUSP computing environment.
use as a research tool. Furthermore, CUSP data are optimized for use in the CUSP environment on DEC computers. Because of the limited computer facilities at the USGS, advanced processing and analysis of moderate to large quantities of seismic waveform data usually have to be carried out on more powerful general computers outside the CUSP computing environment. For this reason, we have implemented two schemes for setting up CUSP data for external processing.
Figure 4 illustrates the two schemes, one for processing "small" data sets and the other for processing "large" data sets outside the CUSP environment. "Small" means a few hundred earthquakes requiring about ten high-density 6250 BPI magnetic tapes to store their waveform data. "Large" means several tens of thousands of earthquakes requiring about 1,000 high-density tapes. The goal of both schemes is to produce an earthquake data file that has all the data for a given earthquake in a form that can be read by any computer. A typical earthquake data file contains about five megabytes. The earthquake data file is organized in a manner described by Lee, Scharre, and Crane (1983). It is designed to be complete, that is, containing index information, a description of the data, specifications of all data formats, recording stations, and earthquake summary, phases, and waveform data. In other words, all the necessary data for studying a particular earthquake are contained in its earthquake data file.
Traditionally, earthquake data are organized in a manner suggested by the nature of the data. For example, instrumentaion and operational information is contained in the station files, arrival times and amplitudes in the
phase files, and digital waveform data in the trace files. Description and format for these files are usually written on paper and sometimes included in publications. However, there is a tendancy to update station files and phase files, introduce new formats, move data files onto different computers, and lose paper notes. Before long, it is almost hopeless to reconstruct a complete data set for a group of earthquakes. In view of this difficulty, when working outside the CUSP environment, we have chosen to put all the necessary information for an earthquake into one independent data file.
Coda Processing and Analysis
In the past several years, there has been considerable interest in studying coda waves from local earthquakes and, in particular, estimating the quality factor Q using coda waves (Herrmann, 1980; Singh and Herrmann, 1983; Biswas and Aki, 1984; Jin, Cao, and Aki, 1985; Novelo-Casanova et al., 1985; Scherbaum and Kisslinger, 1985; Jin and Aki, 1986; Lee et al., 1986; Novelo-Casanova and Butler, 1986; Sato, 1986; Rogers et al., 1987; and Peng et al., 1987). Laboratory experiments indicate that microfracturing should occur prior to earthquakes. Because fractures greatly attenuate seismic waves, temporal variation of coda Q may be a useful precursor for earthquake prediction.
According to Aki and Chouet (1975), the coda amplitude A

where c (w ) represents the coda source factor, a is a constant that depends on geometrical spreading, and Q is the quality factor. By performing linear regression of ln(At a ) versus t , we may obtain Q–1 from the slope of fit, b , by

where f is the frequency in cycles/second.
Lee et al. (1986) began a systematic study of coda Q using the CUSP data from the Central California Microearthquake Network (fig. 5A). For this type of study, the digitized seismic waveform data (100 samples/second), together with auxiliary data such as origin time, hypocenter location, and magnitude, are first organized as earthquake data files in the manner described by Lee, Scharre, and Crane (1983). Using this scheme, we can select any station record from any earthquake with ease because the computerized system keeps track of the data records. For a selected earthquake, a record section is generated with the seismic traces arranged by increasing epicentral distance. From this record section, a data analyst decides whether or not this earthquake has a sufficient number of "good" stations (usually twenty or
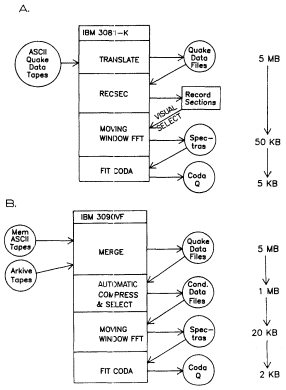
Figure 5
(A) Coda-processing scheme at the SLAC Center (top);
(B) coda-processing scheme at the IBM Center (bottom).
more) and decides which station records have high enough signal quality to be processed.
Judgment of signal quality is rather subjective: for our study, "good" station records were those with coda amplitudes several times larger than the noise amplitudes preceding the earthquake, and station signals with spikes were rejected. For each selected station, a fast Fourier transform was performed on the data in overlapping moving windows for the entire station record. The resulting power spectra were then corrected for instrument response, and spectral averages over five consecutive octave frequency bands (centered at 1.5, 3, 6, 12, and 24 Hz) were obtained for each window. Typically, we used a window size of 512 data samples (corresponding to 5.12 s) and advanced the window by 2.56 s.
To avoid contamination by body and surface waves, only coda data collected at lapse times greater than twice the S travel time were included in the
analysis, following the criterion for a common decay curve given by Rautian and Khalturin (1978). We then corrected the coda amplitude for geometrical spreading using Sato's (1977) formula, which is appropriate for coda waves in the near field. The logarithm of the corrected spectral amplitude was linearly related to the lapse time according to the single back-scattering theory of coda waves, that is, equation (1), and Q–1 was then calculated from equation (2). We commonly performed linear regressions in four coda time windows (10 to 25 s, 20 to 45 s, 30 to 60 s, and 50 to 100 s) to estimate Q–1 .
The procedure described above was performed using an IBM 3081 mainframe computer at the Stanford Linear Accelerator Center (SLAC) as shown in figure 5a. This computer is powerful enough to allow all the analysis in the interactive mode, that is, the computer keeps up with the actions taken by the analyst. Typically, five megabytes of input data for an earthquake are reduced to two kilobytes of results.
The SLAC procedure was designed to process "small" data sets of a few hundred earthquakes and to allow the analyst to quickly modify the program for particular research needs. However, it is not efficient for processing "large" data sets of tens of thousands of earthquakes. For "large" data sets, we are implementing a scheme using an IBM 3090 model 200/VF supercomputer at the IBM Palo Alto Scientific Center, as shown in figure 5b. First, MEM files are restored back to the CUSP data base on our VAX 750 computer, and events are sorted to match the order of the event on a given Arkive tape. Station and phase data are extracted from the CUSP data base and then written on an ASCII formatted tape. This MEM ASCII tape and the corresponding Arkive tape are taken to the IBM Center and put onto an on-line disk storage device. Data from these two tapes are merged into earthquake data files.
Each earthquake data file contains the relevant information about the particular earthquake (hypocentral location, magnitude, etc.) and a large number of digitized seismograms from the recording stations. The automatic selection of stations is based on their location with respect to the epicenter and the quality of their signals. For stations within an appropriate epicentral distance for the event magnitude, we compare the background noise level with the amplitude level for the P and S waves and also with a portion of the coda. If the signal-to-noise ratio is not greater than 4 for the P and S waves and 2.5 for the coda, the seismogram is rejected. The length of the seismogram is also trimmed to twice the length of the coda expected theoretically for the event magnitude.
Because the CUSP system is extremely conservative in saving digital waveform data and generates more data than necessary for waveform analysis, it is possible to greatly reduce the amount of data by the above procedure. This is demonstrated in figure 6. Here, several traces with low seismic energy or with high noise are eliminated, and the excess pre-event and postevent
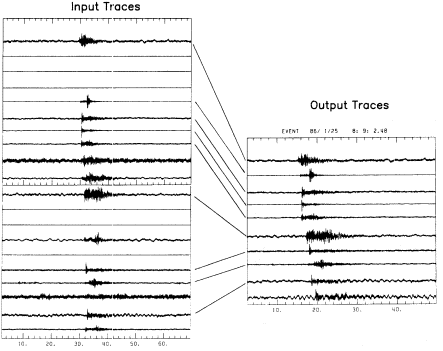
Figure 6
An illustration of automatic compression and selection of waveform traces.
data from "good" traces are trimmed. Actually, figure 6 shows seismic traces arranged according to increasing epicentral distance and illustrates data from only the first twenty stations. Because seismic energy usually decreases with increasing epicentral distance, the number of "good" traces also decreases rapidly. In general, 80 percent of the raw data is eliminated through such automatic selection and compression.
Some Selected Results on Coda Attenuation
Table 1 summarizes the processed data sets. Results from the Long Valley data sets are described in Lee et al. (1986) and Peng et al. (1987). Results from the Big Bend area of California will be described in Peng's Ph.D. thesis. We have completed an analysis of a three-month period (April to June 1984) for all "good" earthquakes in central California. By "good" we mean an earthquake with "good" signals from at least twenty stations, or typically an earthquake with magnitude between 2 and 3, depending on the source location with respect to our network. We have also studied selected quarry blasts and nearby earthquakes for entirely different purposes. Because the coda-
| |||||||||||||||||||||||||||||||||||||||||||||
processing scheme at SLAC can be quickly modified for other research purposes, we have used it to study spectral differences between quarry blasts and nearby shallow earthquakes. We are just beginning a systematic processing of all CUSP digital waveform data since April 1984 at the IBM Center. Our aim is to determine the temporal and spatial variations of coda Q in central California. In addition, this processing will condense the CUSP archived data to a more manageable volume and also convert the data to a form that can be used more easily on other computers not running the CUSP system.
Discussion
The history of earthquake seismology suggests that major advances have been made shortly after an accumulation of sufficient amounts of seismic data of a quality that surpasses that of earlier data. For example, shortly after a few hundred seismographs were established around the world in the early 1900s, the gross structure of the earth's interior was quickly established. By the 1930s, determinations of seismic velocities, density, and other physical parameters for a spherical earth model were completed by Keith Bullen, Harold Jeffreys, and Beno Gutenberg. The establishment of the Worldwide Standardized Seismograph Network in the early 1960s (with seismograms readily available) enabled the study of global seismicity and focal mechanisms on a scale that was not previously possible. As a result, earthquake seismology made significant contributions to the theory of plate tectonics in the late 1960s.
Microearthquake networks became popular in the 1960s, and by now there are about 100 local earthquake networks worldwide. Because of the voluminous amount of data they generate, it is very difficult for network operators to keep up with the data. Early effort was concentrated in processing phase data and the precise location of earthquakes. The amount of phase data for the Central California Microearthquake Network, for example, is about twenty-five megabytes per year. A few years ago, various local
networks began to acquire digital waveform data. The amount of digital data suddenly increased 2,000-fold to about fifty gigabytes per year for the Central California Microearthquake Network. We are just learning how to cope with this vast amount of data, which requires special attention to data organization and the setting up of efficient data processing and analyses schemes. We hope that this present effort in large-scale processing and analysis will provide a foundation for the study of local earthquakes and earth structure in greater detail and for testings various hypotheses about earthquake generation.
Acknowledgments
The work described here was made possible by Carl Johnson's development of the CUSP system and the dedicated efforts of many of our colleagues at the USGS. In particular, we are indebted to Kathy Aviles, Bob Dollar, Peter Johnson, Shirley Marks, Gail Nishioka, Dean Tottingham, and Carlos Valdes. We thank the International Business Machines Corporation for generously providing the necessary computer facilities for our large-scale data processing and analysis under their Academic Research Support Program. We also thank Kei Aki and his students for collaboration, and Bruce Bolt for inviting us to present this paper at the Centennial Symposium of the UC Seismographic Stations.
References
Aki, K., and B. Chouet (1975). Origin of coda waves: Source, attenuation and scattering effects. J . Geophys. Res., 80: 3322–3342.
Biswas, N. N., and K. Aki (1984). Characteristics of coda waves: Central and south-central Alaska. Bull. Seism. Soc. Am., 74: 493–507.
Eaton, J. P., W. H. K. Lee, and L. C. Pakiser (1970). Use of microearthquakes in the study of the mechanics of earthquake generation along the San Andreas fault in central California. Tectonophys., 9: 259–282.
Herrmann, R. B. ( 1980). Q estimates using the coda of local earthquakes. Bull. Seism. Soc. Am., 70: 447–468.
Jin, A., and K. Aki (1986). Temporal change in coda Q before the Tangshan earthquake of 1976 and the Haicheng earthquake of 1975. J . Geophys. Res., 91: 665–673.
Jin, A., T. Cao, and K. Aki (1985). Regional change of coda Q in the oceanic lithosphere. J . Geophys. Res., 90: 8651–8659.
Johnson, C. E. (1979). Cedar—An approach to the computer automation of short-period local seismic networds. Ph.D. diss., California Institute of Technology, 332 pp.
——— (1983). CUSP—Automated processing and management for large, regional seismic networks (abstract). Earthquake Notes, 54: 13.
Lee, W. H. K., K. Aki, B. Chouet, P. Johnson, S. Marks, J. T. Newberry, A. S. Ryall,
S. W. Stewart, and D. M. Tottingham (1986). A preliminary study of coda Q in California and Nevada. Bull. Seism. Soc. Am., 76: 1143–1150.
Lee, W. H. K., and J. C. Lahr (1975). HYPO71 (revised): A computer program for determining hypocenter, magnitude, and first motion pattern of local earthquakes, U.S. Geol. Surv. Open-file Rept. 75–311, 116 pp.
Lee, W. H. K., D. L. Scharre, and G. R. Crane (1983). A computer-based system for organizing earthquake related data. U.S. Geol. Surv. Open-file Rept. 83–518, 28 pp.
Lee, W. H. K., and S. W. Stewart (1981). Principles and Applications of Microearthquake Networks. Academic Press, New York, 293 pp.
Novelo-Casanova, D. A., E. Berg, V. Hsu, and C. E. Helsley (1985). Time-space variation, seismic S-wave coda attenuation (Q–1 ) and magnitude distribution for the Pelatan earthquake. Geophys. Res. Lett., 12: 789–792.
Novelo-Casanova, D. A., and R. Butler (1986). High-frequency seismic coda and scattering in the northwest Pacific. Bull. Seism. Soc. Am., 76: 617–626.
Peng, J. Y., K. Aki, B. Chouet, P. Johnson, W. H. K. Lee, S. Marks, J. T. Newberry, A. S. Ryall, S. W. Stewart, and D. M. Tottingham (1987). Temporal change in coda Q associated with the Round Valley, California, earthquake of November 23, 1984. J . Geophys. Res., 92: 3507–3526.
Rautian, T. G., and V. I. Khalturin (1978). The use of the coda for determination of the earthquake source spectrum. Bull. Seism. Soc. Am., 68: 923–948.
Rogers, A. M., S. C. Harmsen, R. B. Herrmann, and M. E. Meremonte (1987). A study of ground motion attenuation in the southern Great Basin, Nevada-California, using several techniques for estimates of Qs , log A o , and coda Q. J. Geophys. Res., 92: 3527–3540.
Sato, H. (1977). Energy propagation including scattering effects, single isotropic approximation. J. Phys. Earth, 25: 27–41.
——— (1986). Temporal change in attenuation intensity before and after the eastern Yamanashi earthquake of 1983 in central Japan. J . Geophys. Res., 91: 2049–2061.
Scherbaum, F., and C. Kisslinger (1985). Coda Q in the Adak seismic zone. Bull. Seism. Soc. Am., 75: 615–620.
Singh, S., and R. B. Herrmann ( 983). Regionalization of crustal Q in the continental United States. J . Geophys. Res., 88: 527–538.