Blue-Collar Workers and the Federal Government
Presidential Elections and Political Party Identification
Blue-collar workers were a crucial part of the electoral coalition that Franklin Delano Roosevelt put together for the Democratic party. The current disaffection of blue-collar workers, especially of the skilled and better-paid blue-collar workers, from the Democratic party represents one of the major changes in American politics.
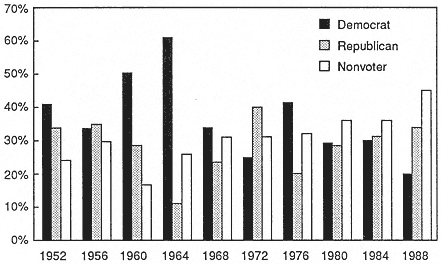
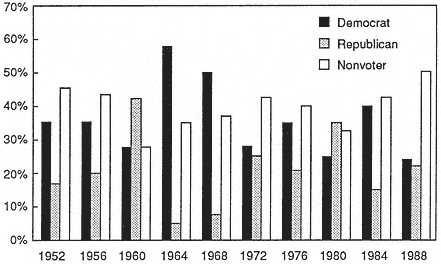
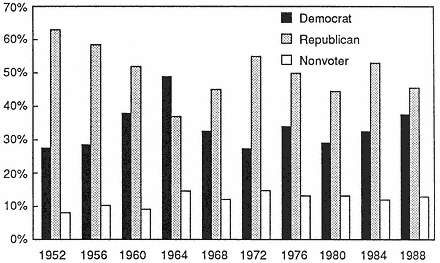
Skilled blue-collar workers voted, by a clear majority, for the Democratic candidate in five of the seven presidential elections that took place between 1952 and 1976 (1952, 1960, 1964, 1968, and 1976); they voted by a clear majority for the Republican candidate only once, in 1972 (see figure 8.3). Less-skilled blue-collar workers (defined here as all blue-collar workers except the skilled ones) also voted, by a clear majority, for the Democratic candidate in five of these seven elections, as shown in figure 8.4.[8] They too voted, by a clear majority, for the Republican candidate only once, in 1960. However in the three presidential elections since 1976, the picture is far less clear-cut. Skilled blue-collar workers voted Republican more heavily than Democrat in 1988, while splitting their vote about evenly between Democrats and Republicans in 1980 and 1984. Less-skilled blue-collar workers split their vote about evenly between Republicans and Democrats in 1988, voted more heavily Democrat in 1984, and more heavily Republican in 1980. By contrast, upper-white-collar workers have voted, by large majorities, for the Republican candidate in every election from 1952 to 1988, except for 1964, when they were clearly presented with an intolerable candidate in Barry Gold-water (see figure 8.5).
Figures 8.6 through 8.14 give a detailed analysis of the determinants of the blue-collar vote in the 1988 presidential election, showing that
8.3
Presidential Vote, 1952–88: Skilled Blue-Collar Workers.
8.4
Presidential Vote, 1952–88: Less-Skilled Blue-Collar Workers.
8.5
Presidential Vote, 1952–88: Upper-White-Collar Workers.
8.6
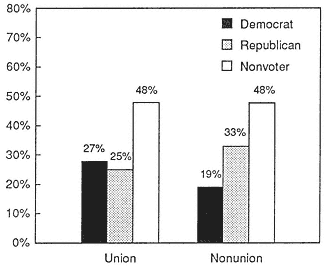
The 1988 Election: Effects of Union Membership
on the Blue-Collar Vote.
SOURCE : Based on figures from the logistic regression
model presented in the appendix to this chapter.
8.7
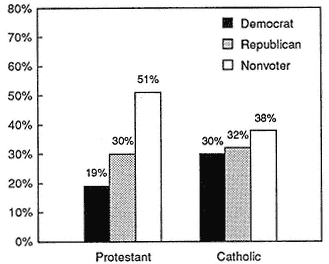
The 1988 Election: Effects of Religion on the Blue-Collar Vote.
SOURCE : Based on figures from the logistic regression
model presented in the appendix to this chapter.
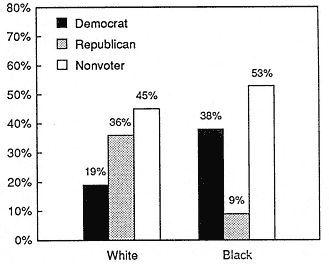
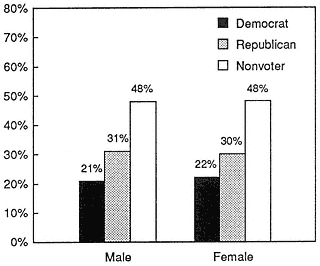
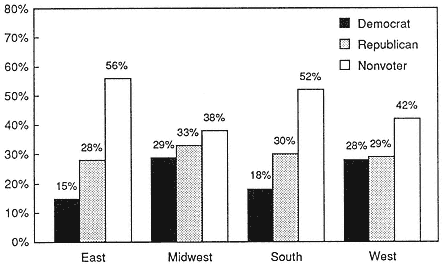
several of the traditional factors associated with voting Democratic still hold for blue-collar Americans. (These figures and figure 8.15 are based on a multivariate logistic analysis of the vote; see the appendix to this chapter for details.) Union members were more likely than non-union members to vote Democrat (figure 8.6). Blue-collar Catholics were more likely to vote Democratic than were blue-collar Protestants (figure 8.7).[9] Blue-collar blacks were more likely to vote Democrat than whites (figure 8.8). And as their income rises, the proportion of blue-collar workers voting Republican increases (figure 8.13). Notice, however, that the effect of region is now complex. Ironically, the voting profile of blue-collar workers in the East (controlling for such factors as religious differences) is now rather similar to that of blue-collar workers in the South (figure 8.10). Notice also that gender—not one of the factors traditionally associated with voting Democratic or Republican—still makes no difference. Male and female blue-collar workers are alike in their voting preferences (figure 8.9).
The movement of blue-collar workers away from Democratic presidential candidates in recent elections is paralleled by, and partly the result of, a tendency that is at least as striking—that of blue-collar workers not to vote at all in presidential elections.[10] Thus in 1980, 1984, and 1988, a larger percentage of skilled blue-collar workers did not vote than voted for either the Republican or Democratic candidate; and among
8.8
The 1988 Election: Effects of Race on the Blue-Collar Vote.
SOURCE : Based on figures from the logistic regression
model presented in the appendix to this chapter.
8.9
The 1988 Election: Effects of Gender on the Blue-Collar Vote.
SOURCE : Based on figures from the logistic regression
model presented in the appendix to this chapter.
8.10
The 1988 Election: Effects of Region on the Blue-Collar Vote.
SOURCE : Based on figures from the logistic regression model presented
in the appendix to this chapter.
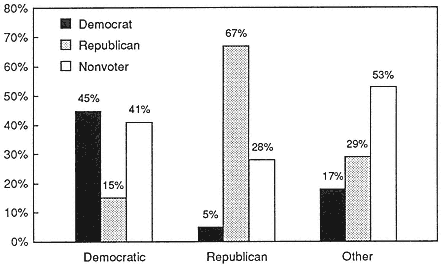
8.11
The 1988 Election: Effects of Party Identification on the Blue-Collar Vote.
SOURCE : Based on figures from the logistic regression model presented
in the appendix to this chapter.
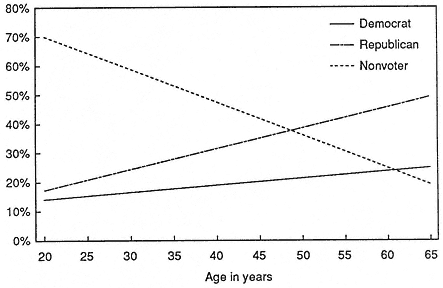
8.12
The 1988 Election: Blue-Collar Vote by Age in Years.
SOURCE: Based on figures from the logistic regression model
presented in the appendix to this chapter.
less-skilled blue-collar workers in four of the five elections from 1972 to 1988, a larger number did not vote than voted for either the Republican or Democratic candidate (see figures 8.3 and 8.4). Further, the proportion of blue-collar workers not voting in the 1988 presidential election was especially high (51 percent of less-skilled and 45 percent of skilled workers). More detailed analysis shows that age, income, and education are the most important determinants of whether blue-collar workers vote (see figures 8.12, 8.13, and 8.14). The younger they are, and the lower their income and level of education, the less likely they are to vote.
Figure 8.15 sums up this tendency of blue-collar workers not to vote. It shows the effect of occupation on the 1988 vote. controlling for race, union membership. religion, age, family income. region and gender. Blue-collar workers were about as likely as either of the white-collar groups to vote Republican, but much less likely than the upper-white-collar sector to vote Democratic, mostly because they were less likely than the upper-white-collar sector to vote at all.
The upper-white-collar sector is in sharp contrast to the blue-collar sector in the matter of voting. The percentage of upper-white-collar workers who did not vote was low in 1988 (only 14.1 percent)[11] and at no time in the period 1952–1988 was it higher than 15.3 percent (see figure 8.18).[12]
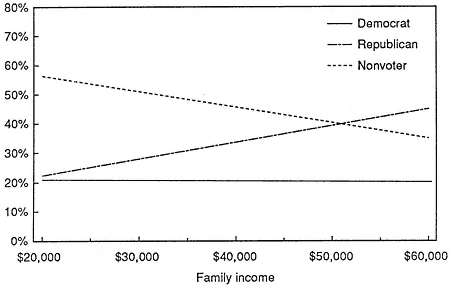
8.13
The 1988 Election: Blue-Collar Vote by Family Income.
SOURCE: Based on figures from the logistic regression model
presented in the appendix to this chapter.
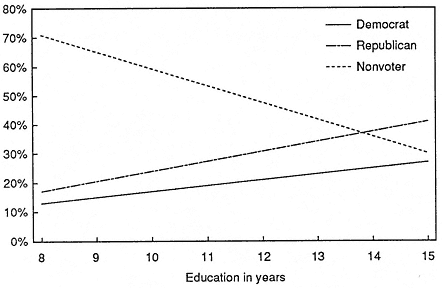
8.14
The 1988 Election: Effects of Education on the Blue-Collar Vote.
SOURCE: Based on figures from the logistic regression model presented
in the appendix to this chapter.
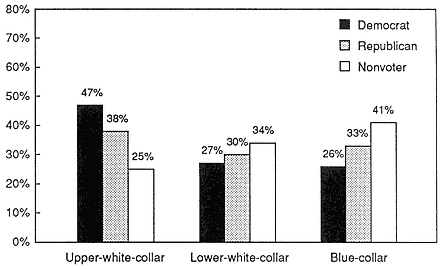
8.15
The 1988 Election: Effects of Occupational Status on the Presidential Vote.
SOURCE: Based on figures from the logistic regression model presented
in the appendix to this chapter.
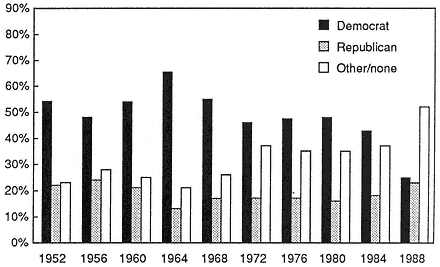
8.16
Party Identification, 1952–88: Skilled Blue-Collar Workers.
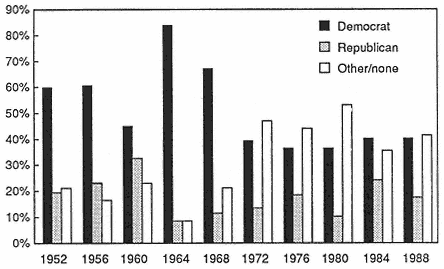
8.17
Party Identification, 1952–88: Less-Skilled Blue-Collar Workers.
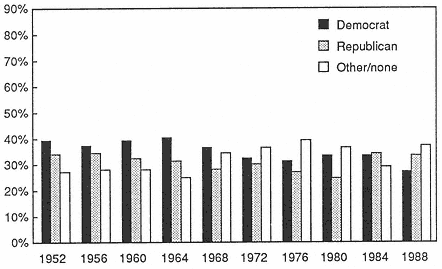
8.18
Party Identification, 1952–88: Upper-White-Collar Workers.
Changes in the political party identification of blue-collar workers since 1952 are also central. Blue-collar workers once identified in large numbers with the Democratic Party. For most of the time from 1952 to 1968, 60 percent or more of less-skilled blue-collar workers saw themselves as Democrats (the exception is 1960 for less-skilled blue-collar
workers), while only 20 percent or less saw themselves as Republicans (see figure 8.17). During most of the same period, 50 percent or more of skilled blue-collar workers saw themselves as Democrats, while only 25 percent or less saw themselves as Republicans (see figure 8.16). There have been two clear changes since 1972. First, a decline in the proportion of blue-collar workers identifying as Democrats (among the less-skilled, the proportion has hovered around 35 percent since 1972; among the skilled, it stabilized in the mid-forties until 1988, when it dropped sharply to 23 percent). The second change is a large increase in the proportion of blue-collar workers reporting no party identification (among less-skilled workers it is now about 40 percent; among skilled workers, it rose to about 38 percent in the period 1972 to 1984, and then climbed sharply in 1988). Interestingly, there has been no major shift of party identification toward the Republicans.
Attitude toward the Political System and Power Structure
The belief that government, including the federal government, is in the hands of a small number of organized groups who have unofficially usurped power is widespread and striking. This belief is common among blue-collar workers, though also among other occupational groups. When asked whether they thought the government was run for the benefit of everybody or for the benefit of a few big interests, 59 percent of blue-collar workers in 1984 answered that the government was run for the benefit of a few big interests. About the same percentage of Americans in upper-white-collar, lower-white-collar, and service-sector occupations agreed, as did 51 percent of housewives.[13]
Survey data going back to 1964 (when the question was first asked) suggest that this belief has been a fairly stable part of the political outlook of most Americans, including blue-collar workers. Thus in every election year except 1964, at least 40 percent of the entire population has believed that the government is run for a few big interests, and in five of the seven election years in this period more than 50 percent of the population has believed this. As in 1988, variation by occupation is not especially pronounced; blue-collar and upper-white-collar Americans both followed this trend from 1964 onward (see figures 8.19 and 8.20). The survey studies do not explore these beliefs further. For example, they do not ask the obvious follow-up question, namely, which are the "few big interests" for whose benefit so many blue-collar workers (and other Americans) believe the government is run. However, data from detailed case studies give an indication of an answer. A study of employees (almost all truck drivers) of a California company that delivers packages, a study of blue-collar and lower-white-collar Italians in Brooklyn, and a study of blue-collar chemical workers in New Jersey, all came to similar conclusions.[14] The vast majority of blue-collar workers believe that Big
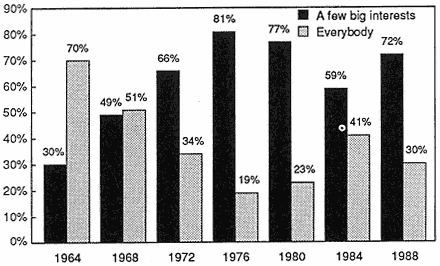
8.19
Who Benefits from Government, 1964–88: Blue-Collar Workers.
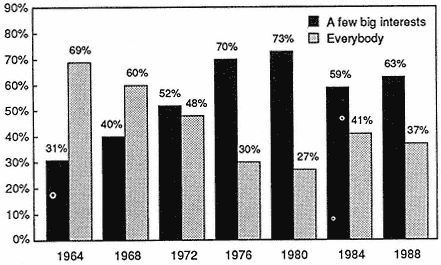
8.20
Who Benefits from Government, 1964–88: Upper-White-Collar Workers.
Business really runs America. The dominant view is that corrupt politicians are a venal facade behind which major corporations, "Big Business," prevails, in politics and economics. Remarks like "it's business that runs the country," "big corporations are behind everything," "the [political] power is in the hands of the people with money," and "oil, steel
insurance, and the banks run this country" are commonplace. These were typical comments: "Politics? It's all money! Big Business pays out money to get what it wants." "Who runs the country? Well, I suppose the president does. He makes the decisions. Of course, business is behind him. They make the real decisions. Politicians are all on the take."
That this attitude toward Big Business is widespread is also suggested by Erik Olin Wright's survey data, which found that over 74 percent of blue-collar workers believe that "big corporations have too much power" in America. It is noteworthy that, in terms of their beliefs about the power of corporations in society, American blue-collar workers are just as class conscious as workers in Sweden (presented in Wright's analysis as far more class conscious than American workers). For in both societies, between 75 percent and 82 percent of blue-collar workers believe that "big corporations have too much power" in their respective countries.[15] This underlines the importance of considering separately the three spheres: attitude toward the political regime, attitude toward the work setting, and attitude toward life outside the workplace.
Despite these critical and sceptical beliefs that American blue-collar workers have about who runs the country, the lack of approval for alternatives to the current political system is notable. The general acceptance of the American Constitution ranges from enthusiasm ("it's the best in the world") to lukewarm ("I complain a lot, but it isn't any better anywhere else"). This phenomenon needs explaining. In part it is based on a distinction between the system and those who operate it, between politicians and the Constitution: the political system is sound, but it is in the hands of scoundrels. In part, lack of support for alternative political systems results from a perception that radical change in the United States is impractical: the country is too large, and potential leaders are too prone to sell out. But in part the widespread acceptance of the Constitution and the political system is based on a key distinction most workers make, either explicitly or implicitly, between freedom and democracy. The United States does offer freedom and liberties, which are very valuable. Consider these typical comments, all made by workers who believe venal politicians subvert the electoral process: "In America you have freedom. That's important. I can say Reagan is a jerk and no one is going to put me in jail." Another worker: "You know what I like about America? You're free. No one bothers you. If I want to take a piss over there [points to a corner of the tavern], I can." Socialism and communism are ruled out in almost everyone's eyes, for they are seen as synonymous with dictatorship. They are political systems that permit neither popular control of government (democracy) nor individual freedom and liberties.[16] Survey data suggest that, like mistrust of government, this attitude toward freedom is widespread among blue- and white-collar Americans.
The vast majority both value freedom and consider it an important feature of contemporary America.[17]