Twelve
Trends in Old Age Mortality in the United States, 1900-1935: Evidence from Railroad Pensions
George Alter
In his agenda for the historical demography of aging, Peter Laslett calls attention to the need for historical studies of survival at the oldest ages. Although our understanding of trends in mortality is informed by two centuries of European and almost one century of American vital registration, these data provide little guidance on trends in mortality at the oldest ages. Even in a large population, few people survive to the oldest ages, so the mortality rates at these ages are subject to large random errors. In addition, demographers and actuaries have always been mistrustful of the reporting of ages among the elderly. There is a well-documented tendency toward the overstatement of ages above 65 in both censuses and vital registration. Reliable evidence on old age mortality in the United States has only become available since 1940 with the advent of the Social Security system. This chapter will examine new evidence on old age mortality at the beginning of the twentieth century.
Although empirical data on mortality at the oldest ages are sparse, the length of the human life span and the shape of mortality at the oldest ages have been debated for a long time. Medical researchers have been intrigued by experimental evidence suggesting a biological limit to longevity (Sacher 1978; Strehler and Mildvan 1960). Actuaries and demographers have been searching for a mathematical representation of old age mortality (Benjamin 1982; Gompertz 1825; Le Bras 1976; Perks 1932). The Gompertz function, which has been used to approximate mortality at the oldest ages for more than a century, is widely considered less than satisfactory (Bayo 1972; Pakin and Hrisanov 1984). In the last decade interest in old age mortality was renewed by two new theoretical perspectives.
James Fries proposed that the twentieth century has witnessed a tendency toward the "rectangularization of the survival curve" (Fries 1983; Fries and
Crapo 1981). Fries uses official U.S. life tables from 1900 onward to argue that additions to the length of life have not resulted from any increase in the maximum human life span but rather from an increase in the number of people who approach the limits of human longevity. This evidence, he argues, is consistent with biological models of a limited life span. Fries is mainly interested in the implications of this pattern for health policy, and he advocates public health efforts directed toward "compressing" morbidity into the last years of life. Thus, although human life span would not increase, the period between the onset of chronic diseases and the end of life would be shortened. Unfortunately, as we shall see below, U.S. mortality data are not a reliable basis for this kind of analysis.[1]
An alternative perspective with dramatically different implications was introduced by Kenneth G. Manton, James W. Vaupel, and others who have called attention to the implications of heterogeneous "frailty" for the future course of mortality and morbidity. An influential 1979 article by Vaupel, Manton, and Eric Stallard showed that differences among individuals in susceptibility to disease and death can result in misleading trends in aggregate mortality. The term "frailty" has been used to describe differences in the likelihood of death among individuals in the face of a given set of environmental factors. When mortality is high, persons who are relatively more "frail" tend to die at younger ages, and the distribution of frailty among survivors at older ages is quite different from the distribution of frailty at birth. As the level of mortality declines, some individuals who would have died in earlier cohorts reach older ages. These "new survivors" tend to be more frail than those who would have survived when mortality was higher, and the average frailty of the elderly population increases.
Although the magnitude of this effect is still heatedly debated, it has important implications (Coale and Kisker 1986). Vaupel, Manton, and Stallard (1979) showed that changes in the average frailty of the surviving population tend to hide long-run changes in mortality rates at older ages. When mortality is declining, the increasing frailty of the older population offsets some of the reduction in the risk of death. Thus, if the underlying hazard of death was changing at the same rate at every age, old age mortality would appear to be declining more slowly. Indeed, the rising average frailty due to new survivors can lead to increasing mortality rates at some older ages, even though mortality for a hypothetical "standard" individual with a given genetic endowment would have been decreasing at every age.
George Alter and James C. Riley (1989) have explored the implications of frailty models for morbidity. Simulations in this study show that falling mortality can result in rising morbidity as relatively frail individuals have longer lives but are still more likely to become ill. The tendency of some medical interventions to lengthen life without restoring health has been
called the "failures of success" (Gruenberg 1977). This is a perspective quite contrary to the implications derived by Fries (see also Riley 1989).
The available evidence on trends in old age mortality in the United States shows them to have been much less consistent than those at younger ages. While mortality has declined more or less continuously at younger ages, progress at older ages has been slow and halting. There have been periods in which mortality decline at the oldest ages stopped and a natural limit on the human life span appeared to have been reached (Fingerhut 1982; Olshansky, Carnes, and Cassel 1990).
The divergent trends in young and old age mortality were very dramatic in the early part of this century. Table 12.1 compares probabilities of death by age in 1901 and 1930 from U.S. life tables for the ten states with reliable death registration in 1901. The table shows rapid progress in reducing mortality at all of the younger ages. The probability of death in five years fell by 40 percent or more at every age under 40. There was almost no change in old age mortality, however.
TABLE 12.1 | |||
5 qx | |||
Age | 1901 | 1930 | Percent Change |
0 | 0.1914 | 0.0838 | -56.2 |
5 | 0.0217 | 0.0107 | -50.5 |
10 | 0.0136 | 0.0082 | -39.7 |
15 | 0.0213 | 0.0124 | -41.7 |
20 | 0.0323 | 0.0160 | -50.5 |
25 | 0.0364 | 0.0174 | -52.1 |
30 | 0.0418 | 0.0211 | -49.6 |
35 | 0.0482 | 0.0281 | -41.7 |
40 | 0.0552 | 0.0396 | -28.3 |
45 | 0.0667 | 0.0552 | -17.2 |
50 | 0.0835 | 0.0785 | -6.0 |
55 | 0.1150 | 0.1117 | -2.9 |
60 | 0.1551 | 0.1580 | 1.9 |
65 | 0.2193 | 0.2207 | 0.6 |
70 | 0.3020 | 0.3098 | 2.6 |
75 | 0.4265 | 0.4290 | 0.6 |
80 | 0.5718 | 0.5702 | -0.3 |
85 | 0.7100 | 0.7008 | -1.3 |
SOURCES : Glover 1921; Hill 1936. | |||
This chapter investigates old age mortality in this period of rapid progress at the younger ages. Annual series of mortality rates at older ages seem to show increasing mortality, with a peak around 1926. This pattern attracted the attention of influential researchers, such as the public health reformer Edgar Sydenstricker (1933) and the actuary Louis Dublin (Metropolitan Life Insurance Company 1929b ). However, it was by no means certain that the trend had really changed. These apparent increases may have been an echo of the 1918-1919 influenza epidemic or a result of temporary conditions in the 1920s.[2] Furthermore, as noted above, mortality at the oldest ages is always difficult to measure.
The evidence presented here supports the conclusion that an increase in old age mortality did occur in the early twentieth century. Data from three sources will be described: vital registration from the death registration area of 1900, the Pennsylvania Railroad Pension Fund, and an investigation of all railroad pensions by the Federal Coordinator of Transportation. The railroad pension fund data are important, because they are not subject to the age misreporting that seriously impairs the usefulness of censuses and vital registration. These data sets differ in methodology and geographic coverage, but they provide a consistent picture of old age mortality. All these data suggest that mortality above age 80 was either stable or rising in the first third of this century.
Trends in U.S. Vital Rates
The United States was one of the last industrial countries to develop comprehensive vital registration. Vital registration was the responsibility of the individual states. Massachusetts was the first state to establish a reliable death registration system, and its records are considered complete from about 1870 (Gutman 1956). The U.S. Bureau of the Census began publishing mortality statistics beginning with 1900 for the states and cities in which adequate registration was available. This "original" registration area covered ten states (the six New England states, Indiana, Michigan, New Jersey, and New York) and the District of Columbia. States were added to the registration area as their records were found to be complete. The registration area had expanded to 20 states in 1910, 34 states in 1920, and 47 states in 1930. The death registration system was completed in 1933 when Texas was added.
The gradual expansion of the registration area often confuses the picture of mortality trends in this period. Registration was established first in northeastern states. On balance, these were more industrial and more urban than the southern and western states added later. The early registration states also had fewer nonwhites and more recent immigrants. The net effect of these differences was higher mortality in states with earlier registration. Consequently, mortality tables constructed from the expanding registration
area tend to show a decline in mortality, which is an artifact of changing geographic coverage.
Figures 12.1 and 12.2 show age-specific death rates for ages 65-74, 75-84, and 85 and older from 1900 to 1940 for white males and white females in the original registration states. Each of these curves tells a similar story. There appears to have been constant or slightly rising mortality from about 1900 to 1920, a peak in mortality in the mid-1920s, and declining mortality in the late 1920s and 1930s. These visible patterns are confirmed in table 12.2, which shows regression lines fitted by ordinary least squares. The coefficients for the year in these equations estimate the annual decrease in the age-specific death rates. For the entire period from 1900 to 1940, downward trends are found in five of the six series. When only the period from 1900 to 1929 is considered, however, all six series produce upward trends. Furthermore, the rates of increase are correlated with age. The annual increase in the death rate for white males rises from 0.054 per thousand at ages 65-74 to 0.361 per thousand at ages 85 and over. The corresponding estimates for white females are 0.001 and 0.892, respectively. Mortality at ages below 65 was decreasing. Thus there was an overall shift from falling mortality at younger ages to rising mortality at the oldest ages from 1900 to 1929.
The age-specific death rates from vital registration are suspect, however, because of the tendency toward age overstatement at the highest ages. The death rates shown in figures 12.1 and 12.2 are ratios of deaths reported in vital registration and population estimates derived from censuses. Errors in both sources are suggested by the Matching Record Study, which compared ages reported in the 1960 census to a sample of deaths registered in the following year (Hambright 1968). Discrepancies between the census and death certificates were greatest at the oldest ages, and the results of the study
TABLE 12.2 | |||||||
White Male | White Female | ||||||
65-74 | 75-84 | 85+ | 65-74 | 75-84 | 85+ | ||
1900-1940 | |||||||
Year | -0.045 | 0.025 | -0.505 | -0.170 | -0.099 | -0.466 | |
Constant | 146.5 | 81.3 | 1228.4 | 379.1 | 306.9 | 1142.2 | |
R2 | 0.047 | 0.004 | 0.146 | 0.423 | 0.053 | 0.076 | |
1900-1929 | |||||||
Year | 0.054 | 0.256 | 0.361 | 0.001 | 0.232 | 0.892 | |
Constant | -43.4 | -360.1 | -425.9 | 51.8 | -325.5 | -1452.1 | |
R2 | 0.032 | 0.185 | 0.051 | 0.000 | 0.185 | 0.183 | |
SOURCE : Linder and Grove 1963. | |||||||
NOTE : Dependent variables: Age-specific death rates. Independent variable: Year. | |||||||
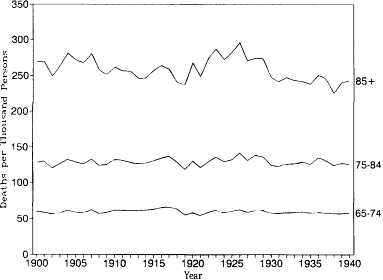
Fig. 12.1.
Age-specific death rates, 1900-1940: White
males, U.S. death registration states of 1900.
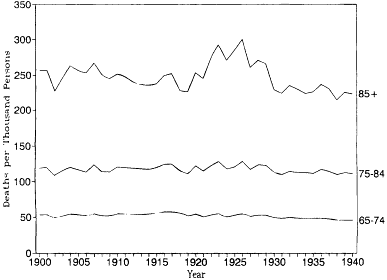
Fig. 12.2.
Age-specific death rates, 1900-1940: White
females, U.S. death registration states of 1900.
are consistent with a hypothesis of roughly equal age misreporting in both sources. It is likely that age misreporting at the beginning of this century was even more common than it was in 1960.
Since age overstatement tends to be dominant at the oldest ages, the reported age-specific death rates at these ages include some experience of younger people. We can consider the problem in the following way. When age misreporting is present, the observed mortality rate at a given age is a weighted average of the mortality rates of three groups: (1) those who are younger than the reported age, (2) those who are reported at their true age, and (3) those who are older than the reported age. Persons whose ages are overstated (group 1) tend to lower observed mortality, because younger persons have lower mortality rates. Age understatement (group 3) tends to increase mortality by erroneously including older persons in younger age groups. The amount of bias in the observed mortality rate depends on both the numbers of younger and older persons whose ages are misreported and on the differences in mortality at true and observed ages.[3]
Age misreporting will have little effect on the observed death rate when the proportions misreported from younger and older ages are approximately equal. This tends to be the case at the younger adult ages, but it is not likely to occur at the oldest ages. First, there is a tendency for more age overstatement than understatement at these ages. Second, at the upper ages there are many fewer people at older than at younger ages. The high mortality rates at these ages impart a steep slope to the population distribution, which puts more people at risk of age overstatement than age understatement. All of the errors in the final, open-ended age category are errors of age overstatement. Thus age misreporting results in an influx from younger to older age groups. These younger individuals experience mortality rates lower than those of the age groups in which they are reported. This results in an underestimate of the death rates at the oldest ages (Coale and Kisker 1986).
Trends in observed mortality rates will be affected by changes in both age misreporting and in the underlying true mortality rates. On one hand, improvements in age reporting will result in an upward trend in the observed mortality rates at older ages. As the proportions incorrectly reported in higher age groups decline, the mortality rates at these higher ages will tend to increase. On the other hand, a downward trend in mortality at younger ages will tend to produce a decline in mortality at older ages as well. Individuals impart the trends in their true mortality rates to the categories in which they are reported.
The death rates in the U.S. registration area would have been subject to both of these effects. It is possible that age reporting was improving at this time. Ansley J. Coale and Melvin Zelnik (1963) estimated decreasing enumeration errors at most adult ages for the censuses of 1900 to 1930. How-
ever, the population aged 85 and over was still significantly overcounted in the 1930 census. Preliminary estimates using stable population methods suggest that at least 10 and possibly more than 25 percent of those reported as 85 and over were really younger than 85 (Alter 1990). This factor would lead to an understatement of the upward trend at these older ages. Thus the effects of improved age reporting were probably offset by declining or less rapidly increasing mortality at younger ages.
On balance, the upward trend in old age mortality observed in the U.S. death registration states appears to be real. It is unlikely that the peak in mortality in the mid-1920s was caused by changes in age reporting.
The Pennsylvania Railroad Pension Fund
Tabulations of the mortality experience of the Pennsylvania Railroad Pension Fund are available from its inception in 1900. The Pennsylvania Railroad was one of the first corporations to provide modern employee benefits. Sickness insurance and death benefits had been introduced in 1886, and in 1889 the company decided to give pensions to all workers above the age of 70. The new program included mandatory retirement at age 70, and the amount of the pension was based on earnings before retirement. Pensions were also provided for disabled workers aged 65-69 with thirty years of service. To limit future eligibility to long-term employees, the railroad also restricted the hiring of new workers to applicants under age 35.
Annual reports included in the minutes of the Board of Officers of the Pennsylvania Railroad Pension Fund have been used to calculate age-specific death rates. These records fall into two periods. Before 1920, the company was divided into eastern and western operating divisions, and a separate pension fund was maintained for workers in the railroad lines west of Pittsburgh. In 1920, the two pension funds were united, as part of a general reorganization of the company. The board of the smaller western fund did not tabulate its pensioners by age, so mortality rates presented here for 1900 to 1919 refer only to the eastern division of the company. Mortality rates for 1921 to 1936 refer to both divisions combined. In 1957, all railroad pensions were taken over by the Railroad Retirement Board, and the Pennsylvania Railroad Pension Fund limited its activities to providing for workers who did not meet the requirements of the new national system. Annual age-specific mortality rates are not available after the formation of the Railroad Retirement Board.
The Pennsylvania Railroad was the largest corporation in the United States during the nineteenth century, and its pension obligations at the beginning of this century were correspondingly large. By the end of its first year in operation, the fund supported 1,190 pensioners, including 1,054 who were age 70 or older, and 735 more workers retired in 1901. In 1920
when the western lines were added, there were 5,776 pensioners who were almost equally divided between ages 65-69 and 70 and older. At the end of 1936, when the fund was turned over to the U.S. Railroad Retirement Board, there were 11,682 pensioners, 3,428 of whom were aged 70 or more.[4]
Tabulations of mortality by attained age for the lines west of Pittsburgh are not available before the two operating divisions were merged in 1920. However, evidence on mortality in each region by age at retirement suggests that the difference between regions was negligible. Table 12.3 compares mortality in the eastern and western operating divisions for the years 1910 to 1919. Among those who retired at age 70 or older, mortality was nearly the same in each region, 103.4 deaths per thousand in the east compared to 103.9 in the western lines. The difference was somewhat higher for disability retirements at ages 65-69: 89.4 and 96.8 per thousand, respectively. Although these differences do indicate that mortality may have been slightly higher in the lines west of Pittsburgh, they do not represent significant differences.
Reporting of Ages
The pension fund records do not seem to suffer from the kinds of age mis-reporting that affect other sources of mortality information. Retirements were based on dates of birth already recorded in company personnel files. Since these dates of birth were reported at young adult ages, they would not have been subject to the systematic overstatement common at the older ages. Reporting is also likely to be more accurate when respondents are asked for their date of birth rather than their age, because there is less tendency to round years of birth.[5]
If workers were tempted to misstate their ages, they probably would have reported themselves as younger rather than older. Even before the com-
TABLE 12.3 | ||||
Age at Retirement | ||||
70 + | 65-69 | Total | ||
Number of deaths | ||||
East | 1,800 | 1,462 | 3,262 | |
West | 803 | 320 | 1,123 | |
Number of lives at riska | ||||
East | 17,407.5 | 16,354.5 | 33,762.0 | |
West | 7,731.0 | 3,305.5 | 11,036.5 | |
Death rate | ||||
East | 0.1034 | 0.0894 | 0.0966 | |
West | 0.1039 | 0.0968 | 0.1018 | |
a Number on December 31 of preceding year plus one-half the number who retired during the year. | ||||
pany banned the hiring of workers above the age of 35, younger workers were probably preferred. As retirement age approached, workers whose ages were understated could choose between continued employment or having their records corrected so that they could retire on time.
The minutes of the Board of Officers of the pension fund suggest that the company did attempt to keep its records accurate. Ages could often be checked by comparing different company files, because most workers would have reported their dates of birth more than once. The board considered a number of resolutions that would correct the dates of birth recorded in company files. For example, in 1919, the Board of Officers received a letter requesting the cancellation of mandatory retirement proceedings for a certain worker. The superintendent who wrote the letter claimed to have in his possession a family Bible proving that the correct date of birth was 1854, not 1848 (Pennsylvania Railroad Pension Fund, January 1, 1919).
An important indication of the accuracy of the ages reported in the pension records is the rarity of centenarians in these data. Only two pensioners reached the age of 102, and none exceeded that age. Individuals over the age of 100 are much more common when ages are poorly reported, and deaths are often found at ages 110 and over when age reporting is unreliable.
Selectivity and Representativeness
The mortality experience found in insurance, pensions, and annuities is usually not a representative sample of the entire population. These records differ in two important ways. First, the criteria for admission to these programs are often related to health. For example, insurance companies try to eliminate high-risk cases by requiring medical examinations. In general, the individuals included in insurance and pension records are healthier than the average population. Second, financial aspects of insurance and pensions often limit them to social and economic groups with special characteristics. Both of these problems affect the comparison between the Pennsylvania Railroad pensioners and the general population. For purposes of discussion, the first of these problems will be called "selectivity" and the second, "representativeness."
Actuaries have long been aware that mortality tables derived from insurance records often differ substantially from those based on the general population. The mortality of insurees tends to be particularly low in the first few years after the contracts begin, because persons with detectable disabilities are either refused insurance or placed in special high-risk categories. Pension records usually suffer from a similar selection bias known as the "healthy worker effect" (Fox and Collier 1976). Workers who retire at the mandatory age limit tend to be healthier than those who stop working at earlier ages. Mortality tables based on the experiences of disabled workers show much lower life expectancies than those based on active workers.
These selection effects lead us to expect lower mortality in the railroad pension records than we would see in the general population.
The difference between select and general populations is not constant, however. As the duration of the contract increases, the advantage due to selection diminishes for two reasons. On one hand, most health risks cannot be forecast very far into the future, so the select experience begins to approach the general experience. On the other hand, the high-risk individuals in the general population die more rapidly than others, which brings the average experience closer to the select experience. Most of the effects of selection are gone after five years, and only minor differences exist after ten years.
The rules of the Pennsylvania Railroad Pension Fund removed some of the impact of the selection in the data used here. Although the age of mandatory retirement was 70, workers became eligible for a disability pension at age 65. As we would expect, the mortality of disability retirees between ages 65 and 70 was very high. The disability provision of the pension meant that workers were selected into the pension system at age 65, even though most workers only began receiving benefits at age 70. Thus the healthy worker effect is reduced in these data, because pensioners have already been in the system for five years by age 70. There is some evidence of select mortality at ages 71 and 72, but this effect is gone by age 75.
An additional kind of selection bias can occur when a new program is introduced. The healthy worker effect is probably stronger for employees who retired in the first year of the new pension program than for those who retired later. The first cohort of pensioners did not benefit from the possibility of earlier disability pensions, and many of those who retired in 1900 and 1901 were above age 70 at retirement. Abraham M. Niessen (1948) notes that mortality rates in the first two years of the U.S. Railroad Retirement Board were lower than subsequent experience. A similar effect in the Pennsylvania Railroad pension data is described below.
There is no way to manipulate the pension fund data to make it approximate a random sample of the entire population, but railroad employees seem to be as close to a representative sample of white males as we are likely to find. A breakdown of the Pennsylvania Railroad pensioners by race and sex is not available. However, 93 percent of the early beneficiaries of the U.S. Railroad Retirement Board were white males (Niessen 1948).[6] We also know that the Pennsylvania Railroad Pension Fund applied to all employees of the railroad, company officers as well as manual workers. Since the railroad employed an extensive workforce with a large segment of clerks and other non-manual employees, its distribution of workers by social status is probably closer to the national pattern than a manufacturing firm would be.
Douglas Ewbank has provided me with estimates of infant and child mortality comparing railroad employees to the rest of the population. The esti-
mates are based on reports of surviving children and children ever born in vital registration for the year 1928, and they refer to mortality conditions in approximately 1923. Ewbank has estimated child mortality rates of 0.1323 for railroad employees aged 20-39 and 0.1329 for the total population, a difference of less than 1 percent.[7] Since infant mortality and child mortality are very sensitive to living conditions, we can conclude that railroad workers were not subject to any unusual nonoccupational sources of mortality. Thus railroad workers, if not a representative sample, are at least a close approximation to the national average.
Calculating Mortality Rates
Information in the minutes of the Board of Officers has been used to calculate probabilities of dying for single years of age beginning at age 71. From 1900 to 1936, we have reports giving the number of pensioners by age at last birthday on December 31 of each year. From 1900 to 1919, the reports also give the number of new pensioners and deaths at each age, but after 1919, only the total numbers of new pensioners and deaths are given. Two years are missing from the series. The table for 1902 could not be located. In 1920, the merger of pensioners from lines west of Pittsburgh and changes in reporting procedures made it impossible to compute death rates.[8]
Death rates were computed by dividing the number of deaths by lives at risk. Lives at risk were computed as the sum of the number of pensioners on December 31 of the preceding year and one-half the number who retired during the year. After 1920, the totals of deaths and retirements must be distributed to single years of age. The age distribution of retirees in the years 1917-1919 was used to assign ages to retirees, and deaths were computed by subtracting the number of survivors at the end of the year. Since the overwhelming majority of nondisability retirements occurred at ages 70 or 71, any errors in assigning ages at retirement are minor and have almost no effect after age 75. Annual variations in the distribution of retirements by age are further mitigated by the procedure used to convert mortality estimates to exact ages.
The tables included in the minutes of the pension fund show ages tabulated by age at last birthday. Simple procedures have been used to compute age-specific mortality rates for exact ages in standard life table form. We assume that the population whose age at last birthday was x can be treated as a population aged exactly x + 1/2. This is a reasonable approximation for data given by single year of age. Probabilities of death for exact ages (1 qx ) are derived by computing two-year moving averages.[9]
Trends in Mortality by Age
Figure 12.3 shows annual movements in probabilities of death at ages 71, 75, 80, and 85 (4 q71 , 5 q75 , 5 q80 , and 5 q85 ) for 1900 to 1936 derived from the Penn-
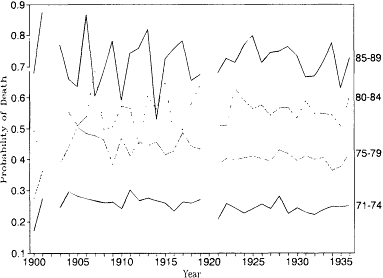
Fig. 12.3.
Probability of death, by age: Pennsylvania Railroad
Pension Fund, 1900-1935.
sylvania Railroad Pension Fund data. In table 12.4 and figures 12.4 through 12.7, these mortality rates are aggregated into five-year periods centered on years ending in 5 and 0. The mortality rates for ages 71-74 have been extrapolated to ages 70-74 to facilitate comparison with U.S. life tables (also presented in table 12.4 and figs. 12.4-12.7). Trends are easier to detect in these figures without the confusing influence of annual fluctuations.
The influence of the selection effects described above are apparent in the first two years of the pension fund. The mortality rates for ages 71-74 were noticeably lower in the first two years of the pension fund, because currently employed workers tend to be healthier than those who retire early. This effect disappeared relatively quickly as disability pensions at age 65 became available, however.
The most remarkable aspect of these data is the difference between the trends in mortality above and below age 80. The mortality rates at ages 71-74 and 75-79 show clear and steady declines between 1905 and 1935. It is much more difficult to detect trends at the two older age groups. The age group 80-84 has a generally rising pattern with the suggestion of a peak around 1925. Ages 85-89 also peak near 1925, but the overall trend is even more difficult to identify.
Table 12.4 and figures 12.4 through 12.7 show life table mortality estimates for the U.S. death registration area. Joseph A. Hill (1936) provides
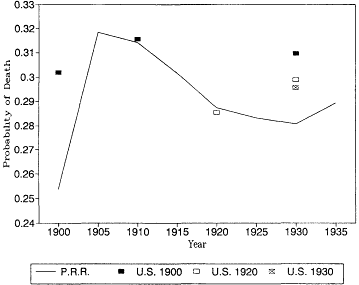
Fig. 12.4.
Probability of death at age 70: Pennsylvania Railroad Pension
Fund, 1900-1935, and U.S. Life Tables, 1900, 1920, and 1930.
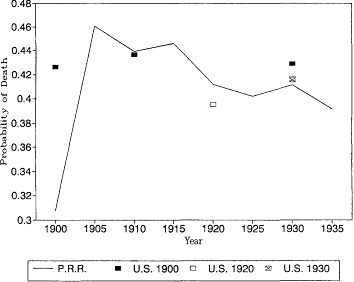
Fig. 12.5.
Probability of death at age 75: Pennsylvania Railroad Pension
Fund, 1900-1935, and U.S. Life Tables, 1900, 1920, and 1930.
TABLE 12.4 | |||||||||
Pennsylvania Railroad Pension Fund | |||||||||
Aged | 1900-1901 | 1903-1907 | 1908-1912 | 1913-1917 | 1918-1922 | 1923-1927 | 1928-1932 | 1933-1936 | |
70 | 0.2537 | 0.3186 | 0.3143 | 0.3018 | 0.2876 | 0.2833 | 0.2808 | 0.2893 | |
75 | 0.3077 | 0.4608 | 0.4394 | 0.4461 | 0.4119 | 0.4021 | 0.4114 | 0.3917 | |
80 | 0.4765 | 0.5616 | 0.5176 | 0.5581 | 0.5546 | 0.5803 | 0.5610 | 0.5520 | |
85 | 0.7584 | 0.7097 | 0.7311 | 0.7297 | 0.6860 | 0.7504 | 0.7099 | 0.7152 | |
90 | 0.8284 | 0.8683 | 0.8670 | 0.8189 | 0.8176 | 0.8516 | |||
95 | 0.8808 | 0.6915 | 0.9613 | ||||||
U.S. White Male Life Tables | |||||||||
1901 | 1910 | 1920 | 1930 | ||||||
Contemporary U.S. death registration area | |||||||||
70 | 0.3019 | 0.3156 | 0.2854 | 0.2958 | |||||
75 | 0.4265 | 0.4366 | 0.3955 | 0.4157 | |||||
80 | 0.5718 | 0.5769 | 0.5382 | 0.5603 | |||||
85 | 0.7101 | 0.7040 | 0.6850 | 0.6889 | |||||
90 | 0.8274 | 0.8103 | 0.7835 | 0.8041 | |||||
95 | 0.9179 | 0.8940 | 0.8907 | 0.9125 | |||||
(Table continued on next page)
(Table continued from previous page)
U.S. White Male Life Tables | |||||||||
1901 | 1910 | 1920 | 1930 | ||||||
Registration states of 1900 | |||||||||
70 | 0.3019 | 0.3156 | 0.3098 | ||||||
75 | 0.4265 | 0.4366 | 0.4290 | ||||||
80 | 0.5718 | 0.5769 | 0.5702 | ||||||
85 | 0.7101 | 0.7040 | 0.7008 | ||||||
90 | 0.8274 | 0.8103 | 0.8122 | ||||||
95 | 0.9179 | 0.8940 | 0.9055 | ||||||
Registration states of 1920 | |||||||||
70 | 0.2854 | 0.2989 | |||||||
75 | 0.3955 | 0.4170 | |||||||
80 | 0.5382 | 0.5602 | |||||||
85 | 0.6850 | 0.6908 | |||||||
90 | 0.7835 | 0.8039 | |||||||
95 | 0.8907 | 0.9170 | |||||||
Registration states of 1930 | |||||||||
70 | 0.2958 | ||||||||
75 | 0.4157 | ||||||||
80 | 0.5603 | ||||||||
85 | 0.6889 | ||||||||
90 | 0.8041 | ||||||||
95 | 0.9125 | ||||||||
a The probabilities of death for ages 71-74 have been converted to 70-75 using the formula 5 q70 = 1.169 4 q71 . | |||||||||
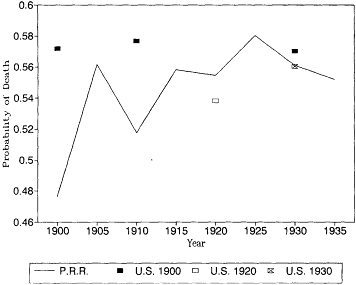
Fig. 12.6.
Probability of death at age 80: Pennsylvania Railroad Pension
Fund, 1900-1935, and U.S. Life Tables, 1900, 1920, and 1930.
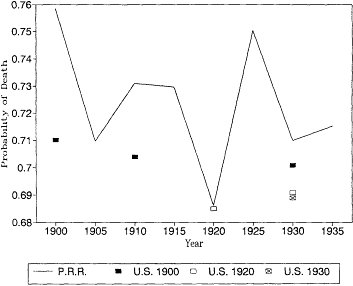
Fig. 12.7.
Probability of death at age 85: Pennsylvania Railroad Pension
Fund, 1900-1935, and U.S. Life Tables, 1900, 1920, and 1930.
U.S. life tables for 1930 based on the death registration areas of 1900 and 1920. At most younger ages the differences between the earlier and later registration areas would not change our interpretation of the trend in mortality. At these ages, however, the expanding death registration area suggests a larger decline in mortality than the original registration states of 1900. In 1930, the estimates based on the 1.900 death registration area are higher than the other two estimates, and the 1930 death registration area yields the lowest mortality rates of all.
It is also reassuring to see that the Pennsylvania Railroad pension mortality was very close to the more general experience captured by the U.S. Bureau of the Census life tables. There is no evidence here that the railroad annuitants were select lives with lower than normal mortality. At age 85 the railroad mortality rates are higher than the U.S. life table estimates. This is probably due to age misreporting errors in the U.S. data, which were discussed above.
A statistical analysis of mortality trends at different ages is presented in table 12.5. Logit regression models have been used to estimate the relationships among age, time period, and the age-specific mortality rates of the Pennsylvania Railroad Pension Fund. The dependent variable in this analysis is the set of death rates for single years of age (lqx) in each of the years from 1903 to 1935. Death rates based on fewer than 10 lives at risk were excluded, which left 649 observations for the full period. Logit regression was used because the range of the dependent variable is restricted to the interval from 0 to 1. This restriction results in heteroskedasticity, which biases standard errors derived from ordinary least squares regressions. Observations were weighted by the number of lives at risk in all computations.[10] Estimates are provided for three periods. The first period, 1903-1935, uses all of the available data except for the three initial years of the pension fund, which show strong selectivity effects. The second period, 1903-1929, excludes the last six years of the pension fund, in which mortality appears to have been falling at all ages. The third period, 1903-1919, refers to data for only the eastern operating division of the railroad and excludes the possible confounding effects of the western lines added when the two pension funds merged in 1920.
Model I provides a simple estimate of the relationship between age and mortality without distinctions by time period. The logit model of mortality is similar to the Gompertz model, which is more commonly used to approximate adult mortality.[11] In both models the logarithm of the probability of death is almost linear at younger ages, but it increases more slowly at the highest ages as it converges toward 1.0. The estimated coefficient for age in this model represents the rate of increase in the probability of death as age increases. The desirability of additional parameters in modeling the Pennsylvania Railroad Pension Fund data was tested by adding an age-
TABLE 12.5 | ||||
Years | ||||
1903-1935 | 1903-1929 | 1903-1919 | ||
Model I | ||||
Constant | -9.238* | -9.210* | -8.542* | |
Age | .0927* | .0927* | .0845* | |
Model II | ||||
Constant | -9.274* | -9.256* | -8.545* | |
Age | .0932* | .0930* | .0845* | |
Year | -.0044* | -.0040* | -.0002 | |
Model III | ||||
Constant | -9.252* | -9.502* | -8.966* | |
Age | .0929* | .0962* | .0901* | |
Year | -.0057* | -.0062* | -.0014 | |
Year for age 80+ | .0057* | .0096* | .0061 | |
Model IV | ||||
Constant | - 9.252* | - 9.502* | - 8.966* | |
Age | .0929* | .0962* | .0901* | |
Year for ages 71-79 | -.0057* | -.0062* | -.0014 | |
Year for age 80+ | .0000 | .0034 | .0046 | |
NOTE : Dependent variable is life table lqx. | ||||
* The probability of obtaining this result if the true coefficient equals zero is p < .05. | ||||
squared term to the logit regression. This additional term did not improve the fit of the model significantly.
The estimates in table 12.5 support the impression that the shape of the mortality curve was changing. If mortality at ages 70-79 was decreasing and mortality above age 80 was constant or increasing, the rate of increase of the probability of death with advancing age should have become more pronounced. This is exactly the kind of change that we find in Model I by comparing the estimates for 1903 to 1919 to the estimates for 1903 to 1929 or 1903 to 1936. The estimated coefficient for age increases from 0.0845 in the earlier period to 0.0927 when the 1920s and 1930s are included.
In Model II, the year is added as an independent variable in the logit regression equation. This allows the level of the mortality curve to shift upward or downward over time. The estimates for all three periods indicate that mortality was falling, but the change from 1903 to 1919 is not statistically distinguishable from zero.
Models III and IV allow us to distinguish between the trends in mortality at ages 71-79 and trends over the age of 80. These models are actually mathematically identical, but they yield tests of somewhat different statisti-
cal inferences. In Model III, a variable is added to distinguish trends in mortality at ages 80 and over from the trend at ages 71-79. This variable is set equal to the year at ages 80 and over but is set to zero under age 80. In Model III, the coefficient for the independent variable "Year" measures the rate of change of mortality at ages 71-79, and the coefficient for "Year for age 80+" measures the difference between the rate of change at ages 80 and over and ages 71-79. The estimated coefficients for this "interaction" variable indicate that mortality decreased less above age 80 in each of the three periods. The difference in trends is greatest for the period 1903 to 1929, and the differences in the periods 1903 to 1929 and 1903 to 1936 are both statistically significant.
In Model IV, the variable for the year is replaced with a variable that is equal to the year at ages 71-79 and zero at ages 80 and over. Since this change does not add any new information, the estimated coefficients for this independent variable are the same as those for the variable that is replaced in Model III. However, the interpretation of the variable "Year for age 80+" is different in Model IV. This variable now provides a direct measure of the trend in mortality at ages 80 and older, instead of measuring the difference between trends above and below age 80. In Model IV, the statistical test associated with this variable considers the null hypothesis that there was no trend in mortality at ages 80 and over. In the previous model the null hypothesis was that there was no difference between the trend at ages 71-79 and the trend at 80 and older.
Model IV indicates that mortality was increasing above age 80 until 1929. When the seven years from 1930 to 1936 are included, however, there is no measurable trend above age 80. This pattern is consistent with other indications in both the Pennsylvania Railroad Pension Fund and the death registration states that old age mortality peaked in the 1920s and declined in the 1930s. It is also noteworthy that the period 1903 to 1919 shows a stronger upward trend at ages 80 and older and a weaker downward trend at ages below 80. This suggests that the mortality peak in the mid-1920s is not due to changes in composition of the pension fund after the western lines were added in 1920. We cannot attach much certainty to the inference that mortality above age 80 was rising, because the statistical tests on Model IV indicate that the estimated coefficients for the "Year for age 804+" variable could differ from zero because of random variations in the data.
The logit regression models in table 12.5 provide statistical confirmation of the impressions derived from figures 12.4 through 12.7. Mortality below age 80 was declining, and there was a significant difference between the trends in mortality above and below age 80. The estimated coefficients indicate that mortality above age 80 was rising in the period from 1903 to 1929, but the statistical tests do not reject the null hypothesis that mortality at these ages was constant.
Thus these data from the Pennsylvania Railroad Pension Fund support the evidence from U.S. vital registration. Both data sets show divergent trends in mortality, at the older and younger ages. Furthermore, both data sets point to a turning point around 1926, when mortality at the oldest ages peaked and began to decline.
Federal Coordinator of Transportation
In 1934, the Federal Coordinator of Transportation, a short-lived branch of the U.S. government, conducted a major study of employment and pension histories of railroad workers. This was undoubtedly one of the largest studies of its kind ever conducted. The study was motivated by concern for employment during the economic depression and the emerging crisis among railroad pension funds. More than 300,000 employment histories from thirteen railroads and pension histories of 109,096 former male workers from fifty-nine railroads were collected.[12] The pension histories record 644,417 years of experience and 59,165 deaths. In 1940, the U.S. Railroad Retirement Board compiled the results of this survey for use in its actuarial valuation of the railroad pension system.
Since the pension programs examined by the Federal Coordinator of Transportation differed substantially in their provisions, it was necessary to organize them into the six classes shown in table 12.6. Classes 1 and 2 include pension records for workers forced to retire at a compulsory retirement age. In the programs included in class 1, most workers retired at the compulsory age, but in class 2, a substantial percentage of retirements occurred before or after the compulsory retirement age. Classes 3, 4, and 5 identify three kinds of disability retirements. Workers in class 3 were deemed permanently and totally disabled from "any occupation." The disabilities in class 4 were subjected to the less stringent requirement of disability from engaging in the "usual" occupation. The pension programs in class 5 did not distinguish between "any occupation" and "usual occupation." Railroads that allowed both disability and age retirements, such as the Pennsylvania Railroad, contributed histories to class 5 as well as to class 1 or 2. The railroads in class 6 had only disability retirement or did not distinguish between age and disability retirements.
Table 12.6 shows the number of person years of experience in each class of retirement program for workers who retired in three periods: in 1910 or earlier, 1911 to 1920, and 1921 to 1930. The retirement systems with the largest numbers of workers combined compulsory age retirements with disability retirement at older ages. More than half of the experience in these two categories was contributed by the two largest pension systems, the Pennsylvania Railroad (27,431 retirements) and the New York Central Railroad (13,396 retirements). The second panel of the table, presenting the per-
TABLE 12.6 | |||||
Year of Retirement | |||||
Class of Retirementa | Before 1910 | 1911-1920 | 1921-1930 | ||
Number of retirements | |||||
1 | 3,963 | 7,936 | 19,371 | ||
2 | 275 | 1,359 | 7,962 | ||
3 | 276 | 383 | 892 | ||
4 | 46 | 227 | 557 | ||
5 | 3,056 | 9,702 | 30,414 | ||
6 | 718 | 3,433 | 13,483 | ||
Total | 8,334 | 23,040 | 72,679 | ||
Percent of retirements | |||||
1 | 47.6 | 34.4 | 26.7 | ||
2 | 3.3 | 5.9 | 11.0 | ||
3 | 3.3 | 1.7 | 1.2 | ||
4 | 0.6 | 1.0 | 0.8 | ||
5 | 36.7 | 42.1 | 41.8 | ||
6 | 8.6 | 14.9 | 18.6 | ||
Total | 100.0 | 100.0 | 100.0 | ||
Actual as percent of expected mortalityb | |||||
1 | 122.3 | 115.2 | 101.7 | ||
2 | 114.4 | 124.3 | 118.3 | ||
3 | 79.6 | 95.1 | 90.4 | ||
4 | 91.9 | 90.5 | 92.0 | ||
5 | 79.7 | 83.0 | 72.1 | ||
6 | 63.3 | 78.6 | 73.7 | ||
Index of actual/expected mortality | |||||
1 | 100.0 | 94.2 | 83.2 | ||
2 | 100.0 | 108.7 | 103.4 | ||
3 | 100.0 | 119.5 | 113.6 | ||
4 | 100.0 | 98.5 | 100.1 | ||
5 | 100.0 | 104.1 | 90.5 | ||
6 | 100.0 | 124.2 | 116.4 | ||
Totalc | 100.0 | 104.2 | 95.1 | ||
1, 5d | 100.0 | 99.7 | 87.6 | ||
2, 3, 4, 6e | 100.0 | 112.1 | 107.6 | ||
SOURCE : Federal Coordinator of Transportation 1940. | |||||
a Definition of classes: class 1, age retirements with 85 percent retired at compulsory retirement age; class 2, age retirements with significant early and late retirements; class 3, retirement for permanent and total disability to engage in any occupation; class 4, retirement for permanent and total disability to engage in usual occupation; class 5, disability retirement where "any occupation" and "usual occupation" distinction were not applied; class 6, retirement where only disability retirements were made or where separation between age and disability retirement was not possible. | |||||
b Mortality tables used in standardization: classes 1 and 2, combined annuity table; classes 3-6, disabled life table. | |||||
c Weighted average of the six classes. | |||||
d Weighted average of classes 1 and 5. | |||||
e Weighted average of classes 2, 3, 4, and 6. | |||||
centage of retirements by class in each period, shows that there was a change in the composition of retirements over time. Retirements at a compulsory age (class 1) fell from 47.6 percent of all retirements in the period before 1910 to 26.7 percent between 1921 and 1930. Disability retirements (class 5) increased from 36.7 to 41.8 percent, and the retirement systems with less easily classified rules (classes 2 and 6) also grew.
The detailed tabulations done in 1940 do not lend themselves to the computation of age-specific rates, but summary statistics can be used for a standardized comparison. Since the 1940 tables were created for the valuation of pensions, disability, retirements were tabulated by years since retirement rather than attained age. This makes is impossible to compute mortality by attained age for the entire population of pensioners. However, comparisons between the railroad pensioners and standard actuarial tables are available. For each class of retirements, we have the ratio of actual deaths to the number of deaths expected under the mortality of the Combined Annuity Mortality Table (classes 1 and 2) or the Disabled Life Mortality Table (classes 3, 4, 5, and 6). These ratios are presented in the third panel of table 12.6, which shows the actual experience as a percentage of the mortality expected under the standard table. Since the standards differ across classes, each class has been indexed to the value for retirements in 1910 or earlier in the fourth panel of table 12.6. Weighted averages of these indexes have been computed using the numbers of retirements as weights. The weighted averages show the standardized experience for all types of retirements and for programs that had both age and disability retirements (classes 1 and 5).
It is important to note that the data in table 12.6 are organized by year of retirement. The data were collected in 1934 and reflect experience up to the end of 1933. Much of the experience of workers who retired in 1910 or earlier occurred after 1910, and some workers who retired between 1911 and 1920 were still alive in 1933. Furthermore, workers who retired in 1910 or earlier were under observation longer and at older ages than those who retired after 1921. Most pensions began between ages 65 and 70, so few of those retired between 1921 and 1930 had passed the age of 80 in 1933. Thus the reader should remember that the time periods in table 12.6 actually overlap, and standardization may not remove all the effects of different age distributions.
Among the six classes of pensions shown in table 12.6, only the compulsory, age retirements in class 1 experienced a steady mortality decline over this period. Tabulations of the class 1 retirements by attained age also show steady declines in mortality at each age. As usual, the rate of decline was slower at older ages. The mortality in each of the other classes tended to be highest in the cohort retired between 1911 and 1920, and mortality appears to have been about the same for those retired in 1910 or earlier and between 1921 and 1930.
The trends in the separate retirement classes are not necessarily meaningful, however, because retirement patterns were shifting. As noted above, there was a marked increase in disability retirements at the expense of age retirements. This trend was also apparent in the Pennsylvania Railroad Pension Fund, which relaxed its requirements for disability retirement in 1920 (Pennsylvania Railroad Pension Fund, 19 July 1920). The weighted averages at the bottom of table 12.6 were computed to capture these shifts in disability retirement. When all retirement classes are considered, mortality appears to have increased and then declined. Compared to those who retired in 1910 or earlier, the mortality index for all classes combined is 4 percent higher among the 1911 to 1920 retirements and 5 percent lower for retirements between 1921 and 1930. The weighted average for classes 1 and 5 combined shows the trend among railroads with provisions for both age and disability retirements. Among these pensioners, the mortality decline in class 1 is offset by an increase in class 5 in the middle cohort of retirements. This results in no change from the earliest cohort to the 1911 to 1920 retirements, followed by 12 percent lower mortality among the 1921 to 1930 retirements.
The trends in mortality shown by the weighted averages in table 12.6 are consistent with the mortality experience of the Pennsylvania Railroad Pension Fund described above. We recall that in the Pennsylvania Railroad data, mortality declined at ages below 80, while it increased above age 80. This would create offsetting trends in an overall index, such as the one shown in table 12.6. This fits the pattern of railroads divided between classes 1 and 5. Mortality among these pensioners was constant from the earliest cohort to the 1911 to 1920 cohort of retirements. If we assume that mortality was falling at ages 70-79, then mortality must have been rising above age 80 in that period. The mortality decline noted in the 1921 to 1930 retirements reflects only the downward trend under age 80, because few of these pensioners had passed age 80 when the data were collected in 1934.
One reason that classes 1 and 5 follow the experience of the Pennsylvania Railroad Pension Fund is that the Pennsylvania Railroad experience is included in these results. The Pennsylvania Railroad Pension Fund was by far the largest railroad retirement fund included in the study, contributing 25 percent of the retirement histories. It may well be responsible for the trends in classes 1 and 5. However, even larger increases in mortality are observed in classes 2, 3, 4, and 6, which do not include Pennsylvania Railroad retirees.
A notable aspect of table 12.6 is the contrast between the falling mortality among the age retirements in class 1 and the other classes. The authors of the report suggest that rising mortality among disability retirements may have been a result of stricter criteria for defining disability, but this explanation seems unlikely. Disability retirements were increasing at a much
faster rate than age retirements, and we have direct evidence from the Pennsylvania Railroad that their criteria were being relaxed. An alternative explanation is that pension funds were becoming better at identifying disabilities. The diagnostic skills of physicians were improving in this period, and they may have become more able to detect conditions that would result in early death. If those granted disability pensions were not only more numerous but also sicker, we would expect to see improved health among those retired at the mandatory age.
Conclusion
It would not have been surprising to find that mortality declined more rapidly below age 80 than above age 80. We know that in the United States and other developed countries, mortality declined more rapidly at younger than at older ages (Dublin and Lotka 1937; Stolnitz 1956). Samuel H. Preston's (1976) analysis of causes of deaths at different ages offers a convincing explanation for these different rates of decline. Mortality at the highest ages is primarily due to degenerative diseases, in particular, cardiovascular diseases and cancer, which are much less likely to respond to public health and medical interventions. Thus the decline in infectious diseases at the beginning of this century had a greater proportional effect on mortality at younger ages.
However, the shift from infectious to degenerative diseases associated with aging does not explain why mortality at the oldest ages was constant or even rising. Since mortality from infectious diseases was declining even at the older ages, mortality from degenerative diseases must have risen for the overall death rate to remain constant.[13] Increases in cardiovascular diseases and cancer were observed at the time, but there was a controversy about the validity of these trends. Medical diagnoses were improving, and there was a decrease in the proportion of deaths attributed to unknown causes and nonspecific conditions, such as senility. The apparent increases in deaths from heart and circulatory diseases and malignant neoplasms were sometimes attributed to better reporting of causes of death (Dublin and Lotka 1937). Edgar Sydenstricker (1933) mentions a controversy about whether cancer rates were actually rising which had been resolved in favor of increasing rates.
Any explanation of the rise in old age mortality at the beginning of the twentieth century must also be consistent with the declining mortality at younger ages. This draws our attention to factors that accumulate slowly with age, which can be grouped into three broad categories: changes in behavior, changes in environment, and the selective demographic effects of earlier declines in mortality.
Two behavioral changes stand out as potential explanations: smoking and diet. Cigarette smoking was clearly rising in this period, but it is unlikely that its effects would have appeared in the cohorts analyzed here. The consequences of smoking are most apparent in individuals who have smoked for a long time, and these men would have been too old to adopt this new habit. Furthermore, smoking was almost strictly a male prerogative at this time, and the rise in female mortality in the U.S. death registration area was as great as the rise in the male mortality.[14]
Dietary changes in the late nineteenth century were quite likely, however, to have increased the risk of cardiovascular disease and possibly cancer as well. Rising incomes, urban life styles, and technological changes, such as refrigeration, may have changed the American diet in unhealthy ways.[15] Richard Doll and Bruce Armstrong (1981) describe a set of "Western diseases" that have been increasing in certain African populations. The cancers identified by them as "Western diseases" were almost all increasing among Metropolitan Life Insurance policyholders between 1911 and 1935 (Dublin and Lotka 1937) and throughout the United States from 1935 to 1974 (Devesa and Silverman 1978). Louis I. Dublin and Mortimer Spiegel-man (1952: 428) identified diet as one of the factors accounting for the relatively poor mortality of the United States at older ages when compared to other industrialized countries: "At least one-fifth of our adults are more or less seriously overweight; the proportion is higher for males than for females. Because of our prosperity and abundance, a large number of our people are literally eating themselves to death."
Second, there may have been deleterious changes in the environment, such as pollution or increased housing density. The direction of change in environmental quality is not entirely clear, however. Declining infant mortality rates suggest that public health measures were having a positive effect on water quality in this period, and air pollution was still more dependent on coal-fired furnaces than automobiles. But it is possible that rising cancer rates reflected the accumulation of industrial pollutants from the expansion of manufacturing at the end of the nineteenth century.
Finally, a process of demographic selection might have been responsible. If a population is composed of subgroups with differing susceptibilities to disease, the composition of the population at each age depends on past experiences of mortality (Alter and Riley 1989; Vaupel, Manton, and Stallard 1979). Individuals with high relative risks tend to die at younger ages, so a population becomes less "frail" as it ages. If mortality declines, however, more of the high-risk individuals will survive to old age. When the distribution of relative risks is wide, mortality declines at younger ages can appear to produce mortality increases at older ages. The rising proportion of high-risk, new survivors makes the average mortality at older ages appear higher,
even though mortality for individuals of the same relative risk in different cohorts would be declining. Again, Dublin and Spiegelman (1952: 429) anticipated this explanation in their international comparison of adult mortality:
In other words, the suggestion is that our generally better level of medical care has been prolonging the lives of persons whose health has been impaired by earlier infection. As a result, it is possible that we have among the middle-aged and older persons now in our midst a larger proportion of persons with organic impairments than may be found in other nations.
If this process was at work earlier in this century, it would explain the paradox of worsening old age mortality.
References
Alter, George. 1990. "Trends in old age mortality in the U.S., 1900-1940." Paper presented at the annual meeting of the Population Association of America, Toronto, Canada, May 3-5.
Alter, George, and James C. Riley. 1989. "Frailty, sickness, and death: Models of morbidity and mortality in historical populations." Population Studies 43: 25-45.
Atack, Jeremy, and Fred Bateman. 1987. To their own soil: Agriculture in the antebellum North . Ames: Iowa State University Press.
Bayo, Francisco R. 1972. "Mortality of the aged." Transactions of the Society of Actuaries 30: 1-24.
Bayo, Francisco R., and Joseph F. Faber. 1983. "Mortality experience around age 100." Transactions of the Society of Actuaries 35:21-43.
Benjamin, Bernard. 1982. "The span of life." Journal of the Institute of Actuaries 109, pt. 3: 319-341.
Coale, Ansley J., and Ellen Eliason Kisker. 1986. "Mortality crossovers: Reality or bad data?" Population Studies 40: 389-401.
Coale, Ansley J., and Melvin Zelnik. 1963. New estimates of fertility and population in the United States . Princeton: Princeton University Press.
Condran, Gretchen A., Christine Himes, and Samuel H. Preston. 1989. "Old age mortality patterns in low-mortality countries: An evaluation of population and death data at advanced ages, 1950 to the present." Paper presented at the annual meeting of the Population Association of America, Baltimore, March 30-April 1.
Devesa, Susan S., and Debra T. Silverman. 1978. "Cancer incidence and mortality trends in the United States: 1935-74." Journal of the National Cancer Institute 60: 545-571.
Doll, Richard. 1979. "The pattern of disease in the postinfection era: National trends." Proceedings of the Royal Society of London , series B, 205: 47-61.
Doll, Richard, and Bruce Armstrong. 1981. "Cancer." In Western diseases: Their emergence and prevention , ed. H. C. Trowell and D. P. Burkitt, 93-110. Cambridge: Harvard University Press.
Dublin, Louis I., and Alfred J. Lotka. 1937. Twenty-five years of health progress . New York: Metropolitan Life Insurance Company.
Dublin, Louis I., and Mortimer Spiegelman. 1952. "Factors in the higher mortality of our older age groups." American Journal of Public Health 42: 422-429.
Ewbank, Douglas C. 1989. "Child mortality differentials by father's occupation, U.S. 1895-1925." Paper presented at the annual meeting of the Population Association of America, Baltimore, March 30-April 1.
Federal Coordinator of Transportation. 1940, November. "Actuarial data and basic tables for valuation of retirement benefits to railroad employees." Washington, D.C.
Fingerhut, Lois M. 1982. "Changes in mortality among the elderly: United States, 1940-78." Vital and Health Statistics , U.S. National Center for Health Statistics, series 3, no. 22.
Fox, A.J., and P. F. Collier. 1976. "Low mortality rates in industrial cohort studies due to selection for work and survival in industry." British Journal of Preventive Social Medicine 30: 225-230.
Fries, James F. 1983. "The compression of morbidity." Milbank Memorial Fund Quarterly 61: 397-419.
Fries, James F., and L. M. Crapo. 1981. Vitality and aging: Implications of the rectangular curve . San Francisco: W. H. Freeman.
Glover, James W. 1921. United States life tables, 1890, 1901, 1910, and 1901-1910 . Washington, D.C.: Government Printing Office.
Gompertz, B. 1825. "On the nature of the function expressive of the law of human mortality and a new mode of determining the value of life contingencies." Philosophical Transactions of the Royal Society of London 115, pt. 2:513-585.
Gruenberg, Ernest M. 1977. "The failures of success." Milbank Memorial Fund Quarterly 55: 3-24.
Gutman, Robert. 1956. "The accuracy of vital statistics in Massachusetts, 1842-1901." Ph.D. dissertation, Columbia University.
Hambright, Thea Zelman. 1968. "Comparability of age on the death certificate and matching census record." Vital and Health Statistics , U.S. National Center for Health Statistics, series 2, no. 29.
Hill, Joseph A. 1936. United States life tables, 1929 to 1931, 1920 to 1929, 1919 to 1921, 1909 to 1911, 1901 to 1910, 1900 to 1902 . Washington, D.C.: Government Printing Office.
Kestenbaum, Bert. 1989. "Centenarians: An administrative records perspective." Paper presented at the annual meeting of the Population Association of America, Baltimore, March 30-April 1.
Le Bras, Hervé. 1976. "Lois de mortaliteé et âge limite" [Laws of mortality and the life span]. Population 31: 655-691.
Linder, Forrest E., and Robert D. Grove. 1963. Vital statistics rates in the United States, 1900-1940 . Washington, D.C.: National Office of Vital Statistics.
Metropolitan Life Insurance Company. 1929a . "A setback in mid-life mortality." Statistical Bulletin of the Metropolitan Life Insurance Company 10 (February): 1-4.
———. 1929b . "The human life span unchanged." Statistical Bulletin of the Metropolitan Life Insurance Company 10(October): 1-3.
Niessen, Abraham M. 1948. "Recent mortality of railroad annuitants." Transactions of the Actuarial Society of America 49: 296-302.
Olshansky, S. Jay, Bruce A. Carnes, and Christine Cassel. 1990. "In search of Methuselah: Estimating the upper limits of human longevity." Science 250: 634-640.
Pakin, Yu B., and S. M. Hrisanov. 1984. "Critical analysis of the applicability of the Gompertz-Makeham law in human populations." Gerontology 30: 8-12.
Pennsylvania Commissioner of Health. 1916-1918. Annual report, 1914-1916 . Harrisburg: Wm. Stanley Ray, State Printer.
Pennsylvania Railroad Pension Fund. 1899-1937. "Minutes of the Board of Officers." Urban Archives, Temple University.
Perks, W. 1932. "On some experiments in the graduation of mortality statistics." Journal of the Institute of Actuaries 63: 12-40.
Preston, Samuel H. 1976. Mortality patterns in national populations . New York: Academic Press.
———. 1983. "An integrated system for demographic estimation from two age distributions." Demography 20: 213-226.
Preston, Samuel H., and Ansley J. Coale. 1982. "Age structure, growth, attrition, and accession: A new synthesis." Population Index 48: 217-259.
Preston, Samuel H., Nathan Keyfitz, and Robert Schoen. 1972. Causes of death: Life tables for national populations . New York: Seminar Press.
Riley, James C. 1989. Sickness, recovery and death . London: Macmillan.
Sacher, George A. 1978. "Longevity, aging, and death: An evolutionary perspective." The Gerontologist 18: 112-119.
Stolnitz, George J. 1956. "A century of international mortality trends: II." Population Studies 10: 17-42.
Strehler, Bernard L., and Albert S. Mildvan. 1960. "General theory of aging." Science 132: 14-21.
Sydenstricker, Edgar. 1933. Health and environment . New York: McGraw-Hill.
U.S. Bureau of the Census. 1900-1940. Census of population . Washington, D.C.: Government Printing Office.
———. 1914-1916, 1924-1926, 1934-1936. Mortality statistics . Washington, D.C.: Government Printing Office.
Vaupel, J. W., K. G. Manton, and E. Stallard. 1979. "The impact of heterogeneity in individual frailty on the dynamics of mortality." Demography 16: 439-454.
Wiehl, Dorothy G. 1930. "Changes in mortality among adults." Journal of Preventive Medicine 4: 215-237.