1—
Weather and Climate
Douglas R. Powell and Harold E. Klieforth
Introduction
The highest range of the many mountain ranges that are arranged en echelon in the Great Basin between the Sierra Nevada and the Wasatch Mountains is the White Mountains, situated along the California-Nevada border about 225 mi (362 km) east of the Pacific Coast. Climatically, this location is transitional between the moderating maritime influence of the Pacific Ocean and the more extreme continental influence of interior North America. The very large variation in elevation within the range, from 4,000–5,000 ft (1,200–1,500 m) at the base to 14,246 ft (4,343 m) at the summit, results in rapid and significant changes in temperature and precipitation within short horizontal distances. Any air mass reaching the White Mountains must pass over an assemblage of other ranges that vary in width and altitude. By far the most important of these mountain barriers is the equally high Sierra Nevada, lying immediately to the west, which, by inducing air to rise, clouds to form, and precipitation to fall, intercepts some of the moisture from Pacific storms in the winter half of the year. To the north, east, and south are a series of lower ranges that have lesser climatic influence. Topographically, the least impeded avenue of approach for an air mass is from the southeast, but significant movement of air from this direction is uncommon. When it does occur, normally in July or August, the result may be spectacular thunderstorms with high precipitation intensities.
Atmospheric Circulation Patterns
Unlike other features of the physical environment, the gases that constitute the atmosphere are invisible, so that it is necessary to use indirect means to describe graphically and to map continuously changing atmospheric conditions. Atmospheric motions are complex, but when studied they are found to follow patterns. To understand the weather regimes of the White-Inyo mountains, it is helpful to recognize three principal scales of motion, each roughly an order of magnitude greater than the next.
The first and largest of these is the synoptic scale , so called because it is analyzed from numerous soundings, measurements, and observations made at the same time at hundreds of locations around the world. This is the scale of the familiar weather maps seen in daily newspapers and on television. These surface and upper-air charts cover horizontal distances of 100 to 2,000 mi (160 to 3,200 km) and depict such features as low- and high-pressure areas, cyclones, and anticyclones, air masses, weather fronts, and regions of precipitation. Generally, these features progress in a predictable manner,
and from them it is possible to produce, by computerized prediction models, future patterns of airflow, moisture, temperature, clouds, and precipitation. These are used to forecast, with varying degrees of certainty, weather conditions for a particular region for a few days following receipt of the climatic data.
The second scale of atmospheric motion, the mesoscale , describes airflow patterns over distances of, say, 1 to 100 mi (or 1.6 to 150 km), a range that includes many of the spectacular cloud formations and weather conditions experienced in and near the mountains of eastern California (Plates 1.1–1.8). These phenomena are closely related to the synoptic flow patterns but are controlled and shaped by major terrain features such as the Sierra Nevada and the White-Inyo Range.
The third scale, the toposcale , applies to weather and climatic conditions within a distance of, say, 1 mi (1.6 km) that vary in relation to prominent features shown on local (15-minute or 7.5-minute series) topographic maps. Thus, under differing synoptic and mesoscale conditions different air temperatures, wind velocities, and snow accumulations are measured, whether the location is on a mountain ridge or in a canyon, on a windward or leeward slope, or in a broad valley.
In the sections that follow we discuss the principal patterns that affect the White-Inyo Range, its inhabitants, and its visitors in each of these different scales. We begin with a survey of synoptic-scale airflow and its relation to seasonal weather.
Synoptic-Scale Circulation
Weather Regimes
Figure 1.1 shows the principal airflow patterns and air-mass types or source regions that determine regional weather in different seasons of the year. The arrows indicate the directions of air movement near and above the crest of the major mountain ranges, at levels between 10,000 and 20,000 ft (3 to 6 km) above sea level. The open circles are locations from which twice-daily (near 4 A.M. and 4 P.M. PST) rawinsonde balloon ascents are made to obtain data on air temperature, humidity, and wind velocity, from which upper-air (e.g., 500 mb) weather maps are plotted and analyzed. The black circle indicates the location of the Bishop Airport, the nearest (3 mi, or 5 km) National Weather Service station to the White-Inyo Range.
The air that flows across California at any time of year is most likely to have passed over some part of the Pacific Ocean. In summer the Pacific Anticyclone (a large, slow-moving clockwise whirl of air) lies just west of California, bringing an onshore flow of cool marine air, stratus clouds, and fog to the coast and mostly clear, dry air to the Sierra and White-Inyo Range. During much of the summer the Great Basin Anticyclone develops over the warm plateau region of Nevada and Utah. When this whirl expands and shifts westward, a flow of moist maritime tropical air from the Gulf of California or the Gulf of Mexico may persist for a few days before the normally dry Pacific flow reasserts itself. Thus, during the summer season the mountainous terrain of eastern California and western Nevada is contested for by two air masses, with that from the northern or central Pacific usually prevailing.
Figure 1.1
Major airflow patterns and air mass types affecting California and the Great
Basin. Rawinsonde stations shown are:
| ||||||||||||||||||||||||||||
During fall, winter, and spring a series of traveling upper-air troughs (cyclonic bends with counterclockwise flow) and ridges (anticyclonic bends with clockwise flow) cross California and Nevada. Ridges and anticyclones usually bring subsiding air, few clouds, and "fair" weather, whereas the troughs and associated cyclones, low-pressure centers, and fronts bring much cloudiness and widespread precipitation. Fronts are boundaries between converging air masses from different source regions. The primary air masses affecting California are cold maritime polar air from the Gulf of Alaska and warmer, moist maritime subtropical air from lower latitudes. Occasionally there are invasions of cold continental polar air from northern Canada or the Rocky Mountains.
Seasonal Storms
Cloud formation and precipitation result primarily from ascending motion in moist air. When air rises, it expands and cools. This causes its invisible water vapor to
condense, forming small cloud droplets. As the ascending motion continues, the clouds thicken and the droplets grow larger to form raindrops. If it is sufficiently below freezing (32°F, or 0°C), snow crystals form, which, when heavy enough, fall from the clouds and reach the ground as rain or snow. The precipitation that falls on the mountains each year is a result of four principal mechanisms of upward-moving air: general ascent produced by widespread horizontal convergence in cyclonic flow, more intense lifting in frontal zones, strong "orographic," or terrain-induced, lifting over the windward slopes of mountains, and thermal convective instability triggered by the ascending motion, which causes the cloud to billow upward and precipitate with greater intensity. Although heavy precipitation (40 to 80 in or 100 to 200 cm of water annually) falls on the upper western slope of the Sierra, the region immediately leeward, including the Owens Valley, the White-Inyo Range, and much of western Nevada, is in the so-called rain shadow of the Sierra and receives much less precipitation. The drying of the air results from both the loss of moisture due to precipitation on the windward slope and the adiabatic warming induced by descent over the leeward slope.
Cold fronts, moving in such a way that cold air replaces warmer air at the surface, usually approach from the northwest or the west. Before the passage of the front and its lagging upper-air trough, the airflow across the mountains is from the west or southwest, while surface winds in the valleys and basins are mild and from the south. After frontal passage the upper flow becomes northwesterly to northerly, and cold northerly to northeasterly winds sweep across the mountain ridges and along the valleys. The Sierra Nevada has a profound effect on most fronts, causing them to stall west of the crest while their northern sectors move more rapidly across Oregon and then southward over northern Nevada. Thus, many fronts converge on the Sierra Nevada and White-Inyo Range in nutcracker fashion, with the cold air reaching the leeward valleys and basins from the north before the cold air from the west can surmount the High Sierra.
When a surface low-pressure center forms in western Nevada accompanied by an upper trough that deepens excessively to form a cyclone over the region — a weather pattern known locally as a "Tonopah low" — a northeasterly to southeasterly flow often brings continental polar air or recycled maritime polar air, low clouds, and snowfall to the White-Inyo Range. When such storms involve moist Pacific air, they usually bring heavy snowfall to the region; some of the biggest snowstorms recorded in the White Mountains have occurred in such circulation patterns. Precipitation from closed cyclones over the region is most frequent in spring, resulting in a spring (April or May) precipitation maximum in much of the Great Basin, in contrast to the pronounced winter maximum in the Sierra Nevada.
On infrequent occasions, usually several years apart (e.g., January 1937, January 1949, December 1972, February 1989, and December 1990), a long northerly fetch of air may bring an invasion of true Arctic air from interior Alaska or the Yukon. These episodes bring record cold temperatures to the White-Inyo Range and adjacent valleys; at such times minimum temperatures may dip to -25°F (-31°C) or below.
Most winters include one or two episodes of "warm storms," periods of a few to several days in which very moist tropical air reaches California from the vicinity of Hawaii. In these events the freezing level may be above 10,000 ft (3,000 m), and the heavy rainfall may result in widespread flooding in much of California. It is during such storms that heavy rime icing may form on trees, structures, and power lines on high mountain ridges. This is caused by the combined effect of strong winds and supercooled clouds (composed of water droplets at air temperatures below freezing). The cloud droplets freeze on contact, building great formations of ice that grow into the direction of the wind.
Conversely, "cold storms" bring snow to low elevations, including the floor of Owen Valley and desert areas to the south and east of the White-Inyo Range. Major westerly storms that last for two or three days bring heavy accumulations of snow — a foot (30 cm) or more in the valleys, and two or three times as much at the highest elevations. Very cold storms from the northwest contain less water vapor, are of shorter duration, and usually bring only a few inches (several centimeters) of snow.
Mesoscale Phenomena
Mountain Lee Waves
When a cold front approaches California from the northwest and the westerly airflow increases in speed over the Sierra crest, spectacular "stationary" clouds are usually seen over the leeward valleys. These are manifestations of a mountain lee wave, as it is known (Fig. 1.2). If the ridges and troughs of the horizontal airflow pattern are likened to the bends or meanders of a stream, the lee wave phenomena are analogous to the falls and ripples. Figure 1.3 shows a typical pattern of airflow and cloud forms in a strong lee wave. Air flowing over the Sierra Nevada plunges downward, then upward, and then downward again in a series of crests and troughs. The wavelength depends on the airflow characteristics, mainly the variation of air temperature with height (lapse rate) and the increase of wind speed with height (wind shear). The amplitude is greatest in strong waves and in cases where the vertical flow pattern is in resonance with the terrain, as, for example, when the second wave crest lies over the next mountain range downwind, such as the White-Inyo mountains, east of Owens Valley.
Updrafts and downdrafts in a strong lee wave often have speeds of 2,000 ft (600 m) per minute, sometimes exceeding 4,000 ft (1,200 m) per minute. Where the air descends, it warms, and the relative humidity decreases. The warm, dry winds, which may reach speeds of 60 mph (30 m/s) or greater at the surface, are known as foehn winds. The stratocumulus cloud deck over the Sierra Nevada is called a foehn-wall or cap cloud, and its downslope extension is known as a cloudfall. After it evaporates, the invisible moisture is cooled again in the ascending current and forms the turbulent cumuliform roll cloud. Looking at the roll cloud, an observer has the impression that it is rotating, but this is an illusion caused by the wind shear. However, below the roll cloud there is commonly a true rotor circulation, which brings easterly winds at
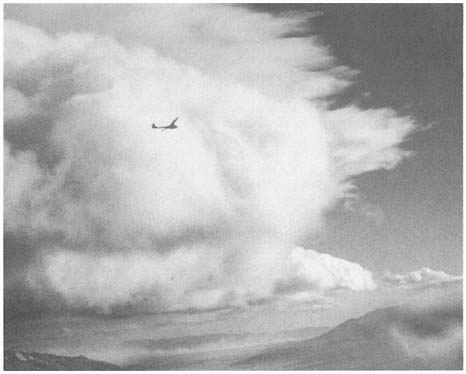
Figure 1.2
Sailplane in 4,000 ft/min (20 m/s) updraft en route to 40,000 ft (12,200 m) over Owens
Valley. The view is from the towplane at 15,000 ft (4,570 m) on 18 December 1951 at
14:47 PST. The windward sides of the roll cloud and high lenticular clouds are seen in the
center. At the lower right, a "cloud fall" descends the steep leeward slope of the High
Sierra, and at the lower left can be seen blowing dust from Owens (dry) Lake. At about this
time a Greyhound bus was blown off Highway 395 near Lone Pine.
the surface. On rare occasions a very strong lee wave will be in resonance with the terrain so that the first wave crest lies over the White-Inyo Range.
Above the roll cloud, there may be one layer or several decks of smooth, lens-shaped altocumulus clouds which appear stationary but through which the air is passing at 50–100 mph (22–45 m/s); the cloud droplets form at the windward edge and evaporate at the leeward edge. Soaring pilots make use of a mountain lee wave by flying into the wind and ascending in the updraft zone. In Figure 1.3 the dotted line shows a typical path of a sailplane: a line of flight under the roll cloud during airplane tow, release point at "x," and then a line of flight upward. Several flights above altitudes of 40,000 ft (12,000 m) have been made in lee waves by pilots equipped with oxygen to survive the low pressure (200 to 150 mb) and with warm clothing to withstand the cold temperatures (-94°F or -70°C).
Wave clouds may appear in any month of the year, but they are most often seen in late winter and in spring. They usually reach their maximum development in
Figure 1.3
Vertical cross section of Sierra lee wave showing airflow
pattern and cloud forms.
midafternoon and are most beautiful at sunset, when the highest clouds, at 30,000–40,000 ft (9,000–12,000 m), remain colorful long after the sunlight has left the leeward valley.
A local wind of another sort may sometimes be observed by motorists in the winter season in the Owens Valley near Olancha. During strong lee wave conditions or the passage of a cold front, a great horizontal cyclonic eddy may develop about Owens (dry) Lake; there will be a northerly (i.e., from the north) wind along the route of Highway 395 but, as evidenced by blowing dust, a southerly wind on the east side toward Keeler. When the surface flow is southerly in Owens Valley, the dust from Owens Lake may be carried far north of Bishop, lowering visibility so that the mountains are nearly obscured, and the alkali dust is sometimes tasted by pilots flying at 12,000 ft (3,600 m)! Similar phenomena occur in other arid basins of California and Nevada.
Thunderstorms
At any time from early May to early October, there may be an incursion of tropical air from the south; then thunderstorms are possible. The intense heating of the arid Southwest during the summer months creates the upper-air anticyclone and surface low-pressure area that provide the circulation necessary for the northward flow of tropical air. In eastern California and Nevada, this summer monsoon is best developed during the period from early July to late August.
At first, the moisture enters the area at the high levels, and a thundery spell is commonly heralded by the appearance of rather exotic cirrus clouds from the south quadrant. Within a day or two, if the flow persists, the air at middle and low levels is also moist, and daily thundershowers can occur. These are strongly diurnal in their development; that is, they develop as a result of the daily heating of the mountain slopes by the sun, and they decline after sunset.
The appearance of patchy, turreted altocumulus clouds at sunrise is a good indication of possible thunderstorms later in the day. Heating of the rocky mountain slopes causes the air to rise toward the crests, and soon cumulus clouds form above these upslope currents. The clouds continue to rise upward, becoming what the weather observer calls towering cumulus. Near midday their tops develop a fibrous appearance indicative of ice crystal formation, and they are said to be glaciated. Soon they develop anvil-shaped cirrus tops with streamers of ice clouds stretching downwind at those levels (30,000–40,000 ft, or 9,000–12,000 m). At this time, lightning flashes from cloud to mountain and heavy local showers of rain and, commonly, graupel , or pea-sized hail, fall on the crests and ridges of the ranges. By this time hikers and climbers should have taken shelter.
Later, as downdrafts of cool air predominate, the thunderstorm ceases, and as the sky brightens to the west, the clouds begin to thicken over the leeward valley, where the day-long heating has created rising thermal currents. Often at 5:00 P.M. or 6:00 P.M. PST a brief thundershower is experienced in valley locations. As the shower moves eastward and the lowering sun in the west shines on the dark cloud and rain shafts, a brilliant rainbow is visible. Finally, when the sky has cleared and stars have appeared, lightning might continue to flash in the east if a nocturnal storm continues over central Nevada.
During some summers there are numerous thunderstorms, as in 1955, 1956, 1967, 1976, 1983, and 1984; in other years there are very few. It is difficult to predict exactly where the storms will occur, as this depends on subtle differences in wind velocity, amount of moisture, rate of growth, and topography. In the morning hours, the eastern slopes of the mountains are heated, the warm currents rise, and an easterly upslope wind forms in the valleys. If the upper synoptic flow has an easterly component, the clouds will develop even more rapidly. In the afternoon, the western slopes of the mountains are heated more effectively by the sun, and, especially if aided by a westerly breeze, the cloud development intensifies there. Once the cloud has formed, latent heat is released, which increases the cloud's buoyancy and causes it to rise more vigorously. Because these storms are so localized, commonly affecting a single canyon, intense cloudbursts may cause flash floods. These commonly occur when cloud bases are below the mountain tops. Such events often go unobserved in the Inyo Mountains and remote Nevada ranges and are discovered some days or weeks later. The damage is usually greater there, though, because roads commonly follow the canyons and washes.
As a general rule, it does not rain on summer nights in the mountains, but there are exceptions. Occasionally, the remnants of tropical storms called "easterly waves"
are carried northward along the Sierra and over much of Nevada. The cloudiness is general, and precipitation may be widespread, continuing at night and commonly accompanied by low clouds and fog, lightning, and thundershowers. Such episodes occurred in July 1956 and in August 1965.
Toposcale Effects
The hiker's pocket altimeter and the altimeter in an aircraft are merely barometers measuring atmospheric pressure and indicating the equivalent height according to average weather conditions. Pressure, which always decreases with altitude, is usually measured in millibars, as shown at the right side of Table 1.1, or in inches (or millimeters) of mercury. Some equivalent pressures and heights for average atmospheric conditions in the California-Nevada region are listed in Table 1.1. The physiological effects of increasing altitude and decreasing pressure are mainly caused by the reduced amount of oxygen and the greater effort one has to exert to get enough oxygen into the lungs. Most hikers have to become acclimated for a day or two before they can be comfortable above 10,000 ft.
| |||||||||||||||||||||||||||||||||||||||||||||||||||||||||||||||||||||||||||||||||||||||||||||||
At most times and places, air temperature also decreases with height because the atmosphere is mainly heated from below. The atmosphere does not absorb much of the direct radiation from the sun, but the earth's surface does and reradiates the energy at a longer wavelength, which the atmosphere absorbs mainly through two of its variable gases: water vapor and carbon dioxide. The average lapse rate (generally, the decrease of temperature with altitude) is approximately 3.6°F per 1,000 ft (6.5°C per km). At midday in summer with strong thermal activity, the lapse rate on the slopes approaches the adiabatic value of about 5.4°F per 1,000 ft (10°C per km) of ascent. Thus, on days when the temperature is 90°F (32°C), for example, in the Owens Valley, it can be 45° to 55°F (7° to 13°C) on Mt. Whitney or White Mountain Peak (both above 14,000 ft or 4,000 m). On clear nights, on the other hand, cooler air with its greater density sinks and collects in the valleys, forming inversions in which the temperature increases with height in the lowest few hundred feet (» 100 m) above the ground.
Topography influences local weather and climate in many ways, examples of which will be noted throughout the following sections of this chapter.
Weather Observations and Climatological Data
Weather Stations
Sparseness of permanent population, little human use of the area, and inaccessibility of the terrain have led to a scarcity of reliable weather records. Students and aficionados of mountain weather and climate always bemoan the paucity of weather instruments and observers at high elevations. Figure 1.4 shows the locations and elevations for weather stations in and immediately adjacent to the White Mountains. Table 1.2 gives the average monthly and annual temperatures for these stations, and Table 1.3 lists the corresponding precipitation data. Unfortunately, there are gaps in the records from most of the stations, especially during extreme weather events when such data can be very useful. Most reliable is Bishop (see Fig. 1.4), at 4,108 ft (1,250 m) in Owens Valley to the west of the White-Inyo Range, operated by the National Weather Service since 1947. The other stations are maintained by cooperative agencies, institutions, or individuals. The only continuous records from within the mountains proper are from stations operated by the White Mountain Research Station (WMRS) — White Mountain I in the valley of Crooked Creek, at 10,150 ft (3,095 m), and White Mountain II on the east slope of Mt. Barcroft, at 12,470 ft (3,800 m). Regrettably, maintenance costs and problems have closed White Mountain II during the winter months from January 1980 to the present, and the record from White Mountain I stopped after 1977. Automated weather-recording equipment is now being installed in the White Mountains by the WMRS. Dyer, at 4,975 ft (1,517 m) in Fish Lake Valley, and Deep Springs College, at 5,225 ft (1,593 m) in Deep Springs Valley, are representative of the lowland valleys to the east and southeast of the mountains. Benton, 5,377 ft (1,640 m), and Basalt, 6,358 ft (1,940 m), to the northwest and
Figure 1.4
Locations and elevations of weather stations.
north of the mountains have incomplete records and were little used in this climatic analysis. Unless otherwise noted in the tables, the period of record is from 1956 through 1985; 30 years is generally considered by climatologists to be the minimum length of time necessary to establish meaningful averages.
Following is a summary of three important components of weather and climate in and around the White Mountains: temperature, precipitation, and wind. Data from the above-mentioned stations serve as a basis for the discussion. Monthly average temperatures are calculated by averaging the daily maximum readings for the month, averaging the daily minima, adding these two totals, and dividing by 2. In the following discussion, winter includes December, January, and February; spring March, April, and May; summer June, July, and August; and fall September, October, and November. Both authors of this chapter have many years of direct observation
| |||||||||||||||||||||||||||||||||||||||||||||||||||||||||||||||||||||||||||||||||||||||||||||||||||||||||||||||||||||||||||||||||||||||||||||||||||||||||||||||||||||||||||||||||||||||||||||||||||||||||||||||||||||||||
| ||||||||||||||||||||||||||||||||||||||||||||||||||||||||||||||||||||||||||||||||||||||||||||||||||||||||||||||||||||||||||||||||||||||||||||||||||||||||||||||||||||||||||||||||||||||||||||||||||||||||||||||||||||||||||||||||||||||||||||||||||||||||||||||||||||
of weather events in the White Mountains and have used personal experience and knowledge to augment interpretation of the formal record, especially in the large portions of the range not covered by the recorded data.
Temperature
The summer visitor to Owens Valley at midday may well think the valley and the apparently barren, flat-lighted slopes of the White Mountains to the east to be under the full possession of the sun, with a forbidding aspect of heat. The same visitor to elevations above 10,000 ft (3,049 m) would likely comment — perhaps complain — about coolness, or even the cold. In July, the warmest month, average daily temperatures are 70°F (21°C) or higher on all the adjacent valley floors; the maximum daily temperature reached 109°F (43°C) at Bishop in June 1969 and July 1982, 106°F (41°C) in June 1961 at Dyer, and 104°F (40°C) at Deep Springs in June 1964. The July average is 51.7°F (10.9°C) at White Mountain I and 46.7°F (8.2°C) at White Mountain II, with maximum summer temperatures reaching 79°F (26°C) at I in July 1967, and 73°F (23°C) at II in August 1978. The decline in average July temperatures with an increase in altitude is close to the 3.6°F drop per 1,000 ft (6.5°C per km) rise in elevation regarded as the normal lapse rate throughout the world. It is a rarity for any of the summer months at either mountain station not to have one or more readings of 32°F (0°C) or below, and even the adjacent valleys have such readings in June and August. For any location on earth, trees are generally absent if the average of the warmest month is below 50°F (10°C). This critical value occurs between White Mountain I and White Mountain II; the former has trees, and the latter has none.
In January, the coldest month, the average temperature is 37.2°F (2.9°C) at Bishop, with a winter low of -7°F (-21.5°C) in January 1982. Temperatures are somewhat colder in the valleys to the east, with Dyer at 31.4°F (-0.3°C) with a winter low of -21°F (-29.5°C) in January 1962 and 1974, and Deep Springs at 30.6°F (-0.8°C), with a low of -10°F (-23.5°C) in January 1973. Fish Lake and Deep Springs Valley are colder than Owens Valley because they are at higher elevations, they are farther from the maritime influence of the Pacific Ocean, and they are more open to invasions of cold air from the north and east. At White Mountain I January is the coldest month, with an average of 20.6°F (-6.3°C) and a winter low of -25°F (-31.5°C) in March 1968. February is the coldest month at White Mountain II, with an average of 14.8°F (-9.6°C) and a winter low of -35°F (-37°C) in March 1964. In winter there is less of a decrease in monthly average temperatures with a rise in elevation than in summer. Cold air settling in the lower valleys at night from radiational cooling and downslope drainage seems to be the major reason: the temperature difference between the valleys and the slopes or highlands is less pronounced for minimum readings than for daily maxima, especially on clear nights. This phenomenon is characteristic of high mountains everywhere. At White Mountain I, located in a valley, average minima for the three coldest months
(January, February, and March) are 2°F (1°C) warmer than at White Mountain II, which is 2,320 ft (707 m) higher on a slope; average maxima for those same months are 9.5°F (5.3°C) higher. Thus, a typical early winter morning at the lower station would be just about as cold as at the higher station, but midafternoon would be noticeably warmer.
There is also a much greater variation in average monthly temperatures in winter than in other seasons at all stations and elevations. At some time during most winters, there is an invasion of continental polar or arctic air from northern Canada and Alaska, which brings below-normal temperatures. The frequency and duration of these incursions of cold air vary greatly from year to year; on rare occasions they dominate the weather for weeks. The last such major occurrence was in January and February 1949, and in January 1937 before that. In 1937, a minimum of -42°F (-41°C) was recorded in January at Fish Lake Valley; readings close to that may have occurred within the mountains. In general, the White Mountains are protected from common and prolonged cold air invasions by the many mountain ranges to the north and east.
February and March averages are lower than those for January at White Mountain II, and they are only slightly higher than January averages at White Mountain I. This is not the case at the lowland stations in the area or at most inland stations in cold-climate regions elsewhere in the United States, where January is nearly always the coldest month, with definite warming occurring in February and, particularly, March. At the two high-elevation stations March is colder than December, an anomaly for the latitude. A continous snow cover during the winter and spring could partially account for this delay in warming at high elevation, but other regions in the United States with persistent snow cover do not show this effect. It is probably the result of the frequent passage of closed low-pressure systems in late winter and spring over the White Mountain area. An analysis of 500 mb (near 18,000 ft or 5,500 m) weather maps shows that these closed lows commonly contain very cold air, which could affect the highest elevations of the White Mountains. At lower elevations the increased solar radiation from longer days and a higher angle of the sun would offset the influence of the cold air aloft. Thus, there is a pronounced lag in temperature increase in late winter and early spring at high elevation in the White Mountains. Significant warming there usually does not occur until mid-May, when the frequency and intensity of the upper-level closed lows diminish. Major cooling throughout the area generally comes in late September and October, at a slower rate at high elevation than the warming in late spring, with a marked decrease in November at all stations.
Midwinter temperatures at White Mountain I are comparable to those in central Iowa, and at White Mountain II to southern Minnesota or Anchorage, Alaska. Summer temperatures at White Mountain I are similar to those at the northern limit of trees in Alaska and Canada, and at White Mountain II to the treeless Arctic Slope of Alaska. At comparable elevations and latitudes, temperatures in the White Mountains are generally warmer in winter and cooler in summer than in Utah or Colorado, reflecting less maritime influence farther inland. From meager data and personal ex-
perience, there seem to be no significant temperature differences between the White Mountains and the Sierra Nevada at similar elevations, although the Sierra might be expected to have warmer winters and cooler summers because of closer proximity to the Pacific Ocean. It is difficult to compare climates in different mountain ranges because of topographical variations at individual recording sites — north slope, south slope, valley, orientation to prevailing winds, and other factors.
Precipitation
As discussed previously, precipitation in the White Mountain area results primarily from the passage of cyclones with associated fronts during fall, winter, and spring; from closed cyclones in late winter and spring; and from the flow of moist tropical air from the southeast to the southwest quadrant in the summer. Annual amounts vary from 5–6 in (125–150 mm) on the valley floors to 20 in (508 mm) or a little more at the highest elevations. Totals appear to increase right up to the crest of the range. The rate of increase averages about 1.5 to 2.5 in per 1,000 ft (120–205 mm per km) rise. However, this average is difficult to apply to any one portion of the range, and the increase is not linear, being higher at upper elevations. Table 1.3 gives average monthly and annual precipitation amounts for stations within the region.
From west to east in the White Mountain area, there are important differences in the seasonal distribution of precipitation. Bishop, on the west, has the typical regime of most California stations: winter wet and summer dry, with January the wettest month. White Mountain I and White Mountain II have precipitation much more evenly distributed throughout the year. At both mountain stations January is the wettest month, but only by a slight margin. There is no pronounced dry season; June is the driest month, reflecting the gap between the cyclones of winter and spring and the thunderstorms of July and August. Early fall is relatively dry, with a gradual buildup of precipitation to the winter months. Deep Springs, at the southeast edge of the White Mountains, has maximum precipitation amounts in January and February, with a minor peak in July and August, and minimum amounts in June and October. On the east margin of the White Mountains, Dyer has a slight maximum in spring and mid-summer and a minor minimum in December and January. At lower elevations, the western slope of the White Mountains is relatively open to cyclones from the west in winter, partially subject to closed cyclones from the north in the spring, and somewhat protected from thunderstorms in the summer. The eastern slope, in the double rain shadow of the Sierra Nevada and the White Mountains, is protected from winter cyclones but is more open to closed cyclones in spring and thunderstorms in summer. Upper elevations in the White Mountains are relatively open to all three types of storms and show a trimodal maximum of precipitation. Thus, the White Mountain range is truly transitional in seasonal distribution of precipitation between the winter maximum of California and the Sierra Nevada and the more even annual distribution of the eastern Great Basin and Rocky Mountains.
Yearly precipitation totals not only increase with higher elevation in the mountains but very likely are larger in the northern part of the range. There are no station
records to substantiate this assertion, but the experience of many long-time residents of the area and of both writers suggests that the portion of the range from White Mountain Peak north to Boundary Peak receives more precipitation from cyclones and thunderstorms than the region south of the main peak. Occasional measurements made with a standard snow sampler at comparable elevations show greater depth and water content in the snowpack in the northern part of the range. There is also higher streamflow, more extensive former glaciation, and a less xerophytic vegetation north of White Mountain Peak. In the nearby Sierra Nevada, snow survey records show a general decrease in precipitation from north to south, reflecting a lower frequency of passing cyclones. This could also affect the White Mountains. Moreover, the crest of the Sierra Nevada is lower opposite the northern half of the White Mountains than opposite the southern half, and this may allow more moisture to reach across to the northern segment of the White Mountain Range. Still another possible effect of the Sierra Nevada is that, as previously mentioned, fronts may be retarded in crossing the massive barrier of that range, bringing in cooler air from the north and northeast, which may strengthen the fronts and increase precipitation in the northern portion of the White Mountains.
Empirical observation also indicates that the buildup of cumulonimbus clouds in summer thunderstorms is more likely to occur over specific portions of the summit upland than at random. Topographic influence on air moving into the area from characteristic directions is the probable cause. This could add a checkerboard pattern of precipitation distribution independent of more general patterns, such as the increase with elevation and from south to north. Four areas of cloud concentration are noticeable. From south to north, these are Sheep Mountain-Piute (or Paiute) Mountain, the plateau just south of White Mountain Peak, Chiatovich Flats and the area just north of the Cabin Creek-Birch Creek saddle, and the northern portion of Pellisier Flats at the head of Chiatovich Creek. Common features of the four areas are rises in elevation from south to north and broad lateral extent from west to east. Cumulonimbus clouds may form over any part of the range on any summer day, and during extensive storms all or most of the higher elevations may be cloud-covered, but initial formation and greater subsequent development more commonly occur over these four areas.
There are significant departures from normal in amounts of precipitation from month to month and year to year at all elevations in the White Mountains. Most weather stations in the United States use the calendar year in calculating annual amounts. This causes problems in much of California, with its winter-wet, summer-dry regime, and in high-mountain regions, where much of the significant precipitation falls as snow. Thus, the annual snowpack begins in the fall of one calendar year and builds to a maximum in late winter or spring of the next calendar year. Most California stations use a 1 July–30 June precipitation year to avoid this problem. An even better breakdown for the White Mountain Range is to use the water year employed by many hydrologists — 1 October–30 September. This has the advantage of including snow buildup and important July and August precipitation in one annual total, thus giving a more accurate figure of the water available for streamflow and plant growth, much of which occurs from July to September.
The following discussion uses the 1 October–30 September year to show extremes and variation from normal (see Table 1.4). Thus, the year mentioned in the table ends on 30 September and includes the precipitation from October through December of the previous year. Bishop and, by inference, the lower western slope of the range show the largest departures from normal, with the wettest year (17.28 in or 43.9 cm) in 1969 and the driest (1.68 in or 42.5 mm) in 1960. This is a range of 308% to 30% of average. Fish Lake Valley and Deep Springs Valley to the east and southeast show less variation, with both Dyer and Deep Springs ranging from about 190% to 40%. White Mountain I had maximum precipitation in 1967 (26.59 in, or 67.55 cm) and minimum in 1960 (5.57 in, or 14.15 mm), a range of 206% to 45%. At White Mountain II the high total was 33.56 in (85.35 cm) in 1967, and the low was 9.51 in (24.15 cm) in 1960, a range of 187% to 53%. It is to be expected that Bishop, with its low annual average, would have a greater variation from normal than the mountain stations, with higher averages. But Bishop also varies more than the other lowland stations. Bishop and the lower western slope of the range receive most of their rain and snow from winter cyclones, and precipitation totals reflect seasons of frequent or sporadic passage of such storms. The eastern valleys and lower slopes get relatively more moisture from spring and summer storms, and the upper elevations are more open to precipitation in all three seasons. At all stations 1967 and 1969 were very wet, and 1960 was the driest year. Unfortunately, records for the obviously wet years of 1982 and 1983 are incomplete or missing at the mountain stations; both years brought high totals to lowland stations. It is noteworthy that neither White Mountain I nor White Mountain II was very dry in 1976 and 1977, critical drought years in central California. At both stations spring and summer precipitation partially
| ||||||||||||||||||||||||||||||
made up for winter deficiencies. It seems probable that higher elevations in the White Mountains are less subject to either very dry or very wet years than the neighboring Sierra Nevada and Owens Valley; there is less chance that all three types of storms will be common or rare in any one precipitation year.
Extreme monthly totals at Bishop vary from 8.93 in (22.7 cm) in January 1969 to 0.00 for all months of the year. At Dyer, the extremes are 3.44 in (8.75 cm) in August 1983 and 0.00 for all months; at Deep Springs, totals vary from 4.86 in (12.35 cm) in August 1983 to 0.00 for all months. At higher elevation, White Mountain I shows a maximum of 7.53 in (19.1 cm) in December 1966 and a minimum of no rainfall or a trace for all months but January; White Mountain II shows a high at 8.55 in (21.7 cm) for December 1966 and a low of no rainfall or a trace for all months but February. However, summer thunderstorms at high elevation have certainly exceeded these monthly totals. In part of July 1955, one of the authors (D. R. Powell) measured over 11 in (28.0 cm) in a standard rain gauge at Chiatovich Flats, between 10,000 ft (3,050 m) and 11,000 ft (3,350 m), 8.48 in (21.55 cm) of which fell in 2 1/2 hours on July 23. This is the greatest 24-hour total yet recorded in the White Mountains, although it probably has been approached or exceeded during other summer thunderstorms in the range. At the two mountain stations, maximum summer 24-hour totals are about 2 in (50 mm). It is evident that neither station has yet been in the direct path of the most intense thunderstorms. White Mountain II has a winter high 24-hour sum of 4.40 in (11.2 cm) on 6 December 1966, and White Mountain I recorded 3.80 in (9.65 cm) on the same date. Dyer and Deep Springs each show about 2 in (50 mm) for the maximum daily total for any season; Bishop has received more than 3 in (7.6 cm) in each of the three winter months, from Pacific cyclones.
Snowfall
At elevations above 10,000 ft (3,050 m), over 80% of the mean annual precipitation falls as snow. On the valley floors, from 15 to 25% of the average precipitation is snow, with wide fluctuations from year to year in the snow-to-rain ratio. Regardless of the temperature of air masses moving onto land, rainfall is rare from November through April at White Mountain I and practically nonexistent from October through May at White Mountain II. Moreover, snow has been recorded, usually in amounts of less than 6 in (15 cm), in all of the warmest months from June through September at White Mountain II (see Table 1.5 for a summary of snowfall).
Average annual snowfall is low at the base of the mountains, with 9 in (23 cm) at Bishop, 12 in (30 cm) at Dyer, and 15 in (38 cm) at Deep Springs. It builds to 106 in (270 cm) at White Mountain I and 164 in (417 cm) at White Mountain II. As discussed earlier, annual totals are very likely higher at upper elevations north of White Mountain Peak. Maximum seasonal snowfall amounts have been 50–60 in (125–150 cm) at Bishop and Deep Springs, and a little less at Dyer, with low average precipitation in winter. Bishop has had a few seasons with no snowfall; the other lowland stations have had at least 1 in (2.5 cm) or more of snow in all years of
| ||||||||||||||||||||||||||||||||||||||||||
record. At higher elevations measurable snowfall certainly occurs every year. Seasonal totals, 1 October to 30 September, range from 170 in (432 cm) in 1969 to 48.5 in (123 cm) in 1960 at White Mountain I, and from 238 in (605 cm) in 1969 to 83 in (211 cm) in 1960, at White Mountain II. Maximum monthly falls are 76 in (193 cm) at White Mountain I, e.g., in January 1969, and 86 in (218 cm) at White Mountain II in December 1966. Maximum 24-hour totals are 38 in (97 cm) at I and 44 in (36.37 cm) at II, both on 6 December 1966. At White Mountain II, 76 in (193 cm) of snow fell on the two days 5–6 December. Daily accumulations of 10–24 in (25–60 cm) are not infrequent at higher elevation. These are impressive figures for any location in the world, though exceeded in the nearby Sierra Nevada, and winter travelers in the White Mountains should be aware of the difficulty and danger of being out in such intense snowstorms, commonly accompanied by high winds. Where snow has been measured for water equivalent in both stations, or elsewhere at high elevations, a ratio of about 10 in (25 cm) of snow, as it falls, to 1 in (2.5 cm) of water is common. In lieu of actual measurements of melted snow, a ratio of 10-to-1 (snow depth to water equivalent) has been used in the records from all stations. A 10% density is occasionally too high, but less commonly too low, for snowfall at the two mountain stations.
Continuous snow cover at elevations above 10,000 ft (3,050 m) usually begins in late October or mid-November but can begin as early as the end of September and as late as February. Disappearance of snow cover usually occurs in May or June at White Mountain I, and in June or July at White Mountain II. Average duration of snow cover is about 160 days at the lower station and 210 days at the higher locations, but there is great variation from year to year, with a range at White Mountain II of 292 days in 1973 to 54 days in 1964. Snow depths at upper elevations generally increase until March or April, and occasionally May. Maximum recorded depth at White Mountain I is 94 in (239 cm), in March 1969, and 123 in (312 cm) at White Mountain II, in the same month. A measurement of 144 in (366 cm) was made with a snow sampler at Chiatovich Flats, at 10,600 ft (3,230 m), in March 1967. It is difficult to measure accurately such parameters as snowfall, snow cover, and snow depth; significant differences can occur in short horizontal distances. Much depends on the location and exposure of the site, the instruments used, the times of observation, and the knowledge, persistence, and hardiness of the observer. It is commonly difficult to differentiate snow that has fallen directly from the sky and that subsequently removed or deposited by wind. Thus, the figures used here should be taken as approximations.
At the base of the mountains snowfall is much lower than above 10,000 ft (3,050 m), but individual storms can still bring impressive 24-hour totals. All of the lowland stations have had daily accumulations up to 20 in (60 cm). Snow cover in the lowlands is discontinuous, with durations rarely longer than six weeks. There is notably rapid disappearance of snow cover on the western slopes of the range, facing Owens Valley, up to elevations of 8,000–9,000 ft (2,440–2,745 m), even following major snowfalls. This slope faces a high angle of the sun during the relatively warm temperatures of afternoon. As expected, snow cover lasts longer on north- and east-facing slopes
than on south- or west-facing ones — often many weeks longer. In late spring and early summer, the snowline is distinctly lower and the cover more continuous in the mountains as viewed from Fish Lake Valley in the east than from Owens Valley in the west.
Precise measurements are nonexistent, but it is obvious that some snow is removed from its site of original fall on the extensive summit upland to slopes and canyons adjacent to the plateau. Because prevailing winds generally have a westerly component, the wind-blown snow is generally deposited on eastern slopes, although occasionally the direction is reversed, especially in conjunction with northeast winds following the passage of storms or with closed cyclones in late winter and spring. Quite probably, the sites of deepest snow accumulation in the White Mountains are at the heads of the major canyons on the east side of the range. Maximum Pleistocene glaciation occurred in these canyons, the heads of which are now steep-walled, east- or northeast-facing cirques — favorable locations for the accumulation and retention of snow. A conspicuous sight from Fish Lake Valley is a discontinuous, but commonly prominent, line of snow cornices at the edge of the summit plateau, commonly lasting through the summer months and sometimes well into fall or until the next season's snowpack begins. A worthwhile addition to the knowledge of the White-Inyo Range climate would be the acquisition of reliable data on how much snow is moved by wind and deposited either east or west of the summit upland. It may well be less than visual inspection, perhaps affected by the discomfort and poor visibility caused by fine blowing snow, indicates. Sporadic measurements of wind-blown snow in the Sierra Nevada in similar terrain do not substantiate the notion of a significant increase in snowpack in leeward sites, except in localized areas.
Wind
Wind is even more difficult to measure accurately than snow. Instruments are commonly of doubtful accuracy, and there are wide fluctuations in speed and even direction in short periods of time at any one location, and across very short horizontal distances. Topography obviously exerts a major influence on wind speed and direction. Wind data, somewhat incomplete, exist for the two mountain stations, and there is a more complete and accurate record at Bishop.
Direction is easier to measure than speed. At both mountain stations, for about two-thirds of the year the prevailing direction (from which the air is moving) is westerly — northwest, southwest, and west. East is the least common, although the northeast can be of importance in some years. At Bishop prevailing directions are northerly and southerly, reflecting the topographical influence of Owens Valley. Fish Lake Valley and Deep Springs Valley very likely have the same regime as Owens Valley.
Maximum wind velocities have approached or exceeded 100 mph (45 m/s) at both mountain stations. The strongest winds usually come in the winter, from west to south in association with storm fronts, or from west to north after frontal passage. Monthly average maximum speeds are about 30 mph (13.5 m/s) during the winter
at White Mountain II and near 20 mph (9 m/s) in the summer; averages are about 5 mph (2.5 m/s) less in all seasons at White Mountain I. At Bishop average speeds are much less than at high elevation, but a peak gust of 75 mph (33.5 m/s) was recorded in August 1976. In general, maximum velocities in the lowlands occur in winter and early spring. Experience indicates that Fish Lake Valley and the eastern slopes of the White Mountains have the highest velocities of the lowland areas.
The intensity, frequency, and duration of high-velocity winds in the White Mountains do not seem extraordinary for a mountain range of its height and latitude. However, an extensive portion of the range above treeline has no shelter from wind. The most notable aspect of wind at higher elevations is not high velocity, although that may occur, but rather the constancy of moderate wind, with a conspicuous lack of calm, even in summer. Significant results of wind are the redistribution of snow, poor visibility from blowing snow, and the wind chill factor. At 10°F (-12°C), a wind speed of 30 mph (13.5 m/s) is calculated to have roughly the same effect on humans as an equivalent temperature of -33°F (-36°C) without wind.
Wind also significantly affects snow texture. At upper elevations the snow surface is seldom smooth or powdery but is generally hard-packed, ridged, and of unequal depth, with patches of bare ground present even in wet years, because of frequent wind action. The snow is commonly packed and ridged as it strikes the ground; most snowstorms occur with moderate to high wind velocities. Despite increasing attention in recent years to the White Mountains as an area for cross-country skiing and winter snow camping, snow conditions in the range are not particularly favorable for such activities. Added to the adverse surface texture is the problem that, in many years, the amount of snow accumulation is insufficient to cover ground irregularities adequately.
Climate Hazards
The traveler or resident in the White Mountains should be aware of troublesome or possibly hazardous weather and climatic conditions that can occur. Snowstorms, sometimes heavy and often accompanied by moderate to high winds, can happen from fall through spring, and even in summer. These may bring poor visibility and drifting snow, which can make vehicular, foot, or air travel difficult or dangerous. From October through May, temperatures well below freezing make frostbite a problem if adequate clothing is not worn. The wind chill factor commonly has the effect on humans of lowering the effective temperature 20 to 40°F (10 to 22°C).
June through September is the thunderstorm season, which can bring flash floods in canyons, such as the Narrows below Westgard Pass, and common lightning strokes. Anyone who has experienced a major thunderstorm above treeline in the White Mountains with little or no protection available is acutely aware of danger from lightning.
At any elevation, but particularly above 10,000 ft (3,048 m), solar radiation — especially ultraviolet — may be intense, resulting all too quickly in painful sunburn and chapped lips. Water is not readily available throughout most of the range, par-
ticularly along the road to the two mountain stations, and dehydration due to the wind and low humidity can be a problem.
Travelers into the White Mountains — by foot, ski, road vehicle, or helicopter — are strongly advised to check weather reports before entering the range. San Francisco, Los Angeles, Reno, and Salt Lake City are major forecast centers, and the National Weather Service station at Bishop can be contacted during daylight hours for briefing on local conditions. Mountain weather is notorious for rapidly developing adverse events, but knowledge of seasonal patterns, empirical observation of cloud sequences, and current information from forecast offices can do much to reduce potential hazards.
References
Goodridge, James D. 1981. California rainfall summary, monthly total precipitation, 1849–1980 . California Dept. of Water Resources.
Holmboe, J., and H. Klieforth. 1957. Investigations of mountain lee waves and the air flow over the Sierra Nevada, final report . Contract AF 19 (604)-708. Meteorology Department, University of California, Los Angeles.
Houghton, J. 1969. Characteristics of rainfall in the Great Basin . Desert Research Institute, University of Nevada System, Reno.
Houghton, J., C. Sakamoto, and R. Gifford. 1975. Nevada's weather and climate . Nevada Bureau of Mines and Geology, University of Nevada, Reno.
National Oceanic and Atmospheric Administration. Climatological data (1950–1990): California, vols. 54–94; Nevada, vols. 65–105 (monthly and daily tabulations and annual summary). NOAA, National Climate Center.
Neiburger, Morris, James G. Edinger, and William D. Bonner. 1982. Understanding our atmospheric environment , 2d ed. W. H. Freeman, San Francisco, p. 453.
Powell, Douglas. 1963. Physical geography of the White Mountains, California-Nevada. M.A. thesis, Geography Department, University of California, Berkeley.
White Mountain Research Station. Unpublished observations from White Mountain Research Station weather recording sites I and II. White Mountain Station, Bishop, Calif.