PART IV—
PHYSIOLOGICAL ECOLOGY
Nineteen—
Apnea Tolerance in the Elephant Seal during Sleeping and Diving:
Physiological Mechanisms and Correlations
Michael A. Castellini
ABSTRACT. To better understand the diving behavior of elephant seals, it is necessary to study how their diving physiology limits their diving behavior and how behavior fits into the window of physiological options. Unfortunately, the diving physiology of elephant seals is very difficult to study because the seals are at sea and inaccessible during most of the year. However, when on land, they exhibit long duration breath holds during sleep that can last over 20 minutes. By studying these periods of breath holding during sleep, we have found that the physiology of sleep apnea appears to be very similar to the physiology of diving apnea. We suggest that the control processes involved in both states may be similar enough to allow us to study some of the aspects of diving physiology by instead examining the animals while they hold their breath on land.
Diving behavior and physiology are integrally related components to the study of "diving biology" in any species. Given the physiological limits that may be placed on a species, diving behavior must fit into those constraints. For example, most natural dives of the Weddell seal, Leptonychotes weddelli , appear to fall within the physiological time window of the seal's aerobic diving limit (Kooyman et al. 1980). While a tremendous amount of knowledge has recently been gained about the diving behavior of the elephant seal, the seal's pelagic nature makes it almost impossible to study diving physiology. However, these seals also exhibit extremely long duration (up to 20 min.) breath holding while sleeping on land. This behavior allows us to study the physiology of apnea under more controlled conditions and extrapolate our findings to what may be occurring during diving apneas at sea. Using this method, we have been attempting to understand some of the components of diving physiology in elephant seals that may not be attainable by other methods. Unfortunately, the sleeping habits of seals are one of
those behaviors that marine mammal biologists have often informally observed but not documented. Consequently, it is "common knowledge" that seals hold their breath while sleeping and that in captivity they often sleep on the bottom of their pools. For example, at the National Zoo in Washington, D.C., there is a sign in front of the gray seal exhibit telling the public that the seals lying motionless underwater on the bottom of the tanks are not dead, just sleeping. There have been very few formal studies of sleeping seals, although there are some data available from various projects in which sleeping seals were coincidentally observed as part of larger behavior or physiology programs. Sleep in seals, however, offers a window into the study of mammalian metabolic and physiological tolerance to apnea that is not easily modeled by any other system. The primary question in this review is whether sleep breath holding is analogous to diving.
The study of the physiology of naturally diving marine mammals is confounded by the fact that the animals are at sea, and it is very difficult to even track them, let alone obtain solid physiological data on basic parameters such as heart rate or body temperature. The vast majority of natural diving physiology data has come from work on Weddell seals in Antarctica. By working on the sea ice from experimental dive sites, scientists have been able to study this species in a relatively confined area and be reasonably sure that the seal will return to the experimental hole after each dive. This experimental protocol has provided most of the physiological data on natural diving in pinnipeds (Kooyman 1981, 1989). Under these conditions, however, natural diving is complicated by its two major components: underwater exercise and breath holding. These two processes compete with one another for the limited supply of oxygen that the seal carries with it from the surface. Exercise increases oxygen demand, while diving calls for reducing oxygen consumption. Seals balance such seemingly conflicting demands on each dive, but it is difficult for the scientist to distinguish how the physiological and metabolic data reflect that balance. For example, does the pattern of heart rate variability during diving reflect the demands of exercise, or does diving reduce the heart rate that would occur if the seal was simply exercising? This may at first seem like a mere semantic distinction, but it is not. To understand how seals survive extremely long periods underwater, it is critical to know how they balance their response to hypoxia and their response to exercise. Understanding this balance is why there has been such a concerted effort to obtain swimming velocities on diving seals. Given a constant supply of oxygen, a seal swimming quickly would presumably consume oxygen faster than if it was swimming slowly. This would make the aerobic dive time shorter and alter underwater efficiency. Such alterations have clear implications for foraging theory and for migration. No matter what aspect of natural diving behavior is being studied, there is always some question about the amount of oxygen carried and the rate at which it is utilized.
How does sleep physiology interact with this area of diving physiology? During the long periods of apnea in sleep, the seal experiences hypoxia but without the simultaneous demands of exercise. Thus, the seal in sleep apnea offers the opportunity to study how the animal reacts to breath holding without the additional energy requirements of swimming, foraging, or underwater traveling. It is a completely natural process in these animals, and as a group, the seals exhibit the longest duration normothermic sleep apnea of any mammal. Long duration sleep-associated apnea appears to be a strictly phocid attribute and has not been seen in otariids or cetaceans. Even so, it has been formally reported in less than half a dozen species of seals. By far, the greatest amount of information on sleep physiology in seals comes from studies of the northern elephant seal. G. A. Bartholomew (1954) first described the phenomenon by placing his hands on the chests of sleeping elephant seals and counting the heartbeats. R. C. Hubbard (1968) discussed the general cardiorespiratory pattern of sleeping elephant seals. A. C. Huntley (1984) cataloged some of the basic cardiorespiratory and sleep stage patterns in pups. S. B. Blackwell and B. J. Le Boeuf (1993) described developmental changes in sleep apnea from birth to adulthood. Since 1987, our laboratory has been involved in detailed studies of the metabolic implications of long duration sleep apnea in seals, mainly elephant seals (for review, see Castellini 1991).
Physiology of Sleep-Associated Apnea
There are four primary areas to consider when discussing the physiology of sleep apnea in seals: respiratory, cardiac, circulatory, and metabolic alterations. The electrophysiology of sleep in pinnipeds is also of great interest but will only be referred to here when sleep staging is important to better understand the four areas noted above. In each of these areas, data from diving apnea will be compared and contrasted. The goal of this section is to ask how sleep and dive apnea may be related, keeping in mind that while at sea, seals may sleep while at depth and thus combine the two events. Most of this information comes from studies on elephant seal pups, with some comparative work on Weddell seals. This is all very recent work and is still in the process of being analyzed. Thus, a great deal of this discussion is based on personal observations, but references to work already published will be noted as available.
Respiratory Pattern
In elephant seal pups, the typical respiratory pattern while sleeping is to link together several periods of apnea and eupnea into one "bout" of sleep. Thus, the seal may sleep for 30 to 40 minutes and during that time go through a 10-minute period of apnea, 2 to 3 minutes of eupnea, another apnea, another short eupnea, and then a final apnea before waking. Figure
Fig. 19.1
Polygraph recording of a sleeping, 3-month-old northern elephant seal pup. The top line is a time trace with 5-second tick marks.
Line 2 is the electroencephalogram (EEG) showing large-voltage, slow-frequency recordings typical of slow wave sleep (SWS).
Line 3 is a respiratory trace showing the end of a 12-minute apnea, about 2.6 minutes of eupnea, and then the beginning of
another apnea. Line 4 is the instantaneous heart rate showing the low heart rate during apnea, the postapnea tachycardia,
the appearance of the normal sinus arrhythmia, and then the low heart rate of the next apnea. The heart rate calibration is on
the left. Line 5 is the electrocardiogram (EKG), which varies depending on the respiratory cycle.
19.1 shows a short (2.5-min.) breathing interval between two longer apnea periods. There are many variations to this pattern, but it is critical to note that apnea is not a prerequisite for sleep (i.e., a seal can be ventilating and sleeping) and that sleep is not a prerequisite for apnea (an awake seal can breath hold). However, the longest apneas appear only during sleep, and awake apnea seems to have a limit of about 5 minutes. The longest period of apnea that has been reported on a 4-month-old elephant seal pup is just over 11 minutes (Castellini, Costa, and Huntley 1986), but recent recordings have exceeded 14 minutes. Average apnea duration ranges from about 6 to 8 minutes for a 3½- to 4-month-old pup. It is interesting to note that the pattern of long apnea relative to short eupnea is similar to the repetitive diving habits of both elephant seals (Le Boeuf et al. 1986) and Weddell seals (Castellini, Davis, and Kooyman 1988). This pattern implies that oxygen loading and carbon dioxide dumping are accomplished quickly during the respiratory period and that there is no metabolic processing of hypoxic end products. In fact, as will be discussed in detail later, there is no apparent change in plasma lactate or glucose during or after sleep apnea in elephant seals. Neither we nor Hubbard (1968) were able to find a clear correlation between the length of the eupnea and the length of the preceding apnea, although Huntley (1984) saw such a relationship in his study, which was conducted using different methods on restrained pups. Similarly, there is no relationship between the surface interval duration and preceding dive duration interval in elephant seals (Le Boeuf et al. 1988). In Weddell seals, there is no relationship between dive time and surface time during aerobic diving, but there is a longer surface recovery time correlated to increasing postdive lactate loads after anaerobic diving (Kooyman et al. 1980). Thus, both sleep apnea and diving apnea have the similar appearance of short eupnea periods between longer apnea periods, occur in bouts, and appear to be mostly aerobic.
Cardiac Pattern
The bradycardia associated with natural diving seals is well documented and has been shown to be related to the length of the dive (Kooyman and Campbell 1973) and to ascent and descent patterns (Hill et al. 1987) and therefore, presumably, to both effort and the need to stay underwater as long as possible. Similarly, Bartholomew (1954) noted that there was bradycardia in sleeping elephant seals with a reduction in heart rate from about 65 beats per minute (BPM) to 54 BPM in adults. G. L. Kooyman (1968) recorded the heartbeats of sleeping Weddell seals and also observed a decline in heart rate of about 30 to 40% in adults. S. H. Ridgway, R. J. Harrison, and P. L. Joyce (1975) demonstrated a slowing of heart rate in sleeping gray seals, and Huntley (1984) recorded the electrocardiogram (EKG) of restrained, sleeping elephant seal pups and showed that the aver-
age sleeping heart rate declined during apnea to about 70% of average, awake, breathing values. This pattern of bradycardia during the sleep apnea in seal pups appeared straightforward until we recently found two patterns that suggest the heart rate changes may be more complicated. First, the "bradycardia" in sleeping northern elephant seal pups seems to be age related in that 2-month-old pups neither drop their heart rate as low as 4-month-old pups nor seem to hold the heart rate steady during apnea. This same pattern has been seen in Weddell seal pups (Kooyman 1968). Second, there may not actually be a true bradycardia in the sense of the dramatic instantaneous decline seen in diving animals. By analyzing the EKG with an instantaneous beat-to-beat heart rate analyzer, we found that during eupnea, the older pups show a normal sinus arrhythmia. That is, as they inhale, heart rate increases, and as they exhale, heart rate declines. During eupnea, heart rate varies from about 80 BPM high to about 50 BPM low, for an "average" heart rate of about 65 BPM. As the pups enter into apnea with the last exhalation of their breathing period, the heart rate declines just as it had during the exhalation in eupnea and then stays at the 50 BPM rate during the long apnea. This pattern is clearly shown in figure 19.1. Thus, it seems that the "bradycardia" associated with sleep apnea is actually the low heart rate of a normal respiratory cycle and that the apnea is just a very long breath pause, at least in terms of cardiac control. The only time that the heart rate becomes very low during sleep is when the pup moves from slow wave sleep (SWS), which is the predominant type of sleep state, into rapid eye movement (REM) sleep. At this point the heart rate can get very low (around 20–25 BPM) and become quite variable.
The heart rate of freely diving elephant seals is being studied at this time (R. Andrews, pers. comm.). Preliminary evidence suggests that the most common heart rate of freely diving elephant seals may, in fact, be closer to the rate seen during sleep apnea than to low rates more often associated with forced diving conditions. However, very low heart rates have been observed and reinforces the point that the heart rate in these animals is not a reflex and is probably under higher-level control. Therefore, what at one time seemed to be clear sleep and dive apnea bradycardia may not remain as clear as more information is collected.
Circulatory Alterations
In 1980, Kooyman et al. found that the hemoglobin (Hb) levels in the blood of freely diving seals varied before and after dives. When the seals returned from a dive, the Hb levels would be high but declining. Later, J. Qvist et al. (1986) showed that Hb and hematocrit (Hct) in Weddell seals began to increase as soon as the dive began, leveled out at high values during the dive, and then declined afterward. M. A. Castellini, R. W. Davis, and G. L. Kooyman (1988) showed that the Hct in Weddell seals tended to
stay high during an entire diving bout and only returned to resting levels during very long breaks in diving. This variation in Hct has been proposed to be caused by the sequestering and release of red blood cells (RBC) by the spleen during diving events (Zapol 1987). The maximization of Hct in the interdive surface interval would certainly facilitate the rapid loading of oxygen and also maximize the amount of oxygen that could be carried by the blood. Increased Hct is also known to occur in racing horses and dogs during sprint events (Harris et al. 1986). This is a perfect example of the difficulty of trying to separate diving into its exercise and apnea components. Does the change in Hct in diving seals come about because of exercise, or is it related to breath holding? As it turns out, sleeping seals may provide the answer.
In 1986, M. A. Castellini, D. P. Costa, and A. C. Huntley found that the Hct in sleeping elephant seal pups began to increase as soon as the apnea started and then declined as soon as breathing began. It has recently been found that when several apnea-eupnea-apnea cycles are linked together, the Hct stays elevated during the entire cycle and then drops to resting values when the pup is awake and breathing for a long period. Therefore, it seems reasonable to conclude that the change in Hct that occurs in diving seals most likely arises from the apnea response and not from exercise. If the spleen is the modulating organ for this phenomenon, then it must begin to contract on the initial apnea and sequester RBC during eupnea. However, if the next apnea follows soon after the short eupnea, there would not be enough time for all the cells to be gathered, and thus the Hct will stay somewhat elevated during the breathing period.
The striking similarity between the diving and sleeping apnea alterations in Hct suggests that the neurological mechanisms involved in initiating and maintaining the apnea are the same for both diving and sleeping. This is a critical point because sleep apnea in seals appears to be centrally controlled. That is, it is a neurologically influenced event and not obstructive apnea. In obstructive apnea, which is very common in humans, the upper airway becomes blocked during sleep as the tissues around the trachea relax and the patient begins, essentially, to suffocate. In obstructive apnea, the patient tries to breathe but cannot and must awaken to break the pattern (Strohl, Cherniak, and Gothe 1986). In seals, there is no attempt to breathe during the sleep apnea event (fig. 19.1). The apnea is controlled from higher central nervous system centers, and the same neural inputs that initiate the breath hold must also contract the spleen. The advantage of a high Hct, in both sleeping and diving seals, is that they can load oxygen quickly during the short eupnea period following the apnea.
There are additional changes that occur in the circulation of sleeping seals that strike parallels with the diving condition. It is well known that there are marked circulatory perfusion shifts that occur in diving seals. The
classic dive response involves shunting blood flow away from the peripheral tissues and conserving the oxygen-rich blood for the more aerobic central organs, such as the brain and heart. This shunting has been visualized in a variety of methods, but one that is relevant here is a procedure that examines how plasma radioisotope tracers can show such shifts. When a radioactive metabolic tracer is injected into the circulation of a diving seal, the tracer slowly equilibrates into the blood pool and is only slowly utilized until the dive ends. At that point, the tagged tracer is metabolized at the normal resting rate. At the point of inflection, the specific activity of the tracer in the plasma falls dramatically and provides a qualitative method to visualize the transition. This process appears to occur in both laboratory dives (Castellini et al. 1985) and natural dives (Guppy et al. 1986). Similarly, such transition points have been observed at the apnea/eupnea transition at the end of sleep apnea in northern elephant seal pups (Castellini 1986). When a tracer is injected into a sleeping seal, it follows a distinct pattern during the apnea and is then altered as soon as breathing occurs. These data imply that the same type of circulatory shifts that have been so well documented in diving seals may also occur in the sleeping seal.
On the basis of these two different indications of circulatory modifications that occur in sleeping seals, it is tempting to suggest that many of the same control mechanisms that regulate circulation during diving also occur in the sleep apnea event.
Metabolic Changes
While diving, there are a variety of blood chemistry changes that can occur. The first and most obvious is that blood oxygen decreases as the dive progresses, and the animal becomes hypoxic. Carbon dioxide partial pressure increases, and there is a respiratory acidosis induced by the high CO2 (Kooyman et al. 1980; Qvist et al. 1986). During long dives, beyond the aerobic diving limit (ADL), lactate accumulates in the periphery and is flushed into the circulation when the peripheral tissues are reperfused after the dive ends (Guppy et al. 1986; Kooyman et al. 1980). Despite the low oxygen levels that are reached in all dives, the majority of dives, at least in Weddell seals, are known to be aerobic and do not show the characteristic increase in lactate after the dive. Similarly, the concentration of plasma glucose, the ultimate substrate for the lactate, drops during anaerobic diving but does not change during aerobic diving (Castellini, Davis, and Kooyman 1988; Guppy et al. 1986; Kooyman et al. 1980). Finally, during bouts of dives, there appears to be very little change in glucose or lactate over hours of diving unless a long dive occurs (Castellini, Davis, and Kooyman 1988).
During sleep apnea, blood oxygen declines to very low levels, CO2 increases, and there is a respiratory acidosis (Kooyman et al. 1980). However, plasma lactate and glucose remain stable and do not change before,
during, or after any single apnea or bout of apnea (Castellini, Costa, and Huntley 1986; Castellini and Castellini 1989). Thus, sleep apnea would appear to be mostly aerobic. This makes sense, since the seal sleeping on the beach can simply breathe when it becomes necessary. However, this does raise an interesting problem for seals that may be sleeping underwater at sea. If a sleeping seal has dropped its blood oxygen and raised its carbon dioxide to the point where is it necessary to breathe, it cannot ventilate if it is at 500 m depth. It would seem to be necessary for the seal to either awaken and swim to the surface or to somehow stay asleep and get to the surface. We know that sleeping elephant seal pups can come to the surface from about 0.5 m in a tank and ventilate without having to awaken. But floating to the top of a 0.5 m tank is considerably different from swimming to the surface from 500 m. We are left with trying to construct a control mechanism that signals to the seal when it will be necessary to breathe and get the animal to the surface while it is sleeping. Perhaps, however, elephant seals do not sleep while at sea, although this is unlikely given that they are pelagic for months at a time.
There is one last area of metabolic alteration that is of importance, and this concerns the metabolic cost of diving or sleeping. In Weddell seals, it has been shown that diving is not very costly and only elevates metabolism by 1.5 to 2 times over resting (Kooyman et al. 1973). We have recently found that for dive events and sleep apnea events of the same duration, diving only costs about 1.5 times the cost of sleep in Weddell seals (Castellini, Kooyman, and Ponganis 1992). If this is an energy demand that is typical of phocids, then we might be able to predict the metabolic cost of diving in elephant seals from the oxygen requirements of sleeping. For elephant seal pups, this would not be a difficult calculation, because there is a considerable amount of data available on the oxygen consumption patterns of pups during both apnea and eupnea periods. For adult elephant seals, however, this would involve finding a way to measure the oxygen consumption rate of a large and intractable animal. However, measuring the oxygen consumption rate of a sleeping elephant seal on land is infinitely easier than obtaining the same information on one that is diving at sea.
Conclusion
Are diving and sleep apnea similar? Based on the information available, it would appear that many of the same responses seen in diving seals occur in seals that are breath holding on land. Given that it is much easier to study sleeping seals on land than diving seals, this approach could be worthwhile as a starting point for species that are simply too difficult for study while at sea. However, the study of sleep apnea in and of itself is also interesting
and has implications for the study of sleep apnea syndrome and sudden infant death syndrome (SIDS) in humans. Sleep apnea in seals is perfectly normal; it is not a disease or a syndrome and instead is part of a natural breathing pattern and is adaptive for a diving life-style.
The goal here was to relate some of the physiological mechanisms involved in the phenomenon of breath holding during sleep to breath holding while diving. After years of work in this area, our conclusions are that the two events are extremely similar and that many of the same control processes are involved. In the future, it is our hope that when seals are sleeping during a biological study, the scientists involved will not just casually note that the seal is resting but will instead look a little closer at an event that is like no other in the mammalian order.
References
Bartholomew, G. A. 1954. Body temperature and respiratory and heart rates in the northern elephant seal. Journal of Mammalogy 35: 211–218.
Blackwell, S. B., and B. J. Le Boeuf. 1993. Developmental aspects of sleep apnoea in northern elephant seals, Mirounga angustirostris. Journal of Zoology, London 231: 437–447.
Castellini, M. A. 1986. Visualizing metabolic transitions in aquatic mammals: Does apnea plus swimming equal "diving"? Canadian Journal of Zoology 66: 40–44.
———. 1991. The biology of diving mammals: Behavioral, physiological, and biochemical limits. In Advances in Comparative and Environmental Physiology , vol. 8, 105–134. Berlin: Springer Verlag.
Castellini, M. A., and J. M. Castellini. 1989. Influence of hematocrit of whole blood glucose levels: New evidence from marine mammals. American Journal of Physiology 256: R1220–R1224.
Castellini, M. A., D. P. Costa, and A. C. Huntley. 1986. Hematocrit variation during sleep apnea in elephant seal pups. American Journal of Physiology 251: R429–R431.
Castellini, M. A., R. W. Davis, and G. J. Kooyman. 1988. Blood chemistry regulation during repetitive diving in Weddell seals. Physiological Zoology 61: 379–386.
Castellini, M. A., G. L. Kooyman, and P. J. Ponganis. 1992. Metabolic rates of freely diving Weddell seals: Correlations with oxygen stores, swim velocity, and diving duration. Journal of Experimental Biology 165: 181–194.
Castellini, M. A., B. J. Murphy, M. Fedak, K. Ronald, N. Gofton, and P. W. Hochachka. 1985. Potentially conflicting demands of diving and exercise in seals. Journal of Applied Physiology 251: R429–R431.
Guppy, M., R. D. Hill, R. C. Schneider, J. Qvist, G. C. Liggins, W. M. Zapol, and P. W. Hochachka. 1986. Microcomputer-assisted metabolic studies of voluntary diving of Weddell seals. American Journal of Physiology 250: R175–R187.
Harris, R. C., J. C. Harman, D. J. Marlin, and D. H. Snow. 1986. Acute changes in the water content and density of blood and plasma in the thoroughbred horse during maximal exercise: Relevance to the calculation of metabolic concentra-
tions in these tissues and muscles. In Equine Exercise Physiology , ed. J. R. Gillespie and N. E. Robinson, 464–475. Davis: ICEEP.
Hill, R. D., R. C. Schneider, G. C. Liggins, A. H. Shuette, R. L. Elliot, M. Guppy, P. W. Hochachka, J. Qvist, K. J. Falke, and W. M. Zapol. 1987. Heart rate and body temperature during free diving of Weddell seals. American Journal of Physiology 253: R344–R351.
Hubbard, R. C. 1968. Husbandry and laboratory care of pinnipeds. In The Behavior and Physiology of Pinnipeds , ed. R. J. Harrison, R. C. Hubbard, R. S. Petersen, C. Rice, and R. J. Schusterman, 299–383. New York: Appleton-Century-Crofts.
Huntley, A. C. 1984. Relationships between metabolism, respiration, heart rate, and arousal states in the northern elephant seal. Ph.D. dissertation, University of California, Santa Cruz.
Kooyman, G. L. 1968. An analysis of some behavioral and physiological characteristics related to diving in the Weddell seal. In Antarctic Research Series , vol. 11, Biology of the Antarctic Seas III , ed. W. L. Schmidt and G. A. Llano, 227–261. Washington, D.C.: American Geophysical Union.
———. 1981. Weddell Seal: Consummate Diver . Cambridge: Cambridge University Press.
———. 1989. Diverse Divers: Physiology and Behavior . Berlin: Springer Verlag.
Kooyman, G. L., and W. B. Campbell. 1973. Heart rate in freely diving Weddell seals (Leptonychotes weddelli ). Comparative Biochemistry and Physiology 43: 31–36.
Kooyman, G. L., D. H. Kerem, W. B. Campbell, and J. J. Wright. 1973. Pulmonary gas exchange in freely diving Weddell seals. Respiration Physiology 17: 283–290.
Kooyman, G. L., E. A. Wahrenbrock, M. A. Castellini, R. W. Davis, and E. E. Sinnett. 1980. Aerobic and anaerobic metabolism during voluntary diving in Weddell seals: Evidence of preferred pathways from blood chemistry and behavior. Journal of Comparative Physiology 138: 335–346.
Le Boeuf, B. J., D. P. Costa, A. C. Huntley, and S. D. Feldkamp. 1988. Continuous, deep diving in female northern elephant seals, Mirounga angustirostris. Canadian Journal of Zoology 66: 446–458.
Le Boeuf, B. J., D. P. Costa, A. C. Huntley, G. L. Kooyman, and R. W. Davis. 1986. Pattern and depth of dives in northern elephant seals, Mirounga angustirostris. Journal of Zoology, London 208A: 1–7.
Qvist, J., R. D. Hill, R. C. Schneider, K. J. Falke, G. C. Liggins, M. Guppy, R. L. Elliot, P. W. Hochachka, and W. M. Zapol. 1986. Hemoglobin concentrations and blood gas tensions of free-diving Weddell seals. Journal of Applied Physiology 64: 1560–1569.
Ridgway, S. H., R. J. Harrison, and P. L. Joyce. 1975. Sleep and cardiac rhythm in the gray seal. Science 187: 553–555.
Strohl, K. P., N. S. Cherniak, and B. Gothe. 1986. Physiologic basis of therapy for sleep apnea. American Reviews of Respiratory Disease 134: 791–802.
Zapol, W. M. 1987. Diving adaptations of the Weddell seal. Scientific American 256: 100–107.
Twenty—
Expenditure, Investment, and Acquisition of Energy in Southern Elephant Seals
Michael A. Fedak, Tom A. Arnbom, B. J. McConnell, C. Chambers, Ian L. Boyd, J. Harwood, and T. S. McCann
ABSTRACT. Information on the expenditure and investment of energy in southern elephant seals, Mirounga leonina , was collected during breeding and molt over four field seasons at South Georgia. Weight and body composition changes of mothers, pups, and breeding males were monitored during the breeding season. These changes were also measured in adult females, before and after the 70-day period when animals fed at sea between breeding and molt. During this period, information on foraging movements and behavior was gathered using purpose-built satellite-relay data loggers. Body composition changes were measured using isotope dilution techniques.
Breeding energetics information is discussed in relation to the evidence for differential investment in male and female pups. Large females produce larger pups, both at birth and weaning. Male pups are born larger than female pups. However, there is no evidence that mothers invest more energy (either relative or absolute) in male pups after birth once female size and birth weight are taken into account.
Foraging movements and diving behavior are discussed in terms of the oceanography of the foraging area and possible constraints placed by prey consumption on the seals' dive behavior. We suggest that the long distance travel of females to distant feeding locations may be advantageous in providing for the requirements for reliable food sources in a long-lived, uniparous mammal. Dive characteristics changed during the different phases of activity in foraging animals in relation to the average daily velocity of the animal, water depth, and undersea topography.
Southern elephant seals divide their year between land and sea. While on land, they breed and molt, expending energy and material that was stored in their bodies while foraging at sea over the remainder of the year. Some energy is invested in the production of young and some in new skin and hair, while the remainder is metabolized to support the animal during the fasts associated with these activities. Southern elephant seals separate these
periods of net energy loss, both geographically and temporally, from their foraging efforts. This presumably allows them some freedom in their choice of the location of their breeding and molting areas and can help to insulate them from local changes in the abundance of prey. The sharp distinction between periods of net energy gain and loss and the temporal separation of breeding and molt make it possible to study each of these phases of the life history separately. Because there is no feeding during either the breeding or molting periods and the animals are on land and accessible during these times, the behavior and energy expenditures of these activities can be studied using relatively straightforward techniques.
The same cannot be said of studies of the periods of energy gain while the animals are at sea. Because the southern elephant seals that breed on South Georgia have a very large number of widely scattered breeding and molting sites from which to choose and because travel on the island (and to other islands) is difficult, recovery of time-depth recorders from animals is uncertain; this makes the use of telemetry advantageous. However, the scale and remoteness of the Southern Ocean make this difficult. The study of the dive behavior of the species therefore has lagged behind that of northern elephant seals (M. angustirostris ). However, a combined data logger/Argos transmitter has been developed by the Sea Mammal Research Unit (SMRU) to gather detailed information about their movements and behavior while at sea. These devices are now producing a flood of new information on the southern species.
Here, we bring together information collected as part of a joint program involving the SMRU, the British Antarctic Survey, and the University of Stockholm on (1) breeding energetics, (2) parental investment, and (3) energetics and behavior of molting and foraging in this species. The information was collected over four field seasons from 1986 to 1991 at Husvik, South Georgia. It presents work in the process of analysis and publication and is preliminary attempt to synthesize the energetics of the life history of this species.
Using a combination of techniques (serial weight changes and isotope dilution measurements of body composition), we provide information on the energy expenditure of female southern elephant seals during breeding and molt and relate this to their size, their energy stores, and the sex and growth of pups. We use this information to consider the evidence for differential parental investment in this species. We briefly consider the reproductive effort of harem males and compare this with that of females. We then present information on foraging behavior of females and their weight gain during the period at sea between breeding and molt using serial weight changes and position and dive depth/velocity information provided by the satellite-relayed data logger.
Expenditure and Investment While Ashore
Overview of Reproductive Season and Annual Cycle
Southern elephant seals have a circumpolar distribution in the Southern Ocean. They breed during October and November on a small number of subantarctic islands and mainland sites in South America (Ling and Bryden 1981; Laws 1984). Approximately half of the world population breeds at South Georgia (54°S, 35°W) (McCann and Rothery 1988). Female southern elephant seals may begin to breed at 3 years of age, but the majority do not come ashore to breed until age 4 or 5 (Laws 1960; McCann 1980, 1981). Pregnant female southern elephant seals begin to arrive on beaches on South Georgia in mid-September, after some males have made an appearance. New females continue to appear until early November. They give birth about one week after arrival and nurse their pups for 18 to 23 days. Mating occurs after an average of about 22 days. Pups are weaned when females leave the beach but then remain ashore for 3 to 6 weeks. After breeding, females spend around 70 days at sea, then come ashore again for approximately one month to molt (Laws 1956). Males spend more time ashore while breeding and molt about one month later than females.
An Important Proviso
Breeding female elephant seals vary greatly in size: the largest females may weigh three times more than the smallest. We have tried to include in the study significant numbers of the smallest and largest animals on the beaches. Very large and small animals are probably somewhat overrepresented in the sample, and, therefore, the distributions about the means for some of the variables of interest are probably not representative of the population norms. Rather, the sample emphasizes the potential range of values the variables can take and the relationships possible over the size range of females in the population.
Growth of Pups
Table 20.1 summarizes information on weight changes for a sample of females and pups taken in 1986 and 1988 at Husvik, South Georgia. Pups are born weighing an average of 43 kg; males average 6 kg heavier than females (McCann, Fedak, and Harwood 1989). Overall, birth weight is positively correlated with the maternal weight, although this correlation is significant in female pups but not in males when the sexes are treated separately. Growth during lactation follows a roughly sigmoid trajectory (fig. 20.1). It may begin during the first day after birth, but in some pups, it may be negligible or even negative for the first 1 to 10 days. A period of constant growth rate follows this postpartum lag. This is in turn followed in
| ||||||||||||||||||||||||||||||||||||||||||||||||||||||||||||||
Fig. 20.1
Weight changes in male (arrows) and female (circles) pups. Growth follows a roughly sigmoid
trajectory with a variable lag and some indication of a growth slowdown near weaning.
many cases by a decreasing rate just prior to weaning. Size at weaning is not highly correlated with weight at birth, and the size advantage held by males at birth is often lost by the time of weaning. Average weight at weaning of male and female pups is not significantly different if the size of their mothers and the size of pups at birth are taken into account. This results from the fact that larger females produce larger pups and that the average weight of mothers of male pups was significantly larger than that of female pups, primarily because few small females in the sample had male pups (see discussion below).
Weight Loss of Females
The rate at which females lose weight during lactation depends, in part, on their size; large females lose weight more rapidly than small ones (fig. 20.2a), but they also tend to produce larger pups (fig. 20.2b). Overall, there is no clear difference in the growth of male and female pups (table 20.1) or the weight loss of their mothers when one accounts for differences in the size of the mothers and the birth weight of their pups. However, some small females that produced male pups lose more weight than might be expected, and their male pups seem to grow somewhat faster than average for pups of females of this size (fig. 20.2b). However, there are few small females with male pups in the sample (in spite of the effort to sample small females), and this trend would require much larger sample sizes to establish.
Changes in Body Composition
After weaning their pups, some females leave the beach looking extremely thin, while others (often the largest) look quite fat. This suggested to us that in spite of the fact that larger females produce larger pups at both birth and weaning, there might still be a differential investment with respect to the size or age of the mother. There might be large differences in resources available in small and large females, and although larger females tend to produce larger pups, the amount invested relative to the amount available (relative investment) might vary as a function of size. To measure this investment in terms of energy and materials and to compare it to the resources that mothers of different sizes had available, the body compositions of 45 females were measured at the beginning and end of lactation during 1986 and 1988 (Fedak et al. 1989) using isotope dilution techniques (Reilly and Fedak 1990).
Table 20.2 gives the average use of energy, fat, and protein for the nursing females in the sample, subject to the proviso noted above. On average, approximately 40% of the energy, 47% of the fat, and 17% of the protein in the body is utilized in producing a pup. However, these amounts vary
Fig. 20.2
(A) The relationship between initial female mass and daily weight loss
split by male (arrows) and female (circles) pups. Large females lose
weight more rapidly than small females; some small mothers of male
pups lose weight rapidly. (B) The relationship between initial female
mass and male (arrows) and female (circles) pup mass at weaning.
Large females produced larger pups. The relation is significant (p < .01)
for female pups but not for males when sexes are considered
separately. See fig. 20.3 for explanation of symbol sizes.
| ||||||||||||||||||||||||||||||||||||||||||||||||
widely among individual females (fig. 20.3). Some very large females used as little as 30% or less of the total energy or fat available. In contrast, some of the smallest females that produced large pups used almost 60% of the total energy in their bodies and up to almost 70% of the fat. Some of the smallest females used little of their reserves, but these were mothers who produced pups in the lowest quartile of weaning weight.
One way of viewing this distribution of data is to consider females in order of decreasing size. The largest females can produce even the largest pups with small relative investment; indeed, in theory, some have sufficient reserves to produce two. Some midsize females can produce large pups with no more than average relative investment. But small females face a problem: if they produce pups of average size or greater, they will use a very large fraction of their reserves, possibly with deleterious effects on their subsequent reproduction or survival (Huber 1987; Reiter and Le Boeuf 1991). If they produce small pups, these pups may have a reduced probability of survival to adulthood. The best option for small females might be to abort their pup as early in gestation as possible if their own size at parturition will fall below that necessary to produce a viable pup.
Thus, we could view the distribution of investments in figure 20.3 as reflecting a solution to this dilemma. As female size decreases, relative investment increases up to a point; at weights below the median of female size, females produce either normal pups at very high relative investment or very small pups, well below median size. Indeed, the small number of small females with pups of any size in the sample may well suggest that many small females either do not become pregnant or abort before term.
Fig. 20.3
The relationship between initial female mass and the percentage of energy
stores used in nursing male (arrows) and female (circles) pups. Symbol
size reflects pup size in quartiles: the largest symbol indicates pups in the
highest quartile of weaning weight, and so forth. Note the marked
variation in relative investment with changes in female size.
Energetics of Reproduction in Males
The information presented below on weight changes of males is an interim and incomplete presentation of our data. We include it here to complement the data on northern elephant seal bulls (Deutsch et al., this volume).
Male elephant seals on South Georgia may become sexually mature at 5 to 6 years of age, although most harem bulls are probably 9 to 12 years old (McCann 1981). As is true among females, a very wide size range of animals is present on the breeding beaches. Bulls occupying positions within harems typically weigh 1,500 to 3,000 kg, and weights up to 3,700 kg have been reported (Ling and Bryden 1981). Bulls peripheral to harems may weigh as little as 1,000 kg. The duration of the bulls' stay in and around harems is also very variable. In our sample, the longest stay was 73 days; the average was 58 days. Males lost weight at 12 to 15 kg per day while ashore, although one male lost weight at a prodigious 20 kg/day. Typical males lose around 700 kg during their breeding fast, and some lose up to 1,000 kg.
When compared to lactating females, the rate of weight loss and total
weight loss are much greater and more variable. Females lose around 8 kg/day for 23 days or about 180 kg. Much of this loss is material, largely fat and protein, transferred to their pup. Male losses are largely metabolic, probably mostly fat consumed to provide energy for breeding activity. While males are 2 to 8 or more times the size of breeding females, their total losses are only about 4 times as great, even though they may spend double the time breeding and fasting.
These rates of weight loss are larger than similar estimates for northern elephant seal bulls (Deutsch et al., this volume). This is not unexpected, since southern elephant seal bulls are somewhat larger. The spatial organization of harems on South Georgia is also quite different from that on most northern elephant seal beaches. Harems on South Georgia tend to be linearly arrayed along the shoreline and are often separated by unoccupied beach or rocky headlands. This distribution may require a swim if males from one harem are to visit another. The number of interactions between animals could therefore be quite different when compared to northern elephant seals among which harems often spread back from the beach and are more crowded. This might well influence the energy used during breeding.
Behavior and Energetics of the Molt in Females
Less is known about the behavior of animals during the annual molt or the energetic and material requirements of this phase of the life cycle of southern elephant seals. However, we have begun work to find out how much energy animals use during the molt and how much energy they gain while at sea between breeding and molt (Boyd, Arnbom, and Fedak, 1993). During the breeding season of 1990–1991 at Husvik, we captured 20 females late in lactation, weighed them, determined body composition isotopically, and marked or radio tagged them. Some were recaptured when they made landfall at the start of the molt and again 2 to 4 weeks into the molt and the procedures repeated. During the molting period, individual animals were located every few days until they left the Stromness Bay area. Reports of this study are now in press (ibid.), and we can now make some statements about the behavior and weight changes during the molt and about the weight gains while the animals are at sea between breeding and molt.
Adult females begin to arrive in significant numbers at molting sites around Husvik in mid-January (Laws 1960). Roughly one-third of the females tagged at breeding returned to the Stromness Bay area to molt. One female molted in another bay 10 km away in an area inaccessible to us, but we could monitor her presence via a VHF radio. At least two of the radio-tagged seals are known to have molted away from South Georgia on islands near the Antarctic Peninsula.
Several phases seem to occur during the molt in terms of both the mor-
phological changes (Worthy et al. 1992) and, from our observations, the behavior of the animals. When radio-tagged animals first come ashore, they may make landfall at one site and then reenter the water and move to other sites, sometimes many kilometers away. They are often quite mobile for several days before settling down in a "wallow" or other place not immediately adjacent to the water's edge. Once in such a spot, they often remain there for 7 to 14 days while their old hair and skin loosens and falls away. Once this stage is complete and new hair begins to be detectable by touch, they often move out of the wallow to areas where their skin remains relatively clean and dry. During this period, hair growth continues and animals lose the velvet feel and appearance they have when leaving the wallows. They often move close to shore during this time and, on warm days, enter the water occasionally. Once at the shore, they may later move along it to more exposed locations on points and rocky headlands. Some animals were found along the shore for many weeks after leaving wallows and after hair seemed completely regrown. These changes in behavior may be related to underlying thermoregulatory or mechanical needs associated with shedding and regrowth of hair and skin.
During this period, animals lost 4 to 5 kg/day, a rate slightly greater than that of northern elephant seals (Worthy et al. 1992), but the animals in that study were somewhat smaller. This loss is roughly half that during lactation. If animals remain ashore for 30 days, the total loss may approach two-thirds to three-fourths of the lactational loss. The chemical composition or the weight lost is slightly different from that lost during lactation, with 39% of the loss being fat and 16% protein (Boyd, Arnbom, and Fedak 1993) compared with 47% fat and 17% protein during lactation. Thus, each year, females invest half as much energy in their skin as they do in their offspring. It seems fair to say that elephant seals look after their own skin.
Acquisition of Energy:
Movements and Behavior at Sea
Little is known about where southern elephant seals go after leaving breeding and molting beaches. But as this and other chapters in this volume demonstrate, we are starting to acquire information on foraging movements and diving behavior to complement the serial data on individuals gathered before and after they go to sea. Gathering such serial data is difficult at South Georgia because animals may breed and molt on widely separated islands and because of the large number of inaccessible breeding and molting sites available to animals that do return over several years.
Animals that bred and returned to the Husvik area to molt tended to arrive for the molt in the same order in which they left the beach after breed-
Fig. 20.4
The tracks of three postbreeding females obtained from Argos-compatible
transmitter packages. The cross-hatched area is the continental shelf. Locations
with a Location Quality Index (LQI) = 0 are shown as a cross and those with
LQI > 0 as a circle. All three seals swam southwest from South
Georgia to areas of the continental shelf.
ing. Their periods at sea ranged from 66 to 75 (mean = 72) days, during which time they gained 70 to 153 kg (mean = 107 kg, n = 8). Daily weight gains ranged from 1.1 to 2.3 (mean = 1.5) kg while at sea. Foraging success seems to vary significantly from individual to individual, even though the size range of animals recaptured was small (breeding beach departure weights of 340–457 kg). There was no relationship between size on leaving the beach and weight gain while at sea. The sample is, however, very small.
Four postbreeding female southern elephant seals at South Georgia were fitted with Argos compatible transmitter packages (Argos 1989) in November 1990 (McConnell, Chambers, and Fedak 1992). One failed when bitten by a copulating male. The movements of the remaining three animals are shown in figure 20.4. All traveled southwest to sites on the Antarctic continental shelf.
Seal 1 provided detailed information over 70 days. Its track was divided
Fig. 20.5
Typical dive depth profiles over 24 hours from seal 1 while (A) in phase 1 and
(B) in phase 3. Four depth values were transmitted for each dive at intervals of
one-fifth of the duration of the dive. The maximum depth of each dive was also
transmitted and is shown as a dotted line in the figure. Preceding surface intervals
are represented by a horizontal line at zero depth. Breaks in the continuous plot
indicate missing data, due primarily to diurnal variation in satellite visibility. Note
the variability of dive depth and duration in phase 1 compared with phase 3.
into three phases based on location and movement. During phase 1 (23 days), it swam 1,845 km (average daily velocity [ADV] across the sea surface 0.93 m/sec.) to Livingston Island. In phase 2 (17 days), it hauled out at Livingston Island for 18 hours and then swam a further 805 km (ADV .55 m/sec.) to the southwest, following the continental shelf margin of the Antarctic Peninsula to a location 110 km west to Adelaide Island where water depth was 300 to 400 m. During this phase, it spent several periods of up to 12 hours at the surface. During phase 3 (29 days), it remained within 20 km of this location.
Seal 2 swam 1,420 km in 16 days (ADV 1.02 m/sec.) to Elephant Island where it hauled out. The transmitter failed one day later. It was captured, reweighed, and the transmitter removed at a molting site at South Georgia on February 8, 1991. Seal 3 swam 1,435 km in 16 days (ADV 1.03 m/sec.) to the continental shelf 110 km southeast of Elephant Island. It remained within a 60-km radius of this area for the next 4 days, after which the transmitter failed. It was sighted on January 19, 1991, at a molting site on King George Island.
Figure 20.5 provides a detailed view of dive profiles from seal 1 on two days typical of phases 1 and 3. Such dive-by-dive data were available from 65% of the animal's track: 6-hour dive summaries covered the entire period. We suggest that most of phase 1 was spent in transit to feeding
grounds, although the variability of maximum depths and dive durations suggests that there was some opportunistic feeding. Dives made during phase 3, when the animal remained in the small area off Adelaide Island, were shallower and less variable (fig. 20.6a) than during phases 1 and 2. The seal tended to swim directly to the bottom and remain there, sometimes swimming slowly, until it returned to the surface (fig. 20.6d). These dives involved less swimming activity than those in phases 1 and 2 (fig. 20.6e), yet they tended to be shorter (fig. 20.6b) with a smaller proportion of time spent underwater (fig. 20.6c). Between days 63 and 65, the seal moved 8 km north, 40 km west and then returned to its starting location. Over these 3 days, all dive parameters (fig. 20.6a–e) shifted to values similar to those in phase 1.
Seal 2 gained 141 kg over 78 days (equivalent to 1.8 kg/day) between breeding and molt. By analogy with female northern elephant seals whose weight gain is similar (Le Boeuf et al. 1989; Sakamoto et al. 1989), we estimate that South Georgia seals require 9 to 20 kg of prey per day; that is, 630 to 1,400 kg over the approximately 70-day interval between breeding and molt.
Our interpretation of the activity of seal 1 in phase 3 is of targeted benthic or demersal feeding. This is consistent with data from stomach samples taken on land in which cephalopods predominate. These cephalopods include species of demersal squid and benthic octopods (Rodhouse et al. 1992; Murphy 1914; Laws 1960; Clarke and MacLeod 1982). However, if, as we have demonstrated, feeding areas are far from breeding sites, these stomach samples may underrepresent the consumption of fish whose remains are retained in the stomach for shorter periods. Samples from seals hauled out on sites near foraging areas could help to asses this bias.
Dives in phase 3 were shorter by a factor of 1.5 than in phase 1, and thus more time was spent traveling to and from the surface than would be the case for longer dives to the same depth. The proportion of time spent underwater in these dives was 6% (81% vs. 87%) less on average than those in the first two phases. The following argument suggests that the seal was not merely resting during these dives. These animals spend 80 to 90% of their time underwater and might be better referred to as "surfacers" rather than "divers." If these were rest dives, there would seem to be little reason why they should be more frequently interrupted by traveling to and from the surface to breathe given that oxygen stores should last longer at rest.
But if these were feeding dives, why should they be shorter? Extended periods at the surface were rare during phase 3, implying that the processes of digestion and assimilation were combined with diving activity on a steady state basis and not delayed to breaks in diving activity. Assimilation of food is known to increase basal metabolic rate up to 1.7 times in another
Fig. 20.6
Dive parameters from seal 1 over the 70-day tracking period. Vertical lines demarcate
the three phases described in the text. Mean and standard error values, for each
phase, are shown for each parameter. The parameters refer either to individual dives,
to individual dives averaged over a day, or to 6-hour summary periods. Note that
during days 63 to 65 there was a temporary change in all dive parameters.
(A) The maximum depth attained in each dive. Depth values are accurate to within
5 m at 100 m, to 50 m at 1,600 m. The maximum depth of approximately 910 m was
obtained during phase 1. The variability of maximum depths declined markedly
through phases 1 to 3 (SD = 171.2, 105.9, and 45.2). The constant upper limit of
depth in phase 3 corresponds to the depth of the seabed as
determined from Admiralty Charts.
(B) The duration of each dive. Dive durations were shorter in phase 3 than
in phase 1 and less variable (SD = 2.5 and 5.4).
(C) The percentage of time within each 6-hour summary period that the seal
spent underwater. This was least in phase 2, due primarily to extended periods on
the surface. The time spent underwater in phase 3, when we suggest the seal
was feeding, was less than during the transit in phase 1.
(D) Index of dive depth profile squareness of each dive. Four depth readings
at intervals of one-fifth of the dive duration were transmitted in addition to the
maximum depth attained. The average of these four values are expressed as a
percentage of maximum depth. Dives were more flat bottomed in
phase 3 than in phase 1.
(E) Daily averages of mid-dive swimming activity for each dive. A velocity turbine
provided an index of swimming activity over five equally spaced intervals within
each dive. The average of the middle three values is shown here to exclude descent
and ascent activity. Mid-dive activity was less in phase 3 than in phase 1.
phocid, the harp seal, Phoca groenlandica (Gallivan and Ronald 1981). We therefore suggest that the seal's aerobic dive limit was reduced during this phase, even though swimming activity was also reduced (fig. 20.6e), because the specific dynamic effect (SDE) (Kleiber 1961) of food assimilation increased the rate at which O2 stores were used.
An additional component of this metabolic increase could also be the energy cost of warming the prey from sea temperature to body temperature, some 37°. The amount of heat this would require depends on the specific heat of the prey. If this is assumed to be equivalent to that of water (i.e., 4.19 J/g (and this assumption maximizes the likely effect since all prey will have specific heats less than this), then warming 20 kg of prey would account for the equivalent of about 10% of the standard metabolic rate of a 500-kg animal. However, this is not to say that warming food would require an increase in metabolic rate. This would depend on whether or not the animal was at or below the lower limit of its operational thermoneutral zone under the conditions prevailing while foraging. If it was not, it could decrease its heat loss via other avenues to the extent necessary to make up for the additional loss to the food. Given that SDE will cause a much larger increase in metabolism than 10%, the requirement for heating food in the stomach may not be important.
Interactions between Acquisition and Expenditure:
Linking Data from Land and Sea
Implications of Weight Change for Diving
Consideration of the huge weight losses of males (and, indeed, females as well) raises the question of how seals maintain effective control of buoyancy during diving throughout the annual cycle. Taking an extreme case, if a 3,000-kg male loses 1,000 kg while ashore and if most of the weight loss is lipid, then a thin animal would be much less buoyant than the same animal just prior to arrival on the breeding beach. Given that lipid is only 9 times the density of water (note that it is the density of the lipids used rather than blubber density that is important here), if the animal was neutrally buoyant on arrival, it could leave the beach 100 kg negatively buoyant, which amounts to a force equivalent to 3 to 5% of the weight of the animal.
Clearly, this is an extreme example, and the actual effect could be reduced, both because materials other than lipid are lost during the fast and because animals may come ashore positively buoyant and leave negatively buoyant, halving the imbalance. The imbalance could nonetheless amount to many kilograms upward or downward. While the imbalance in buoyancy would be much less in smaller animals, even small imbalances could be significant. Most human divers will be aware of the dramatic effect even small imbalances in buoyancy can have on maintaining their position in the water column and on the time they can remain submerged on a tank of air. This proportion of buoyancy change would amount to 4 kg extra of lead on a 70-kg human diver's weight belt, which would make for very hard work while operating free in midwater.
While an imbalance might have less energetic consequence during ascent and descent (losses in the energy required to swim up being partially repaid on the way down, or vice versa), it would have profound effects on the effort required to remain at a working depth in midwater or to remain on the bottom while buoyancy is positive. How might the animals compensate for the change in buoyancy? Changing the amount of gas taken down from the surface in the respiratory system would have little or no effect at the depths used by these species. While rocks and gravel are often found in the stomachs of elephant seals, it is hard to imagine enough being taken on board to compensate, and these might not be available in midocean. Could the physical properties (density and its relation to pressure and temperature) of fat stores of these seals be such that changes in the amount stored would not adversely affect buoyancy? Do animals change diving behavior, for example, switching from benthic to midwater foraging, as weight is regained to mitigate or take advantage of the effects of buoyancy changes? The questions remain open.
Foraging in Relation to Oceanography
The animals we tracked traveled more than 85 km each day for 16 to 23 days in a directed way to areas of the continental shelf. The use of distant foraging areas (associated with the Antarctic Polar Front, continental shelf margin, or ice edge) has also been inferred from water temperature data for elephant seals breeding on Macquarie Island (54°S, 157°E) (Hindell, Burton, and Slip 1991). Why do they adopt this strategy?
Elephant seal females are long-lived animals that invest large amounts of resources in a single pup each year over many years. They must, therefore, locate food reliably each year for many years in succession. Movement away from South Georgia may be explained by the fact that the local shelf area contains insufficient prey items to sustain the local elephant seal breeding population (McCann 1985). There may be an advantage, therefore, in adopting strategies that minimize the risk of yearly failure at the expense of the energetic costs of long-distance transits. The narrow Antarctic continental shelf, ice edges, and the Antarctic Polar Front are highly productive and attract many top predators (Ainley and De Master 1990) and fisheries (Itchii 1990). This contrasts with the open reaches of the Antarctic Ocean where concentrations of prey are both spatially and temporally variable and may be associated with unpredictable hydrographic conditions (ElSayed 1988). If an animal has the energy storage capability (as elephant seals, with their prodigious potential for blubber accumulation, do), the benefit of using distant foraging areas where food is reliably associated with readily relocatable oceanographic features, such as the continental shelf and the Antarctic Polar Front, may outweigh the costs of transport to these areas. That is, a long swim on an empty stomach may, in the long term, be more productive than pelagic meandering.
Variability in Size and Success
Yet, in spite of these capabilities, some animals gain more weight than others while at sea. And energy stores and the size at age of both males and females seem likely to be important to reproductive success. What factors of an animal's movements, experience, and foraging techniques are important in determining how successful it is?
Of particular importance is information on all aspects of the variability of foraging parameters: how they vary year to year in the same animal and change with age, sex, and size between animals. How do the patterns observed develop in naive animals when they first go to sea, and how does the variability of such early experience affect later development? No less important are the effects of the choice of breeding and molting sites in relation to near and distant oceanography.
Though the information to answer such questions is not available for
southern elephant seals, the techniques to do so are at hand. What is needed is their continued application and particularly their effective combination in land- and sea-based studies. These techniques will make new demands on the resolution, the accuracy, and, crucially, the availability of oceanographic data.
Acknowledgments
This work was carried out as part of the Sea Mammal Research Unit (Natural Environment Research Council) Open Oceans Programme in conjunction with the British Antarctic Survey and the University of Stockholm. We are particularly grateful to Neil Audley, Colin Hunter, Kevin Nicholas, Tim Barton, Ash Morton, and David Davies-Hughes for technical assistance and essential help in the field. We thank John Croxall for his usual unusually useful comments on the manuscript given good-naturedly with the usual short notice.
References
Ainley, D. G., and D. P. DeMaster. 1990. The upper trophic levels in polar marine ecosystems. In Polar Oceanography, Pt. B: Chemistry, Biology, and Geology , ed. W. O. Smith, 599–630. San Diego: Academic Press.
Argos. 1989. Guide to the Argos System . Toulouse: Argos CLS.
Boyd, I. L., T. Arnbom, and M. A. Fedak. 1993. Water flux, body composition, and metabolic rate during molt in female southern elephant seals (Mirounga leonina ). Physiological Zoology 66: 43–60.
Clarke, M. R., and N. MacLeod. 1982. Cephalopods in the diet of elephant seals at Signy Island, South Orkney Islands. British Antarctic Survey Bulletin 57: 27–31.
El-Sayed, S. Z. 1988. Seasonal and inter-annual variabilities in Antarctic phytoplankton with reference to krill distribution. In Antarctic Ocean and Resources Variability , ed. D. Sahrhage, 101–119. Berlin, Heidelberg, and New York: Springer Verlag.
Fedak, M. A., I. L. Boyd, T. Arnbom, and T. S. McCann. 1989. The energetics of lactation in southern elephant seals, Mirounga leonina , in relation to the mother's size. Abstract from the Eighth Biennial Conference on the Biology of Marine Mammals, Monterey, Calif., December 7–12, 1989.
Gallivan, G. J., and K. Ronald. 1981. Apparent specific dynamic action in the harp seal (Phoca groenlandica ). Comparative Biochemistry and Physiology . 69A: 579–581.
Hindell, M. A., H. R. Burton, and D. J. Slip. 1991. Foraging areas of southern elephant seals, Mirounga leonina , as inferred from water temperature data. Australian Journal of Marine and Freshwater Research 42: 115–128.
Huber, H. R. 1987. Natality and weaning success in relation to age of first reproduction in northern elephant seals. Canadian Journal of Zoology 65: 1311–1316.
Itchii, T. 1990. Distribution of Antarctic krill concentrations exploited by Japanese krill trawlers and minke whales. Proceedings of the NIPR Symposium on Polar Biology 3: 36–56.
Kleiber, M. 1961. The Fire of Life . New York: John Wiley and Sons.
Laws, R. M. 1956. The elephant seal (Mirounga leonina Linn). II. General, social, and reproduction behaviour. Falkland Islands Dependencies Survey, Scientific Reports 13: 1–88.
———. 1960. The southern elephant seal (Mirounga leonina Linn.) at South Georgia. Norsk Hvalfangst-Tidende 49: 466–476, 520–542.
———. 1984. Seals. In Antarctic Ecology , vol. 2, ed. R. M. Laws, 621–715. London: Academic Press.
Le Boeuf, B. J., Y. Naito, A. C. Huntley, and T. Asaga. 1989. Prolonged, continuous, deep diving by northern elephant seals. Canadian Journal of Zoology 67: 2514–2519.
Ling, J. K., and M. M. Bryden. 1981. Southern elephant seal, Mirounga leonina Linnaeus, 1758. In Handbook of Marine Mammals, 2, Seals , eds. S. H. Ridgway and R. J. Harrison, 297–327. London: Academic Press.
McCann, T. S. 1980. Population structure and social organisation of southern elephant seals, Mirounga leonina (L.). Biological Journal of the Linnaean Society of London 14: 133–150.
———. 1981. The social organization and behaviour of the southern elephant seal, Mirounga leonina (L.). Ph.D. dissertation, University of London, England.
———. 1985. Size, status, and demography of southern elephant seal (Mirounga leonina ) populations. In Sea Mammals in South Latitudes: Proceedings of a Symposium of the 52d ANZAAS Congress in Sydney—May 1982 , ed. J. K. Ling and M. M. Bryden, 1–17. Northfield: South Australian Museum.
McCann, T. S., M. A. Fedak, and J. Harwood. 1989. Parental investment in southern elephant seals, Mirounga leonina. Journal of Behavioural Ecology and Sociobiology 25: 81–87.
McCann, T. S., and P. Rothery. 1988. Population size and status of the southern elephant seal (Mirounga leonina ) at South Georgia, 1951–85. Polar Biology 8: 305–309.
McConnell, B. J., C. Chambers, and M. A. Fedak. 1992. Foraging ecology of southern elephant seals in relation to the oceanography of the Southern Ocean. Antarctic Science 4: 393–398.
Murphy, R. C. 1914. Notes on the sea elephant, Mirounga leonina (Linn.). Bulletin of the American Museum of Natural History 33: 63–78.
Reilly, J. J., and M. A. Fedak. 1990. Measurement of the body composition of living gray seals by hydrogen isotope dilution. Journal of Applied Physiology 69: 885–891.
Reiter, J., and B. J. Le Boeuf. 1991. Life history consequence of variation in age at primiparity in northern elephant seals. Journal of Behavioral Ecology and Sociobiology 28: 153–160.
Rodhouse, P., T. R. Arnbom, M. A. Fedak, J. Yeatman, and A. W. A. Murray. 1992. Cephalopod prey of the southern elephant seal, Mirounga leonina L. Canadian Journal of Zoology 70: 1007–1015.
Sakamoto, W., Y. Naito, A. C. Huntley, and B. J. Le Boeuf. 1989. Daily gross energy requirements of female northern elephant seal, Mirounga angustirostris , at sea. Nippon Suisan Gakkaishi 55: 2057–2063.
Worthy, G. A. J., P. A. Morris, D. P. Costa, and B. J. Le Boeuf. 1992. Molt energetics of the northern elephant seal. Journal of Zoology, London 227: 257–265.
Twenty-one—
Hormones and Fuel Regulation in Fasting Elephant Seals
Vicky Lee Kirby and C. Leo Ortiz
ABSTRACT. This chapter summarizes current knowledge about fasting physiology in the northern elephant seal, Mirounga angustirostris . Changes in metabolic fuel distribution and plasma hormone levels as well as changes in insulin secretion and peripheral tissue sensitivity to plasma insulin are addressed. Pups at weaning and during an eight-week postweaning fast were hyperglycemic, hyperlipidemic, hypoinsulinemic with impaired glucose tolerance, and relatively insulin insensitive. Fasting northern elephant seal weanlings did not closely regulate their blood glucose.
It is suggested that the suckling elephant seal pup is preadapted to the postweaning fasting period because of the lack of carbohydrate in the milk, its high fat content (85–95% of the calories), and the large increase in body fat (up to 50% of the mass at weaning). All of these contribute to impaired insulin secretion and action in other mammals. Blood glucose could only be maintained by hepatic gluconeogenesis because of the lack of dietary carbohydrate in this species at all stages of its life history. Adaptations to a low carbohydrate, high fat diet are similar to those necessary for adaptation to fasting. Low plasma insulin and relative tissue insensitivity to insulin are normal adaptations to low carbohydrate diets and fasting and would not be clinically abnormal for carnivores.
The northern elephant seal, M. angustirostris , provides the physiologist with a model for studying the basic physiological, biochemical, and anatomical mechanisms underlying the ability to undergo natural extended periods of complete food and water abstinence in large nonhibernating mammals. With the exception of nursing pups, individuals of all ages and both sexes fast entirely during the terrestrial phase of their life cycle, notably, the reproductive and molting phases. This rigorous life-style begins early in life when pups of the year are weaned abruptly at one month of age (Le Boeuf, Whiting, and Gantt 1972; Reiter, Stinson, and Le Boeuf 1978). During this
period, young animals not only cope with the rigors of zero nutritional and water input but do so while continuing normal neonatal development. This entails substantial intertissue reorganization of protein, minerals, and other cellular components.
Over the past several years, we have investigated aspects of the physiology of spontaneous fasting in these young weanlings with two basic objectives. First, we wanted to understand the physiology of integrated biochemical processes underlying these prolonged fasts. Second, we wanted to determine the control mechanisms that simultaneously integrate catabolic processes involved in meeting energy needs with the anabolic processes required for protein recruitment and synthesis during development.
Our initial studies focused on the major regulatory hormones, insulin and glucagon, in fasting weanlings (Kirby and Ortiz 1989; Kirby 1990). In this chapter, we summarize our current understanding of fasting physiology during the postweaning fast, including a discussion of (1) fuel depots and fuel turnover studies; (2) plasma metabolite and hormone levels during the postweaning fast; and (3) changes in pancreatic and peripheral tissue responsiveness to glucose and insulin tolerance tests.
Fuel Depots:
Storage and Utilization
Northern elephant seals undergo dramatic changes in body composition during their first year of life. Unlike terrestrial mammals, the accumulation of adipose tissue occurs early in the neonatal period (Bryden 1968). Throughout the nursing period, pups gain on average 2 kg of adipose and 1 kg of lean tissue daily, and at weaning, the fat mass averages 48% in healthy pups (Ortiz, Costa, and Le Boeuf 1978). The fat mass gained during nursing is important for survival during the postweaning fast, as evidenced by the correlation between duration of the postweaning fast and the relative level of body fat at weaning (Kirby 1992).
In fasting animals, changes in body mass compartments can be used to calculate how much lean and adipose tissue contribute to metabolism. Newly weaned pups lose 1 to 2 kg of tissue/day in the first 2 weeks of fasting as compared to .65 kg/day during the rest of the 8- to 10-week fast (Kretzmann 1990; Rea 1990). This progressive sparing of tissue reserves is accomplished by a reduction of resting metabolic rate during the postweaning fast (Rea 1990). Although fasting seals catabolize both lean and adipose tissue at an equivalent rate, these tissues do not have equal energy content. Hydrated proteinaceous tissue has a lower energy content than an equivalent weight of adipose tissue. Thus, the size of the fat depot is important because energy mobilized from adipose tissue has to supply more than 85% of the total energy needs of the pup.
Normally, fuel stores important in carbohydrate metabolism are muscle and hepatic glycogen, amino acid stores in lean tissue, and triglycerides in adipose tissue. Although glycogen levels have not been measured specifically in elephant seal tissues, it has been shown in other species of pinnipeds that glycogen is not an important energy store. Therefore, glucose must be made from noncarbohydrate precursors, such as the glycerol moiety derived by triacylglycerol oxidation and the glucogenic amino acids derived from lean tissue. However, the relative contributions of lean and fat tissue to glucose formation cannot be determined from just monitoring changes in fuel depot size.
Fuel Turnover Studies
The relative contributions of lean and fat tissue to total energy needs and to glucose formation have been examined by isotope-labeled fuel metabolite studies in fasting weanlings. Fatty acid oxidation studies confirmed that lipid is the main energy source and suggested that sufficient glycerol was liberated by lipolysis to meet all glucose precursor needs (Castellini, Costa, and Huntley 1987). In fact, the direct contribution of glucose to the total metabolic rate was shown to be less than 1% in seals fasting longer than one month (Keith and Ortiz 1989). Although glucose turnover rates were within mammalian norms, most of the glucose carbon appeared to be recycled, possibly by futile cycling, and was not oxidized. This has also been observed in harbor seals (Davis 1983) and grey seals (Nordoy and Blix 1991).
Similar results from urea, albumin, and leucine turnover studies in fasting pups confirmed that protein oxidation contributed to less than 3% of total energy needs (Ortiz 1990; Pernia 1984; Pernia, Hill, and Ortiz 1980). Since it appears that protein and glucose oxidation, together, provide less than 10% of total energy needs, the physiological role of active turnover of these substrates remains unclear. It is possible that recycling protein and glucose carbon may serve as an important carbon shuttle mechanism, for example, glucose synthesis or synthesis of nonessential amino acids or other cellular components.
Plasma Metabolite Levels
Plasma levels of metabolites from carbohydrate, protein, and lipid metabolism are common parameters in characterizing in vivo fuel homeostasis. These metabolites usually include glucose, blood urea nitrogen (BUN), creatinine, nonesterified fatty acids (NEFA), and b -hydroxybutryate (BOHB).
Early studies reported that elephant seal pups may be hyperglycemic
Fig. 21.1
Plasma levels (mean ± SD) of glucose (cross-hatched bars), blood urea nitrogen
(solid bars), and nonesterified fatty acids (open bars) in eight elephant seal pups
before fasting (at weaning), after 28 days of fasting, and after 56 days of fasting.
because plasma glucose levels were rarely seen below 6 mM, which is substantially higher than predicted by body size (Umminger 1975; Costa and Ortiz 1982). Plasma levels of glucose as high as 200 mg/dL have been reported for other species of pinnipeds (Englehardt and Ferguson 1980; Hochachka et al. 1979; Worthy and Lavigne 1982). Subsequent studies (Kirby 1990) confirmed that plasma glucose levels remain elevated above 6.5 mM throughout the postweaning fast, although there was a small but steady decrease in plasma glucose from 8 mM at the start of the fast to 7mM by the end of the fast (fig. 21.1).
Plasma BUN levels are an indirect measure of protein oxidation and demonstrate predictable changes associated with fasting. They were highest at weaning (33 mg/dL) and decreased significantly over the fasting period to 15 mg/dL, as shown in figure 21.1 (Adams 1991; Kirby 1992; Costa and Ortiz 1982). Another index of lean tissue catabolism is creatinine (C), which is released into plasma when muscle tissue is catabolized. The decrease in the BUN:C ratio from 37 to 16 by the end of the fast was consistent with protein sparing adaptations.
Conversely, plasma levels of NEFA progressively increased from < 1.0 mM at the beginning of the fast (at weaning) to ³ 2.6 mM after 8 weeks of fasting (fig. 21.1; Kirby 1992). The ketone body BOHB, a by-product of fat oxidation, also increased slowly during the fast (Castellini and Costa 1990). After 8 weeks of fasting, there was a sharp decrease in BOHB, and the seals departed within 10 days. This suggests that the seals terminated their land-based fast because adipose reserves had become too low to support ketogenesis and still provide enough insulation to aid thermoregulation while feeding at sea.
All of these changes in plasma fuel levels were consistent with the general animal fasting model (Felig et al. 1969; Cahill 1970) in which there is a metabolic shift from protein oxidation to lipid oxidation early in the fasting period. Similar adaptations have been observed in other animals in which a spontaneous fast is part of their life cycle, for example, the king penguin, Aptenodytes patagonica (Cherel, Stahl, and Le Maho 1987).
Plasma Hormone Levels
The shift to a lipid-based metabolism occurs in conjunction with specific changes in insulin and glucagon levels (Cahill et al. 1966; Felig et al. 1979). A decrease in insulin secretion is vital for fuel homeostasis during fasting because insulin normally inhibits lipolysis. In fasting elephant seals, mean plasma insulin levels decreased throughout the fast from 11 ± 4 µU/ml at weaning, to 9 ± 3 µU/ml after 4 weeks of fasting and 8 ± 2 µU/ml after 8 weeks. Low plasma insulin levels (5–15 µU/ml) were also observed in lactating and molting adult females, molting yearlings, and weanlings captured just after their return from feeding at sea (Kirby 1990; Kirby and Ortiz 1990). Similar low levels have also been reported for feeding harbor seals (Robin et al. 1981) and Weddell seals (Hochachka et al. 1979).
Glucagon levels were highly variable, especially in nursing pups. Different glucagon antibodies in the glucagon radioimmunoassay suggested the possibility that nonpancreatic glucagon cross-reacted with the antibody for pancreatic glucagon, thus overestimating glucagon. Extrapancreatic alpha cells have been observed in the gut of the South African fur seal, Arctocephalus pusillus (Van Aswegan and Viljoen 1987). The lowest total glucagon levels measured contributed to a molar I:G ratio £ 1.0 in all animals studied. In other mammals, an I:G ratio of less than 1 is correlated with high rates of hepatic gluconeogenesis (Unger, Eisentraut, and Madison 1963; Unger 1985).
In general, changes in plasma levels of insulin and glucagon as well as in their ratios were consistent with fasting adaptations observed in animals as diverse as humans and penguins (Marliss et al. 1970; Cahill and Aoki 1977; Cherel, Leloup, and Le Maho 1988). Decreased levels of insulin and a low
I:G ratio allowed for the increased mobilization of lipid from fat stores as protein and glucose were conserved. It was not expected that the prefasting insulin levels in newly weaned seals would be so low. However, potential explanations are that (1) the high fat milk diet (Le Boeuf and Ortiz 1977; Riedman and Ortiz 1979; Kretzmann 1990) suppressed insulin secretion; (2) the high body fat levels impaired insulin secretion (Kirby 1990); (3) 1-month-old seals were still too young developmentally to regulate glucose normally (Tieran 1970); or (4) insulin secretion was low because of its minor role in glucose homeostasis in this species (Kirby 1992).
Glucose Tolerance Tests
Glucose tolerance tests (GTT) can provide an index of pancreatic islet sensitivity to changes in plasma glucose. If insulin does not regulate blood glucose levels in these animals, one would expect an impaired response in which animals do not closely regulate their blood glucose levels. To test this, glucose was administered intravenously (IV) as a 50% solution over a 2- to 4-minute period in a standard dose of 25 g or 0.5 g glucose/kg body weight, and the disappearance rate (K) of glucose was measured over time. Feeding mammals normally have K values of 2.3 or greater in contrast to fasting animals, which have K values of 1.0 or less. The glucose tolerance profile for five seals at weaning and after 8 weeks of fasting is shown in figure 21.2. K values were £ 1.0 for all seals. This profile is similar to that seen in obese and diabetic humans (Salans, Knittle, and Hirsch 1983). Normal (nonobese) mammals would restore euglycemia within 60 to 90 minutes of the glucose injection due to an acute insulin response.
Impaired glucose clearance (K £ 1.0) and the total lack of an insulin response to a glucose injection were virtually identical for pups at weaning and after fasting 8 to 11 weeks. These data indicated that these seals were adapted for fasting, that is, they switched to fat oxidation metabolism, prior to weaning.
In other mammalian neonates, the transition from the glucose-based metabolism of the fetus to the high fat milk diet of the neonate is accompanied by an increase in gluconeogenesis and fatty acid oxidation and a decrease in hepatic lipogenesis in the perinatal period (Kalhan 1992). As carbohydrate is introduced into the diet, the neonate decreases its reliance on de novo synthesis of glucose and increases insulin secretion. Elephant seal milk does not contain carbohydrate; in fact, the fat content is at its highest just prior to weaning. Thus, the suckling elephant seal neonate cannot develop the ability to secrete or utilize insulin for carbohydrate uptake into tissues.
Impaired insulin secretion and tissue insensitivity to insulin are correlated with high body fat levels (and high fat diets) in other mammals. We
Fig. 21.2
Glucose tolerance test for five elephant seal pups just prior to weaning (closed
symbols) and after 8 weeks of fasting (open symbols). The mean glucose
response is represented by the square symbols (solid line). The mean insulin
response is represented by the triangle and hourglass symbols. At time zero,
a bolus injection of 25 g glucose in a 50% saline solution was injected
intravenously. For purposes of clarity, the largest standard deviations for
glucose and insulin are shown as vertical bars.
investigated the effect of body fat on the insulin response to a glucose challenge by comparing glucose clearance rates (K) in pups with known body weights, body composition, and age (Kirby and Ortiz 1989). It proved to be very difficult to separate changes in body fat levels from changes in age. Virtually all seals larger than 100 kg body weight at weaning had a fat mass of 48 to 50%. Seals smaller than 90 kg at weaning had lower body fat levels (< 40%). However, all seals, regardless of weaning mass, age, and duration of fasting, had impaired glucose clearance values less than 1.0 with little or no insulin response to the glucose injection. Glucose clearance values estimated from figures in harbor seal and Weddell seal studies were also less than 1.0 (Hochachka et al. 1979; Robin et al. 1981).
Insulin Tolerance Tests
As a mammal adapts to fasting, there should be a decrease in tissue sensitivity to insulin concomitant with decreased insulin secretion (Cahill et al.
Fig. 21.3
Insulin tolerance test for five elephant seal pups just prior to weaning (closed
symbols) and after 8 weeks of fasting (open symbols). The mean glucose
response is represented by the square symbols (solid line). The mean insulin
response is represented by the triangle and hourglass symbols. At time zero,
a bolus injection of 0.1 U insulin/kg body weight was injected intravenously. For
purposes of clarity, the largest standard deviations for glucose and insulin are
shown as vertical bars. Note change of scale from fig. 21.2.
1966). Changes in peripheral tissue sensitivity to insulin were assessed by intravenous injections of 0.05 to 0.1 U insulin per kg body weight. In response to insulin, plasma glucose levels decreased in all seals studied. Although the exogenous insulin was cleared from the blood within 20 to 30 minutes postinjection, blood glucose levels did not reach a nadir until 40 to 90 minutes postinjection.
A typical insulin tolerance test (ITT) profile is shown in figure 21.3 for five seals prior to and after 8 weeks of fasting. Blood glucose was not restored within 135 minutes postinjection even though some seals tolerated blood glucose levels as low as 3.5 to 4 mM for almost an hour without any behavioral changes. There was no difference in glucose recovery rates for nursing and fasting pups. This pattern of impaired response has been observed in fasting and feeding obese humans as well as in diabetics (Drenick et al. 1972). In contrast, most mammals restore euglycemia within two hours of the insulin injection. The maximal hypoglycemia in response to insulin is reached within 30 minutes of the injection.
Elephant seal pups tolerated a reduction of plasma glucose of 50% of basal level glucose. This suggests that plasma glucose levels were not closely regulated by the standard insulin-glucagon push-pull model. It is possible that glucose control was not as important due to adipose tissue insensitivity to insulin. We measured changes in the by-products of lipolysis, plasma NEFA and BOHB, in response to an insulin injection in four seals after an 8-week fast. Although NEFA and BOHB both decreased in response to insulin, plasma NEFA levels began to recover immediately and returned to preinjection levels 20 minutes after the exogenous insulin was cleared from the plasma. Ketone levels did not start to recover until 60 minutes after the injection and, like glucose, did not return to preinjection levels within the 150-minute experimental period. Thus, insulin had an effect on lipolysis, although in this experiment we could not determine whether fatty acid levels decreased due to insulin suppression of adipocyte lipolysis or due to facilitated muscle cell uptake of fatty acids.
Summary and Conclusions
Overall, fasting elephant seal pups conformed to the general mammalian model of fuel homeostasis for fasting animals in which protein conservation is paralleled by increased mobilization and utilization of lipid. It is surprising that these same adaptations are also seen in suckling pups just prior to weaning. However, when we examine the nutritional life history of elephant seals, we find that fat is the major energy source throughout development whether individuals are consuming high fat milk, high fat fish, or body fat stores. Since elephant seals consume only a minimal amount of dietary carbohydrate, all glucose must be made from precursors derived from the diet or from tissue stores. To date, changes in fuel distribution, fuel turnover rates, and plasma metabolites confirm that lipolysis is the major source of energy—and possibly glucose—in northern elephant seals.
The insulin and glucose studies show that nursing elephant seals are preadapted for fasting. The lack of pancreatic islet response and the impaired glucose clearance (K £ 1; fig. 21.2), the tissue insensitivity to insulin (fig. 21.3), and low plasma insulin and low ratio of I:G all contributed to maximizing the release of lipid from adipose tissue and were not a function of age, body fat, or nutritional status in seals. This emphasis on lipid mobilization concurrent with minimal oxidation of glucose and protein suggests that glucose may be synthesized from glycerol while the fatty acids are oxidized to meet the total energy needs of feeding and fasting seals. The important difference between the feeding and fasting state would be the partitioning of amino acids into protein synthesis or into gluconeogenesis.
Despite the fact that insulin is considered essential to protein synthesis in muscle tissue, suckling pups can gain a kilogram of lean tissue daily, even
with plasma insulin levels of less than 12 µU/ml. We suggest that this same anabolic condition exists for young fasting seals who are actively recycling protein and glucose as they reorganize their tissues. The observation that active synthesis and reorganization of tissue protein occurs throughout the postweaning period of fasting and development is supported by the previously mentioned protein turnover studies. Although we do not understand how these seals balance anabolic and catabolic processes during the post-weaning fast, the hormonal data suggest that we reevaluate the importance of insulin and glucagon in fuel regulation in these animals in particular and in other carnivores in general.
If insulin is not important in fuel homeostasis in this species, then other factors may play a more important role in glucose homeostasis. The influence of diving hypoxia on various tissues as well as the brain may change the influence that insulin has on muscle. It has been observed that hypoxia enhances muscle tissue sensitivity to insulin, reducing the amount needed to stimulate tissue growth (King et al. 1987). Diving may also enhance plasma fuel availability because exercise induces a release in epinephrine, which then increases glucose and free fatty acid release (Hamburg, Hendler, and Sherwin 1979). Increases in epinephrine and glucocorticoid plasma levels can also inhibit glucose-stimulated insulin release (Ploug, Galbo, and Richter 1984; Porte, Smith, and Ensinck 1979).
Alternative speculations suggest that insulin may not be necessary for protein synthesis in muscle tissue because seals may have high plasma levels of growth hormone or growth factors. The cellular requirements for energy are also regulated in part by thyroid hormone and glucocorticoids. These hormones are important for phocid molting (Ashwell-Erickson et al. 1986) and could be important to overall fuel homeostasis in seals. However anabolic processes are regulated, the glucose needs of the brain and other glucose obligate tissues must first be met so that seals can survive as diving carnivores who routinely experience apnea, tissue hypoxia, extreme exercise (as in deep diving), and periodic fasting. While fuel homeostasis in fasting seals is consistent with the general mammalian model of fasting, adipose tissue may be far more important to the elephant seal for glucose homeostasis than it is in other mammals.
References
Adams, S. H. 1991. Changes in protein metabolism and water conservation in northern elephant seals during the postweaning fast. M.Sc. thesis, University of California, Santa Cruz.
Ashwell-Erickson, S., F. Fay, R. Elsner, and D. Wartzok. 1986. Metabolic correlates of molting and regeneration of pelage in Alaskan harbor and spotted seals. Canadian Journal of Zoology 64: 1086–1092.
Bailey, B. A., R. G. H. Downer, and D. M. Lavigne. 1980. Neonatal changes in tissue levels of carbohydrate and lipid in the harp seal. Comparative Biochemistry and Physiology 67B: 179–182.
Bryden, M. M. 1968. Growth of the southern elephant seal, Mirounga leonina (Linn.). Growth 33: 69–82.
Cahill, G. F., Jr. 1970. Starvation in man. New England Journal of Medicine 282: 668–675.
Cahill, G. F., and T. T. Aoki. 1977. The role of glucagon in amino acid homeostasis. In Glucagon: Its Role in Physiology and Clinical Medicine , ed. P. Foa, J. Bajaj, and N. Foa, 487–494. New York: Springer Verlag.
Cahill, G. F., M. G. Herrera, A. P. Morgan, J. S. Soeldner, J. Teinke, P. L. Levy, G. A. Reichard, and D. M. Kipnis. 1966. Hormone-fuel interrelationships during fasting. Journal of Clinical Investigation 45: 1751–1769.
Castellini, M. A., and D. P. Costa. 1990. Relationships between plasma ketones and fasting duration in neonatal elephant seals. American Journal of Physiology 259: R1086–R1089.
Castellini, M. A., D. P. Costa, and A. C. Huntley. 1987. Fatty acid metabolism in fasting elephant seal pups. Journal of Comparative Physiology 157B: 445–449.
Cherel, Y., J. Leloup, and Y. Le Maho. 1988. Fasting in king penguins. II. Hormones and metabolite changes during molting. American Journal of Physiology 254: R178–R184.
Cherel, Y., J. Stahl, and Y. Le Maho. 1987. Ecology and physiology of fasting in king penguin chicks. Auk 104: 254–262.
Costa, D. P., and C. L. Ortiz. 1982. Blood chemistry homeostasis during prolonged fasting in the northern elephant seal. American Journal of Physiology 242: R591–R595.
Davis, R. W. 1983. Lactate and glucose metabolism in the resting and diving harbor seal. Journal of Comparative Physiology 153: 275–288.
Davis, R. W., M. A. Castellini, T. H. Williams, and G. L. Kooyman. 1991. Fuel homeostasis in the harbor seal during submerged swimming. Journal of Comparative Physiology 160B: 627–635.
Drenick, E. J., L. C. Alvarez, G. C. Tamasi, and A. S. Brickman. 1972. Resistance to symptomatic insulin reactions after fasting. Journal of Clinical Investigation 51: 2757–2762.
Englehardt, F. R., and J. M Ferguson. 1980. Adaptive hormonal changes in harp seals and grey seals during the post-natal period. General Comparative Endocrinology 40: 434–445.
Felig, P., O. E. Owen, J. Wahren, and G. F. Cahill, Jr. 1969. Amino acid metabolism during prolonged starvation. Journal of Clinical Investigations 48: 584–594.
Felig, P., R. S. Sherwin et al. 1979. Hormonal interactions in the regulation of blood glucose. Recent Progress in Hormone Research 35: 501–511.
Hamburg, S., R. Hendler, and R. S. Sherwin. 1979. Epinephrine: Exquisite sensitivity to its diabetogenic effects in normal man. Clinical Research 27: 252A.
Hochachka, P. W., B. Murphy, G. C. Liggins et al. 1979. Unusual maternal-fetal blood glucose changes in the Weddell seal. Nature 277: 388–389.
Kalhan, S. C. 1992. Metabolism of glucose and methods of investigation in fetus
and newborn. In Fetal and Neonatal Physiology , vol. 1, eds. R. A. Polin and W. W. Fox, 357–372. Philadelphia: W. B. Saunders.
Keith, E. O., and C. L. Ortiz. 1989. Glucose kinetics in neonatal elephant seals during postweaning aphagia. Marine Mammal Science 5(2): 99–115.
Kerem, D., D. Hammond, and R. Elsner. 1973. Tissue glycogen levels in the Weddell seal: A possible adaptation to asphyxial hypoxia. Comparative Biochemistry and Physiology 45A: 731–736.
King, D. S., G. P. Dalsky, M. A. Staten, W. E. Clutter, D. R. Canhouten, and J. O. Holloszy. 1987. Insulin action and secretion in endurance-trained and untrained humans. Journal of Applied Physiology 63: 2247–2252.
Kirby, V. L. 1990. Marine Mammal Endocrinology. In The CRC Handbook of Marine Mammal Medicine , ed. L. Dieruf, 303–352. Boca Raton: CRC Press.
———. 1992. The regulation of fuel homeostasis in young northern elephant seals. Ph.D. dissertation, University of California, Santa Cruz.
Kirby, V. L., and C. L. Ortiz. 1989. Body fat and glucose insulin response in fasting and feeding northern elephant seals during the first year of life. In Proceedings of Eighth Biennial Conference on the Biology of Marine Mammals , December 7–11, Pacific Grove, Calif.
———. 1990. Glucose regulation in fasting and feeding northern elephant seals less than one year of age. Physiologist 33: A–108.
Kretzmann, M. B. 1990. Milk intake, metabolic rate and mass change in northern elephant seal pups: Evidence for sexual equality. M.Sc. thesis, University of California, Santa Cruz.
Le Boeuf, B. J., and C. L. Ortiz. 1977. Composition of elephant seal milk. Journal of Mammalogy 58: 683–685.
Le Boeuf, B. J., R. J. Whiting, and R. F. Gantt. 1972. Perinatal behavior of northern elephant seal females and their young. Behaviour 43: 121–156.
Marliss, E. B., T. T. Aoki, R. H. Unger, J. S. Soeldner, and G. F. Cahill, Jr. 1970. Glucagon levels and metabolic effects in fasting man. Journal of Clinical Investigations 49: 2256–2270.
Nordoy, E. S., and A. S. Blix. 1991. Glucose and ketone body turnover in fasting grey seal pups. Acta Physiologica Scandinavica 41: 565–571.
Ortiz, C. L. 1990. Protein metabolism during the prolonged natural postweaning fast in rapidly developing elephant seal pups. Physiologist 33: A–56.
Ortiz, C. L., D. P. Costa, and B. J. Le Boeuf. 1978. Water and energy flux in elephant seal pups fasting under natural conditions. Physiological Zoology 51: 166–178.
Pernia, S. D. 1984. Protein turnover and nitrogen metabolism during long-term fasting in northern elephant seal pups. Ph.D. dissertation, University of California, Santa Cruz.
Pernia, S. D., A. Hill, and C. L. Ortiz. 1980. Urea turnover during prolonged fasting in the northern elephant seal. Comparative Biochemistry and Physiology 65B: 731–734.
Ploug, T., H. Galbo, and E. A. Richter. 1984. Increased muscle glucose uptake during contraction: No need for insulin. American Journal of Physiology 247: E726–E731.
Porte, D., Jr., P. H. Smith, and J. W. Ensinck. 1979. Neurohormonal regulation of the pancreatic islet. Metabolism 25 (Suppl. 1): 1453–1460.
Rea, L. 1990. Changes in resting metabolic rate during long-term fasting in northern elephant seal pups (Mirounga angustriostris ). M.Sc. thesis, University of California, Santa Cruz.
Reiter, J., N. L. Stinson, and B. J. Le Boeuf. 1978. Northern elephant seal development: The transition from weaning to nutritional independence. Behavioral Ecology and Sociobiology 3: 337–367.
Riedman, M., and C. L. Ortiz. 1979. Changes in milk composition during lactation in the northern elephant seal. Physiological Zoology 52: 240–249.
Robin, E. D., J. Ensinck, A. J. Hance et al. 1981. Glucoregulation and simulated diving in the harbor seal. American Journal of Physiology 241: R293–R300.
Salans, L. B., J. R. Knittle, and J. H. Hirsch. 1983. Obesity, glucose tolerance, and diabetes mellitus. In Diabetes Mellitus: Theory and Practice , 3 ed., ed. M. Ellenberg and H. Rifkin, 469–479. New York: Medical Examination Publishing Co.
Tieran, J. R. 1970. Insulin in fetal and neonatal metabolism. In Physiology of the Perinatal Period , vol. 2, ed. U. Stave. New York: Plenum Medical.
Umminger, B. L. 1975. Body size and whole blood sugar concentrations in mammals. Comparative Biochemistry and Physiology 52A: 455–458.
Unger, R. H., 1985. Glucagon physiology and pathophysiology in the light of new advances. Diabetologia 28: 574–579.
Unger, R. H., A. M. Eisentraut, and L. L. Madison. 1963. The effects of total starvation upon the levels of circulating glucagon and insulin in man. Journal of Clinical Investigations 42: 1031.
Van Aswegen, G., and A. T. Viljoen. 1987. Endocrine cells in the gut of the South African fur seal, Arctocephalus pusillus. Acta Anatomica 130: 93–95.
Worthy, G. A., and D. M. Lavigne. 1982. Changes in blood properties of fasting and feeding harp seals after weaning. Canadian Journal of Zoology 60: 586–592.
Twenty-two—
Endocrine Changes in Newborn Southern Elephant Seals
Michael M. Bryden
ABSTRACT. The structure and function of some endocrine organs (hypophysis, thyroid, and pineal gland) of newborn southern elephant seals and their role in maintaining homeothermy are reviewed briefly. The adrenal gland is probably important, particularly in the immediate perinatal period, but it has not been examined yet.
The predominant cell in the hypophysis of the newborn seal is the somatotroph, suggesting that secretion of growth hormone is a major function of the gland during suckling, when pups grow rapidly. The degree of control of other endocrine organs by the hypophysis in newborn seals is unknown.
The thyroid gland is large, with histological evidence of activity at and soon after birth. The thyroid hormones T3 and T4, present in circulating blood at birth, are elevated within the subsequent two hours and remain high for approximately the first week postpartum. As circulating thyroid hormones decline, metabolic rate probably declines also, but direct measurements have not been made.
The pineal gland is very large and active in newborn southern elephant seals and remains so until 7 to 10 days postpartum. Circumstantial evidence suggests it is involved in the control of thermogenesis in early postnatal life.
Newborn phocid seals have a characteristically short lactation period, when the young undergo dynamic change (Bryden 1969; Oftedal, Boness, and Tedman 1987). Growth is rapid; most species at least treble their birth weight in just a few days or weeks (Laws 1959; Bowen, Oftedal, and Boness 1985). Most of the increase in weight is due to deposition of fat, although growth of the musculature and many other organs does occur. There is little increase in bones during this phase of growth (Bryden 1969). Dynamic shifts in the relative size of different tissues and organs occur during this stage; for example, the muscles that are used in terrestrial locomotion grow relatively more quickly than those that are not. This situation changes
when the seals begin swimming, when those muscles responsible for aquatic propulsion grow relatively more quickly (ibid.).
Elephant seals are subjected to severe environmental conditions at and soon after birth. Although they experience a less extreme temperature change in passing from the uterus to the external environment than do polar seals such as Weddell and ringed seals, it is conceivable that they experience greater cold stress at birth. The coat of polar seals dries very quickly after birth, as the placental fluids on the coat quickly freeze and fall off or can be shaken off. In addition, the natal fur of these species is thicker than that of the newborn elephant seal and is a more effective insulator.
Southern elephant seals are born on subantarctic islands, where the environmental temperature is usually in the range of –5°C to +5°C. Rain, sleet, or snow is common, and the coat of the newborn seal may remain wet for several hours. This combined with the relatively ineffective insulation of the coat means that the newborn elephant seal can be subjected to extreme cold stress at birth, exacerbated by average wind speed on many subantarctic beaches of 40 km/hour.
As a rule, newborn pups do not adopt behavioral means of reducing heat loss, such as curling up, seeking shelter, or seeking to huddle close to neighbors. Neither does the mother protect the newborn young from heat loss: she does not attempt to shelter it or draw it close to her body.
These observations suggest that physiological mechanisms are predominant in maintaining body temperature in early postnatal life and play an important role in other body mechanisms during this dynamic part of the seal's postnatal life. Shivering is observed rarely (Laws 1953; Little 1989) and does not appear to be an important means of thermogenesis except in the most extreme circumstances.
My group has been studying aspects of the endocrine changes in early postnatal life for several years. Major aims of the work have been to examine the endocrine control of early postnatal development and gain some insight into possible means of thermogenesis in the first hours and days after birth.
The Endocrine Glands in Newborn Seals
It was first observed about forty years ago that in newborn seals certain organs, notably, the gonads, are very large and appear to be subjected to endocrine stimulus at about the time of birth (Harrison, Matthews, and Roberts 1952; Bonner 1955). E. C. Amoroso, G. H. Bourne, R. J. Harrison, L. H. Matthews, I. W. Rowlands, and J. C. Sloper (1965) described the histological appearance of several endocrine organs in fetal, newborn, and adult gray and common seals and noted particularly that the hypophysis (pituitary gland) was well developed at birth. However, they concluded
Fig. 22.1
Comparative median sections of the hypophyses of some mammals.
The shaded structure is the adenohypophysis; the cross-hatched
structures are the neurohypophysis and adnexa.
that the rapid decrease of endocrine influence on the gonads, which involute rapidly, suggested that the placenta rather than the fetal hypophysis is implicated. The large size of the gonads is due mainly to proliferation of interstitial cells and does not reflect functional status of the organs.
The Hypophysis
The hypophysis of the southern elephant seal conforms to the general mammalian pattern. Its form is compared with that of some other mammalian species in figure 22.1, which shows variations in shape but not of general arrangement. The significance of the intraglandular cleft, expansive in the newborn hypophysis but greatly reduced in the adult, is unknown.
Cell types in the pars distalis were differentiated by staining with a Periodic Acid Schiff–Alcian blue—orange G method modified from M. F. El Etreby, K.-D. Richter, and P. Günzel (1973). Four clearly distinct chromophilic cells were visible following staining, namely, gonadotrophs, thyrotrophs, lactotrophs, and somatotrophs. The relative frequencies of the different cell types in adult cows and young pups are shown in table 22.1.
| ||||||||||||||||||||||||||||||||||||||||||||||||||||||||||||||||||||||||
A preponderance of chromophobic cells in the hypophysis at birth contrasts with the situation in the adult, in which chromophilic cells suggest activity in controlling various physiological events and reproductive events in particular (Griffiths and Bryden 1986). A similar, relatively immature appearance of the adenohypophysis of the newborn animal, with the presence of many chromophobic cells, was observed in the harp seal by J. F. Leatherland and K. Ronald (1979). This contrasts with the finding in the common seal that the maturity of the adenohypophysis at birth is striking (Amoroso et al. 1965).
By far the most abundant chromophilic cell in the hypophysis of the elephant seal pup is the somatotroph, suggesting that the adenohypophysis may be actively secreting growth hormone during the rapid early postnatal growth of the pup (see table 22.1). Attempts to assay growth hormone in the plasma of elephant seal pups were unsuccessful, but the morphological evidence suggests that plasma concentrations of growth hormone may be quite high.
Immunocytochemical methods would improve the sensitivity of identifying the different cell types and would enable one to identify corticotrophic cells. They would also differentiate between luteotrophin-secreting and FSH-secreting cells, not possible with the histochemical staining regime used here.
The Thyroid
The hormones secreted by the thyroid gland, thyroxine (T4) and triiodothyronine (T3), are responsible for normal growth and maintenance of homeothermy through their role in controlling body metabolism. We have examined both histological and endocrinological indicators of thyroid function. A detailed description of the thyroid gland and its function in southern elephant seals has been provided by G. J. Little (1991).
Histology
Squamous thyroid epithelial cells are indicative of low or reduced thyroid activity, whereas cuboidal or columnar epithelium signifies increased activity. In southern elephant seal pups, thyroid epithelial cell height is significantly greater in the first two days of life than subsequently (Little 1991).
Ultrastructurally, dramatic morphological changes occur in the thyroid epithelial cells in the first 24 to 48 hours after birth and have been illustrated by Little (1991). Pseudopodia protrude into the thyroid follicular lumen from the surface of the epithelial cells. The pseudopodia engulf colloid within the follicular lumen and take it up into the epithelial cells. For the first few hours of postnatal life, colloid is confined to the apical portion of the epithelial cell, but after 6 hours, colloid droplets become distributed throughout the cytoplasm. This indicates that thyroglobulin, absorbed from
the lumen following engulfment by the pseudopodia, is being hydrolyzed and that T4 and T3 are being released.
Endocrinology
The plasma concentrations of T4 and T3 increased in the first 24 hours or so of postnatal life (Little 1991). Plasma T4 concentration showed about a twofold increase in the first 2 hours after birth, which is similar to the situation in many other mammals. Plasma T3 concentration, however, increased about eightfold at 24 hours after birth, the most dramatic increase of any newborn mammal. The concentration remained elevated until 7 days of age. Little (1991) concluded from these observations that the hypophysis-thyroid axis is functional at birth in the southern elephant seal and that the thyroid gland is the source of circulating T4 and T3 in the pup.
T3 is physiologically much more active than T4, and in newborn elephant seals, it seems to play an important role in thermogenesis, at least in the first week of postnatal life. It probably does so by increasing the metabolic rate. The growth of fat increases markedly after the first week (Bryden 1969), so the physical insulation it provides probably reduces heat loss, leading to lowered metabolic rate. We have not confirmed this in elephant seals, but it has been shown to be the case in common seals and harp seals (Davydov and Makarova 1964).
In summary, there is morphological and physiological evidence that the thyroid gland is very active within a few hours of birth and is responsible for increased levels of circulating T4 and T3 for the first days of life. It was not possible to confirm whether thyroid function was initiated and maintained by the hypophysis, but the presence of mature thyrotrophs in reasonable numbers in the hypophysis of the newborn seal (table 22.1) suggests this is probably the case.
The Pineal
It has been known for almost twenty years that polar animals tend to have a very large pineal gland. Southern elephant seals are no exception. A remarkable feature of this species, however, like the Weddell seal and other polar seal species, is that the pineal gland is particularly large at birth (Bryden et al. 1986; see fig. 22.2).
Histologically, the pineal contains many pinealocytes at birth, indicating that the gland is potentially functional (ibid.). This contrasts with the gonads, whose enlargement at birth results from the great proliferation of interstitial tissue.
Ultrastructurally, the pinealocytes appear relatively immature (Little and Bryden 1990). This suggests that the pineal, although enlarged, may not be very active at birth. However, the density of pinealocytes is similar
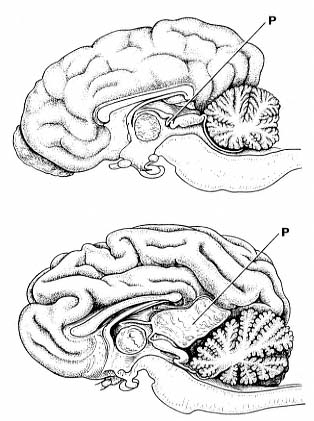
Fig. 22.2
Median section of the brain of a dog (top) and a newborn
elephant seal (bottom). The pineal of each is marked (P).
in pups and adults, and the pup pineal contains 50 to 100 times more pinealocytes than the adult (Bryden et al. 1986).
We tested for pineal activity by assay of plasma for the hormone secreted by the pineal gland, melatonin. Details of the assay method are given in D. J. Kennaway, T. A. Gilmore, and R. F. Seamark (1982) and C. R. Earl, M. J. D'Occhio, D. J. Kennaway, and R. F. Seamark (1985).
The assays revealed extremely high concentrations of circulating melatonin in the first days of postnatal life. Concentrations in excess of 60,000 picomoles per liter (pM/l) were measured. (This contrasts with levels in most adult mammals of 100–300 pM/l.) It is possible that at least some of the melatonin may originate from organs other than the pineal, for example, the retina. However, the fact that the pineals of newborn pups also con-
tained high concentrations of melatonin (Little and Bryden 1990) argues for a high level of production of melatonin in the pineal itself.
The pineal and its secretory product, melatonin, have been implicated in the control of several physiological mechanisms, in particular, reproduction, by mediating the influence of the photoperiod on the neuroendocrine-reproductive axis. As currently perceived, the function of the pineal is a rather general one, serving as an intermediary between the external environment (particularly the photoperiod) and the organism as a whole (Reiter 1981). We have observed that it is large and active in the newborn elephant seal and suggest it is involved in thermoregulation at this stage of the seal's life.
The profiles of plasma melatonin and T3 concentration are somewhat similar. They increase in the first hours of postnatal life and decline after about the first week.
Comparison of Southern and Northern Elephant Seals
If our conclusion that the pineal gland in newborn pups is involved in thermoregulation is correct, we should expect to see a lesser role for the pineal in early postnatal life in the northern elephant seal as compared to the subantarctic southern elephant seal. Plasma has been assayed for melatonin concentration in northern elephant seals (fig. 22.3). We see that although the concentration of melatonin in northern elephant seals is very high, and it follows a similar pattern to that in the southern elephant seal, the concentrations for the most part are substantially lower than in the southern elephant seal. This needs to be looked at in more detail, but these results tentatively support the notion that the pineal gland is involved in thermogenesis in elephant seals in early postnatal life.
Adrenal
An important omission so far is the adrenal gland, which has not been examined in elephant seals. F. R. Engelhardt and J. M. Ferguson (1980) reported high concentrations of cortisol and aldosterone immediately after birth in gray seal and harp seal pups. They discussed the possible role of these hormones acting synergistically to promote gluconeogenesis and the role of cortisol in increasing cold tolerance in the newborn. The extreme cold to which newborn southern elephant seals are subjected induces stress almost certainly, and the role of the adrenal needs to be addressed.
Conclusions
Endocrine glands of newborn southern elephant seals are active and almost certainly vital to survival in the first hours and days of postnatal life. Morphological evidence suggests the hypophysis secretes growth hormone, in-
Fig. 22.3
Plasma melatonin concentration (pM/l) in neonatal southern (closed circles,
solid line) and northern (open circles, broken line) elephant seals.
volved in the very rapid growth during the lactation period. It has not been possible to quantify the degree of hypophyseal control of the thyroid gland in early postnatal life by the methods used so far.
The thyroid gland is large and active within about 2 hours of birth in the production of thyroid hormones. Increased amounts of thyroid hormones are released into the bloodstream during the first day, and high circulating levels are maintained for the first week of life. The rate of metabolism probably declines in the second week as a consequence of reduction in the levels of thyroid hormones, when the rate of blubber deposition increases and physical insulation is enhanced.
The pineal gland is very large and active in newborn elephant seals. Circumstantial evidence suggests that it plays an important role in thermoregulation in the first hours and days of postnatal life.
Acknowledgments
I thank the Director, Antarctic Division, Hobart, and the Director, Tasmanian National Parks and Wildlife Service, without whose support over many years this work would not have been possible. Many people have assisted in many ways, but in particular, I wish to acknowledge the contributions and stimulating discussions of David Griffiths, Gerald Little, David Kennaway, Raymond Tedman, and Jean Ledingham. I extend thanks to Ms. B. Jantulik for illustrations and Mrs. L. Hicks for preparing the manuscript.
References
Amoroso, E. C., G. H. Bourne, R. J. Harrison, L. H. Matthews, I. W. Rowlands, and J. C. Sloper. 1965. Reproductive and endocrine organs of foetal, newborn and adult males. Journal of Zoology, London 147: 430–486.
Bonner, W. N. 1955. Reproductive organs of foetal and juvenile elephant seals. Nature 176: 982–983.
Bowen, W. D., O. T. Oftedal, and D. J. Boness. 1985. Birth to weaning in 4 days: Remarkable growth in the hooded seal, Cystophora cristata. Canadian Journal of Zoology 63: 2841–2846.
Bryden, M. M. 1969. Relative growth of the major body components of the southern elephant seal, Mirounga leonina (L.). Australian Journal of Zoology 17: 153–177.
Bryden, M. M., D. J. Griffiths, D. J. Kennaway, and J. Ledingham. 1986. The pineal gland is very large and active in newborn antarctic seals. Experientia 42: 564–566.
Davydov, A. F., and A. R. Makarova. 1964. Changes in heat regulation and circulation in newborn seals on transition to aquatic form of life. Fiziol. Zhur. SSSR 50: 894–897.
Earl, C. R., M. J. D'Occhio, D. J. Kennaway, and R. F. Seamark. 1985. Serum melatonin profiles and endocrine responses of ewes exposed to a pulse of light late in the dark phase. Endocrinology 117: 226–230.
El Etreby, M. F., K.-D. Richter, and P. Günzel. 1973. Histological and histochemical differentiation of the glandular cells of the anterior pituitary in various experimental animals. Excerpta medica (Amsterdam), International Congress Series 288: 270–281.
Engelhardt, F. R., and J. M. Ferguson. 1980. Adaptive hormone changes in harp seals, Phoca groenlandica , and gray seals, Halichoerus grypus , during the postnatal period. General and Comparative Endocrinology 40: 434–445.
Griffiths, D. J. 1980. The control of the annual reproductive cycle of male elephant
seals (Mirounga leonina ) at Macquarie Island. Ph.D. dissertation, University of Queensland, Australia.
Griffiths, D. J., and M. M. Bryden. 1986. Adenohypophysis of the elephant seal (Mirounga leonina ): Morphology and seasonal histological changes. American Journal of Anatomy 176: 483–495.
Harrison, R. J., L. H. Matthews, and J. M. Roberts. 1952. Reproduction in some pinnipedia. Transactions of the Zoological Society of London 27: 437–540.
Kennaway, D. J., T. A. Gilmore, and R. F. Seamark. 1982. The effect of melatonin feeding on serum prolactin and gonadotropin levels at the onset of estrous cyclicity in sheep. Endocrinology 110: 1766–1772.
Laws, R. M. 1953. The elephant seal (Mirounga leonina Linn.). I. Growth and age. Falkland Islands Dependencies Survey, Scientific Reports 8: 1–62.
———. 1959. Accelerated growth in seals, with specific reference to Phocidae. Norsk Hvalfangst-Tidende 48: 425–452.
Leatherland, J. F., and K. Ronald. 1979. Thyroid activity in adult and neonate harp seals, Pagophilus groenlandicus. Journal of Zoology, London 189: 399–405.
Little, G. J. 1989. Thermoregulation in the newborn southern elephant seal, Mirounga leonina (L.). Ph.D. dissertation, University of Queensland, Australia.
———. 1991. Thyroid morphology and function and its role in thermoregulation in the newborn southern elephant seal (Mirounga leonina ) at Macquarie Island. Journal of Anatomy 176: 55–69.
Little, G. J., and M. M. Bryden. 1990. The pineal gland in newborn southern elephant seals, Mirounga leonina. Journal of Pineal Research 9: 139–148.
Oftedal, O. T., D. J. Boness, and R. A. Tedman. 1987. The behavior, physiology, and anatomy of lactation in the pinnipedia. In Current Mammalogy , vol. 1, ed. H. H. Genoways, 175–245. New York: Plenum.
Reiter, R. J. 1981. The mammalian pineal gland: Structure and function. American Journal of Anatomy 162: 287–313.