REFERENCES
California Energy Commission (1980a). "Renewables and Alternative Technologies Synopsis, Staff Draft," P500-80-012, Sacramento.
California Energy Commission (1980b). Solar/Wind Programs, Final Environmental Impact Report . P700-80-005.
California Energy Commission (1983). "California's Solar, Wind, and Conservation Tax Credits, Draft Report." Tax Credit Committee, P103-83-001.
California Energy Commission (1986a). Results From the Wind Project Performance Reporting System, 1985 Annual Report , P500-86-013.
California Energy Commission (1986b). Solar and Wind Technology Tax Incentive Impact Analysis , Report Prepared by Polydyne, Inc. P500-86-010.
California Energy Commission (1988). Forecasts of Annual Capacities of the Supply of Electricity Likely to be Available from Quailing Facilities Not Subject to CEC Jurisdiction , Prepared by Regional Economic Research, Inc.
Energy Information Administration (1987). Monthly Energy Review , October. DOE/EIA-0035(87/10).
EPRI Journal (1980). "Going With the Wind," Vol. 5, No. 2, March, pp. 6-18.
EPRI Journal (1984). "Wind Power: A Question of Scale," Vol. 9, No. 4, May, pp. 6-16.
Hirsh, E., L. Briefly, and V. Schwent (1981). "A Guide to Financial Assistance for Wind Energy," Sacramento: California Energy Commission.
Kahn, E. (1979). "Wind and Solar With Conventional Technology," Annual Review of Energy , Vol. 4, pp. 313-352, Palo Alto, Calif.: Annual Reviews, Inc.
Katzman, M. T. (1984). Solar and Wind Energy An Economic Evaluation of Current and Future Technologies . Rowman and Allanheld.
Merriam, M. F. (1986). "Wind Electricity for California: Costs and Benefits," Universitywide Energy Research Group Working Paper No. UER-164, Berkeley: University of California.
Office of Technology Assessment (1985). New Electric Power Technologies: Problems and Prospects for the 1990s , Washington, D.C.: OTA-E-246.
Smith, D. R. (1987). "The Wind Farms of the Altamont Pass Area," Annual Review of Energy , Vol. 12, pp. 145-183, Palo Alto, Calif: Annual Reviews, Inc.
Solar Energy Research Institute (1981). A New Prosperity, Building a Sustainable Future, The SERI Solar/Conservation Study. Andover, Mass.: Brick House Publishing.
Tabors, R. D., S. Finger, and A. J. Cox (1981). "Economic Operation of a Distributed Power System Within an Electric Utility," IEEE Transactions on Power Apparatus and Systems , Vol. PAS—100. No. 9.
Van Kuiken, J. C. (1980). "Reliability, Energy, and Cost Effects of Wind-Powered Generation Integrated With a Conventional Generating System," Argonne, Ill.: Argonne National Laboratory, ANL/AA-17.
TABLE 9.1 | ||
Expenditure | % of Total | |
Intermediate and Large Turbines | 202.1 | 51.7 |
Small Turbines | 60.0 | 15.3 |
Darrieus Turbines | 22.3 | 5.7 |
Generic a | 106.8 | 27.3 |
NOTE: Includes policy studies, wind resource assessments and fundamental engineering studies. | ||
TABLE 9.2 | |||||
Before | 1982 | 1983 | 1984 | 1985 | |
Cumulative Number of Turbines | 144 | 1,300 | 3,800 | 8,100 | 13,500 |
Investment/Year ($ In Millions) | 21 | 139 | 326 | 680 | 1,100 |
Installed Capacity (MW) | 7 | 71 | 239 | 583 | 1,121 |
Energy Generated (MWh/yr) | 0 | 6 | 51 | 195 | 661 |
TABLE 9.3 | ||
Cost of | Resulting Average Total | |
Wind Turbine | Social Cost | Private Cost |
900 | 7.5 | 4.1 |
1,200 | 9.1 | 4.6 |
1,500 | 10.8 | 5.0 |
1,800 | 12.3 | 5.5 |
2,100 | 13.9 | 6.0 |
TABLE 9.4 | ||
FloWind 1984 | Zond Painted-Hills | |
Total $ | Average | Total $ | Average | |
(in millions) | (¢/kWh) | (in millions) | (¢/kWh) | |
Partners' After-Tax | 1,750 | 0.4 | 66 | 3.1 |
Payments by SCE | 26,704 | 7.3 | 146 | 7.3 |
Lost Revenue to | 7,440 | 1.9 | 36 | 1.7 |
Lost Revenue to | 8,429 | 2.3 | 38 | 1.8 |
Total Economic Cost | 48,298 | 12.4 | 219 | 10.3 |
Variable Costs | 8,775 | 2.3 | 49 | 2.3 |
TABLE 9.5 | ||
CEC Estimates of | Avoided-Cost Rates From | |
Total | Average | Total | Average | |
($ in thousands) | (¢/kWh) | ($ in thousands) | (¢/kWh) | |
Partners' After-Tax | - 1,121 | -0.29 | -264 | -0.70 |
Payments by SCE | 23,426 | 6.41 | 25,100 | 6.87 |
TABLE 9.6 | |||
Cost of | Resulting Average | Price of Oil ($/barrel) to Produce | |
Wind Turbine | of Electricity | at Heat Rate of | at Heat Rate of |
700 | 6.5 | 27.49 | 30.15 |
800 | 7.0 | 29.16 | 33.18 |
900 | 7.5 | 33.00 | 36.19 |
1,000 | 8.1 | 35.76 | 39.21 |
1,100 | 8.6 | 38.50 | 42.24 |
1,200 | 9.1 | 41.24 | 45.25 |
1,300 | 9.7 | 44.00 | 48.28 |
1,400 | 10.2 | 46.75 | 51.30 |
TABLE 9.7 | |
Present Value | |
Total Costs | 1,602 |
Total Benefits | 1,139 |
Net Benefits | -463 |
Utility Subsidy | 152 |
Tax Credits | 373 |
TABLE 9.8 | ||||
Present Value of Net Benefits (1986 $in millions) | ||||
Target Price of | Target Price of | |||
Wind Program Starting in | Wind Program Starting in | |||
Expectations on Oil Price | 1984 | 1980 | 1982 | 1980 |
3% per year | 667 | 561 | 935 | 895 |
1% per year | No positive value for any start date | -406 | No Positive value for any start date | -139 |
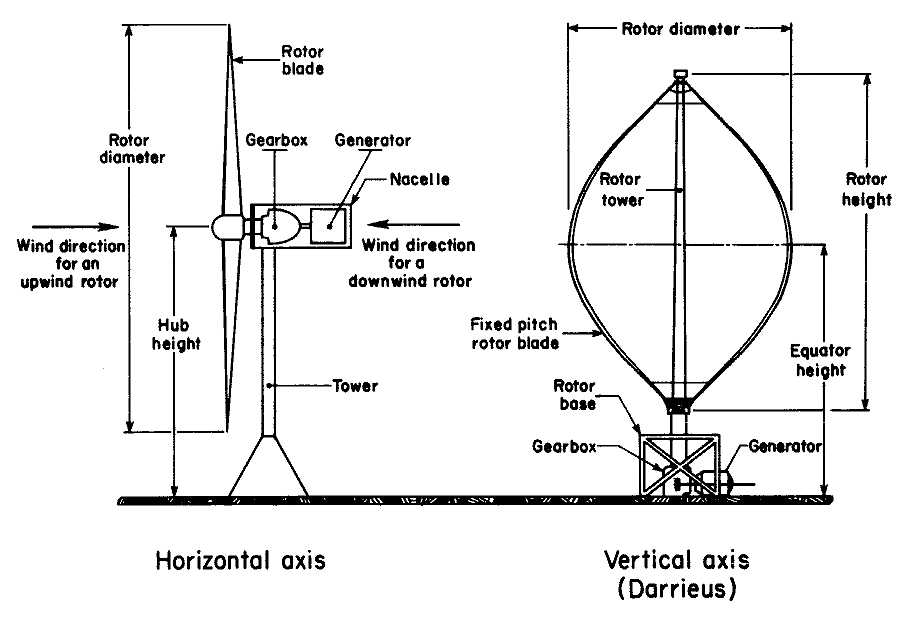
9.1. Vertical axis and horizontal axis wind turbines.
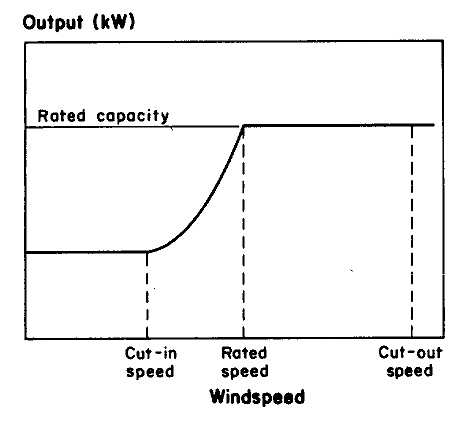
9.2. Windspeed vs. output.
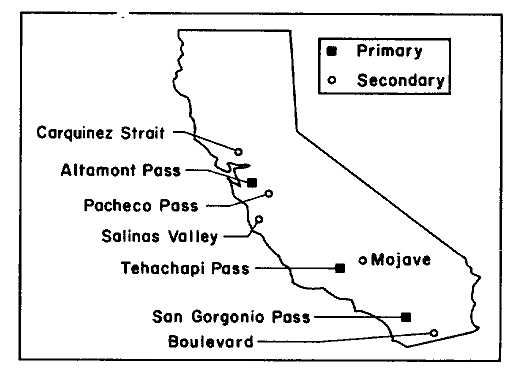
9.3. Major wind farm sites in California.