Data from North China
In a number of respects these estimates are not entirely satisfactory. On the one hand, it is not exactly clear from the summary report which measure of income was used: net or gross, cash or total (which includes cash income plus income in kind). C. Robert Roll has argued that households probably re-
[31] Approximately 45 percent of land was rented out in the Yangzi region, as compared to 15–20 percent in North China. These estimates are based on Tudi Weiyuanhui, Quanguo tudi diaocha , pp. 26–27.
[32] In calculating the Gini coefficient for the entire sample, we have pooled the data by taking a weighted average of the percentage of households in each province in each size category, using as weights the percentage of the total rural population in each province. Rural population estimates are based on provincial population estimates contained in Dwight H. Perkins, Agricultural Development in China, 1368–1968 (Chicago, 1969), p. 212, and estimates of the percentage of population classified as rural are provided in Wu Baosan, Zhongguo guomin suode, 1933 nian (Shanghai, 1947), 1:151.
ported their total net income, yet the difficulty of accurately estimating all in-kind income and production expenditure cannot be underestimated. On the other hand, if household incomes and family size are systematically related, the distribution of household income may provide a misleading indicator of income distribution on a per capita basis. From a welfare perspective, it is the latter distribution with which we are concerned. Again, we need to know how the distributions for household income and household income on a per capital basis are related to each other.
Three village surveys undertaken by the South Manchurian Railway Company in 1936 in Hebei Province provide important information on each of these questions.[33] These surveys are unique because they enumerate every household in the village and give information on both in-kind and cash incomes and expenditures, thus allowing comprehensive estimates of household incomes.[34] The village data allow us to compare the degree of inequality in the distribution of assets and income by households and in per capita terms. The difference between these two measures of village inequality can be combined with the information in Table 6.3 to make a tentative estimate of the degree of income inequality in rural China at the household level on a per capita basis, which can then be compared with estimates for other low-income countries. These surveys also provide important clues as to why the concentration of incomes observed in Table 6.3 was so much lower than that suggested by the data on land ownership alone.
The three villages selected by the South Manchurian Railway Company for detailed examination include Michang Village in Fengrun County, Dabeiguan in Pinggu County, and Qianlianggezhuang (Lianggezhuang for short) in Changli County. All three were located in northeastern Hebei within 100 kilometers of each other and were less than several hundred kilometers from Tianjin. Despite some obvious similarities, there were marked differences between the villages, some of which are captured in Table 6.4.
Dabeiguan was a relatively poor, only moderately commercialized farming village that was first settled in the early Ming dynasty (1368–1644). At the time of the survey it was made up of 98 households and had a total population of 601. Much of its acreage was devoted to food crop production
[33] See Minami Manshu Tetsudo Kabushiki Kaisha, Kito Noson Jittai Chosahan, Dainiji kito noson jittai chosa hokokuso: tokeihen ; Dai ichiban: Heikoku ken ; Dai sanban: Hojun ; Dai yonban: Shorei ken (Dairen, 1937). These surveys are part of an enormous collection of materials on social and economic life in China compiled by the South Manchurian Railway Company during the late 1930s and early 1940s. For an introduction to these materials, see Philip C. C. Huang, Peasant Economy .
[34] An earlier estimate of the degree of income inequality in a North China village made by Marc Blecher suffers in both regards because it is based on a stratified sample in which larger farms are overrepresented and because household income is measured simply by the gross agricultural output of each household. See Marc Blecher, "Income Distribution in Small Rural Chinese Communities," China Quarterly 68 (Dec. 1976): 795–816.
| ||||||||||||||||||||||||||||||||||||||||||||||||||||||||||||||||||||||||
for village consumption, although approximately 15 percent of the total cultivated area was used to grow cotton and sesame primarily for market sale. Slightly less than 15 percent of agricultural output was marketed. Animal husbandry represented an important, but perhaps declining, sideline for some households.[35]
Every household in the village was engaged in agriculture, and all but five actually owned some land. Farms averaged almost 25 mu , or 1.67 hectares (15 mu equals 1 hectare). Only five percent of the land in the village, however, exchanged hands through the rental market. In contrast, the labor market
[35] According to the preface to the survey, population pressure had reportedly begun to crowd out animal husbandry. Some households (the poorer ones) were forced to abandon animal husbandry altogether, whereas others switched to rearing smaller animals.
was very active. Villagers employed substantial amounts of labor from inside and outside the village on an annual and seasonal basis. Villagers also worked outside the village primarily on a daily basis. In this regard, the labor market appears to have been the primary mechanism through which households offset imbalances in resource endowments. On the whole, Dabeiguan was a small net exporter of labor. In all likelihood because of more lucrative opportunities outside the village, Daibeguan was, at the same time, a net lender of capital.
Michang, in contrast, typifies the richer, more highly commercialized villages of North China. It was made up of 114 households and had a total population of 753. Because of its rail links to the region's major urban centers, agriculture had become highly specialized in the course of the early twentieth century. In the process, farm households replaced the cultivation of basic foodgrains, like sorghum and millet, with cash crops, such as cotton, and purchased large amounts of grain from outside sources. By the mid-1930s more than a third of the cultivated area was in cotton, and almost half of agricultural output was marketed. Commercial fertilizers also began to be widely used and represented a significant expenditure item for almost all farming households.
Although agriculture was the primary source of income in Michang, 15 households were engaged solely in nonagricultural activities. An additional 22 households were engaged in nonfarm sidelines. These activities included peddling, carpentry, food processing, and local government service. Three households reported no income and were classified by surveyors as "beggar households." A total of 19 village members had also migrated (primarily to Tangshan and Tianjin, and mostly as shopkeepers) and, through remittances, represented a key source of income for some households.
Cash-cropping and the commercialization of the local economy substantially increased productivity and the demand for labor.[36] Only a portion of this increase, however, was accommodated by an increase in labor supply from within the village, and Michang looked increasingly outside its boundaries for labor. In the 1930s, Michang was a net importer of labor. This was complemented by a very active land rental market, in which almost a third of all land exchanged hands. Yet most of this exchange was due to villagers cultivating land owned by village outsiders (absentee landlords). Within Michang, households cultivated most of the land they owned. Unlike Debeiguan, Michang was a net borrower of capital.
Situated on the Bei-Ning Railroad, Lianggezhuang was also a highly commercialized village, although more closely tied to Manchuria than to North
[36] The annual labor requirement for cotton, for example, was 12 days per mu , or double the requirement for grain crops. The demand for marketing and auxiliary services also increased labor demand.
China. With 101 families and a total population of 574, it was slightly smaller than either Michang or Dabeiguan. Through the first three decades of the twentieth century, Manchuria had provided a rapidly expanding market for farm products and employment for some village members. Lianggezhuang's chief agricultural export was pears. Much of the profit from these exports was reportedly reinvested in land, and by the 1930s almost one third of total acreage was in pear orchards.
With the establishment of the puppet state of Manchoukuo in 1932, however, exports and seasonal migration were sharply curtailed. These difficulties were further compounded by a series of poor harvests. In 1936 pear output contributed only one-seventh to the gross value of agricultural output despite representing almost a third of cultivated area. This had profound ramifications for the labor market, for this one crop had formerly absorbed over one half of agricultural household labor and had drawn in much labor from outside the village.[37] As these opportunities dried up, many villagers now sought short-term work in the nearby prefectural capital, and Lianggezhuang actually became a net exporter of labor. Reflecting these difficulties, in 1936 agriculture contributed only 58 percent of total gross village income.
What can we say about the distribution of land and income in these three villages, and how does it compare to the aggregate estimates for Hebei? Table 6.5 reports Gini coefficients for asset holdings (land, draft animals, and labor power) and incomes, both on a household and household per capita basis for each of the three villages. Mean values of each variable are reported in parentheses.[38] In Michang and Lianggezhuang average landholdings were smaller, and land ownership much more concentrated, than in Dabeiguan. The same is also true of household ownership of draft animals. In the two more highly commercialized villages the degree of concentration of landholdings was 20–25 percent higher than in Dabeiguan. The average Gini coefficient for the three villages was 0.70, only slightly higher than the average (0.65) for 32 villages also surveyed in Hebei in 1936.[39] In all three villages, however, land rental helped to equalize access to land among households; this effect is most pronounced in Michang and Lianggezhuang, where a third and a half of the land were leased to tenants, respectively. In Michang, for example, the Gini coefficient for landholdings was 0.75, while that for operational holdings was 0.55; in Lianggezhuang the coefficients were 0.75 and 0.53, respectively. The mean operational holding in Michang was also much larger than the mean landholding because of the substantial
[37] This was the opinion of the surveyors as expressed in the preface to the survey.
[38] Here, and throughout this paper, we apply the term "per capita" to data on landholdings, incomes and other variables that we obtain by dividing household figures for these variables by the number of persons per household.
[39] See Mantetsu chosa geppo 18, no. 1 (1939): 39–73 and 18, no. 4 (1939): 21–31.
| ||||||||||||||||||||||||||||||||||||||||||||||||||||||||||||||||||||||||||||||||
holdings of absentee landlords. In Lianggezhuang the situation was the exact opposite, because a quarter of the land was rented out to nonvillagers, who were not included in the survey.
Table 6.5 also shows Gini coefficients for household income and household income on a per capita basis.[40] The Gini coefficients for household income are very consistent with the estimate suggested by the National Land Commission data for Hebei. As reported in Table 6.3, the Gini coefficient for the distribution of rural incomes in Hebei was 0.46. We also observe that for two of the three villages net household incomes were much more evenly distributed than cash incomes.
Yet for reasons spelled out above, it is the distribution of household income on a per capita basis that concerns us. And here we observe in every case a much lower degree of inequality on a per capita basis than on a household basis: Michang, 0.488 versus 0.391; Lianggezhuang, 0.409 versus 0.346;
[40] The details of the income calculations are included in a lengthy appendix available from either author on request.
and Dabeiguan, 0.436 versus 0.349. The average difference between the Gini coefficients is 0.08. If this relationship held throughout the province, it would suggest a Gini coefficient for per capita rural household incomes in Hebei of 0.38, that is, 0.46 – 0.08. We also note that when measured on a per capita basis, the differences in the degree of income inequality between the villages are very small. Moreover, although overall inequality was slightly higher in Michang, average per capita income was also more than a fifth higher than in either of the other villages. With differences in consumption expenditure per capita even smaller, much of the higher income in Michang obviously took the form of higher savings.
Several questions immediately arise: (1) why is the inequality of incomes on a per capita basis much lower than the inequality at the household level? (2) why are household incomes distributed so much more equitably than landholdings? and (3) what diluted the influence of the much higher inequality in landholdings in Michang and Lianggezhuang and produced a dispersion in incomes similar to that observed for Dabeiguan?
Until the recent work of Kuznets, the influence of the size distribution of households on income disparities was neglected. Most estimates of income inequality were calculated using income per household. Since households differ in size, this can provide a very misleading indicator of the degree of dispersion of incomes on a per capita basis. In general, family size and family incomes are highly positively correlated. In the three villages we examined, the households with the highest incomes are usually those with ten or more members. The most obvious reason for this is that larger families typically have more members of working age who can add to the household's income. In China these households were typically extended, multigenerational households that had not recently divided.
If incomes increase more than proportionally with household size, the dispersion of incomes on a per capita basis will actually exceed their dispersion on a per household basis. But this is typically not the case; rather, incomes increase less than proportionally, and family size and per capita incomes are negatively associated. Indeed, some of the poorest households on a per capita basis in these villages are among those identified as having the highest total household incomes. Although it need not always be the case, under such conditions the dispersion of household incomes on a per capita basis can be less than that for total household incomes. This is in fact what we observe for all three villages.[41]
[41] The tendency for the dispersion of household incomes on a per capita basis to be lower than their dispersion on a household basis appears to be much more common for developing than for developed countries. For a sample of six developing countries (Colombia, India, Malaysia, Nepal, Sri Lanka, and Taiwan), the average difference between the Gini coefficient for household incomes or expenditures and the same measure on a per capita basis was 0.05. The largest difference was observed for Malaysia, where the Gini coefficient for households ranked by incomes was 0.52, whereas that for households ranked on a per capita basis was 0.43. The data also suggest a slightly larger difference between the two measures in rural than in urban areas. These estimates are taken from Pravin Visaria, "Demographic Factors and the Distribution of Income: Some Issues," in International Union for the Scientific Study of Population, Economic and Demographic Change: Issue for the 1980's (Helsinki, 1979), 1:289–320; and Berry, "Evidence on Relationships." On the relationship more generally between household size and income distribution, see Simon Kuznets, "Size of Households and Income Disparities," Research in Population Economics 3 (1981): 1–40.
The second and third questions concerning the link between land ownership and income earnings benefit from a brief examination of what we mean by income. Conceptually, income can be thought of as a stream of earnings generated by all factors of production owned by an individual or household (current technology defining what is and is not a factor of production). In a primarily agrarian economy, the key factors of production are land, labor, and capital (the last including such things as farm implements and draft animals). Letting H, L , and K represent these three factors, and r, w , and t their returns, for household i , income, Y , is figured by the equation
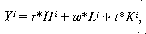
where Hi , Ki , and Li denote household i 's ownership of land, labor, and capital. A household's income, therefore, is positively related to how much of each factor it owns and to the return to each factor.
Yet where do r, w , and t come from? The returns to the various factors of production depend on the nature of the rural economy—most importantly, existing production technology, factor proportions, and the workings of markets or exchange. If all households had access to the same production technology, but each household simply used the resources that it possessed, ri , wi , and ti would differ among households, with the return to each factor negatively correlated with its relative availability within the household. Exchange alters all this. Allowing households to buy and sell the services of the factors of production frees them from their particular endowments and allows them access to all factors of production within the village. Exchange effectively coordinates all households' demands for and supplies of all factors of production, so that the return to each factor is determined by its relative availability within the village rather than within the household.[42] That is, r, w , and t would be the same across households.
Looking at incomes from this perspective, it becomes clear why many observers thought income distribution within China was highly unequal. For a majority of rural households agriculture was the primary source of income, only modestly supplemented by income from subsidiary activities, such as
[42] If factors are mobile, their returns will depend on relative availability within an even wider marketing area, not just availability within the village.
handicrafts. Thus, household incomes in the rural sector were systematically tied to income from agriculture and land ownership. At the same time, farming in China was highly labor-intensive; the land-labor ratio, in fact, was one of the lowest in the world. Modern inputs into agriculture had yet to be introduced in any quantity. As a result, the marginal productivity of labor, the level of rural wages, and the percentage of output captured by labor tended to be low relative to the return to land. A direct result of the limited off-farm opportunities, low relative returns to labor, and high concentration of land ownership was an unequal distribution of rural incomes.[43]
Yet perceptions were that income inequality was becoming more severe. Why? On the one hand, both Chinese and Western observers believed that land ownership had become much more concentrated; on the other hand, they observed a falling land-labor ratio and associated with that a marked decline in wages relative to land rents.[44] This fall was only exacerbated by the imperfectly working factor markets, which prevented households from rationally redistributing factors among themselves.[45] A concurrent decline in off-farm employment opportunities, which small farm households disproportionately relied on, was also perceived to have occurred.[46] What all this seemed to mean was that landowners, who were becoming an even smaller minority, appeared to be capturing an increasing percentage of the net product of the rural sector.
[44] Estimates by Dwight H. Perkins suggest that the land-labor ratio in China proper declined by roughly 15 percent between the 1890s and the 1930s. See Agricultural Development in China , pp. 212 and 236.
[45] See Philip C. C. Huang, Peasant Economy , esp. chaps. 4–12.
[46] See, for example, Fan Baichuan, "Zhongguo shougongye zai waiguo zibenzhuyi qinruhou de zaoyu he mingyun," Lishi yanjiu 3 (1962): 88–115.
The evidence on land and income distribution presented earlier belies much of this story. To see why, recall that income distribution depends not only on the distribution of land ownership but also on the distribution of the other factors of production in the rural economy, most importantly, labor power and, to a lesser extent, draft animals and other forms of capital. It also depends on the returns to these factors and on the correlation of factor ownership across households. A high correlation of landholdings with ownership of other factors of production would only reinforce the influence of a high concentration of landholdings on incomes. The distributive impact of a high degree of concentration in land ownership could, however, be partly or entirely offset by the effects of more even distribution of ownership for other factors of production, by a rise in the share of total income earned by other factors, or by a weak or inverse correlation between ownership of different productive factors by different households.
In Table 6.5 we observe that labor power (and therefore income from labor) was indeed much more evenly distributed among households than was land. The Gini coefficients for labor power per household were 0.33, 0.32, and 0.24, for Michang, Lianggezhuang, and Dabeiguan, respectively. Draft animal ownership, on the other hand, was about as unequally distributed as landholdings in the three villages.
Yet the strength of this influence clearly depends on the portion of output that labor captures. If labor power is evenly distributed among households, but the portion of output going to labor is relatively small, the equalizing effect would itself be modest. In rural North China, land captured about half of agricultural output, labor a third, and the remainder represented the return to draft animals and other forms of farm capital.[47] These estimates are misleading, however, because agriculture was not the only source of income. In all three villages there were a variety of sidelines that offered subsidiary sources of incomes that primarily represented returns to labor. Our calculations, based on the three village surveys, show that land rents (including rents attributed to owner-operated farm land as well as cash or in-kind payments by tenants to landlords) amounted to about a third of total village income, while labor incomes accounted for more than half of all income.
Intervillage differences along these same lines helped to diminish the influence of the much higher concentration of landholdings on incomes in Michang and Lianggezhuang. In Michang, land rents averaged between 4 and 5 yuan per mu , while a long-term laborer could expect to earn 45–50 yuan in cash, plus an in-kind component of perhaps equal value. In Dabeiguan, by contrast, land rents were modestly less, at 3–3.50 yuan per mu , but wages paid long-term agricultural laborers were only about half the rate in Michang. In
[47] These estimates are taken from Loren Brandt, "Farm Household Behavior, Factor Markets, and the Distributive Consequences of Commercialization in Early Twentieth-Century China," Journal of Economic History 47.3 (September 1987): 731.
Lianggezhuang, land rents averaged even less, between 2 and 2.50 yuan per mu , while wages (cash component only) paid long-term agricultural laborers were 30–35 yuan . The same relationship is reflected in output shares; the share of agricultural output going to land in Michang and Lianggezhuang was roughly 40 percent, while in Dabeiguan it exceeded 50 percent.[48] The significantly higher return to labor relative to land in both Michang and Lianggezhuang helped to reduce the influence of a more concentrated land ownership in these villages and produce a degree of income inequality not much different from that in Dabeiguan.
Nonagricultural activities and remittances played a similar role. In both Michang and Lianggezhuang, 40 households were engaged in nonagricultural activities either as a sideline or on a full-time basis.[49] From both villages there was also substantial out-migration—37 household members from Michang, and 19 from Lianggezhuang had migrated—and the out-migrants in turn typically remitted a healthy portion of their earnings back to the villages. The higher the percentage of income generated from nonagricultural sources and received in the form of remittances, the weaker the influence of land concentration on the overall dispersion of incomes. In Lianggezhuang, nonagricultural activities and remittances produced 42 percent of gross household income, while in Michang they amounted to 17.4 percent; in Dabeiguan they totaled only 6.1 percent.
Finally, Table 6.6 reveals that the correlation between land ownership and the other factors of production was also much weaker in Michang and Lianggezhuang than in Dabeiguan. The same is also true for the relationship between labor power and draft animal ownership. While factor ownership was positively correlated, the probability that a household with substantial landholdings simultaneously had more than average labor power and draft animals was significantly lower in either Michang or Lianggezhuang than in Dabeiguan. This partially reflects the higher degree of specialization in the local economy of the first two. As a result, even though land was distributed more unequally in Michang and Lianggezhuang than in Dabeiguan, the
[48] Average land rents were computed from detailed land contract information provided by the survey. Land's share was then calculated by dividing average land rent by average output per unit of land.
[49] The percentage of households in Michang and Lianggezhuang engaged in nonagricultural activity on a full-time basis (3.5 percent and 7.4 percent, respectively) was low compared to that in other North China villages. The average for 30 villages examined by the South Manchurian Railway Company was 13.7 percent. In a number of localities, 20 percent or more of households was classified solely as nonagricultural. These include Macun in Huailu County, 21.8 percent; Zhongliangshan in Changli County, 26.8 percent; Huzhang in Ninghe County, 31.2 percent; and Dongjiao, located just outside Shijiazhuang, 46.8 percent (see Huang, Peasant Economy , pp. 314–20). In a sample of 22 villages in southern Manchuria, 16 percent of all labor (not households) was classified as nonagricultural; see Kokumuin Jitsugyobu Rinji Sangyo Chosakyoku, Kotoku gannendo noson jittai chosa , 4 vols. (Changchun, 1936).
| ||||||||||||||||||||||||||||||||||||||||||||||||||||||||||||||||||||
superior market access and non-farm employment opportunities available to residents of Michang and Lianggezhuang produced distributive outcomes that displayed no more inequality than we observe in Dabeiguan.
These calculations show, then, that the distribution of landholdings can be a very misleading indicator of the degree of income inequality in the rural economy. There is no direct line of causality running from higher concentration of landholdings to a higher concentration of income. What is true for several villages at a single time is probably true for a single village over a long period of time. Unfortunately, we do not have earlier data on distribution for these villages, and so the origins of the higher concentration of landholdings in Michang and Lianggezhuang remain a bit of a mystery. Nevertheless, even if landownership in the latter two villages became more concentrated, no widening of income differentials can be inferred.