Chapter 1—
Recent Practical Advances in Volcanology
Quantitative methods for studying volcanoes and their products are gaining importance in the evolving field of volcanology. Using increasingly more precise and accessible laboratory techniques to determine chemical compositions of rocks and minerals, petrologists have developed methodologies to understand the origins and evolution of magma. The constraints on temperature and pressure estimated from chemical data are enhanced by results of geophysical surveys; together, these efforts have led to a better understanding of magma-chamber dimensions and locations. Simultaneously, the development of computer capabilities has allowed volcanologists to systematically quantify field observations that can be numerically modeled by using fluid mechanics. Although these developments are still relatively immature compared to similar work in other scientific fields, the advances constitute a tremendous resource for practical application in geothermal energy exploration.
In this chapter, we briefly review advances in volcanology that we consider to be fundamentally important for understanding geothermal resources:
· documentation and interpretation of chemical zonation in large-volume pyroclastic deposits and consequential implications concerning the nature of magma chambers,
· development of quantitative approaches for describing and understanding eruption dynamics and the emplacement of volcanic products, and
· the hydromagmatic theory of eruption mechanics and its significance in the interpretation of pyroclastic deposits.
Although this list is incomplete if one considers volcanology as a whole, the topics included here are those we have found to be significant for studies of geothermal systems in volcanic areas.
As in many other scientific fields, rapidly changing technology is reflected in the evolving terminology, and we stress this fact because of its importance in the communication of ideas. Definitions of terms are presented in the Glossary (Appendix G). Terms used in quantitative methods are especially vital because of their mathematical roots and because they are widely employed in science and technology. With this concept in mind, it is appropriate to describe briefly the common quantitative approaches taken in volcanology before discussing in more detail the three advances mentioned above.
Quantitative Methodology and Volcanology
The consequence of maps as the fundamental method of data representation is perhaps unique to the science of geology. Volcanology certainly relies heavily upon maps to graphically portray research problems, their geographic locations, physical and chemical trends, and hypothetical arguments. On a map, many types of quantitative data can be portrayed. For example, mapping contours of deposit thickness (isopachs ) or clast diameters (isopleths ) within the deposit is a common technique in tephra deposit studies. The mathematical representation of these contours is a valuable method for locating vent areas and estimating the volume of eruptive products as well as their emplacement mechanism (see Chapter 2).
The first step in analyzing a map-oriented data set—especially if a hypothetical argument is lacking—is statistical analysis of data trends. Examples of geological data trends are discussed extensively by Davis (1973), and specific cases include:
· trend-surface analysis of stratigraphic units and topography,
· rose diagrams of structural fabrics,
· geographic correlation of absolute and relative rock ages,
· areal density of specific surface features, and
· cluster analysis of geochemical data to define major variations.
Following statistical analysis, hypothesis development and testing can be undertaken, and these generally focus upon chemical and physical problems. Several recent text books have employed quantitative approaches in their discussions of volcanology. Williams and McBirney (1979), Araña and Ortiz (1984), and Fisher and Schmincke (1984) are recommended reading for a general background in volcanology.
Statistical Methods
Data correlation and analysis, more than any other quantitative approach, have grown in consequence as a result of enhanced computer techniques for handling statistics and data bases. In both the chemical and physical aspects of volcanology, statistical approaches are vital in the development of quantitative models.
Subsequent analysis of frequency distributions is particularly important in pyroclastic studies because particle-size distributions are indicative of physical processes involved in eruptions—processes such as the eruptive energy and the origin of volatile gases in the magma system. Parameters describing particle sizes have typically been based on the assumption of lognormal distribution, but this assumption might not be plausible and might lead only to empirical interpretations (Wohletz et al ., 1989). Because we discuss tephra grain-size parameters and their interpretation throughout this book,
a complete review of this subject is included in Appendix A.
Data correlation makes it possible to assess underlying physical or chemical controls in cases where independent and dependent variables are hypothesized. Least squares, regression, and Fourier techniques are commonly applied to correlated data. The use of multivariate analysis is an issue of greater controversy, but the method may have significant application in classification schemes (Sheridan and Kortemeier, 1987). The following pages outline some fundamental physical and chemical relationships that directly apply to geothermal systems.
Physical Processes
Energy transfer through the earth's crust (and heat flow in particular) is a basic component of geothermal systems and volcanoes. In general, heat flow is influenced by several processes that sum in the following equation (Shimazu, 1963).
where temporal heat flow (r = density, C = specific heat, T = temperature, and t = time) is equal to the sum of the adiabatic temperature gradient (a = the coefficient of thermal expansion, p = pressure), heat conduction (r = radial distance, kt = the thermal conductivity), radioactive decay heat (Hi = heat liberated by decay of the i th isotope, li = decay constant), and heat of reaction (Ji = the heat produced or liberated for the ith chemical reaction).[*] To estimate heat flow for volcanic and geothermal systems, this expression must be altered to include convective heat flow, which can be approximated by replacing in the above equation several elements:
where uconv is the velocity of convection, which can in turn be approximated by a function of Rayleigh number: uconv@ 3(Ra)1/3 , where Ra = (ra gD TD3 )/(dt µ), and µ = viscosity, g = gravitational acceleration, D = a characteristic length of the flow, and dt = kt /(r C).
Studies of mass transfer associated with volcanism generally focus on movement of magma and magmatic volatiles from the magma chamber to the surface of the earth. Two extreme cases of these processes are (a) eruptions that result in effusions of lava, and (b) explosive eruptions in which the expansion of gases determines mass transfer processes. Incompressible approximations of mass and momentum conservation are useful descriptive equations. For passive magma flow in conduits, the Bernoulli equation is
where subscripts denote values measured at two different levels in the conduit or flow system, h1 , h2 , u = velocity, and fh = a term reflecting frictional losses and is a function of conduit or substrate surface roughness and Reynolds number: Re = (r uD)/µ. Where the expansion of volatile phases under conditions of changing pressure and temperature causes both fragmentation of magma into tephra and rapid acceleration of a gas and solid mixture from the vent, it is possible to write the Bernoulli equation to account for changes in gas pressure. Two end-member processes of gas decompression are (a) the adiabatic case in which no heat is exchanged between the gas and solid particles and (b) the isothermal case, in which heat is continuously supplied to the gas from the tephra during decompression. Both cases depend upon the gas weight fraction in the mixture:
[*] For this equation and those that follow, a complete notation list is provided in Appendix C .
where r g = the gas density, rb = the bulk density of the mixture, and rp = the solid particle density. The adiabatic and isothermal cases are respectively:
where g = the gas isentropic exponent (Wilson, 1980).
Various adaptations of Eqs. (1-5) and (1-6) can be applied to different eruptive conditions (for example, Vulcanian, Plinian, and Strombolian) that are discussed in Chapter 2); they are then useful in approximating the basic relationships among gas pressure, temperature, and abundance as well as exit conditions such as ejecta velocity and column height (see the section on explosive eruptions and quantitative models later in this chapter). However, these approximations and calculations yield accurate results only when considered in light of nonlinear relationships like those included in the full set of Navier-Stokes equations written separately for gas and solid phases (Valentine and Wohletz, 1989; Wohletz and Valentine, 1990).
Chemical Processes
During the past decade, volcanic petrologists have made great strides in understanding the complex origins of magma chemistry as revealed by analyses of phenocryst and glassy components of volcanic products. Because these analyses provide abundant quantitative data, mathematical approaches are particularly suited for modeling the origins of chemical signatures.
Magma composition generally evolves with time as a result of (a) initial melting from source rocks, (b) fractional crystallization caused by cooling and the loss of volatile constituents, and (c) comingling with magmas of different composition (Carmichael et al ., 1974). The behavior of chemical species during these three important differentiation processes can be quantitatively modeled by using chemical data provided through bulk and modal analyses in which trace-element behavior is most indicative of the differentiation mechanism (Arth, 1976; Allegre and Minster, 1978).
The Rayleigh equation (Rayleigh, 1896; Gast, 1968; Greenland, 1970) applies to fractional crystallization and predicts the concentration of a particular chemical species remaining in the liquid (c1 ) after crystallization of a specific fraction of crystalline phase when the original species concentration is co :
kd = the Nernst distribution coefficient, which expresses the fraction of the chemical species in the liquid that enters the crystalline phase. F = the fraction of original melt remaining. For cases in which the chemical species enters two or more phases, kd is replaced by Do , the weighted average of solid-liquid partition coefficients of all the phases. If crystallization is incomplete at some value of F, then c1 given by Eq. (1-7) must be multiplied by kd or Do , depending upon the number of phases involved.
For conditions of partial melting, in which the liquid phase remains in equilibrium with the residual solid phases until it is removed (Shaw, 1970), the Berthelot-Nernst equation predicts c1 by
Here P = the bulk partition coefficient for the phases that melt, and F = the fraction of melted material. When only one phase is melted, P = Do .
Fractional crystallization and partial melting result in a logarithmic relationship between species concentration in the solid/liquid phases and the degree of melting or crystallization. When both fractional crystallization and partial melting occur and Do approaches zero, Eqs. (1-7) and (1-8) reduce to c1 = co /F. If one assumes that fractional crystallization occurs when there is equilibrium between the total crystallizing solid and melt, its description takes a form analogous to that of partial melting [Eq. (1-8)].
For situations in which chemical trends are the result of mixing two magmas of different compositions, a mass balance equation (Gast, 1968) predicts the resulting concentration in the magma (cx ) of some species; mm1 , c1 , mm2 , and c2 are the magma mass and species concentration of magma 1 and magma 2, respectively:
In contrast to fractional crystallization and partial melting, the concentration of a chemical species in a mixed magma is linearly dependent on the degree of mixing.
Isotopic tracers are also very useful for determining the origin and evolution of magmas (Taylor, 1971; Friedman and O'Niel, 1977; DePaolo, 1985). As in the case of stable isotopes such as oxygen, the isotopic composition is related to a standard. For oxygen, the heavy-isotope 18 O abundance is expressed
where the subscripts s and smow denote the sample and standard mean ocean water isotopic ratios, respectively. Whereas stable isotopes are considered excellent chemical tracers, radiogenic isotopes are employed in dating techniques and are widely used in geochemistry (Faure, 1977).
Magma Generation, Accumulation and Differentiation in Chambers, and Eruptions
Recent geochemical studies in igneous petrology have focused on the processes of magma generation, evolution, and collection in subsurface reservoirs called magma chambers. Although chemical reactions continue to change the composition of lava and tephra after these materials reach the earth's surface, petrologists traditionally studied only the history of volcanic rocks before their eruption. Major fields of interest have been the tectonic setting and origin of magma, processes of chemical differentiation, and magma-chamber dynamics. Recently, with the advent of powerful computers, heat flow, seismicity, and fluid convective and diffusive processes have been used to develop comprehensive models of magma chambers. Through geochemical analysis, field samples of volcanic products yield vital clues about the parent materials of magmas, the depth of their generation, and the differentiation processes that affected them on their path through the earth's crust.
Tectonic Setting and Origin of Magmas
Because ~95% of all volcanoes occur at plate margins, their locations are consistent with the theory of plate tectonics (Fisher and Schmincke, 1984; Wyllie, 1971), as illustrated by Fig. 1.1. The magma sources of volcanoes that occur in intraplate areas, whether oceanic or continental, are more difficult to explain (Christiansen, 1987). In these cases, hypotheses that involve mantle
Fig. 1.1
Tectonic setting of volcanism illustrated by estimated volumes of extrusive rocks found on the
surface of the earth. Magma volumes are expressed in cubic kilometers per year.
(Adapted from Fisher and Schmincke, 1984.)
dynamics, such as hot plumes associated with mantle convection cells (for example, Clague and Dalrymple, 1987), continental rifting (such as Riecker, 1979), and lithospheric thinning associated with extensional tectonics (for example, Christiansen and McKee, 1978) appear to be reasonable. Perhaps the most significant aspect of a tectonic setting is its effect on observed magma compositions and chamber development. (Table 1.1 summarizes five tectonic settings and their volcanic characteristics.) A primary characteristic for geothermal potential is the chamber depth, which provides information about the magma source and stagnation depth (the geothermal heat source depth). For mantle-derived magmas, which are mafic and bear mantle signatures of trace elements and isotopic ratios (Yoder, 1976), source depths of > 50 km are expected and—in the cases of continental, intraplate volcanoes—may show no crustal reservoirs. On the other hand, in rifts and extensional terrains, deep mantle magmas promote melting of crustal rocks so that shallow silicic magma chambers can develop during long periods of magma flux from the mantle (Hildreth, 1981). In contrast, arc-related volcanoes show the effect of crustal thickness. Continental arcs have magmas that, having been generated at intermediate depths of several tens of kilometers, may stagnate or become contaminated by more siliceous crustal materials during their assent (Eichelberger, 1974).
Magma Chambers
Volcanic products are generally classified by their major-element chemistry (Fig. 1.2) or their modal phenocryst content (Fig. 1.3). These classification schemes (Appendix D) are useful in relating volcanic rocks to magma types. Accordingly, the origin and evolution of magma types can be interpreted in a general manner by considering igneous compositional trends: tholeiitic, transitional, alkalic, potassic, and calcalkalic (Carmichael et al ., 1974). When the field geologist examines pyroclastic samples that do not lend themselves to the above classification schemes, the color of glass shards can be simply related to their refractive index as a function of silica content (see Appendix D as well as Williams et al ., 1982, p. 73). Rock classification has been a traditional exercise for volcanologists, and today the results of this work can be used to determine the nature of the magma source: its shape, depth, and longevity—all of which are important components when evaluating geothermal potential.
One of the most significant recent advances in volcanology is the development of a system for relating the chemical aspects of volcanic rocks to magma-chamber dynamics. This effort has been most fruitful in the cases of volcanoes that have developed calderas (Williams, 1941). Smith (1979) shows a direct correlation between caldera area and the volume of products expelled during the caldera-forming eruption (Fig. 1.4). Where caldera eruptions produce ash flows of differentiated products, Smith and Shaw (1975, 1979) and Smith (1979) show that the volume of these products is ~10% of the volume of the underlying magma chamber. This simple concept has profound implications in the search for geothermal heat sources because by using eruption age constraints, cooling models can predict the residual heat left in and around the magma chamber (Fig. 1.5). Furthermore, there is growing evidence that zonation of magma chamber chemistry can be documented by analyses of time-series chemical trends in eruption products (for example, Hildreth 1979; 1981).
Nonbasaltic volcanic rocks are considered to be products of evolved magmas. Hildreth (1981) stated, "every large eruption of nonbasaltic magma taps a magma reservoir that is thermally and compositionally zoned," and "most small eruptions also tap parts of heterogeneous and evolving magmatic systems." One general hypothesis is that evolved or otherwise differentiated magmas have a crustal reservoir. The volume of a crustal magma chamber is directly proportional to the time required for it to evolve. Consequently,
| ||||||||||||||||||||||||||||||

Fig. 1.2
Classification of volcanic rocks by major-element chemistry as expressed in alkali-silica variation
diagrams; details for major oxide concentrations (at right) are shown weight percent.
(Adapted from Cox et al ., 1979.)
differentiated volcanic products—especially where they are several cubic kilometers in volume—are good indicators of a crustal magma chamber (Fig. 1.5).
Smith's (1979) observation of the correlation between caldera area and ejecta volume opened the door for interpretation of chemical zonation in silicic magma chambers. He predicted that "all caldera-forming ash-flow sheets should, when studied in detail, show some degree of chemical and/or mineralogic gradients inherited from the magma chamber." Hildreth (1979) documented such gradients in the Bishop Tuff in eastern California. Assuming that earlier erupted products originate from the top of a magma chamber and later materials derive from lower portions, it is likely that the time-sequenced chemical characteristics of
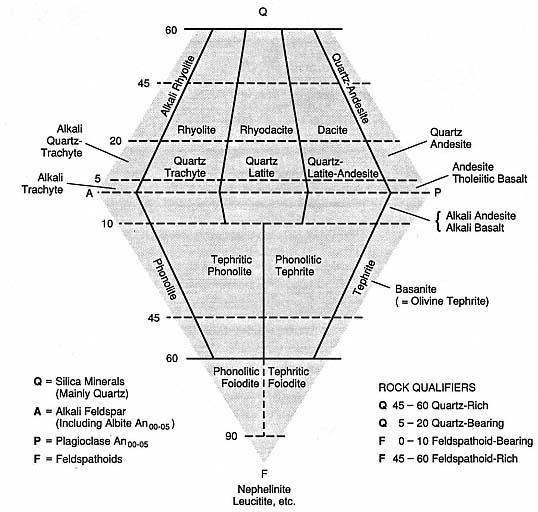
Fig. 1.3
Classification of volcanic rocks by modal phenocryst content plotted on a quartz (Q) - alkali feldspar
(A) - feldspathoid (F) - plagioclase (P) diagram. Petrographic analysis may not always be sufficient to
determine the percentage of minerals present in volcanic rocks; a calculated mineral composition,
based upon normative (chemical) composition might be necessary. Williams et al . (1982) question
this approach to classification because it presupposes "the need to agree upon a single rational and
workable system . . ." and it incorporates both "igneous and igneous-looking rocks" in such a
way that it may conceal the natural association and relative abundances of rock types.
(Adapted from Streckheisen, 1967.)
volcanic ejecta depict an inverse order of the magma chamber's compositional stratification (Fig. 1.6). This chemical stratification also is reflected by oxygen fugacity and mineral equilibrium temperatures that increase with time in products from a large eruption (Hildreth, 1981). Several other petrologic features of volcanic ejecta that suggest magma chamber zonation are isotopic ratios, phenocryst abundances that increase with SiO2 values (Fig. 1.7), and volatile component abundances. This latter feature is best typified by stratigraphic relationships showing that early products resulted from more explosive, gas-rich eruptions and later materials were from
Fig. 1.4
Correlation between caldera area and volume of products (ash flows); diagonal lines plot the
model's draw-down depths of magma chambers.
(Adapted from Smith, 1979.)
Fig. 1.5
Conductive models of heat resource as a function of the age and volume of magma
chambers. Odd numbers refer to slab-like magma chamber shapes and even numbers
represent cubic shapes. Lines 1 and 2 take into account heat transfer effects of con-
vection within the magma body, whereas lines 3 and 4 ignore this effect. Systems in
which estimated magma bodies plot above line 5 and 6 have cooled to near ambient
temperatures; those plotting below lines 1 and 2 may still have near solidus tempera-
tures; and those plotting between lines 3 and 4 are at post magmatic temperatures
>300°C. (Adapted from Smith and Shaw, 1975.)
Fig. 1.6
Plot of elemental enrichment factors as abundance ratios of early to late products of the Bishop
Tuff eruptions shows the overall difference in magma composition. The line drawn at an
enrichment factor of 1 demarks no enrichment or depletion; elements plotting above this line are
enriched in early products and those plotting below the line are enriched in late products.
These enrichment factors are interpreted to reflect magma chamber zonation, assuming
that the eruption taps different parts of the chamber with time.
(Adapted from Hildreth, 1981.)
gas-poor effusive extrusion. However, Eichelberger et al . (1986) suggested that this apparent volatile zonation in rhyolitic eruptions might only reflect eruptive conditions. In Eichelberger's model, the volatiles are not stratified in the magma. Early eruptions are explosive because the volatile flux is confined within a narrow vent region, whereas later effusive eruptions involve a gradual degassing of the rhyolite through permeable vent-wall rocks—a process that results in a volatile-poor magma by the time it reaches the surface and is extruded as a lava flow.
Although major-element abundances do support hypotheses of magma-chamber zonation, it is analyses of the trace elements that best portray the nature of the zonation and mechanisms of differentiation as a result of their variable compatibility in various phenocryst and liquid phases (Fig. 1.8). Petrologic studies of magma suggest that large chambers are fundamentally basaltic because mantle melting supplies heat to the crust for crustal melting, provides a mafic component to hybridize with the crustal melts, and generates a thermal gradient to drive various differentiation processes in the crustal magma reservoir (Fig. 1.9). This general evolution of crustal magma chambers may depend upon tectonic environment (Fig. 1.10).
Fig. 1.7
Plot of phenocryst abundances vs bulk-rock SiO2 of silicic magma for various
volcanoes. The decrease of phenocryst abundance with increasing SiO2 content is
interpreted to reflect liquidus depression caused by dissolved volatiles, which are
supposed to be more abundant in silica-rich magmas found near the tops of magma
chambers. A = caldera-forming eruption of Aniakchak (Miller and Smith, 1977);
FC = Fish Canyon Tuff (Lipman, 1975); FCM = Fish Creek Mountain Tuff (McKee,
1970); KN = Kneeling Nun Tuff (Elston et al ., 1976); MT = Monotony Tuff (Ekren et al ., 1971);
LC = Lava Creek Tuff (Christiansen and Blank, 1972); SM = Snowshoe Mountain Tuff (Ratté
and Steven, 1967); AS = Apache Springs Tuff (Rhodes, 1976); AT = Ammonia Tanks
(Byers et al ., 1976); A-4 = Aso-4 (Lipman, 1967); BT = Bishop Tuff (Hildreth, 1979);
RM = Ranier Mesa (Christiansen et al ., 1977b); S = Shikotsu caldera eruption
(Katsui, 1963); T = Tshirege (Smith and Bailey, 1966); TC = Tiva Canyon
(Christiansen et al ., 1977b); TS = Topopah Spring (Christiansen et al ., 1977b).
(Adapted from Hildreth, 1981.)
Explosive Eruptions and Quantitative Models
For reasons that will be discussed later in Chapter 2, explosive volcanic eruptions are significant in the development of geothermal systems. Over the past two decades, our general knowledge of explosive eruption mechanisms has evolved from the application of theoretical models to quantitative field data. For example, a tripartite field classification scheme shown in Table 1.2 is based upon the assumption that products of explosive eruptions are emplaced as pyroclastic deposits by fallout, flow, and surge.
Fig. 1.8
Plot of rare-earth element (REE) partition
coefficients for clinopyroxene/glass in various
magma compositions. SiO2 content greatly
affects these values; similar trends towards
high partition coefficients with increasing SiO2
content are evident for other phases, including
Fe-Ti oxides, fayalite, and feldspars.
(Adapted from Hildreth, 1981.)
Walker (1973) showed how grain-size characteristics and dispersal area of a pyroclastic deposit can be used to deduce the type of volcanic eruption from which it was produced (Fig. 1.11).
A stylized explosive eruption system is depicted in Fig. 1.12. Although relatively little is known about subsurface processes in the volcanic conduit, the behavior of eruption columns has been deduced from observations; this information allowed Wilson (1976) and Sparks and Wilson (1976) to formulate physical conditions in explosive eruption columns (see also
Fig. 1.9
Illustration of processes affecting magma chamber differentiation; idealized thermogravitational
column is at left. Early stage crustal heating by intermediate to basaltic volcanism triggers
crustal melting and buoyant rise of magmas (diapirism), followed by segregation of liquid
phases in a silicic magma chamber. Within the silicic chamber, convection enhances diffusion
processes such as that of Soret (between cold walls and hot center), volatile mass transport (dots),
and wallrock exchange. Stippled pattern depicts enriched zones in the magma chamber roof
and at both ends of the thermogravitational column. Such differentiation processes probably
last longer than the eruptive history of the associated volcanic field,
typically 106 to 107 years in large systems.
(Adapted from Hildreth, 1981.)
Wilson et al . 1980). The basic equations for the eruption are
which express conservation of mass and momentum, respectively, for one-dimensional flow along the subsurface volcanic conduit. The h and rc = vertical distance and conduit radius, respectively; g = gravitational acceleration, u = the magma's velocity, p = rg RT (perfect gas law pressure), and r = bulk density. fh is the factor expressing frictional loses along the conduit walls. The relationship among bulk (rb ), solid (rp ), and gas (r g ) densities is expressed as in Eq. (1-4).
Equations (1-5) and (1-6) earlier in this chapter are solutions for the conservation relationships of Eqs. (1-11) and (1-12). This quantitative approach to understanding volcanic phenomena is well summarized by Head and Wilson (1986) for a variety of eruption types, including effusive processes, Strombolian (scoria cone), Hawaiian (lava fountain), Plinian
Fig. 1.10
Evolution of silicic magma chambers as a function of tectonic environment. These idealized
diagrams illustrate the profound effect of crustal stress on the size and geometry of evolving
magma bodies. The top diagrams depict basalt-rhyolite magmatism in regions of crustal
extension for (a) early and (b) advanced stages. The lower diagrams show two possible
stages of dominantly intermediate volcanism in convergent tectonic regions:
(c) early stage and (d) intermediate stage; the late stage shown in Fig. 1.9.
(Adapted from Hildreth, 1981.)
| ||||||||||||||||||||||||||||||||||||||||||||||||||||||||||||
(pumice and ash columns), Vulcanian (cannon-like explosions), and Peléean (lava dome destruction).
Pyroclastic Fallout
Pyroclastic fall deposits (Fisher and Schmincke, 1984) are characterized by their relatively well sorted size characteristics, topography-blanketing dispersal, and graded bedding, but lack of other internal bedforms. The emplacement characteristics of these deposits are controlled by the terminal fall velocities of individual pyroclasts (Walker et al ., 1971; Wilson, 1972). One important component for this modeling is the assumption that eruption columns behave as thermal plumes in which the height of the plume (ht ) is proportional to the quarter root of the mass flux (d m/d t):
The constant of proportionality (kh ) is ~43.7 for steady columns and 7.22 for discrete explosions when d m/d t is expressed in kilograms per second (1 kg/s @ 1.1 kW) and ht in meters. For a convecting eruption column, a second important assumption is that vertical velocities (uv ) fit a gaussian function of distance from the plume axis (Carey and Sparks, 1986):
where uc = the centerline velocity at height h as determined from solutions of Eqs. (1-5) and (1-6) (Wilson, 1980); x = the radial distance from the plume axis, and be = the e-folding distance of uc ; 2be is the approximate distance from the plume axis to the visible edge of the plume (Sparks and Wilson, 1982). Superimposed upon uv is ur , the radial velocity of lateral plume spread, which is defined as
where rp = the plume radius, ra = the mean air density between ht (the plume height) and hb (the height at which the plume is neutrally buoyant and begins appreciable lateral movement). Figures 1.13 and 1.14 illustrate the features of this fallout model.
Pyroclastic Flows
Pyroclastic flows (ignimbrites) comprise some of the most voluminous explosive products in the geologic record, and one possible emplacement model is that for the gravitational collapse of an eruptive column (Sparks and Wilson, 1976; Wright, 1979). Based upon Prandtl's (1949) theory of turbulent fluid jets, in which ambient air is incorporated into the jet—thus changing its bulk density, the equation of motion for an eruptive column (Wilson, 1976) is written:
where q = a ratio of the average column velocity to its centerline velocity, rb = the bulk density of the column, rv = the vent radius, and ra = the density of the ambient air. Numerical solutions to this equation, summarized by Sparks et al . (1978), relate column height to gas velocity, vent radius, and water content (Fig. 1.15). Column collapse is predicted for columns that do not continue their upward motion because buoyancy forces can no longer offset drag forces on the margins of the column.
Fig. 1.11
Classification (Walker, 1973) of eruptive mechanism by grain size and dispersal characteristics of
fallout deposits. Ft is the weight percent of tephra finer than 1 mm found along the dispersal axis
where the deposit thickness is 10% of its maximum. Ad is the area of the deposit where its
thickness is at least 1% of its maximum.
(Adapted from Wright et al ., 1981.)
Figure 1.16 depicts the onset of gravitational collapse predicted by solutions to Eq. (1-16). Plinian eruptive column collapse can be precipitated by increases in vent radius or decreases in the water content of erupting materials; either condition decreases the initial velocities of the column and leads to its collapse.
Sheridan (1979) and Malin and Sheridan (1982) modeled the runout of pyroclastic flows and surges by employing an "energy line" concept (Fig. 1.17) derived by analogy to rock-fall debris streams (Hsu, 1975), which are dominantly gravity-driven flows. The maximum distance of runout is computed as the loci of points at which the potential energy surface of the flow intersects the topographic surface. The velocity of the flow at any increment (i) along its flow path [v(i)] is simply modeled as its gravitational potential velocity path: v(i) = [2gD h(i)]1/2 , where D h(i) = height of the energy surface above the local topography; in general, this value is initially determined by height above the vent from which the pyroclastic flow collapses. For directed blasts (for example, Hoblitt et al ., 1981), the initial velocity [v(0)] can be taken as a calculated gas-dynamic velocity such as the blast's sound speed. The flow accelerates with incremental runout distance:
for which q (i) = the local slope and µh = the tangent of the energy surface slope (qe ), called the Heim coefficient (Heim, 1932). This number can vary from 0.06, for highly mobile, large pyroclastic flows, to 0.74, for small pyroclastic flows with low mobility (Sheridan, 1979). The flow accelerates and decelerates depending upon the local slope, in such a way that it flows over a total runout distance (Lf ) to where its velocity v(i) = 0; v(i) = [vo + 2a(i)Le (i)]1/2 , where Le (i) is measured from topographic maps and t(i) = 2Le (i)/v(i)].
Fig. 1.12
Schematic of an idealized volcanic eruptive system.
Although analytical solutions for subsurface
flow of magma and volatiles can be made,
the exact physical conditions of this flow are
unknown, and this lack of information limits
the calculation of mass and energy transport
within the erupted jet and plume.
(Adapted from Wilson et al ., 1980.)
Fig. 1.13
Clast trajectories from the umbrella region of a Plinian eruption column; clast sizes
are given in centimeters. Note that the dispersal is greater for the 35-km-high
column than for the 21-km-high column.
(Adapted from Carey and Sparks, 1986.)
Pyroclastic Surge
Relatively thin bedding (generally less than a decimeter), and a multiplicity of bedforms distinguish the deposits of pyroclastic surges (Fisher and Waters, 1970; Wohletz and Sheridan, 1979). These textural features are thought to indicate unsteady flow and rapid variations in particle-to-gas volume ratios—flow conditions that are especially prevalent during eruptive blasts such as those that may occur during the initial moments of Plinian eruption (Kieffer, 1981; Wohletz et al ., 1984) and explosive hydrovolcanic activity (Waters and Fisher, 1971).
Kieffer (1984b) showed that some volcanic blasts have a jet structure when they emanate from the vent orifice. The conditions of the jet can be initially supersonic and will vary with decompression of the magma reservoir. As Kieffer (1977) showed, the sound speed of multiphased fluids (cs ), such as steam loaded with solid particles found in volcanic columns, can be substantially less than that of the constituent phases (Marble, 1970). The sound speed may be several tens to several hundreds of meters per second for steam and tephra mixtures. Because observed velocities of volcanic ejecta are in the range of 100 to 500 m/s, their flow is internally supersonic and the effects of gas compressibility are important. The Bernoulli Eq. (1-3) can be written to show the effect of Mach number (M = u/cs ):
in which po = the stagnation pressure (the pressure of the erupting mixture at zero velocity; for example, the chamber overpressure), ps = the static pressure, and g , the isentropic exponent (ratio of heat capacities at constant pressure and constant volume), expresses the degree to which the erupting mixture approaches isothermal expansion (g = 1.0). In contrast to the incompressible Bernoulli Eq. (1-3), in which the pressure is a function of velocity only, the compressible form shows that pressure is also a function of thermodynamic parameters. For eruption columns modeled by incompressible equations, the pressure along the axis of the column is nearly atmospheric, but for columns erupted as supersonic jets, the effects of compressibility cause pressure and density to vary by large factors along the column's axis.
To understand flow conditions for surge-producing blasts, it is necessary to solve non-linear forms of the equations of motion. In simplified form (Kieffer, 1984b), these equations express
where r = density,


The above discussion of important quantitative models includes those that have had wide applications in recent years and are frequently cited. With improved modeling approaches and close development of theory in conjunction with field observation, it will be possible to use field measurements to constrain eruptive mechanisms and subsurface conditions that are needed to understand the thermal regime and hydrothermal
Fig. 1.14
Plots of maximum clast isopleths show the
effect of crosswind velocities (v) of 30, 20,
and 10 m/s on a 28-km-high eruption column.
The isopleth contours are for clast diameters (in
centimeters) and clast densities of 2500 kg/m3 .
(Adapted from Carey and Sparks, 1986.)
systems associated with volcanoes. Progress towards these latter goals has been greatly aided by the development of a hydrovolcanism theory that links quantitative models of explosive eruption with the hydrological character of the volcano. Through this theory, both the heat resource and water necessary for a geothermal system can be simply assessed by characterization of explosive eruption products.
Hydrovolcanism
Hydrovolcanism is a broad term that encompasses the role of external (nonmagmatic) water in volcanic activity; synonyms include phreatomagmatism and hydromagmatism . This topic may have its roots in the 18th Century Neptunists' theory about the origin of basaltic rocks in oceans (which was later formalized by Abraham Werner). After the eruption of Krakatau in 1883, world attention was focused on the dynamic potential of oceanic volcanism (Verbeek, 1885). Because water plays such a fundamental role in geothermal systems, we will briefly describe some research efforts that have unraveled the complexities of water/magma interactions in volcanic settings. This research has led to the development of systematics for inferring the existence of external water in volcanic areas. Such systematics concentrate on the interpretation of volcanic landforms and tephra deposits, which is viewed as a first step toward finding areas in which both a heat source and water exist. The study and characterization of hydrovolcanic features is chiefly used to make quick estimates of the abundance of water in a hydrothermal system. Detailed studies of water/magma interaction constrain subsurface conditions that have evolved within a geothermal system; for example, depth and lithology of aquifers and permeable formations, temperature of hydrothermal alteration, and spatial and temporal variations in subsurface hydrothermal behavior.
Fig. 1.15
Velocity/height profiles for the lower part of a Plinian eruption column. Calculated by the method
proposed by Wilson (1976), the plots show consecutively the effect of (a) variable water content
(n = 1.5, 2, 3, and 10 wt%), with a constant initial velocity of 400 m/s, and a constant vent radius
(rv ) of 200 m, (b) variable initial velocity with n = 3.0 wt% and rv = 200 m, and (c) variable vent
radius (rv = 200, 400, and 600 m) with constant initial velocity and water content (n = 3.0 wt%).
(Adapted from Sparks et al ., 1978.)
A host of natural phenomena are produced by the interaction of magma or magmatic heat with an external source of water. Because the earth's crust is, in general, saturated with water, most volcanic fields have at least one feature produced by hydrovolcanic phenomena. Most widely recognized are phreatomagmatic and phreatic explosions (see Appendix G for definitions). Many hydrovolcanic phenomena, such as the gradual fracturing of country rock around magma intrusions and the alteration of rocks in hydrothermal systems are neither explosive nor readily observable. In their review of hydrovolcanism, Sheridan and Wohletz (1983a) discuss various aspects of research, including
· geologic environments where systems occur,
· the range of physical phenomena,
· the wide variety of classical eruption types and landforms,
· experimental modeling,
· petrography of hydrovolcanic products,
· textural analysis and indicators of water abundance in deposits, and
· hydrovolcanic cycles.
During recent years, hydrovolcanism has developed as a field theory that applies to a range of physical as well as chemical processes (for example, magma differentiation by fluid and vapor transport, dynamic magma alteration during eruption, and contamination of magma bodies by external water). The brief review included in this chapter serves as an introduction to more detailed considerations of hydrovolcanism and geothermal energy that are provided in later chapters.
Fig. 1.16
Prediction of column collapse as a function of (a) increasing vent radius, (b) decreasing exsolved
gas content and increasing vent radius, and (c) decreasing gas content with constant vent radius.
These scenarios can be used to interpret emplacement of Plinian falls and pyroclastic flows
under changing eruption conditions.
(Adapted from Wilson et al ., 1980.)
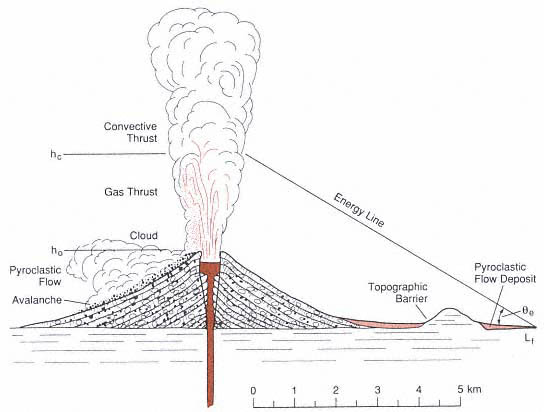
Fig. 1.17
Illustration of the "energy-line" concept for a Plinian eruption from a hypothetical composite cone.
The gas and convective thrust regions of the eruption column (Wilson, 1976; Sparks et al ., 1978)
are shown with a pyroclastic flow that is initiated by collapse near the top of the gas thrust
region (hc ) with the vent at a height of h(0). The initial potential velocity of the pyroclastic flow is
constrained by v(0) = [2gD h(0)]1/2 , where D h(0) = hc - ho . Flow acceleration a(i) and runout are
a function of the local topographic slope [q (i)] and the Heim coefficient (µh ) shown by Eq. (1-17).
The general slope of the energy line (qe ) is given by arctan (hc /Lf ) for which Lf = the distance from
the vent where v(i) vanishes (that is, where the energy line intersects the topographic surface).
(Adapted from Sheridan, 1979.)
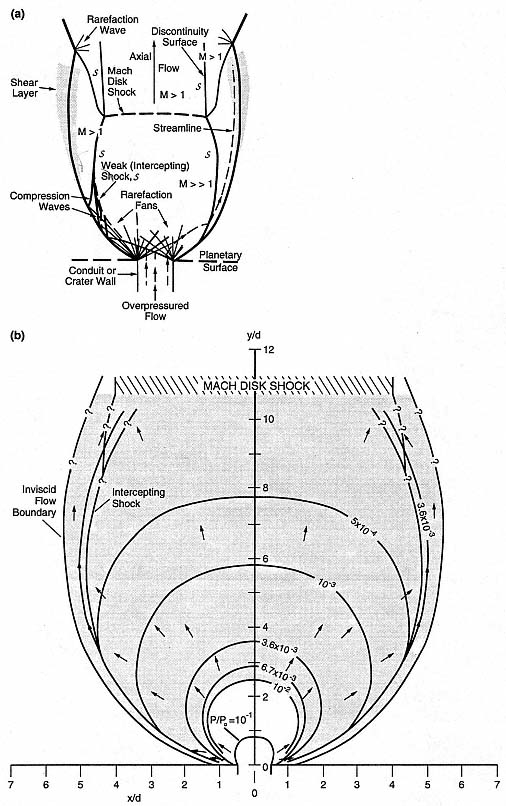
Fig. 1.18
Schematic of (a) an idealized overpressured jet and (b) the jet structure calculated for
conditions of supersonic flow [overpressure of 12.5 MPa; Mach number (M) = 1.02] as
they occurred during the lateral blast and pyroclastic surge of Mount St. Helens on
May 18, 1980. Dimensions x and y are scaled to vent diameter (d @ 0.5 km).
An overpressured jet rapidly expands through rarefaction waves [lines that extend from
the conduit vent sides in (a)] that form a rarefaction fan. As the fluid expands, its atmospheric
boundary initially diverges from axial flow, giving the jet a flaring structure. With substantial
overpressure, the jet may overexpand, developing a subatmospheric pressure zone in the
center of the flow [shaded zone in (b)], which allows the atmosphere to cause downstream
constriction of the jet. Reflections of rarefaction waves from the atmospheric boundaries of
the jet form compression waves that coalesce into weak (intercepting) shocks, which in turn
coalesce downstream to set up a Mach disk shock. Zones of supersonic and subsonic flow are
designated by Mach number. Across the intercepting shocks, the flow velocities decrease,
whereas pressure increases and streamlines (dashed lines with arrows) are deflected.
The supersonic area of the jet, upstream from the Mach disk, corresponds approximately to
the zone of directed blast devastation and pyroclastic surge deposits.
Environments of Hydrovolcanism
During its ascent to the surface, magma commonly encounters groundwater; connate water; marine, fluvial, or lacustrine water; ice; or rain water. The subaqueous environment includes all activity beneath a standing body of water (Kokelaar, 1986); products of this activity have been called subaquatic (Sigvaldason, 1968), aquagene (Carlisle, 1963), hyaloclastite (for deep marine; Bonatti, 1976), hyalotuff (for shallow marine; Honnorez and Kirst, 1975), and littoral (Wentworth, 1938). Volcanism that heats groundwater to produce steam explosions that do not eject juvenile magma fragments is called phreatic (Ollier, 1974) or hydrothermal (Muffler et al ., 1971; Nairn and Solia, 1980). Subglacial volcanism (Noe-Nygaard, 1940) is noted by its products, including massive floods (jökullaups ), table mountains (stapi ), and ridges (mobergs ).
The wide variety of hydrovolcanic phenomena underscores the fact that interaction between water and magma or magmatic heat should be expected in any volcanic setting. One long-held theory suggests that the depth below surface at which dynamic, water/magma interaction is possible is limited by the critical pressure of water or water-rich fluids, and that above this pressure, the phase change from liquid to gas upon heating does not involve large-volume changes (Lorenz, 1986). Accordingly, depths of 0.8 to 2.2 km were considered limits to explosive magma/water interaction. However, more recent work suggests that the critical point need not be a limitation to dynamic interaction and that expansion of water through its two-phase field is not required for rapid volume changes (Wohletz, 1986).
Nature of Hydrovolcanic Phenomena
The physical phenomena of hydrovolcanism belong to a class of well-studied physical processes termed fuel-coolant interactions (FCI). Fig. 1.20 depicts a hypothetical geologic
Fig. 1.19
illustration of the calculated pyroclastic surge
generated during initial moments of Plinian
eruption. (a)An overpressured burst propagates
a bow shock into the atmosphere ahead of
lithic-rich ash as a rarefaction wave recedes
into the magma reservoir. (b and c) Reflected
rarefactions from the reservoir and flow margins
form weak shocks that accelerate ash in surges.
Together, these phenomena constitute a blast
wave that precedes (d) the flow of
juvenile ash from the vent.
(Adapted from Wohletz et al ., 1984).
system in which magma (fuel) explosively interacts with water-saturated sediments (coolant). This process occurs in stages of (a) initial contact and steam-film development, (b) coarse mixing of magma and water or water-rich rock, (c) vapor expansion and flow, and finally (d) explosion and fine fragmentation of the magma. The process does not necessarily evolve through all these stages and may be arrested, for instance, before mixing or explosion.
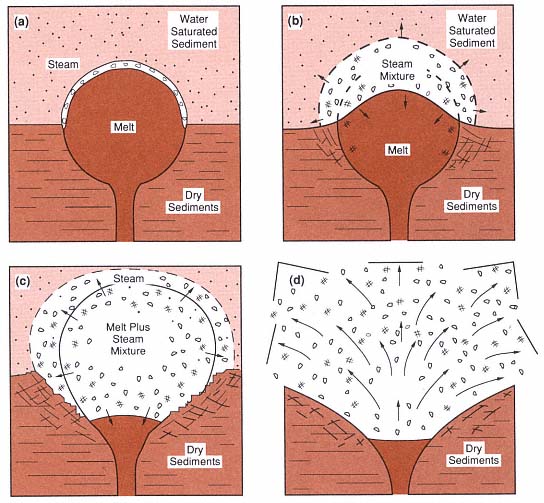
Fig. 1.20
Hypothetical setting of subsurface hydrovolcanic activity, showing (a) initial contact of magma with
water-saturated sediments, (b) vapor film growth, (c) mixing of magma with the sediments, and
(d) expansion of the high-pressure steam in an explosion.
(Adapted from Sheridan and Wohletz, 1983a.)
Much of our theoretical-understanding of hydrovolcanism has developed from laboratory experiments (for example, Wohletz and McQueen, 1984). This approach has made it possible to quantify some controlling parameters by using field and laboratory measurements of hydrovolcanic products. Figure 1.21 shows results from early experiments (Sheridan and Wohletz, 1983a), in which the mass ratio of water and magma (thermite analog) interacted and confining pressure controlled the explosive efficiency of the system.
The thermodynamics of heat transfer is also a significant aspect of hydrovolcanic systems and their physical and chemical effects. The mechanical work produced by interaction of magma with external water is partitioned into many possible modes, including fragmentation of the magma and country rock; excavation of a crater; dispersal of tephra; seismic and acoustic perturbations; and chemical processes such as solution and precipitation, mass diffusion, and magma quenching and crystallization.
Fig. 1.21
Some results of experimental studies (indicated by number) by Wohletz and McQueen (1984)
showing explosive efficiency as a function of water-to-magma mass ratio and confining pressure.
Note the apparent maximum near 0.5 and the increased explosivity of high-confinement
pressure tests. Explosive interaction occurred at 5200 psi (~350 bars) confining pressure,
which is well above the previously assumed limit at water's critical pressure.
This work, D Wsys , is the sum of changes in kinetic energy (D Ek ), potential energy (D Ep ), and volume-change work (pD Vsys ), which is given by
There are several ways by which to evaluate the above expression, but one of the most direct methods is to estimate the change in the internal energy of the water/magma mixture (D Umix ); by definition D Wsysº -D Umix , where

and m = mass, U = internal energy, and subscripts w and m denote water and magma, respectively. Wohletz (1986) demonstrated a method for evaluating Eq. (1-23) that requires data from extended steam tables (Burnham et al ., 1969; Haar et al ., 1984). Further consideration of the mixing and explosion stage (Wohletz, 1986) yields information on particle velocities and sizes. Heiken et al . (1988) extended these calculations to explain country rock fracture by hydrovolcanic processes.
Experimental investigations of water/magma interactions have displayed a variety of explosive and nonexplosive behaviors that are analogous to natural volcanic activity. These results support observations of hydrovolcanic eruptions in which a wide variety of classical eruption types (for example, Strombolian,
Surtseyan, Vulcanian, and Plinian) have involved external water. There is additional evidence of hydrovolcanism in a variety of landforms that range from small maar/tuffring craters to some large caldera outflow sheets of tephra. Such features as peperites, mud volcanoes, hydrothermal explosion pits, pillow lavas and breccias, and parts of composite cones can also be attributed to hydrovolcanic activity. These eruptive behaviors and resulting landforms are, in a general fashion, related to the degree of water interaction, as is shown in Fig. 1.22.
Hydrovolcanic Products
Hydrovolcanic solid products are generally fragmental and are termed hydroclasts by Fisher and Schmincke (1984), instead of pyroclasts , which refers solely to the fragmental products of magmatic eruption. Hydrovolcanic solid products include tephra, explosion breccia, pillow lava, palagonitic and zeolitic tuff, lahars, blocks and bombs, silica sinter and travertine, and intrusive breccia and tuff. Some of these materials involve posteruptive processes (for example, hydrothermal) in which water interacts with volcanic products.
Petrographic studies of hydrovolcanic products involve determining the grain-size and textures of tephra and the chemical signatures caused by rapid and slow alteration. These data are indicators of the degree and type of water interaction. For example, the grain size of hydroclasts is a function of the mass ratio of interacting water and magma; grain textures are indicative of the type of interaction—passive, explosive, extensive, or transient. Field characterization of hydroclastic products focuses on (a) analysis of various ejecta deposit characteristics, including textural analysis of bedforms, lithification, and deposit thickness vs distance from the vent, and (b) correlation of these observations with vent type (for example, composite cone, tuff ring, or caldera).
A correlation can be made between the median grain diameters of hydrovolcanic products and the water/magma mass ratio (Fig. 1.23); this correlation was developed from both experimental and field applications. In general, hydrovolcanic tephra are distinguishable from magmatic tephra by their much finer grain size. Microscopic examination of grain shapes and textures also reveals hydrovolcanic features (Fig. 1.24). Quantitative analyses of these features can document the relative importance of hydrovolcanic (wet) and magmatic (dry) mechanisms in samples from deposits of mixed origins. Hydrovolcanic grain textures are also indicative of the type of water/magma interaction (for example, wet vs dry; Wohletz, 1983).
Hydrovolcanic Cycles and Geothermal Energy
Hydrovolcanic phenomena occur in regular patterns at some volcanoes and thus can assist in defining cycles that in turn are useful in both predictions of future activity and estimates of subsurface hydrological conditions. The eruptive cycles portrayed in Fig. 1.25, for example, show the changing availability of groundwater during periods of activity at several volcanoes. Cycles can be documented by careful field and laboratory analyses of volcanic products in which the abundance of erupted steam and its temperature are constrained by textural indicators of grain cohesion, deposit mobility as a function of moisture abundance, and degree of clast alteration. Cycles are characterized as "wet" when the volcanic products indicate an increase of water during the eruptions; "dry" cycles produce tephra that indicate decreasing water abundance throughout the eruption. The nature of these water indicators also demonstrates whether the erupted steam is saturated (wet) or super-heated (dry). As a general rule, locations that show wet cycles might be better candidates for geothermal exploration because
Fig. 1.22
Relationship of eruptive phenomena, deposit type, and landform to water-to-magma interaction ratio.
(Adapted from Sheridan and Wohletz, 1983a.)
Fig. 1.23
Correlation of deposit texture and grain size to water-to-magma ratio.
(Adapted from Frazzetta et al., 1983 and Sheridan and Wohletz, 1983a.)
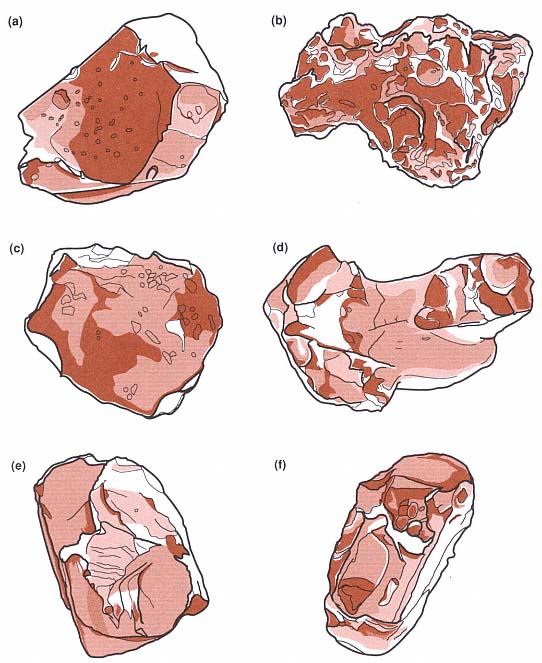
Fig. 1.24
Sketches of pyroclast textures resulting from hydrovolcanism. These textures include
(a) a characteristic blocky and equant glass shard, (b) a vesicular grain shard with cleaved vesicle
surfaces, (c) a platy shard, (d) a drop-like or fused shard, (e) a blocky crystal with conchoidal fracture
surfaces, and (f) a perfect crystal with layer of vesicular glass.
(Adapted from Sheridan and Wohletz, 1983a.)
they prove that water is sufficiently abundant in the volcanic system to quench the magma to water-vaporization temperatures. When estimating the volume of erupted hydroclastic products, this general rule constrains the volume of water involved in the eruptions and thus provides a measure of water abundance in the volcanic system.
Funiciello et al . (1976) pointed out the correlation between geothermal localities and phreatomagmatic volcanoes in Italy, especially those showing wet cycles. In addition, these authors demonstrated how the study of phreatomagmatic products helps locate and characterize a geothermal reservoir with respect to its lithology and fracture permeability, topics that Heiken et al . (1988) discussed in further detail. These studies provide an excellent background for our discussion of hydrovolcanism in Chapter 2.
Fig. 1.25
Various cycles of hydrovolcanism displayed by several type of studied volcanoes. Temporal
variations of water-to-magma mass ratios are shown for (1) Crater Elegante, Mexico;
(2) Kilbourne Hole, New Mexico; (3) Peridot Mesa, Arizona; (4) Taal volcano, Philippines;
(5) Ubehebe crater, California; (6) Zuni Salt Lake, New Mexico; (7) Cerro Colorado, Mexico;
(8) Diamond Head, Hawaii; (9) Koko Crater, Hawaii; (10) Pavant Butte, Utah; and (11) Surtsey,
Iceland. These cycles illustrate general trends (see Sheridan and Wohletz, 1983a, Fig. 5), including
wet to dry (well demonstrated by Vulcano in the Aeolian Islands, Italy) and dry to wet
(activity characteristic of Vesuvius). Some volcanoes show reversals in cyclic activity
(7, 9, and 10 here are tuff cone structures), whereas repeated cycles between dry (Strombolian)
and wet (Surtseyan) occur at others (5).
(Adapted from Wohletz and Sheridan, 1983a.)