4—
San Onofre and Camp Pendleton Area
Oceanside Littoral Cell
Investigators have recognized a series of littoral cells along southern California (Emery 1960:27; Inman and Chamberlain 1960). These cells are based on general southerly drift of sediment, largely derived from rivers, and the entrapment of this sediment by submarine canyons which carry it out to sea (fig. 10) and by points of land that jut out perpendicular to the coast. The Oceanside Littoral Cell includes the area from Dana Point to La Jolla (fig. 11). This cell may be further subdivided at Carlsbad Submarine Canyon, although this generally was not recognized in the past.
The Faulted Coast at San Onofre and the Nuclear Power Plant
San Onofre State Park and Camp Pendleton are located in the north central portion of the Oceanside Littoral cell (fig. 12). A general idea of the character of the area is shown in figure 13, a photo taken when only the first building phase
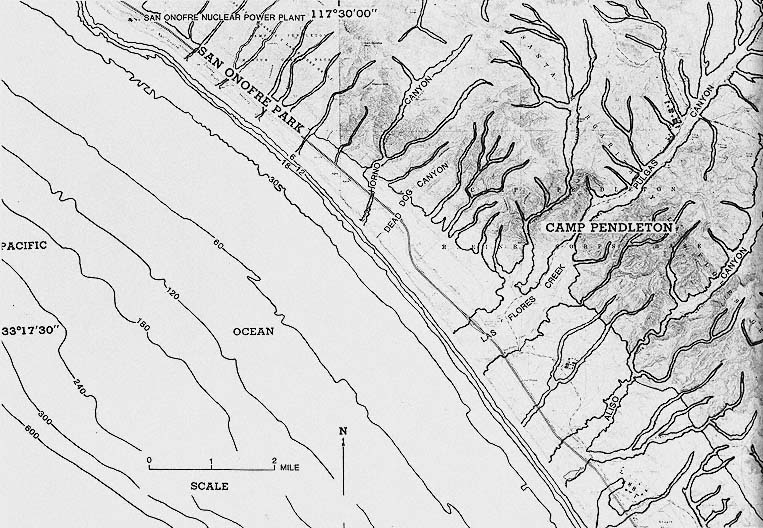
Figure 12
Location map of San Onofre State Park and Camp Pendleton.
NOTE: ocean bottom contours are in feet on this and other maps in the book.
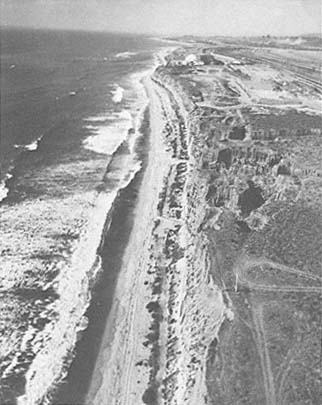
Figure 13
Oblique aerial view looking northwest at San Onofre Nuclear
Power Plant, located directly north of Camp Pendleton, 1970.
Since 1970, two additional units (nos. 2 and 3) have been built
at this nuclear power plant.
Photo : California Coastal Commission.
of the nuclear plant had been completed. The power plant is located on the coastal terrace, which is underlain by Miocene marine rock capped by Pleistocene marine and nonmarine sediments. These Pleistocene sediments are essentially horizontal and are easily eroded from the bluff face and along the canyons.
Approximately 80 percent of the cliffs between the power plant and Target Canyon six miles to the south, on Camp Pendleton, consist of landslides. The Cristianitos Fault is a major structural feature of the region and extends to within about five miles of the construction (not begun at the time of fig. 13) on the seaward side of the plant site. There is considerable difference of opinion among geologists as to the stability of the region relative to recent faulting (Converse, Davis and Assoc. 1970; Western Geophysical Co. of Amer. 1972; Fugro 1974; Hunt and Hawkins 1975; Ehlig 1977a , 1977b ; Fugro 1977; Woodward-Clyde Consultants 1978; Berggreen 1979; Greene et al. 1979; Legg and Kennedy 1979; Greene, Clarke, and Seekins 1980; Green and Kennedy 1981).
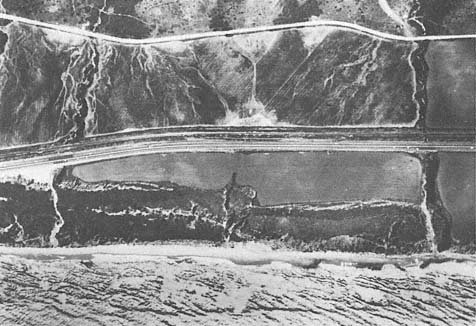
Figure 14
Vertical aerial view of the landslide of 1941 along the cliffs at Camp Pendleton, taken in 1953.
Photo : U. S. Dept. of Agriculture.
Nature of Coastal Cliffs and Canyon Erosion
Early studies of the area conducted by the U. S. Coast and Geodetic Survey (1889a ) concluded that the bluffs eroded during each storm. They also noted that beaches from Los Angeles almost to San Diego were sufficiently wide and continuous to be traveled by horse-drawn vehicles.
The U. S. Army Corps of Engineers (Newton 1960) found that all triangulation monuments set out in 1934 were recoverable in 1958, suggesting that erosion during that period was slight. There were, however, only a few monuments, and they were apparently located outside the landslide zone. Thus a conclusion that there was minimal erosion is not well justified. Actually, there was one major landslide and considerable canyon cutting and bluff-face sloughing. Landslides appear to be directly related to intense sediment saturation and large storm swells. These conditions occurred only during the two wet
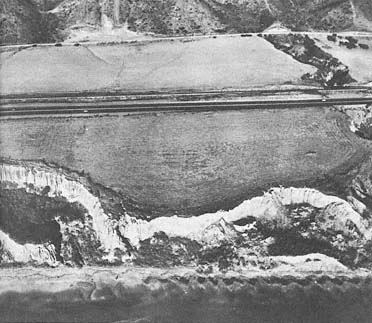
Figure 15a
Oblique aerial view along the bluff at San Onofre State Park, 1954.
Photo : U. S. Navy.
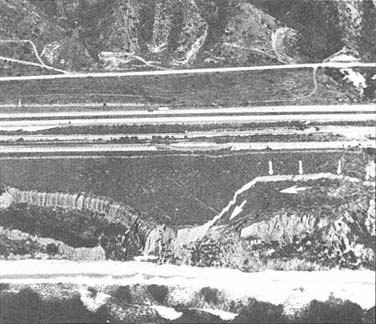
Figure 15b
February 1980 oblique aerial photo showing a landslide measuring 700
feet long by 300–320 feet wide, which occurred in the winter of 1978.
The small arrows show the direction of movement of landslide debris
toward the beach.
Photo : U. S. Navy.
years of 1941 and 1978 (Kuhn, Baker, and Campen 1980). The 1941 landslide measured 1,700 feet in length and 350 feet in width and was along a seaward-dipping plane (fig. 14).
More recently, in February 1978, a landslide measuring approximately 700 feet long by 320 feet wide occurred (figs. 15a and 15b ). The slide apparently was initiated by heavy rain which fell in January 1978. Since the slide, water has ponded on the head of the slump and produced a landward tilting of the bedrock, as shown by the only exposure at the lower end of the block, which dips into the slope. The scarp on the lateral margin on the upper part of the slide is
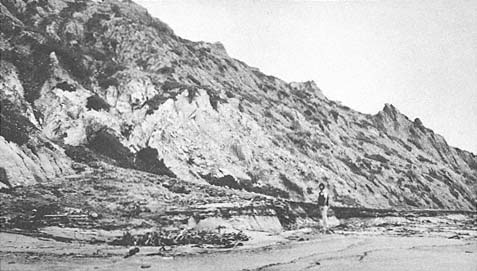
Figure 16
February 1980 view of the debris fan contributing sedimentary material directly to the beach.
Photo : G. Kuhn.
steep enough that slump blocks separate and move on the outer fringe of the main slide. Landslide debris continues to feed the beach as the toe is removed by wave action. Debris fans form in front of small gullies after every storm (fig. 16).
Accelerated Erosion Caused by Man
Since 1885 normal erosion along all drainage avenues has been drastically altered by man. Railroad trestles were built across canyons as early as 1885, but they did not alter the drainage patterns as far as we can tell. The construction of Highway 101, from 1912 to 1918, first altered the natural drainage patterns with the installation of culverts under the highway to channel surface runoff. In the wet years that followed, gully erosion accelerated where culverts concentrated water flow. In the early 1960s, still larger drains were installed under the new Interstate 5. These drains concentrated surface runoff from numerous drainage avenues, channeling it parallel to the highway and then west, under the highway and railroad tracks. There were no severe wet years following the completion of Interstate 5 until 1978, when rainfall was above average and was more concentrated than usual from January to April, and headward erosion along the altered drainage avenues greatly accelerated. The following are some of the
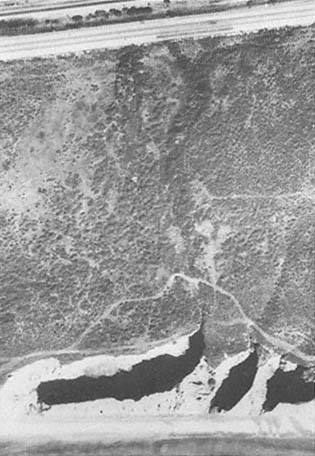
Figure 17a
Vertical photo of the canyon along the bluffs at San Onofre
State Park, 1969. The arrow points to the canyon head.
Photo : U. S. Navy.
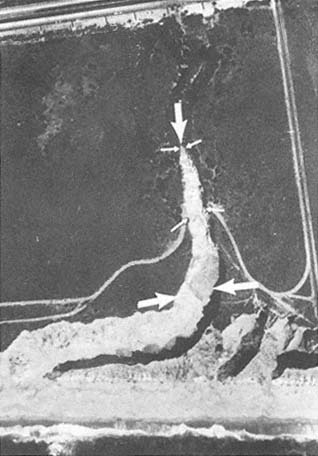
Figure 17b
March 1980 vertical aerial photo showing the development of
a 460-foot canyon perpendicular to the shoreline. It was
extended 235 feet on 20 February 1980 alone.
Photo : U. S. Navy.
more drastic results of this engineering practice.
At Horno Canyon the southbound lanes of old 101 collapsed, leaving a seventy-five-foot deep scarp. At one location, no canyon with an axis perpendicular to the shoreline existed prior to the 1969 storms (fig. 17a ). Sometime between 1968 and 1976, a new canyon was cut perpendicular to the shoreline, about 60 feet headward. Then in January and February 1978 approximately 160 feet of headward erosion occurred, and on February 20, 1980 alone, the canyon eroded another 235 feet landward; this new canyon was 50 to 100 feet deep and 60 to 90 feet wide (figs. 17b and 17c ).
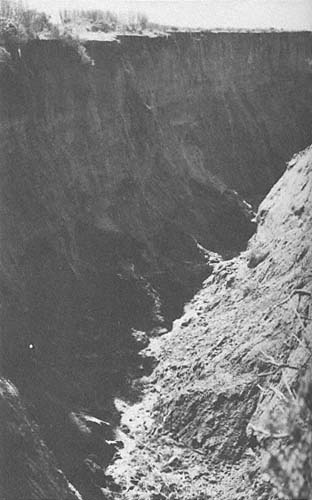
Figure 17c
February 1980 view of the canyon cut into the unconsolidated
colluvial bluff forming terrace deposits at San Onofre State
Park. The evening after the canyon was cut, a park ranger
nearly drove his jeep into the new canyon just before
dark, since it had not been there the previous night.
Photo : G. Kuhn.
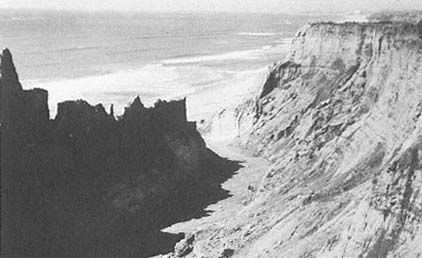
Figure 18
January 1983 view looking down the newly formed canyon, showing how the
sand from the offshore bars has moved onshore to form a wide, new beach.
Dead Dog Canyon, south of Horno Canyon on Camp Pendleton, eroded approximately 560 feet headward between 1932 and 1977. During a two-week period in January and February 1978, this same canyon eroded another 100 feet, and approximately 100 feet more in February 1980. These are just two examples of man-induced erosion which have occurred during the wet years.
Bar System Formed by Rapid Canyon Cutting and Landslides
Prior to 1978 the beaches in this area varied in width from 40 to 60 feet, with few sandbars offshore. This changed in 1978, however, when stormy weather caused extensive erosion of the bluffs and canyons, which in turn provided sediment that widened the beach by at least 40 feet and caused sandbars to form offshore. There were more storms in 1980, and eight to ten bars parallel to the shore were observed afterward. This source of sediment had not been recognized previously, nor had it figured into the sedimentary budget of this part of the littoral cell. Since at least 1950, the predominant longshore transport direction had been from north to south. Had this continued to be the case, large quantities of sediment would have been deposited on the beach in Oceanside and to the south, but since 1980 the net longshore drift has been virtually balanced (Seymore 1980–1982). After the very stormy period from January through March 1983, the beaches along this fourteen-mile stretch of coast were markedly widened and presently vary from 60 to 100 feet wide. It appears that sediment derived from erosion of bluffs and canyons, and landslides between 1978 and 1982 moved back onshore in 1983 (fig. 18).
Figure 19
Location map of Santa Margarita River south through Oceanside and Carlsbad.
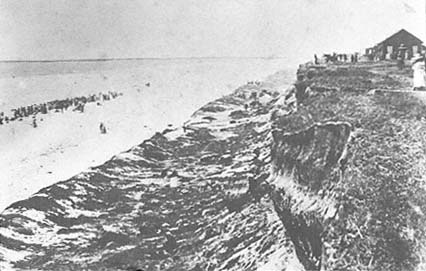
Figure 20
Summer 1885, photo looking north along the bluffs at Oceanside with the wide
beach below. Note the extensive landslide material fronting the cliffs, showing
a predominance of subaerial erosion and a lack of wave erosion.
Photo : SIO Archives, 4 July 1885.