Livestock Prices and Rents
Livestock would seem to have been a different matter. The estate inventories assure us that many estates were equipped to run livestock, and Kent and others have supposed that herding was an important generator of income for many estates, including especially those of Group I. It is, however, difficult to test for a connection between livestock prices and rents. There can be no doubt that the majority of the estates'


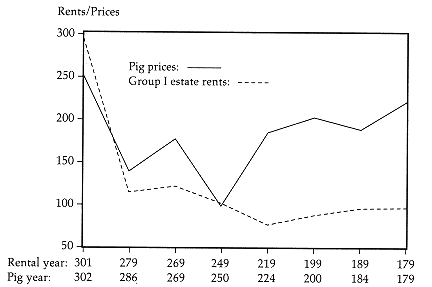
Figure 6.6.
Correlation of Pig Prices with Group I Estate Rents, 301-179 B.C.
Yet pigs were surely raised on at least some estates (see chapter 5), and although over the whole period of independence, pig prices do no better than firewood as predictors of rents, they may have left a trace in the rents of Group I estates. Unlike the estates of Group II, these show a slight but definite rise in rent in the later third and second centuries. This period after ca. 220 B.C. is exactly the time when mean annual pig prices (following firewood) climbed to a new and permanently higher level (fig. 6.6). Although it is impossible to be sure, it may be that the renters of these estates, which were devoid of vines and had previously been devoted largely to cereal culture, began, in response to the rising price of pigs, to run more hogs, and thus to reckon the value of these enterprises in part in terms of pig prices. If this is right, it points to yet another shift in the economy of Delos in the late third century, to which I shall return in chapter 7.[18]
I cannot leave this topic without discussing one other issue, and that is the character of Phytalia, an estate that was regarded as an orchard until the recent join of ID 452 and 467 provided the first inventory for it, showing that it was devoid of any capital equipment at all.[19] Its rents show no
[18] See the somewhat similar view expressed at Isager-Skydsgaard, 196–98.
[19] W. Déonna, La Vie privée des Déliens (Paris, 1948), 96, and BCH 70 (1946): 160; Kent, 254 n. 25; Vial, 323 (a jardin). For the join, see n. 9; for the inventory, see II. 24–25.

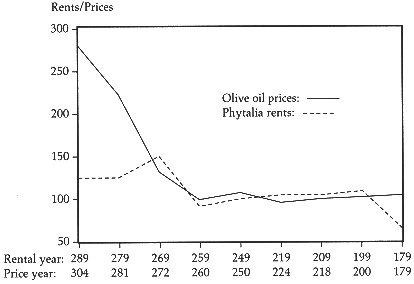
Figure 6.7.
Olive Oil Prices and Rents for Phytalia, 290-179 B.C.
important correlation with barley prices and a correlation of about 40 percent with oil prices (fig. 6.7, table 6.8). The absence of any correlation with barley prices makes it very unlikely that Phytalia was, as Brunet suggests,

The results of this section are very important, for despite the few data points on which they rest, they are remarkably consistent: the rents fetched by agricultural land on Delos were linked to and in part determined by the price levels of important agricultural commodities. This linkage expressed itself most strongly in the estates of Groups I and IIC, and to a lesser extent Group IIB, which had no, or relatively few, vines. Barley culture provided the direct connection, since these estates in fact produced barley. The tie with olive oil, at first sight surprising, can probably be explained by the
[20] Brunet, 146; cf. BCH 114 (1990): 679.
| |||||||||||||||||||||||||||||||||||||||||||||
role oil played on land in private possession on Delos and its nearest neighbors.
These two basic staples, barley and olive oil, which were locally produced and locally consumed, were thus closely linked in the local economy, and rents were tied to them. This sheds welcome light on a very important aspect of the local economy. In contrast, growing grapes and running livestock seem to have taken place in a different sphere. Livestock have left surprisingly little impact in our data, although the picture might be quite different if we had a set of prices for sheep or goats comparable to those for pigs. Viticulture, of course, was aimed mostly at wine production, and we shall have to test Kent's idea that declining wine prices after 250 B.C. depressed the values of Group II estates. Whether we can say a "universal price-setting market" for wine existed will depend in part on the results of that investigation.
Rent History until 290 B.C. and Kent's Wine Hypothesis
Two important phenomena in the rent histories of the estates have long been noticed: the drastic collapse of rents in 290 B.C. , and a slower decline after 220 B.C. , which Kent attributes to depressed wine prices.[21] Both of these phenomena can be confirmed by statistical analysis, which
[21] Kent, 302, Larsen, 401–7, Heichelheim, Wirt. Schw., 82–83, Gustave Glotz, Journal des Savants 11 (1913): 19–20. Kent, 310, 299–301; 309–13.
however also reveals new and important differences among the groups of estates.
The rent history of Group I estates responds very nicely to a model that attributes almost all of the change in their rents to a turnaround in 290 B.C. This model explains fully 72 percent of the variation in rents and indicates an extremely strong response to the watershed; rents decline by almost 106 units (table 6.9). There is, however, no improvement in explanation if the model is modified by adding a dummy variable for the period after 220 B.C. This is an important result, since it seems to confirm Kent's view: these estates without any vines at all are not affected by his proposed decline in wine prices over the second half of the third century.
For Group IIA estates the best model incorporates dummy variables for both 290 B.C. and for Kent's wine factor, taken as a watershed at 220 B.C. This model accounts for fully 88 percent of the variation in rents with good statistics (the Durbin-Watson is marginal but acceptable). It is interesting that the coefficient for 290 B.C. represents a much more modest response than that for Group I estates (table 6.10).
Group IIB estates, which had 1,550-1,000 vines, follow a pattern similar to that of Group IIA estates (table 6.11). Eighty-three percent of their rent variation can be attributed to the two factors, 290 B.C. and Kent's wine hypothesis. The response of rents to the watershed years, however, is rather different from those for the IIA estates. The decline in 290 B.C. amounts to 61 units, or 2.25 times greater than for IIA estates, while the decline in 220 B.C. of 48 units is essentially the same as that for IIA estates.
The same pattern obtains for Group IIC estates (table 6.12). Again, the
| |||||||||||||||||||||||||||||||||||||||||||||
| ||||||||||||||||||||||||||||||||||||||||||||||||||||||
| ||||||||||||||||||||||||||||||||||||||||||||||||||||||
model accounts for 87 percent of the rent variation, and the coefficients that represent the response to each factor are close to those of the Group IIB estates. On the evidence of these results, Groups IIB and IIC clearly belong together. Group IIA estates stand apart in their more moderate response to the change in 290 B.C.
| ||||||||||||||||||||||||||||||||||||||||||||||||||||||