Volcanology and Geothermal Energy
Kenneth Wohletz
Grant Heiken
For our families, who have provided inspiration,
instilled the desire to learn, encouraged us to share our knowledge,
and, along the way, given us love
Table of Contents
- Preface
- Introduction
- Chapter 1— Recent Practical Advances in Volcanology
- Chapter 2— Pyroclastic Rocks as a Tool to Evaluate Geothermal Systems
- Chapter 3— Surface Manifestations of Geothermal Systems
- Chapter 4— Calderas and Their Geothermal Systems
- Chapter 5— Silicic Domes: Heat Flow around Small, Evolved Magma Bodies
- Chapter 6— Geothermal Systems Associated with Basaltic Volcanoes
- Chapter 7— Geothermal Systems in Maturing Composite Cones
- Appendix A— Field Methods in Volcanic Regions
- Appendix B— Volcanic Rock Classifications and Data
- Appendix C— Notation
- Appendix D— Conversion Factors, Steam Properties, and Conversion of Geothermal Heat to Electricity
- Appendix E— Heat Flow (Two-Dimensional Diffusion Code)
- Appendix F— Core and Drill Cuttings: Geothermal Well Logs
- Appendix G— Glossary
- References
- Index
Preface
Los Alamos National Laboratory, with support from the U.S. Department of Energy, has been developing geothermal energy technology for nearly 20 years. The technology and experimental verification concepts developed by the Laboratory's Hot Dry Rock Program have demonstrated tremendous potential for what is now known as heat mining—the creation of a man-made heat-exchange system in hot, fractured rock. This method was developed because much of the Earth's crustal heat resources are found in impermeable rock that is not capable of supporting the hydrothermal system required for a traditional geothermal resource.
Geologists at Los Alamos have contributed to the fundamental aspects of this geothermal energy program since its inception. Because the Laboratory's Hot Dry Rock experimental facility is located near the Valles caldera of the Jemez volcanic field in northern New Mexico, much of our geological research has focused on understanding the ultimate heat source for that experiment: the magma body below the Valles caldera. One of the most complex problems we have studied is how hydrothermal systems develop in calderas and the relationship of these systems to volcanic vents and rock permeability. Research drilling within the Valles caldera and the Long Valley caldera of California has expanded our knowledge of these relationships.
During the past decade, we have applied the experience gained in the Jemez volcanic field to numerous volcanic areas throughout the world to evaluate their geothermal energy resources. This book is a testament of our firm belief that volcanic geothermal systems are uniquely defined by specific combinations of tectonic environment and volcanic structure. In recognition of these conditions, we have attempted to develop a general perspective of such geothermal systems from a volcanological viewpoint. Modern volcanological concepts have not been adequately applied to the numerous geothermal ventures now being developed
throughout the world. With the application of volcanological observations, one can quickly locate the areas within volcanic fields that are most likely to contain hydrothermal systems. In addition, volcanoes and their products may be seen as the initial windows to subsurface conditions such as the thermal regime and lithology; this information can greatly reduce the error involved in locating exploration drill holes and geophysical surveys.
This book is a collation from vast amounts of many individuals' previous work in volcanology and geothermal exploration. The key to our presentation of this earlier work is the development of often unrecognized links between these two fields. In review of many modern volcanological tools and their potential bearing upon geothermal energy exploration, we present numerous case histories of geothermal development in volcanic areas. This approach encourages the reader to begin thinking about volcanoes and geothermal energy in parallel and—we hope—stimulates thought processes that might uncover still more links.
Publication of Volcanology and Geothermal Energy is the result of the dedication and enthusiastic support of numerous individuals. The University of California Press, in conjunction with Los Alamos National Laboratory, fosters creation of books that pass on the knowledge and experience gained in sometimes obscure studies at the Laboratory. We thank Elizabeth Knoll and David Sharp for their roles in this collaboration. The U.S. Department of Energy, through Laboratory Directed Research and Development at Los Alamos, dedicated initial funds for the writing of the book; illustration, design, and editing have been supported by Laboratory Director's funds.
Jody Heiken should by all rights be listed not only as the editor but also as a contributing author. In addition to steadfastly and thoroughly editing the often disparate bits and pieces of text she received from us, she recognized and filled gaps in information, corrected inconsistencies, and discerned technical problems with sound scientific judgement. She also developed and implemented the book design. As authors, we owe the actual completion of the book to her long hours of work. Her firm faith in our knowledge of the subject often bridged the gap between our files of data and creation of the text.
Lynn Phipps of Tech Reps, assisted by Mike Dominguez, showed ingenious creativity in developing the more than 250 illustrations in this book, many of which were adapted from previous publications and required numerous modifications to fit the evolving text and format of the book. She also was responsible for design of the chapter icons and the book cover. Lynn's enthusiasm for this often frustrating work has served as a tremendous inspiration.
Numerous scientific colleagues have enthusiastically supported our work on this book, although we name but a few here. Drs. Richard V. Fisher and Wendell Duffield thoroughly reviewed the book, and much of the information contained in it is attributed to their fruitful careers in volcanology and geothermal energy. Wes Myers, John Whetten, and Wayne Morris provided institutional support and logistics for our studies. Fraser Goff has been an extremely knowledgeable and supportive compatriot in developing our ideas and organizing field work in geothermal areas.
On another level, our wives, Ann and Jody, and our families have happily accompanied and patiently waited with us through years of exploration in a jungle of information and experience, which has required laboratory research and travel to remote geothermal fields. We hope that they also will reap the benefits we have received in completing this work.
Introduction
Geothermal energy is an important and promising alternative energy resource that has shown continual growth throughout this century; regrettably, its fortunes have reflected the variable successes experienced when traditional petroleum exploration techniques are used. Because the world's highest temperature—and perhaps most abundant—geothermal resources are associated with volcanic regions, this book develops a framework for exploration and development of geothermal resources in volcanic areas by linking modern volcanological concepts to aspects of geothermal energy.
We emphasize the importance of volcanic field observations to geothermal exploration and review the OLADE (Latin American Energy Development Organization) approach to geothermal energy exploration. We have integrated quantitative approaches and models that can be used to collect and interpret field and laboratory data. These quantitative approaches have been introduced, in a simplified theoretical framework, to also show some links between volcanology and engineering concepts.
Volcanology has largely been an outgrowth of the larger discipline of geology and, like geology, is mostly a qualitative or "inexact" science. In contrast, much of the supporting science of geothermal energy has evolved from engineering methods that were developed in the petroleum industry; hence, it is intrinsically more quantitative and has a very different technical language. This traditional dichotomy in technological approach has, we believe, hindered progress in both exploration for and developments of geothermal systems in volcanic areas. We practice a strategy that bridges that gap by first synthesizing classical and newly developed models of volcanoes (as well as their hydrothermal systems) and then applying this synthesis to the quantitative and engineering aspects of geothermal energy exploitation. This philosophy has been implicit in the OLADE methodology but has never been described and published in detail.
Because so much of volcanology has direct societal impact—and thus requires measures of certainty, the ability to predict, and inter-disciplinary approaches—volcanological studies have become increasingly quantitative over the last decade or more. For economic minerals and geologic hazards applications, these studies must address such problems as investment security, environmental issues, and municipal safety. Our need for pragmatic approaches to research has spawned new methods in geophysics, mechanical engineering, and geochemistry; these techniques are now woven into the fabric of volcanology and have resulted in an increasingly quantitative discipline. Throughout this book, we attempt to demonstrate how models based upon these approaches can elucidate the complex and uncertain environments of volcanic hydrothermal systems.
In developing the text of this book, we have emphasized the inexactitude of the quantitative or semi-quantitative volcanologic models. Each volcano or volcanic area is complex and presents an individual problem to be solved systematically. Models only serve as a framework to focus and possibly enhance the efficiency of exploration and development. It is for this reason that we use case histories as examples for readers to consider in terms of typical models.
Finally, it is our intention that by addressing issues of volcanology that can be directly applied to engineering problems, it will be possible to better incorporate geologic reasoning into the development of geothermal resources. Through our experience at Los Alamos National Laboratory, where geologists and engineers work closely, we have found that the "cross fertilization" of these disciplines produces seeds of understanding that can grow to strong exploration and development programs, often surmounting scientific and technological barriers that might have otherwise prevented success.
Application of Volcanological Observations to Geothermal Exploration
Our experience in numerous geothermal exploration projects has taught us a fundamental axiom for geothermal exploration in volcanic areas. Many of the complexities and unknown, subsurface characteristics of a volcanic geothermal field can be constrained through logical deduction that is based upon careful field observation, mapping, sample studies, and the integration of related geophysical and hydrogeochemical data.
We believe that many geothermal exploration projects in volcanic areas have suffered from the lack of pertinent volcanological observations and interpretations. So many clues regarding the location and magnitude of geothermal systems are available from the volcanic structure and deposits that one might say detailed interpretation of these observations constitutes a type of "exploration drillhole." Therefore, we stress the need for careful field volcanology during geothermal exploration projects in volcanic areas.
During the last 10 years, the field of volcanology has been growing rapidly; the resulting new observations and ideas are providing us with numerous hypotheses on volcanic structure and processes. In magma genesis, movement, and eruption phenomena, as well as volcanic structure and thermal histories, there have been many new discoveries that have engendered a better understanding of igneous systems and their relationship to high-grade geothermal systems. These hypotheses and discoveries have important geothermal implications when applied to the interpretation of volcanological observations.
Geologists must use what is known about volcanoes, their structure, eruption phenomena, and composition, to reveal necessary information about the heat sources and settings of groundwater—key factors in formation of a hydrothermal system. A basic approach to exploration includes good geological mapping by whatever means is available: topographic maps, aerial photographs, satellite photographs, planetable surveying, tape and brunton traverses, and panoramic viewpoints. Also, systematic descriptions of tephra deposits and rocks are vital, especially for core logs from exploration holes.
In applying volcanological observations, one should integrate the observations (for example, mapping and sample analyses) with other information on surface springs and fumaroles, water chemistry and hydrology, and geophysical surveys, including gravity, electrical resistivity, seismicity, and heat flow. Any of these surveys by itself, without a geologic framework, is almost useless; integrated with good geological surveys, each is valuable. Hydrochemists, geophysicists, reservoir engineers, and geologists must talk to each other and work as teams to successfully develop geothermal resources.
A basic methodology for geothermal exploration in volcanic fields was developed in 1983 by an international team of experts for the Latin American Energy Development Organization (OLADE, 1983). The field approach involves learning everything possible about a volcano or volcanic field, including structure, structural setting, eruption phenomena, composition, and ages of eruptions (see illustration). Using these data, it is possible to establish hypotheses regarding the location and magnitude of hydrothermal resources. Simply put, the volcano and its products supply information normally gathered from the first drillholes and may provide a view of the volcano's geothermal system or systems. Employed in conjunction with hydrogeochemical sampling of hydrothermal waters and gases,
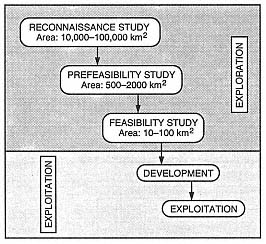
Flow diagram showing steps of the OLADE
methodology for a geothermal project.
the field approach is extremely cost-effective and is the first step toward prescribing the more expensive geophysical surveys and exploration drilling that will be needed. The geological and physical volcanological approach involves the three steps outlined here; these steps are undertaken at the same time as the hydrogeochemical sampling but before geophysical surveys. Later chapters will expand upon these techniques and their application.
Step 1—
Evaluation of Available Information about the Area to Be Studied
In the initial phase of a project, all existing information is collected and evaluated, including:
· topographic and geological maps at large and small scales;
· regional geological syntheses, including stratigraphy, structural geology, and history of volcanism;
· all published and unpublished reports on geology, geochemistry, and geophysics;
· satellite images and aerial photography;
· information on the presence and characteristics of hot springs, fumaroles, and hydrothermal alteration;
· information on drillholes or coreholes from any source, including water well drilling, petroleum drilling, and coring by mining companies;
· published and unpublished geophysical data; and
· information on hydrology and meteorology.
Step 2—
Field and Laboratory Investigations
Following analysis and interpretation of prior work, field and laboratory investigations should be designed to answer specific questions regarding (a) the possible presence of shallow thermal anomalies, (b) regional hydrologic conditions, and (c) the nature of thermal manifestations. In volcanic regions, it is important to focus geological observations on a number of points.
· Identify those areas where there are episodes of recent volcanism. The definition of "recent" varies according to the volume of material erupted because large magma bodies retain heat much longer than small ones do.
· Evaluate the relative quantities of silicic and mafic or intermediate volcanic products.
· Define, on a regional scale, the present relationship between the volcanic structure and the regional tectonic framework.
· Identify phreatic explosion craters.
· Systematically collect samples of all lithologic types for laboratory analysis, including petrographic and chemical analyses.
· Collect lithic clasts (xenoliths) from pyroclastic units for petrographic analysis.
· Determine the absolute ages of representative lithologic units.
· Study (in preliminary form) all possible reservoir and caprock units.
Analysis and interpretation of field and laboratory data at this time will help define principal geothermal areas to be studied in detail and, if appropriate, selected for geophysical surveys and exploratory drilling. Along with results of the regional hydrogeochemical surveys, the preliminary data can be used to determine areas to be evaluated for potential commercial development.
Step 3—
Detailed Field and Laboratory Studies: Geology and Volcanology
Detailed field and laboratory studies begin with (a) interpretation of aerial photography, (b) preliminary identification of faults and volcanic structures, (c) hypotheses concerning the regional volcanotectonic setting, and (d) integration of information from existing maps. Following this work is a detailed field study that comprises the aspects listed here.
(1) A search for thermal anomalies in the upper crust involves mapping and sampling young volcanic eruption sequences, especially rock types indicative of shallow magma bodies. All areas of hydrothermal manifestations, both fossil and active, are mapped and sampled in conjunction with hydrogeochemical sampling. All volcanic structures are mapped, including craters, domes, phreatic craters, and associated faults.
(2) In areas with surface hydrothermal manifestations, potential caprocks are mapped and sampled, and their origin is determined. In volcanic zones, the search for phreatic explosion craters is emphasized.
(3) The extent of potential geothermal reservoirs can be estimated through
· A study of lithic clasts (xenoliths) in pyroclastic deposits; these clasts provide information on the nature of rock units underlying the volcano.
· Identification and mapping of recent faults. This effort is essential because active faults frequently represent zones of fracture permeability.
· Determination of the degree of hydrovolcanic activity responsible for pyroclastic deposits in the volcanic field. This work may identify aquifers beneath the volcano during recent eruptions. These aquifers could be current hydrothermal reservoirs.
(4) In tropical countries where soils form rapidly and outcrops are soon covered by vegetation, geological mapping is considerably more difficult. In these situations, several additional approaches are necessary:
· Landform mapping. These maps are based primarily on the interpretation of aerial photographs and satellite images, especially in young volcanic fields. The interpretations are field checked along road cuts, stream bottoms, and shorelines, as well as in quarries.
· Side-looking airborne radar (SLAR) imagery. Such images are extremely useful in mapping faults and volcanic landforms in tropical areas, although they may be relatively expensive to acquire.
Basic Approach
In this book, we review some important advances in volcanology from the last several decades and show how an understanding of volcanic systems can be applied to geothermal systems. We have drawn considerable background information from volcanological literature and combined it with our own research experience in volcanology, which has been to a large degree in support of geothermal exploration.
This book is organized into seven chapters. The first three chapters review general volcanological principles and aspects of geothermal reservoirs and manifestations. We employ recent volcanological findings, emphasizing the importance of fragmental products of volcanoes (tephra). Chapters four through seven discuss the main types of volcanic fields, including calderas, silicic domes, basaltic volcanoes, and composite cones. As well as exploring the pertinent geological structures and models of their origin, we use known case histories as examples of geothermal exploration and development for each field type.
The seven appendices provide practical background material, including volcanic field and laboratory study techniques, rock classification schemes and data, engineering units and conversions with abbreviated steam table data, a two-dimensional heat flow code for personal computers, logging methods for cores and cuttings, and an extensive glossary of volcanological terms.
Through a review of recent advances in volcanology, geothermal applications of pyroclastic rock studies, and geothermal manifestations, we develop a more quantitative approach than has commonly been used in volcanic fields. We hope this approach stimulates readers to think about how previously studied volcanic geothermal areas might benefit from more quantitative applications.
Chapter 1—
Recent Practical Advances in Volcanology
Quantitative methods for studying volcanoes and their products are gaining importance in the evolving field of volcanology. Using increasingly more precise and accessible laboratory techniques to determine chemical compositions of rocks and minerals, petrologists have developed methodologies to understand the origins and evolution of magma. The constraints on temperature and pressure estimated from chemical data are enhanced by results of geophysical surveys; together, these efforts have led to a better understanding of magma-chamber dimensions and locations. Simultaneously, the development of computer capabilities has allowed volcanologists to systematically quantify field observations that can be numerically modeled by using fluid mechanics. Although these developments are still relatively immature compared to similar work in other scientific fields, the advances constitute a tremendous resource for practical application in geothermal energy exploration.
In this chapter, we briefly review advances in volcanology that we consider to be fundamentally important for understanding geothermal resources:
· documentation and interpretation of chemical zonation in large-volume pyroclastic deposits and consequential implications concerning the nature of magma chambers,
· development of quantitative approaches for describing and understanding eruption dynamics and the emplacement of volcanic products, and
· the hydromagmatic theory of eruption mechanics and its significance in the interpretation of pyroclastic deposits.
Although this list is incomplete if one considers volcanology as a whole, the topics included here are those we have found to be significant for studies of geothermal systems in volcanic areas.
As in many other scientific fields, rapidly changing technology is reflected in the evolving terminology, and we stress this fact because of its importance in the communication of ideas. Definitions of terms are presented in the Glossary (Appendix G). Terms used in quantitative methods are especially vital because of their mathematical roots and because they are widely employed in science and technology. With this concept in mind, it is appropriate to describe briefly the common quantitative approaches taken in volcanology before discussing in more detail the three advances mentioned above.
Quantitative Methodology and Volcanology
The consequence of maps as the fundamental method of data representation is perhaps unique to the science of geology. Volcanology certainly relies heavily upon maps to graphically portray research problems, their geographic locations, physical and chemical trends, and hypothetical arguments. On a map, many types of quantitative data can be portrayed. For example, mapping contours of deposit thickness (isopachs ) or clast diameters (isopleths ) within the deposit is a common technique in tephra deposit studies. The mathematical representation of these contours is a valuable method for locating vent areas and estimating the volume of eruptive products as well as their emplacement mechanism (see Chapter 2).
The first step in analyzing a map-oriented data set—especially if a hypothetical argument is lacking—is statistical analysis of data trends. Examples of geological data trends are discussed extensively by Davis (1973), and specific cases include:
· trend-surface analysis of stratigraphic units and topography,
· rose diagrams of structural fabrics,
· geographic correlation of absolute and relative rock ages,
· areal density of specific surface features, and
· cluster analysis of geochemical data to define major variations.
Following statistical analysis, hypothesis development and testing can be undertaken, and these generally focus upon chemical and physical problems. Several recent text books have employed quantitative approaches in their discussions of volcanology. Williams and McBirney (1979), Araña and Ortiz (1984), and Fisher and Schmincke (1984) are recommended reading for a general background in volcanology.
Statistical Methods
Data correlation and analysis, more than any other quantitative approach, have grown in consequence as a result of enhanced computer techniques for handling statistics and data bases. In both the chemical and physical aspects of volcanology, statistical approaches are vital in the development of quantitative models.
Subsequent analysis of frequency distributions is particularly important in pyroclastic studies because particle-size distributions are indicative of physical processes involved in eruptions—processes such as the eruptive energy and the origin of volatile gases in the magma system. Parameters describing particle sizes have typically been based on the assumption of lognormal distribution, but this assumption might not be plausible and might lead only to empirical interpretations (Wohletz et al ., 1989). Because we discuss tephra grain-size parameters and their interpretation throughout this book,
a complete review of this subject is included in Appendix A.
Data correlation makes it possible to assess underlying physical or chemical controls in cases where independent and dependent variables are hypothesized. Least squares, regression, and Fourier techniques are commonly applied to correlated data. The use of multivariate analysis is an issue of greater controversy, but the method may have significant application in classification schemes (Sheridan and Kortemeier, 1987). The following pages outline some fundamental physical and chemical relationships that directly apply to geothermal systems.
Physical Processes
Energy transfer through the earth's crust (and heat flow in particular) is a basic component of geothermal systems and volcanoes. In general, heat flow is influenced by several processes that sum in the following equation (Shimazu, 1963).
where temporal heat flow (r = density, C = specific heat, T = temperature, and t = time) is equal to the sum of the adiabatic temperature gradient (a = the coefficient of thermal expansion, p = pressure), heat conduction (r = radial distance, kt = the thermal conductivity), radioactive decay heat (Hi = heat liberated by decay of the i th isotope, l i = decay constant), and heat of reaction (Ji = the heat produced or liberated for the ith chemical reaction).* To estimate heat flow for volcanic and geothermal systems, this expression must be altered to include convective heat flow, which can be approximated by replacing in the above equation several elements:
where uconv is the velocity of convection, which can in turn be approximated by a function of Rayleigh number: uconv @ 3(Ra)1/3 , where Ra = (ra gD TD3 )/(dt µ), and µ = viscosity, g = gravitational acceleration, D = a characteristic length of the flow, and dt = kt /(r C).
Studies of mass transfer associated with volcanism generally focus on movement of magma and magmatic volatiles from the magma chamber to the surface of the earth. Two extreme cases of these processes are (a) eruptions that result in effusions of lava, and (b) explosive eruptions in which the expansion of gases determines mass transfer processes. Incompressible approximations of mass and momentum conservation are useful descriptive equations. For passive magma flow in conduits, the Bernoulli equation is
where subscripts denote values measured at two different levels in the conduit or flow system, h1 , h2 , u = velocity, and f h = a term reflecting frictional losses and is a function of conduit or substrate surface roughness and Reynolds number: Re = (r uD)/µ. Where the expansion of volatile phases under conditions of changing pressure and temperature causes both fragmentation of magma into tephra and rapid acceleration of a gas and solid mixture from the vent, it is possible to write the Bernoulli equation to account for changes in gas pressure. Two end-member processes of gas decompression are (a) the adiabatic case in which no heat is exchanged between the gas and solid particles and (b) the isothermal case, in which heat is continuously supplied to the gas from the tephra during decompression. Both cases depend upon the gas weight fraction in the mixture:
where r g = the gas density, r b = the bulk density of the mixture, and r p = the solid particle density. The adiabatic and isothermal cases are respectively:
where g = the gas isentropic exponent (Wilson, 1980).
Various adaptations of Eqs. (1-5) and (1-6) can be applied to different eruptive conditions (for example, Vulcanian, Plinian, and Strombolian) that are discussed in Chapter 2); they are then useful in approximating the basic relationships among gas pressure, temperature, and abundance as well as exit conditions such as ejecta velocity and column height (see the section on explosive eruptions and quantitative models later in this chapter). However, these approximations and calculations yield accurate results only when considered in light of nonlinear relationships like those included in the full set of Navier-Stokes equations written separately for gas and solid phases (Valentine and Wohletz, 1989; Wohletz and Valentine, 1990).
Chemical Processes
During the past decade, volcanic petrologists have made great strides in understanding the complex origins of magma chemistry as revealed by analyses of phenocryst and glassy components of volcanic products. Because these analyses provide abundant quantitative data, mathematical approaches are particularly suited for modeling the origins of chemical signatures.
Magma composition generally evolves with time as a result of (a) initial melting from source rocks, (b) fractional crystallization caused by cooling and the loss of volatile constituents, and (c) comingling with magmas of different composition (Carmichael et al ., 1974). The behavior of chemical species during these three important differentiation processes can be quantitatively modeled by using chemical data provided through bulk and modal analyses in which trace-element behavior is most indicative of the differentiation mechanism (Arth, 1976; Allegre and Minster, 1978).
The Rayleigh equation (Rayleigh, 1896; Gast, 1968; Greenland, 1970) applies to fractional crystallization and predicts the concentration of a particular chemical species remaining in the liquid (c1 ) after crystallization of a specific fraction of crystalline phase when the original species concentration is co :
kd = the Nernst distribution coefficient, which expresses the fraction of the chemical species in the liquid that enters the crystalline phase. F = the fraction of original melt remaining. For cases in which the chemical species enters two or more phases, kd is replaced by Do , the weighted average of solid-liquid partition coefficients of all the phases. If crystallization is incomplete at some value of F, then c1 given by Eq. (1-7) must be multiplied by kd or Do , depending upon the number of phases involved.
For conditions of partial melting, in which the liquid phase remains in equilibrium with the residual solid phases until it is removed (Shaw, 1970), the Berthelot-Nernst equation predicts c1 by
Here P = the bulk partition coefficient for the phases that melt, and F = the fraction of melted material. When only one phase is melted, P = Do .
Fractional crystallization and partial melting result in a logarithmic relationship between species concentration in the solid/liquid phases and the degree of melting or crystallization. When both fractional crystallization and partial melting occur and Do approaches zero, Eqs. (1-7) and (1-8) reduce to c1 = co /F. If one assumes that fractional crystallization occurs when there is equilibrium between the total crystallizing solid and melt, its description takes a form analogous to that of partial melting [Eq. (1-8)].
For situations in which chemical trends are the result of mixing two magmas of different compositions, a mass balance equation (Gast, 1968) predicts the resulting concentration in the magma (cx ) of some species; mm1 , c1 , mm2 , and c2 are the magma mass and species concentration of magma 1 and magma 2, respectively:
In contrast to fractional crystallization and partial melting, the concentration of a chemical species in a mixed magma is linearly dependent on the degree of mixing.
Isotopic tracers are also very useful for determining the origin and evolution of magmas (Taylor, 1971; Friedman and O'Niel, 1977; DePaolo, 1985). As in the case of stable isotopes such as oxygen, the isotopic composition is related to a standard. For oxygen, the heavy-isotope 18 O abundance is expressed
where the subscripts s and smow denote the sample and standard mean ocean water isotopic ratios, respectively. Whereas stable isotopes are considered excellent chemical tracers, radiogenic isotopes are employed in dating techniques and are widely used in geochemistry (Faure, 1977).
Magma Generation, Accumulation and Differentiation in Chambers, and Eruptions
Recent geochemical studies in igneous petrology have focused on the processes of magma generation, evolution, and collection in subsurface reservoirs called magma chambers. Although chemical reactions continue to change the composition of lava and tephra after these materials reach the earth's surface, petrologists traditionally studied only the history of volcanic rocks before their eruption. Major fields of interest have been the tectonic setting and origin of magma, processes of chemical differentiation, and magma-chamber dynamics. Recently, with the advent of powerful computers, heat flow, seismicity, and fluid convective and diffusive processes have been used to develop comprehensive models of magma chambers. Through geochemical analysis, field samples of volcanic products yield vital clues about the parent materials of magmas, the depth of their generation, and the differentiation processes that affected them on their path through the earth's crust.
Tectonic Setting and Origin of Magmas
Because ~95% of all volcanoes occur at plate margins, their locations are consistent with the theory of plate tectonics (Fisher and Schmincke, 1984; Wyllie, 1971), as illustrated by Fig. 1.1. The magma sources of volcanoes that occur in intraplate areas, whether oceanic or continental, are more difficult to explain (Christiansen, 1987). In these cases, hypotheses that involve mantle
Fig. 1.1
Tectonic setting of volcanism illustrated by estimated volumes of extrusive rocks found on the
surface of the earth. Magma volumes are expressed in cubic kilometers per year.
(Adapted from Fisher and Schmincke, 1984.)
dynamics, such as hot plumes associated with mantle convection cells (for example, Clague and Dalrymple, 1987), continental rifting (such as Riecker, 1979), and lithospheric thinning associated with extensional tectonics (for example, Christiansen and McKee, 1978) appear to be reasonable. Perhaps the most significant aspect of a tectonic setting is its effect on observed magma compositions and chamber development. (Table 1.1 summarizes five tectonic settings and their volcanic characteristics.) A primary characteristic for geothermal potential is the chamber depth, which provides information about the magma source and stagnation depth (the geothermal heat source depth). For mantle-derived magmas, which are mafic and bear mantle signatures of trace elements and isotopic ratios (Yoder, 1976), source depths of > 50 km are expected and—in the cases of continental, intraplate volcanoes—may show no crustal reservoirs. On the other hand, in rifts and extensional terrains, deep mantle magmas promote melting of crustal rocks so that shallow silicic magma chambers can develop during long periods of magma flux from the mantle (Hildreth, 1981). In contrast, arc-related volcanoes show the effect of crustal thickness. Continental arcs have magmas that, having been generated at intermediate depths of several tens of kilometers, may stagnate or become contaminated by more siliceous crustal materials during their assent (Eichelberger, 1974).
Magma Chambers
Volcanic products are generally classified by their major-element chemistry (Fig. 1.2) or their modal phenocryst content (Fig. 1.3). These classification schemes (Appendix D) are useful in relating volcanic rocks to magma types. Accordingly, the origin and evolution of magma types can be interpreted in a general manner by considering igneous compositional trends: tholeiitic, transitional, alkalic, potassic, and calcalkalic (Carmichael et al ., 1974). When the field geologist examines pyroclastic samples that do not lend themselves to the above classification schemes, the color of glass shards can be simply related to their refractive index as a function of silica content (see Appendix D as well as Williams et al ., 1982, p. 73). Rock classification has been a traditional exercise for volcanologists, and today the results of this work can be used to determine the nature of the magma source: its shape, depth, and longevity—all of which are important components when evaluating geothermal potential.
One of the most significant recent advances in volcanology is the development of a system for relating the chemical aspects of volcanic rocks to magma-chamber dynamics. This effort has been most fruitful in the cases of volcanoes that have developed calderas (Williams, 1941). Smith (1979) shows a direct correlation between caldera area and the volume of products expelled during the caldera-forming eruption (Fig. 1.4). Where caldera eruptions produce ash flows of differentiated products, Smith and Shaw (1975, 1979) and Smith (1979) show that the volume of these products is ~10% of the volume of the underlying magma chamber. This simple concept has profound implications in the search for geothermal heat sources because by using eruption age constraints, cooling models can predict the residual heat left in and around the magma chamber (Fig. 1.5). Furthermore, there is growing evidence that zonation of magma chamber chemistry can be documented by analyses of time-series chemical trends in eruption products (for example, Hildreth 1979; 1981).
Nonbasaltic volcanic rocks are considered to be products of evolved magmas. Hildreth (1981) stated, "every large eruption of nonbasaltic magma taps a magma reservoir that is thermally and compositionally zoned," and "most small eruptions also tap parts of heterogeneous and evolving magmatic systems." One general hypothesis is that evolved or otherwise differentiated magmas have a crustal reservoir. The volume of a crustal magma chamber is directly proportional to the time required for it to evolve. Consequently,
|
||||||||||||||||||||||||||||||

Fig. 1.2
Classification of volcanic rocks by major-element chemistry as expressed in alkali-silica variation
diagrams; details for major oxide concentrations (at right) are shown weight percent.
(Adapted from Cox et al ., 1979.)
differentiated volcanic products—especially where they are several cubic kilometers in volume—are good indicators of a crustal magma chamber (Fig. 1.5).
Smith's (1979) observation of the correlation between caldera area and ejecta volume opened the door for interpretation of chemical zonation in silicic magma chambers. He predicted that "all caldera-forming ash-flow sheets should, when studied in detail, show some degree of chemical and/or mineralogic gradients inherited from the magma chamber." Hildreth (1979) documented such gradients in the Bishop Tuff in eastern California. Assuming that earlier erupted products originate from the top of a magma chamber and later materials derive from lower portions, it is likely that the time-sequenced chemical characteristics of
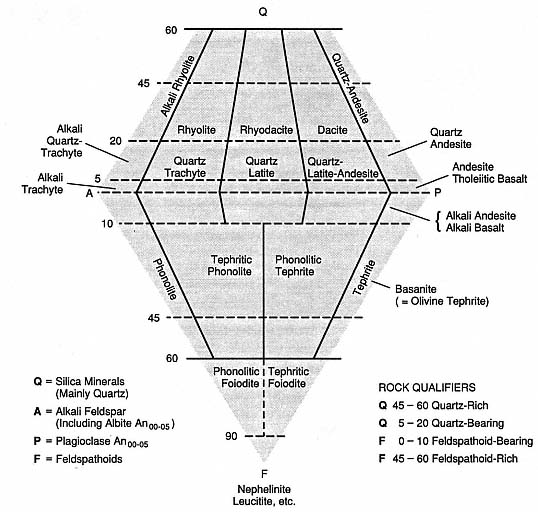
Fig. 1.3
Classification of volcanic rocks by modal phenocryst content plotted on a quartz (Q) - alkali feldspar
(A) - feldspathoid (F) - plagioclase (P) diagram. Petrographic analysis may not always be sufficient to
determine the percentage of minerals present in volcanic rocks; a calculated mineral composition,
based upon normative (chemical) composition might be necessary. Williams et al . (1982) question
this approach to classification because it presupposes "the need to agree upon a single rational and
workable system . . ." and it incorporates both "igneous and igneous-looking rocks" in such a
way that it may conceal the natural association and relative abundances of rock types.
(Adapted from Streckheisen, 1967.)
volcanic ejecta depict an inverse order of the magma chamber's compositional stratification (Fig. 1.6). This chemical stratification also is reflected by oxygen fugacity and mineral equilibrium temperatures that increase with time in products from a large eruption (Hildreth, 1981). Several other petrologic features of volcanic ejecta that suggest magma chamber zonation are isotopic ratios, phenocryst abundances that increase with SiO2 values (Fig. 1.7), and volatile component abundances. This latter feature is best typified by stratigraphic relationships showing that early products resulted from more explosive, gas-rich eruptions and later materials were from
Fig. 1.4
Correlation between caldera area and volume of products (ash flows); diagonal lines plot the
model's draw-down depths of magma chambers.
(Adapted from Smith, 1979.)
Fig. 1.5
Conductive models of heat resource as a function of the age and volume of magma
chambers. Odd numbers refer to slab-like magma chamber shapes and even numbers
represent cubic shapes. Lines 1 and 2 take into account heat transfer effects of con-
vection within the magma body, whereas lines 3 and 4 ignore this effect. Systems in
which estimated magma bodies plot above line 5 and 6 have cooled to near ambient
temperatures; those plotting below lines 1 and 2 may still have near solidus tempera-
tures; and those plotting between lines 3 and 4 are at post magmatic temperatures
>300°C. (Adapted from Smith and Shaw, 1975.)
Fig. 1.6
Plot of elemental enrichment factors as abundance ratios of early to late products of the Bishop
Tuff eruptions shows the overall difference in magma composition. The line drawn at an
enrichment factor of 1 demarks no enrichment or depletion; elements plotting above this line are
enriched in early products and those plotting below the line are enriched in late products.
These enrichment factors are interpreted to reflect magma chamber zonation, assuming
that the eruption taps different parts of the chamber with time.
(Adapted from Hildreth, 1981.)
gas-poor effusive extrusion. However, Eichelberger et al . (1986) suggested that this apparent volatile zonation in rhyolitic eruptions might only reflect eruptive conditions. In Eichelberger's model, the volatiles are not stratified in the magma. Early eruptions are explosive because the volatile flux is confined within a narrow vent region, whereas later effusive eruptions involve a gradual degassing of the rhyolite through permeable vent-wall rocks—a process that results in a volatile-poor magma by the time it reaches the surface and is extruded as a lava flow.
Although major-element abundances do support hypotheses of magma-chamber zonation, it is analyses of the trace elements that best portray the nature of the zonation and mechanisms of differentiation as a result of their variable compatibility in various phenocryst and liquid phases (Fig. 1.8). Petrologic studies of magma suggest that large chambers are fundamentally basaltic because mantle melting supplies heat to the crust for crustal melting, provides a mafic component to hybridize with the crustal melts, and generates a thermal gradient to drive various differentiation processes in the crustal magma reservoir (Fig. 1.9). This general evolution of crustal magma chambers may depend upon tectonic environment (Fig. 1.10).
Fig. 1.7
Plot of phenocryst abundances vs bulk-rock SiO2 of silicic magma for various
volcanoes. The decrease of phenocryst abundance with increasing SiO2 content is
interpreted to reflect liquidus depression caused by dissolved volatiles, which are
supposed to be more abundant in silica-rich magmas found near the tops of magma
chambers. A = caldera-forming eruption of Aniakchak (Miller and Smith, 1977);
FC = Fish Canyon Tuff (Lipman, 1975); FCM = Fish Creek Mountain Tuff (McKee,
1970); KN = Kneeling Nun Tuff (Elston et al ., 1976); MT = Monotony Tuff (Ekren et al ., 1971);
LC = Lava Creek Tuff (Christiansen and Blank, 1972); SM = Snowshoe Mountain Tuff (Ratté
and Steven, 1967); AS = Apache Springs Tuff (Rhodes, 1976); AT = Ammonia Tanks
(Byers et al ., 1976); A-4 = Aso-4 (Lipman, 1967); BT = Bishop Tuff (Hildreth, 1979);
RM = Ranier Mesa (Christiansen et al ., 1977b); S = Shikotsu caldera eruption
(Katsui, 1963); T = Tshirege (Smith and Bailey, 1966); TC = Tiva Canyon
(Christiansen et al ., 1977b); TS = Topopah Spring (Christiansen et al ., 1977b).
(Adapted from Hildreth, 1981.)
Explosive Eruptions and Quantitative Models
For reasons that will be discussed later in Chapter 2, explosive volcanic eruptions are significant in the development of geothermal systems. Over the past two decades, our general knowledge of explosive eruption mechanisms has evolved from the application of theoretical models to quantitative field data. For example, a tripartite field classification scheme shown in Table 1.2 is based upon the assumption that products of explosive eruptions are emplaced as pyroclastic deposits by fallout, flow, and surge.
Fig. 1.8
Plot of rare-earth element (REE) partition
coefficients for clinopyroxene/glass in various
magma compositions. SiO2 content greatly
affects these values; similar trends towards
high partition coefficients with increasing SiO2
content are evident for other phases, including
Fe-Ti oxides, fayalite, and feldspars.
(Adapted from Hildreth, 1981.)
Walker (1973) showed how grain-size characteristics and dispersal area of a pyroclastic deposit can be used to deduce the type of volcanic eruption from which it was produced (Fig. 1.11).
A stylized explosive eruption system is depicted in Fig. 1.12. Although relatively little is known about subsurface processes in the volcanic conduit, the behavior of eruption columns has been deduced from observations; this information allowed Wilson (1976) and Sparks and Wilson (1976) to formulate physical conditions in explosive eruption columns (see also
Fig. 1.9
Illustration of processes affecting magma chamber differentiation; idealized thermogravitational
column is at left. Early stage crustal heating by intermediate to basaltic volcanism triggers
crustal melting and buoyant rise of magmas (diapirism), followed by segregation of liquid
phases in a silicic magma chamber. Within the silicic chamber, convection enhances diffusion
processes such as that of Soret (between cold walls and hot center), volatile mass transport (dots),
and wallrock exchange. Stippled pattern depicts enriched zones in the magma chamber roof
and at both ends of the thermogravitational column. Such differentiation processes probably
last longer than the eruptive history of the associated volcanic field,
typically 106 to 107 years in large systems.
(Adapted from Hildreth, 1981.)
Wilson et al . 1980). The basic equations for the eruption are
which express conservation of mass and momentum, respectively, for one-dimensional flow along the subsurface volcanic conduit. The h and rc = vertical distance and conduit radius, respectively; g = gravitational acceleration, u = the magma's velocity, p = r g RT (perfect gas law pressure), and r = bulk density. f h is the factor expressing frictional loses along the conduit walls. The relationship among bulk (r b ), solid (r p ), and gas (r g ) densities is expressed as in Eq. (1-4).
Equations (1-5) and (1-6) earlier in this chapter are solutions for the conservation relationships of Eqs. (1-11) and (1-12). This quantitative approach to understanding volcanic phenomena is well summarized by Head and Wilson (1986) for a variety of eruption types, including effusive processes, Strombolian (scoria cone), Hawaiian (lava fountain), Plinian
Fig. 1.10
Evolution of silicic magma chambers as a function of tectonic environment. These idealized
diagrams illustrate the profound effect of crustal stress on the size and geometry of evolving
magma bodies. The top diagrams depict basalt-rhyolite magmatism in regions of crustal
extension for (a) early and (b) advanced stages. The lower diagrams show two possible
stages of dominantly intermediate volcanism in convergent tectonic regions:
(c) early stage and (d) intermediate stage; the late stage shown in Fig. 1.9.
(Adapted from Hildreth, 1981.)
|
||||||||||||||||||||||||||||||||||||||||||||||||||||||||||||
(pumice and ash columns), Vulcanian (cannon-like explosions), and Peléean (lava dome destruction).
Pyroclastic Fallout
Pyroclastic fall deposits (Fisher and Schmincke, 1984) are characterized by their relatively well sorted size characteristics, topography-blanketing dispersal, and graded bedding, but lack of other internal bedforms. The emplacement characteristics of these deposits are controlled by the terminal fall velocities of individual pyroclasts (Walker et al ., 1971; Wilson, 1972). One important component for this modeling is the assumption that eruption columns behave as thermal plumes in which the height of the plume (ht ) is proportional to the quarter root of the mass flux (d m/d t):
The constant of proportionality (kh ) is ~43.7 for steady columns and 7.22 for discrete explosions when d m/d t is expressed in kilograms per second (1 kg/s @ 1.1 kW) and ht in meters. For a convecting eruption column, a second important assumption is that vertical velocities (uv ) fit a gaussian function of distance from the plume axis (Carey and Sparks, 1986):
where uc = the centerline velocity at height h as determined from solutions of Eqs. (1-5) and (1-6) (Wilson, 1980); x = the radial distance from the plume axis, and be = the e-folding distance of uc ; 2be is the approximate distance from the plume axis to the visible edge of the plume (Sparks and Wilson, 1982). Superimposed upon uv is ur , the radial velocity of lateral plume spread, which is defined as
where rp = the plume radius, r a = the mean air density between ht (the plume height) and hb (the height at which the plume is neutrally buoyant and begins appreciable lateral movement). Figures 1.13 and 1.14 illustrate the features of this fallout model.
Pyroclastic Flows
Pyroclastic flows (ignimbrites) comprise some of the most voluminous explosive products in the geologic record, and one possible emplacement model is that for the gravitational collapse of an eruptive column (Sparks and Wilson, 1976; Wright, 1979). Based upon Prandtl's (1949) theory of turbulent fluid jets, in which ambient air is incorporated into the jet—thus changing its bulk density, the equation of motion for an eruptive column (Wilson, 1976) is written:
where q = a ratio of the average column velocity to its centerline velocity, r b = the bulk density of the column, rv = the vent radius, and r a = the density of the ambient air. Numerical solutions to this equation, summarized by Sparks et al . (1978), relate column height to gas velocity, vent radius, and water content (Fig. 1.15). Column collapse is predicted for columns that do not continue their upward motion because buoyancy forces can no longer offset drag forces on the margins of the column.
Fig. 1.11
Classification (Walker, 1973) of eruptive mechanism by grain size and dispersal characteristics of
fallout deposits. Ft is the weight percent of tephra finer than 1 mm found along the dispersal axis
where the deposit thickness is 10% of its maximum. Ad is the area of the deposit where its
thickness is at least 1% of its maximum.
(Adapted from Wright et al ., 1981.)
Figure 1.16 depicts the onset of gravitational collapse predicted by solutions to Eq. (1-16). Plinian eruptive column collapse can be precipitated by increases in vent radius or decreases in the water content of erupting materials; either condition decreases the initial velocities of the column and leads to its collapse.
Sheridan (1979) and Malin and Sheridan (1982) modeled the runout of pyroclastic flows and surges by employing an "energy line" concept (Fig. 1.17) derived by analogy to rock-fall debris streams (Hsu, 1975), which are dominantly gravity-driven flows. The maximum distance of runout is computed as the loci of points at which the potential energy surface of the flow intersects the topographic surface. The velocity of the flow at any increment (i) along its flow path [v(i)] is simply modeled as its gravitational potential velocity path: v(i) = [2gD h(i)]1/2 , where D h(i) = height of the energy surface above the local topography; in general, this value is initially determined by height above the vent from which the pyroclastic flow collapses. For directed blasts (for example, Hoblitt et al ., 1981), the initial velocity [v(0)] can be taken as a calculated gas-dynamic velocity such as the blast's sound speed. The flow accelerates with incremental runout distance:
for which q (i) = the local slope and µh = the tangent of the energy surface slope (q e ), called the Heim coefficient (Heim, 1932). This number can vary from 0.06, for highly mobile, large pyroclastic flows, to 0.74, for small pyroclastic flows with low mobility (Sheridan, 1979). The flow accelerates and decelerates depending upon the local slope, in such a way that it flows over a total runout distance (Lf ) to where its velocity v(i) = 0; v(i) = [vo + 2a(i)Le (i)]1/2 , where Le (i) is measured from topographic maps and t(i) = 2Le (i)/v(i)].
Fig. 1.12
Schematic of an idealized volcanic eruptive system.
Although analytical solutions for subsurface
flow of magma and volatiles can be made,
the exact physical conditions of this flow are
unknown, and this lack of information limits
the calculation of mass and energy transport
within the erupted jet and plume.
(Adapted from Wilson et al ., 1980.)
Fig. 1.13
Clast trajectories from the umbrella region of a Plinian eruption column; clast sizes
are given in centimeters. Note that the dispersal is greater for the 35-km-high
column than for the 21-km-high column.
(Adapted from Carey and Sparks, 1986.)
Pyroclastic Surge
Relatively thin bedding (generally less than a decimeter), and a multiplicity of bedforms distinguish the deposits of pyroclastic surges (Fisher and Waters, 1970; Wohletz and Sheridan, 1979). These textural features are thought to indicate unsteady flow and rapid variations in particle-to-gas volume ratios—flow conditions that are especially prevalent during eruptive blasts such as those that may occur during the initial moments of Plinian eruption (Kieffer, 1981; Wohletz et al ., 1984) and explosive hydrovolcanic activity (Waters and Fisher, 1971).
Kieffer (1984b) showed that some volcanic blasts have a jet structure when they emanate from the vent orifice. The conditions of the jet can be initially supersonic and will vary with decompression of the magma reservoir. As Kieffer (1977) showed, the sound speed of multiphased fluids (cs ), such as steam loaded with solid particles found in volcanic columns, can be substantially less than that of the constituent phases (Marble, 1970). The sound speed may be several tens to several hundreds of meters per second for steam and tephra mixtures. Because observed velocities of volcanic ejecta are in the range of 100 to 500 m/s, their flow is internally supersonic and the effects of gas compressibility are important. The Bernoulli Eq. (1-3) can be written to show the effect of Mach number (M = u/cs ):
in which po = the stagnation pressure (the pressure of the erupting mixture at zero velocity; for example, the chamber overpressure), ps = the static pressure, and g , the isentropic exponent (ratio of heat capacities at constant pressure and constant volume), expresses the degree to which the erupting mixture approaches isothermal expansion (g = 1.0). In contrast to the incompressible Bernoulli Eq. (1-3), in which the pressure is a function of velocity only, the compressible form shows that pressure is also a function of thermodynamic parameters. For eruption columns modeled by incompressible equations, the pressure along the axis of the column is nearly atmospheric, but for columns erupted as supersonic jets, the effects of compressibility cause pressure and density to vary by large factors along the column's axis.
To understand flow conditions for surge-producing blasts, it is necessary to solve non-linear forms of the equations of motion. In simplified form (Kieffer, 1984b), these equations express
where r = density,


The above discussion of important quantitative models includes those that have had wide applications in recent years and are frequently cited. With improved modeling approaches and close development of theory in conjunction with field observation, it will be possible to use field measurements to constrain eruptive mechanisms and subsurface conditions that are needed to understand the thermal regime and hydrothermal
Fig. 1.14
Plots of maximum clast isopleths show the
effect of crosswind velocities (v) of 30, 20,
and 10 m/s on a 28-km-high eruption column.
The isopleth contours are for clast diameters (in
centimeters) and clast densities of 2500 kg/m3 .
(Adapted from Carey and Sparks, 1986.)
systems associated with volcanoes. Progress towards these latter goals has been greatly aided by the development of a hydrovolcanism theory that links quantitative models of explosive eruption with the hydrological character of the volcano. Through this theory, both the heat resource and water necessary for a geothermal system can be simply assessed by characterization of explosive eruption products.
Hydrovolcanism
Hydrovolcanism is a broad term that encompasses the role of external (nonmagmatic) water in volcanic activity; synonyms include phreatomagmatism and hydromagmatism . This topic may have its roots in the 18th Century Neptunists' theory about the origin of basaltic rocks in oceans (which was later formalized by Abraham Werner). After the eruption of Krakatau in 1883, world attention was focused on the dynamic potential of oceanic volcanism (Verbeek, 1885). Because water plays such a fundamental role in geothermal systems, we will briefly describe some research efforts that have unraveled the complexities of water/magma interactions in volcanic settings. This research has led to the development of systematics for inferring the existence of external water in volcanic areas. Such systematics concentrate on the interpretation of volcanic landforms and tephra deposits, which is viewed as a first step toward finding areas in which both a heat source and water exist. The study and characterization of hydrovolcanic features is chiefly used to make quick estimates of the abundance of water in a hydrothermal system. Detailed studies of water/magma interaction constrain subsurface conditions that have evolved within a geothermal system; for example, depth and lithology of aquifers and permeable formations, temperature of hydrothermal alteration, and spatial and temporal variations in subsurface hydrothermal behavior.
Fig. 1.15
Velocity/height profiles for the lower part of a Plinian eruption column. Calculated by the method
proposed by Wilson (1976), the plots show consecutively the effect of (a) variable water content
(n = 1.5, 2, 3, and 10 wt%), with a constant initial velocity of 400 m/s, and a constant vent radius
(rv ) of 200 m, (b) variable initial velocity with n = 3.0 wt% and rv = 200 m, and (c) variable vent
radius (rv = 200, 400, and 600 m) with constant initial velocity and water content (n = 3.0 wt%).
(Adapted from Sparks et al ., 1978.)
A host of natural phenomena are produced by the interaction of magma or magmatic heat with an external source of water. Because the earth's crust is, in general, saturated with water, most volcanic fields have at least one feature produced by hydrovolcanic phenomena. Most widely recognized are phreatomagmatic and phreatic explosions (see Appendix G for definitions). Many hydrovolcanic phenomena, such as the gradual fracturing of country rock around magma intrusions and the alteration of rocks in hydrothermal systems are neither explosive nor readily observable. In their review of hydrovolcanism, Sheridan and Wohletz (1983a) discuss various aspects of research, including
· geologic environments where systems occur,
· the range of physical phenomena,
· the wide variety of classical eruption types and landforms,
· experimental modeling,
· petrography of hydrovolcanic products,
· textural analysis and indicators of water abundance in deposits, and
· hydrovolcanic cycles.
During recent years, hydrovolcanism has developed as a field theory that applies to a range of physical as well as chemical processes (for example, magma differentiation by fluid and vapor transport, dynamic magma alteration during eruption, and contamination of magma bodies by external water). The brief review included in this chapter serves as an introduction to more detailed considerations of hydrovolcanism and geothermal energy that are provided in later chapters.
Fig. 1.16
Prediction of column collapse as a function of (a) increasing vent radius, (b) decreasing exsolved
gas content and increasing vent radius, and (c) decreasing gas content with constant vent radius.
These scenarios can be used to interpret emplacement of Plinian falls and pyroclastic flows
under changing eruption conditions.
(Adapted from Wilson et al ., 1980.)
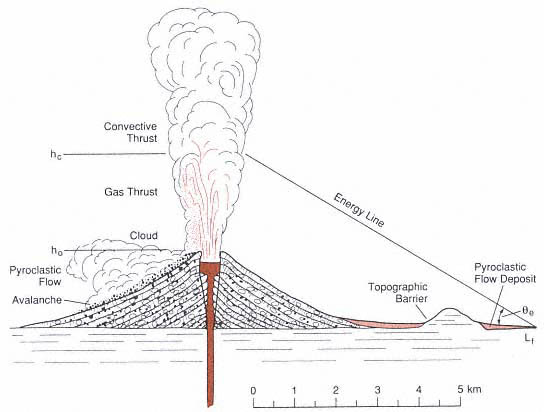
Fig. 1.17
Illustration of the "energy-line" concept for a Plinian eruption from a hypothetical composite cone.
The gas and convective thrust regions of the eruption column (Wilson, 1976; Sparks et al ., 1978)
are shown with a pyroclastic flow that is initiated by collapse near the top of the gas thrust
region (hc ) with the vent at a height of h(0). The initial potential velocity of the pyroclastic flow is
constrained by v(0) = [2gD h(0)]1/2 , where D h(0) = hc - ho . Flow acceleration a(i) and runout are
a function of the local topographic slope [q (i)] and the Heim coefficient (µh ) shown by Eq. (1-17).
The general slope of the energy line (q
e ) is given by arctan (hc /Lf ) for which Lf = the distance from
the vent where v(i) vanishes (that is, where the energy line intersects the topographic surface).
(Adapted from Sheridan, 1979.)
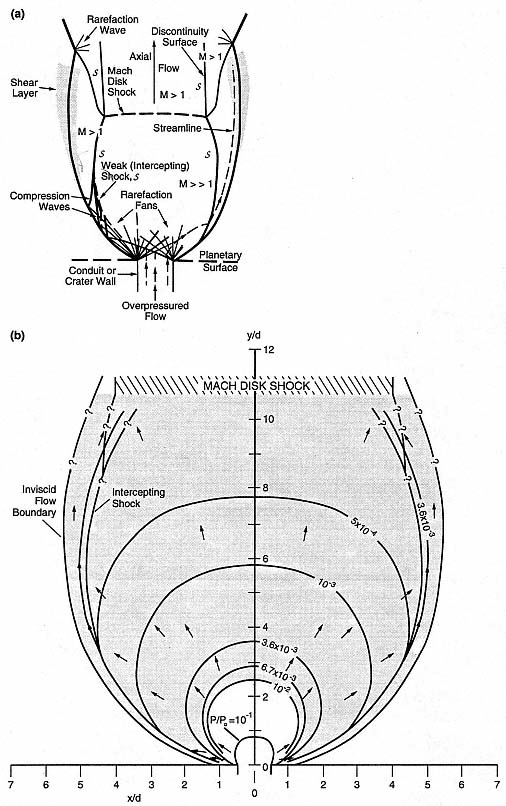
Fig. 1.18
Schematic of (a) an idealized overpressured jet and (b) the jet structure calculated for
conditions of supersonic flow [overpressure of 12.5 MPa; Mach number (M) = 1.02] as
they occurred during the lateral blast and pyroclastic surge of Mount St. Helens on
May 18, 1980. Dimensions x and y are scaled to vent diameter (d @ 0.5 km).
An overpressured jet rapidly expands through rarefaction waves [lines that extend from
the conduit vent sides in (a)] that form a rarefaction fan. As the fluid expands, its atmospheric
boundary initially diverges from axial flow, giving the jet a flaring structure. With substantial
overpressure, the jet may overexpand, developing a subatmospheric pressure zone in the
center of the flow [shaded zone in (b)], which allows the atmosphere to cause downstream
constriction of the jet. Reflections of rarefaction waves from the atmospheric boundaries of
the jet form compression waves that coalesce into weak (intercepting) shocks, which in turn
coalesce downstream to set up a Mach disk shock. Zones of supersonic and subsonic flow are
designated by Mach number. Across the intercepting shocks, the flow velocities decrease,
whereas pressure increases and streamlines (dashed lines with arrows) are deflected.
The supersonic area of the jet, upstream from the Mach disk, corresponds approximately to
the zone of directed blast devastation and pyroclastic surge deposits.
Environments of Hydrovolcanism
During its ascent to the surface, magma commonly encounters groundwater; connate water; marine, fluvial, or lacustrine water; ice; or rain water. The subaqueous environment includes all activity beneath a standing body of water (Kokelaar, 1986); products of this activity have been called subaquatic (Sigvaldason, 1968), aquagene (Carlisle, 1963), hyaloclastite (for deep marine; Bonatti, 1976), hyalotuff (for shallow marine; Honnorez and Kirst, 1975), and littoral (Wentworth, 1938). Volcanism that heats groundwater to produce steam explosions that do not eject juvenile magma fragments is called phreatic (Ollier, 1974) or hydrothermal (Muffler et al ., 1971; Nairn and Solia, 1980). Subglacial volcanism (Noe-Nygaard, 1940) is noted by its products, including massive floods (jökullaups ), table mountains (stapi ), and ridges (mobergs ).
The wide variety of hydrovolcanic phenomena underscores the fact that interaction between water and magma or magmatic heat should be expected in any volcanic setting. One long-held theory suggests that the depth below surface at which dynamic, water/magma interaction is possible is limited by the critical pressure of water or water-rich fluids, and that above this pressure, the phase change from liquid to gas upon heating does not involve large-volume changes (Lorenz, 1986). Accordingly, depths of 0.8 to 2.2 km were considered limits to explosive magma/water interaction. However, more recent work suggests that the critical point need not be a limitation to dynamic interaction and that expansion of water through its two-phase field is not required for rapid volume changes (Wohletz, 1986).
Nature of Hydrovolcanic Phenomena
The physical phenomena of hydrovolcanism belong to a class of well-studied physical processes termed fuel-coolant interactions (FCI). Fig. 1.20 depicts a hypothetical geologic
Fig. 1.19
illustration of the calculated pyroclastic surge
generated during initial moments of Plinian
eruption. (a)An overpressured burst propagates
a bow shock into the atmosphere ahead of
lithic-rich ash as a rarefaction wave recedes
into the magma reservoir. (b and c) Reflected
rarefactions from the reservoir and flow margins
form weak shocks that accelerate ash in surges.
Together, these phenomena constitute a blast
wave that precedes (d) the flow of
juvenile ash from the vent.
(Adapted from Wohletz et al ., 1984).
system in which magma (fuel) explosively interacts with water-saturated sediments (coolant). This process occurs in stages of (a) initial contact and steam-film development, (b) coarse mixing of magma and water or water-rich rock, (c) vapor expansion and flow, and finally (d) explosion and fine fragmentation of the magma. The process does not necessarily evolve through all these stages and may be arrested, for instance, before mixing or explosion.
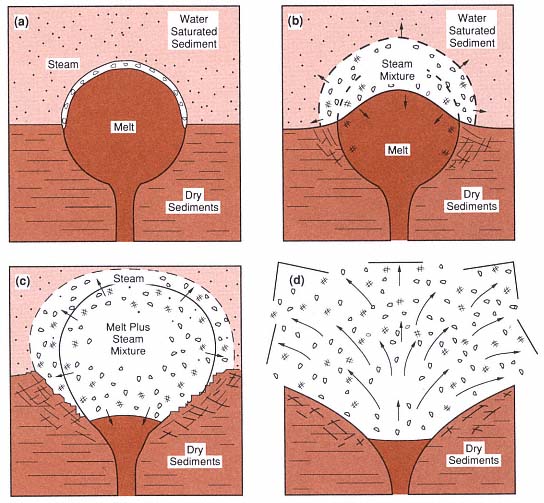
Fig. 1.20
Hypothetical setting of subsurface hydrovolcanic activity, showing (a) initial contact of magma with
water-saturated sediments, (b) vapor film growth, (c) mixing of magma with the sediments, and
(d) expansion of the high-pressure steam in an explosion.
(Adapted from Sheridan and Wohletz, 1983a.)
Much of our theoretical-understanding of hydrovolcanism has developed from laboratory experiments (for example, Wohletz and McQueen, 1984). This approach has made it possible to quantify some controlling parameters by using field and laboratory measurements of hydrovolcanic products. Figure 1.21 shows results from early experiments (Sheridan and Wohletz, 1983a), in which the mass ratio of water and magma (thermite analog) interacted and confining pressure controlled the explosive efficiency of the system.
The thermodynamics of heat transfer is also a significant aspect of hydrovolcanic systems and their physical and chemical effects. The mechanical work produced by interaction of magma with external water is partitioned into many possible modes, including fragmentation of the magma and country rock; excavation of a crater; dispersal of tephra; seismic and acoustic perturbations; and chemical processes such as solution and precipitation, mass diffusion, and magma quenching and crystallization.
Fig. 1.21
Some results of experimental studies (indicated by number) by Wohletz and McQueen (1984)
showing explosive efficiency as a function of water-to-magma mass ratio and confining pressure.
Note the apparent maximum near 0.5 and the increased explosivity of high-confinement
pressure tests. Explosive interaction occurred at 5200 psi (~350 bars) confining pressure,
which is well above the previously assumed limit at water's critical pressure.
This work, D Wsys , is the sum of changes in kinetic energy (D Ek ), potential energy (D Ep ), and volume-change work (pD Vsys ), which is given by
There are several ways by which to evaluate the above expression, but one of the most direct methods is to estimate the change in the internal energy of the water/magma mixture (D Umix ); by definition D Wsys º -D Umix , where

and m = mass, U = internal energy, and subscripts w and m denote water and magma, respectively. Wohletz (1986) demonstrated a method for evaluating Eq. (1-23) that requires data from extended steam tables (Burnham et al ., 1969; Haar et al ., 1984). Further consideration of the mixing and explosion stage (Wohletz, 1986) yields information on particle velocities and sizes. Heiken et al . (1988) extended these calculations to explain country rock fracture by hydrovolcanic processes.
Experimental investigations of water/magma interactions have displayed a variety of explosive and nonexplosive behaviors that are analogous to natural volcanic activity. These results support observations of hydrovolcanic eruptions in which a wide variety of classical eruption types (for example, Strombolian,
Surtseyan, Vulcanian, and Plinian) have involved external water. There is additional evidence of hydrovolcanism in a variety of landforms that range from small maar/tuffring craters to some large caldera outflow sheets of tephra. Such features as peperites, mud volcanoes, hydrothermal explosion pits, pillow lavas and breccias, and parts of composite cones can also be attributed to hydrovolcanic activity. These eruptive behaviors and resulting landforms are, in a general fashion, related to the degree of water interaction, as is shown in Fig. 1.22.
Hydrovolcanic Products
Hydrovolcanic solid products are generally fragmental and are termed hydroclasts by Fisher and Schmincke (1984), instead of pyroclasts , which refers solely to the fragmental products of magmatic eruption. Hydrovolcanic solid products include tephra, explosion breccia, pillow lava, palagonitic and zeolitic tuff, lahars, blocks and bombs, silica sinter and travertine, and intrusive breccia and tuff. Some of these materials involve posteruptive processes (for example, hydrothermal) in which water interacts with volcanic products.
Petrographic studies of hydrovolcanic products involve determining the grain-size and textures of tephra and the chemical signatures caused by rapid and slow alteration. These data are indicators of the degree and type of water interaction. For example, the grain size of hydroclasts is a function of the mass ratio of interacting water and magma; grain textures are indicative of the type of interaction—passive, explosive, extensive, or transient. Field characterization of hydroclastic products focuses on (a) analysis of various ejecta deposit characteristics, including textural analysis of bedforms, lithification, and deposit thickness vs distance from the vent, and (b) correlation of these observations with vent type (for example, composite cone, tuff ring, or caldera).
A correlation can be made between the median grain diameters of hydrovolcanic products and the water/magma mass ratio (Fig. 1.23); this correlation was developed from both experimental and field applications. In general, hydrovolcanic tephra are distinguishable from magmatic tephra by their much finer grain size. Microscopic examination of grain shapes and textures also reveals hydrovolcanic features (Fig. 1.24). Quantitative analyses of these features can document the relative importance of hydrovolcanic (wet) and magmatic (dry) mechanisms in samples from deposits of mixed origins. Hydrovolcanic grain textures are also indicative of the type of water/magma interaction (for example, wet vs dry; Wohletz, 1983).
Hydrovolcanic Cycles and Geothermal Energy
Hydrovolcanic phenomena occur in regular patterns at some volcanoes and thus can assist in defining cycles that in turn are useful in both predictions of future activity and estimates of subsurface hydrological conditions. The eruptive cycles portrayed in Fig. 1.25, for example, show the changing availability of groundwater during periods of activity at several volcanoes. Cycles can be documented by careful field and laboratory analyses of volcanic products in which the abundance of erupted steam and its temperature are constrained by textural indicators of grain cohesion, deposit mobility as a function of moisture abundance, and degree of clast alteration. Cycles are characterized as "wet" when the volcanic products indicate an increase of water during the eruptions; "dry" cycles produce tephra that indicate decreasing water abundance throughout the eruption. The nature of these water indicators also demonstrates whether the erupted steam is saturated (wet) or super-heated (dry). As a general rule, locations that show wet cycles might be better candidates for geothermal exploration because
Fig. 1.22
Relationship of eruptive phenomena, deposit type, and landform to water-to-magma interaction ratio.
(Adapted from Sheridan and Wohletz, 1983a.)
Fig. 1.23
Correlation of deposit texture and grain size to water-to-magma ratio.
(Adapted from Frazzetta et al., 1983 and Sheridan and Wohletz, 1983a.)
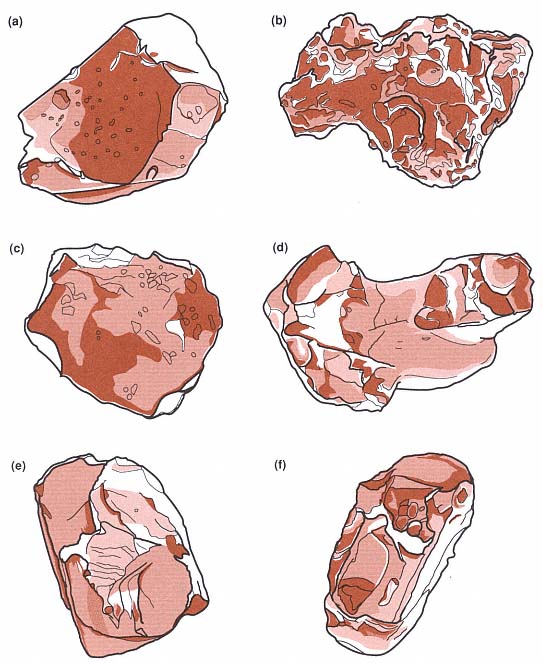
Fig. 1.24
Sketches of pyroclast textures resulting from hydrovolcanism. These textures include
(a) a characteristic blocky and equant glass shard, (b) a vesicular grain shard with cleaved vesicle
surfaces, (c) a platy shard, (d) a drop-like or fused shard, (e) a blocky crystal with conchoidal fracture
surfaces, and (f) a perfect crystal with layer of vesicular glass.
(Adapted from Sheridan and Wohletz, 1983a.)
they prove that water is sufficiently abundant in the volcanic system to quench the magma to water-vaporization temperatures. When estimating the volume of erupted hydroclastic products, this general rule constrains the volume of water involved in the eruptions and thus provides a measure of water abundance in the volcanic system.
Funiciello et al . (1976) pointed out the correlation between geothermal localities and phreatomagmatic volcanoes in Italy, especially those showing wet cycles. In addition, these authors demonstrated how the study of phreatomagmatic products helps locate and characterize a geothermal reservoir with respect to its lithology and fracture permeability, topics that Heiken et al . (1988) discussed in further detail. These studies provide an excellent background for our discussion of hydrovolcanism in Chapter 2.
Fig. 1.25
Various cycles of hydrovolcanism displayed by several type of studied volcanoes. Temporal
variations of water-to-magma mass ratios are shown for (1) Crater Elegante, Mexico;
(2) Kilbourne Hole, New Mexico; (3) Peridot Mesa, Arizona; (4) Taal volcano, Philippines;
(5) Ubehebe crater, California; (6) Zuni Salt Lake, New Mexico; (7) Cerro Colorado, Mexico;
(8) Diamond Head, Hawaii; (9) Koko Crater, Hawaii; (10) Pavant Butte, Utah; and (11) Surtsey,
Iceland. These cycles illustrate general trends (see Sheridan and Wohletz, 1983a, Fig. 5), including
wet to dry (well demonstrated by Vulcano in the Aeolian Islands, Italy) and dry to wet
(activity characteristic of Vesuvius). Some volcanoes show reversals in cyclic activity
(7, 9, and 10 here are tuff cone structures), whereas repeated cycles between dry (Strombolian)
and wet (Surtseyan) occur at others (5).
(Adapted from Wohletz and Sheridan, 1983a.)
Chapter 2—
Pyroclastic Rocks as a Tool to Evaluate Geothermal Systems
Our approach to exploration for geothermal systems in volcanic fields is based primarily on an understanding that the volume and characteristics (both physical and chemical) of pyroclastic rocks (tephra ) are fundamental indicators of the presence, size, and location of a potential hydrothermal system. Fisher and Schmincke (1984) distinguished two primary types of tephra: those produced by expansions of magmatic gases—termed pyroclastic —and those caused by expansions of water from external sources—termed hydroclastic (or hydrovolcanic ). Where we can be certain of the difference, we will use this terminology, but where the distinction is not clear or where both processes are involved in the formation of a tephra sequence, we use pyroclastic in a general sense. In this chapter, we describe important relationships among pyroclastic rocks, their parental magma body, and the potential hydrothermal reservoir in the vicinity of the magma body. Several important issues should be considered.
· The existence of pyroclastic rocks implies that explosive eruptions have occurred. The volume of these rocks can be used to estimate the size of their parental magma chamber. Some of this explosive energy will have had important effects on fracture permeability surrounding the vent.
· Many explosive eruptions and their pyroclastic/hydroclastic products resulted from vaporization of groundwater (hydrovolcanism). This process can indicate both host rock permeability and existence of water in the thermal system below the volcano.
· For hydrovolcanic (hydroclastic ) tephra, the deposit bedforms, particle types, and vent structures are a function of the thermodynamic state of water during eruption and therefore are indicative of the abundance of meteoric water in the vent area.
· Lithic constituents in tephra deposits can be used to reconstruct the host rock lithology and stratigraphy beneath the volcano, the location of aquifers at depth, and—through secondary mineral assemblages—the thermal regime of the country rock and the composition of hydrothermal fluids at depth.
By using the information gathered from these considerations, it is possible to make an integrated appraisal of tephra deposits and help constrain the existence, location, size, depth, and reservoir character of a potential geothermal system in a volcanic field. Topics involving pyroclastic rocks that were introduced in Chapter 1 will be discussed here with emphasis on their importance to geothermal exploration.
Explosive Eruptions and Geothermal Energy Sources
Pyroclastic rocks are the products of explosive volcanism. Many different types of volcanoes exhibit explosive behavior, as discussed by Fisher and Schmincke (1984). Table 2.1 summarizes the major types of volcanoes and their explosive behavior.
In his review of significant explosive eruptions, Wilson (1980) discussed Plinian, Strombolian, and Vulcanian models (for example, Self et al ., 1979), and showed the relationships among observed kinetics, such as ash ejecta velocity, eruptive plume over-pressure, and volatile content, by using forms of the energy equations explained in Chapter 1 of this book [Eqs. (1-5) and (1-6)].
Figure 2.1 shows an idealized Plinian eruption in which ejecta dynamics are directly related to the fragmenting magma dynamics in the throat of the volcano. The isothermal form of the energy equation is appropriate for Plinian eruptions because most
|
||||||||||||||||||
pyroclasts are small enough to transmit their thermal energy to expanding gases within the time frame of the eruption.

where n = the weight percent of water in the magma, r = the average density of the solid and gas mixture, pi and pf = the initial and final (atmospheric) gas pressures, and uf is the ejecta velocity at height (h) in the ejecta plume. Other parameters are those defined in Chapter 1 and summarized in Appendix C.
For Strombolian eruptions (Fig. 2.2), ejecta velocities are related to magma gas overpressure by an adiabatic form of the energy equation.
Fig. 2.1
Idealized Plinian eruption conduit and column. This diagram shows magma (cross hatch)
rising up the volcanic conduit, the growth of vesicles (circles) before complete disruption
(dashed line), and the ejection of gas and tephra mixture (stippled) from the vent.
The initial pressure (pi ) and velocity (ui ) of the gas and tephra mixture within the vent,
which are primarily functions of the gas content of the magma and the vent radius,
are related to the final pressure (pf ) and velocity (uf ) by an isothermal form of the
energy equation [Eq. (2-1)] because the gas draws heat from the entrained tephra and
maintains a nearly constant temperature during expansion. (Adapted from Wilson, 1980.)
where r a = the air density, g = the ratio of specific heats for the gas, ri = the vesicle radius before burst, and n @ 0.2 for erupted materials (Blackburn et al ., 1976).
In the Vulcanian mechanism (Fig. 2.3), which applies to eruptions where the expanding gas may be either or both magmatic and hydromagmatic, a motion equation can relate pressure and velocity.
Fig. 2.2
Idealized Strombolian eruption model. Individual
centimeter-to-meter size gas bubbles burst at
the surface of the magma within the vent,
propelling scoria in ballistic trajectories. An
adiabatic form of the energy equation [Eq. (2-2)]
relates ejecta velocities to the initial pressure,
temperature, and radius of the gas bubbles.
(Adapted from Wilson, 1980.)
where Av = the vent area, Lp = the plug thickness, p = pi [xs /(xs + ym )]g, xs = the thickness of the steam cap for which the ratio xs /Lp is related to weight fraction water (n) by xs /Lp = [(r g RTi )/Pi ][n/(1-n)], r g = the steam density, and Cd (the drag coefficient) @ 1, and ym is the vertical distance over which the rock mass is moved. In Eqs. (2-1) through (2-3), our observations of ejecta velocities allow us to estimate the explosion overpressure, which we can assume is the volatile overpressure (magmatic or hydromagmatic). The thermal energy involved in the explosion (Et ) is related to the bulk isentropic exponent g = [(Cp + mf Cm )/(Cv + mf Cm ] by
where r b = the bulk density of the erupting mixture of vapor and tephra fragments, Cp and Cv = the heat capacities of the vapor at constant pressure and volume, respectively, Cm = the magma heat capacity, and mf is the mass fraction of fragments in the mixture of vapor and ash. On the other hand, the kinetic energy (Ek ) of the eruption is some fraction (x c ) of Et because not all the available thermal energy is converted to the kinetic energy of cratering and ejection of tephra. The exact value of x c , often called the thermodynamic efficiency or conversion ratio , is generally <0.1 but can vary over an order of magnitude depending upon eruption circumstances (Wohletz, 1986). Ek can be estimated from observed ejecta velocities (ve ) as


The above relationship between thermal energy and estimates of eruption energy
Fig. 2.3
Idealized Vulcanian eruption model, in which
magma (cross hatch) is covered by a steam
pocket of thickness xs , which is in turn
capped by a plug of solidified lava of
thickness Lp in a vent of area Av . An
equation of motion [Eq. (2-3)] relates these
dimensions to the pressure and density of
the gas pocket and acceleration of the
tephra after failure of the lava plug.
(Adapted from Wilson, 1980.)
depends on observations of actual eruptions and their ejecta. In cases where necessary ejecta masses and velocities are unknown but a crater is preserved, it is possible to empirically estimate explosion energy by using explosive-testing analogs for which there is data to relate crater dimensions to explosion energies. Assuming that the cratering efficiency of high explosives is the same (within a factor of 10) as that of volcanic explosions (Wohletz, 1986), crater dimensions scale as the cube-root of explosive energy. Johnson (1971) plotted observed crater radius, depth, and volume with respect to explosive yield, as is shown in Fig. 2.4.
Subsurface Thermal Energy Estimates
The most widely applied estimates for thermal energy in magmatic systems underlying volcanic fields are based on the volume and age of the most recent volcanism associated with these systems. As discussed in Chapter 1, Smith and Shaw
Fig. 2.4
Scaling crater dimensions and depth of burial to the explosive energy
equivalent of TNT. English units have been used for dimensions to preserve
the original logarithmic scale. For reference, TNT releases about
4.6 MJ/kg of energy, which is about four times the enthalpy released
by cooling 1 kg of magma from 1473 to 273 K. For optimum thermal
conversion efficiencies of 10% (see Fig. 1.21), a ton of erupted magma is
roughly equivalent to 0.025 tons of TNT. Comparison of the plots for
explosions in (a) dry rock and (b) soil indicates that larger craters
typically form in soils.
(Adapted from Johnson, 1971.)
(1975; 1979), have used this approach in estimating thermal energies of magmatic systems. Volumes are inferred from caldera size, vent distribution, seismic shadows, fracture patterns, topographic uplift, geophysical anomalies, and estimates of silicic ejecta volume. If a volcano produces chemically evolved (nonbasaltic) products—especially those spanning andesite through dacitic and rhyolitic compositions—it is very likely that magma has formed a crustal magma chamber and has differentiated on its path to the surface. Because differentiation is a time-dependent process, evolved compositions can indicate prolonged residence in the crust, during which a significant amount of heat flowed from the magma into crustal rocks. The larger the magma chamber, the larger is the thermal resource, which is a measure of the amount of economically useful energy.
The thermal resource (Htr ) of a magmatic heat source is proportional to the volume of rock (Vtr ) that exceeds the minimum temperature for economic heat extraction (q tr )
Table 2.2 summarizes the parameters of Eq. (2-6), which outlines aspects of modeling heat flow from a crustal magma body such as the silicic caldera depicted in Fig. 2.5. The general nature of the function for Vtr in Eq. (2-6) is based on the solution of heat flow in and around the magma body—a calculation that is discussed later in this chapter.
Because numerous petrologic experiments have shown that magma-chamber temperatures range from about 900 to 1200°C, depending upon their composition, it is possible to use heat content data (Bacon, 1977) and magma-chamber volume to calculate thermal energy. Smith and Shaw (1975) based their conclusions about magma-chamber volumes on models of magma and heat transport in the earth's crust, observations of exhumed intrusive bodies, petrologic constraints on the production of evolved magmas, and geophysical studies of active igneous systems. Smith et al . (1978) and Shaw (1985) extended this approach to the study of volume-periodicity relationships for a wide variety of volcanoes; their results, along with those of Crisp (1984) and Wadge (1984), support the basic premise that extruded volumes as well as caldera areas and other geophysical measurements can be related to magma-chamber volumes. For silicic eruptions, conservative estimates of magma-
|
||||||||||||||||||
chamber volume are ~10 times greater than those for the dense-rock equivalent (DRE) volume of silicic products erupted. For composite cones (discussed in Chapter 7), this ratio of intrusive to extrusive volumes may range from <2 to >10. In the case of basaltic volcanoes, the relationship is uncertain because these volcanoes may not have high-level crustal magma reservoirs.
Pyroclastic Rock Volumes
Pyroclastic rock volumes provide the simplest method of estimating magma-chamber volumes for eruptions of evolved magmas in many localities. Several methods can be used to calculate the volumes of pyroclastic products. Froggatt's (1982) comparison of three types of volume estimations is based on (1) mathematical models of aerial dispersal, (2) field measurements of area and volume vs thickness, and (3) measurements of crystal-to-glass ratios.
Fig. 2.5
Heat flow from a magma body beneath a silicic
caldera is modeled for situations in which the
rock is unsaturated. In such areas, the thermal
resource might be exploited by using the hot
dry rock (HDR) technology described later in
this chapter (Rowley, 1982). The light shading
denotes country rock, and the dark shading
represents caldera fill and outflow rocks
(mostly volcanic).
The first of these volume estimation methods is predicated on the general assumption that pyroclastic deposits exponentially decrease in thickness with distance from the vent if there is no significant ponding of the deposit in topographically low areas (Froggatt, 1982; Pyle, 1989). Measurements of maximum thickness (Li ) and distance over which the deposit thickness halves (rh ) are sufficient to characterize the volume of a deposit of circular isopach distribution.
where ki = [ln (2)]/rh . For deposits of elliptical distribution, one may assume a constant eccentricity (e e ) given by e e = (1-b e )1/2 , where b e = ry /rx . For this case, rh is measured along both the major and minor axes of the ellipse to give rx and ry , respectively, and ki = [ln (2)]/ry . The volume integral reflects this ratio:
The second method requires many field measurements of thickness for logarithmic plots of isopach area or volume vs thickness. These plots make it possible to extrapolate volumes of deposits for which minimum thicknesses are not exposed in the field area. For each isopach, a minimum volume is found by multiplying its thickness by its mapped area. A sum for all isopachs gives the total volume. Froggatt (1982) found that plots of log-volume vs log thickness were superior for extrapolations.
The third method was proposed by Walker (1980) to estimate eruptive volumes when a significant proportion of ash (<2-mm diameter) has been carried great distances from the vent and therefore cannot be measured in the field. This method is based on the assumptions that all crystals, being
denser than glass, fall out near the vent and that large pumices show average magmatic ratios for glass to crystals. It is possible to calculate the proportion of vitric ash missing from the deposit by measuring the crystal abundance in both ash and pumices and then determining the difference in enrichment. Walker (1981) suggested, however, that this third method may overestimate the deposit volume.
By recalculating the volumes of volcanic products, including tephra and lavas, to DRE (Vdre @ 0.6 V for tephra and Vdre @ V for lavas) and by assuming that they represent some fraction of the magma-chamber volume (for example, 0.1 for silicic volcanic fields), it is possible to obtain a measurement of the thermal resource described in Eq. (2-6). For instance, Fig. 2.6 depicts a young, silicic pyroclastic deposit for which V = 1.0 km3 . The thermal resource (Htr ) of the magma chamber (volume = 6.5 km3 ) is shown as a function of the kinetic energy of the eruption that emplaced the deposit. Assuming a conservative 1% recovery of the thermal resource, the potential electrical energy resource for this system is estimated by tapping 250°C fluids from the associated hydrothermal or hot dry rock system (discussed later). About 850 kJ/kg is available from the saturated vapor produced; if one allows for a conservative 14% turbine cycle efficiency for saturated vapor cooled to 50°C, then wells producing ~600 tons/hour would generate ~19 MWe (see Appendix D).
Heat-Flow Calculation
There is one important limitation of the simple thermal resource estimation described above: the volcanic products must be erupted from a crustal magma chamber that is sufficiently young to retain much of its initial heat. This limitation has been studied in detail by Smith and Shaw (1975; 1979) and applied to numerous volcanic fields where the volume and age of underlying magma chambers have been estimated from both geomorphological constraints (for example, caldera size, vent distribution, and volume of silicic pyroclastic deposits) and geophysical anomalies. Thus, for the 1.0-km3 pyroclastic deposit shown in Fig. 2.6, one can apply the cooling calculations of Smith and Shaw (1975) as shown in Fig. 1.5. Assuming that (1) the pyroclastic deposit age reflects the time over which the magma chamber has cooled from solidus temperatures, and (2) the deposit represents about one-tenth of the magma-chamber volume, then it follows that the deposit would have to be younger than ~10,000 yr for exploitable temperatures to exist in and around the magma chamber. This estimate is conservative even if the magma chamber has cooled as a result of hydrothermal convection in roof rocks above the magma chamber. If cooling were solely conductive, the age limit could be extended to nearly 20,000 yr.
In making a detailed estimation of thermal resource (Htr ), the thermal resource volume function (Vtr ) of Eq. (2-6) can be modeled by heat flow calculations. A first-order model assumes heat flow by conduction only, which requires solution of Fick's second law of diffusion:
for which H = the heat content or enthalpy (which is directly proportional to temperature) and k t = the rock thermal diffusion coefficient, which can be directionally and spatially dependent. Equation (2-9) can be conveniently solved with an explicit numerical procedure (Appendix E) for a variety of geometric, initial temperature, and diffusivity conditions. An approximation for convective transport is included in the numerical procedure to better estimate heat flow in areas where hydrothermal convection is important. The procedure, given in FORTRAN in Appendix E, can be adapted for personal computers. It solves thermal diffusion in two dimensions for a variety of rocks, geologic structures, and effective x and y diffusion coefficients. The problem
Fig. 2.6
Thermal resource (total heat contained in a magma body) and tephra volume are related to explosive
energy [1 Megaton (Mt) equivalent] by the conversion efficiency (e
c ) of the magma's thermal
energy to explosive energy (kinetic) during an eruption. For this plot, it is assumed that
the tephra volume of an eruption represents 10% of the magma body volume (Smith, 1979),
the magma density (r ) = 2.5 × 10³ kg/m3 , and the magma body is young enough to have a heat
content (H) = 800 kJ/kg. This example (X) depicts a volcano that recently erupted a 1.0-km3
pyroclastic deposit (at 0.65 km3 DRE) with an explosive energy equivalent of about 24 Mt
(e
c = 0.077), which represents a magma chamber with a thermal resource (Htr ) of 1.3 × 10¹⁶ kJ.
Assuming about 1% of the magma chamber's thermal resource can be exploited with ~14%
conversion to electrical energy, a geothermal plant could produce
nearly 19 MWe for 30 yr by either hydrothermal or hot dry rock methods.
for this calculation is set up in a manner similar to that outlined in Eq. (2-6). The results of this calculation give a two-dimensional representation of Vtr for any time after formation of a magma chamber. One should be cautious when using this routine to model measured geothermal gradients; the case described here is considered mathematically ill-posed because solutions may not be unique.
Figure 2.7 shows results of the above heat flow calculation for a cooling, subvolcanic pluton 2.5 km wide and 4 km below the surface. The results are compared for 100 and 200 ka of cooling, with and without a convective zone above the magma chamber. At an age of 100 ka, the two-dimensional thermal resource volume (Vtr ) within the calculated area ranges from 2 to 9 km2 (the latter value is for the model with convection). This result is based on a volume of rock with temperatures above 150°C within 3 km of the surface. From Fig. 2.7b, one can see from thermal gradients that Vtr would be slightly greater after 200 ka of heat flow. Although the convection model produces a higher near-surface thermal gradient than the nonconvective model does, the gradient can not be reliably projected to greater depths. Such modeled or measured geothermal gradients are an significant initial step in evaluating the geothermal potential of an area. Figure 2.8 plots several general types of thermal gradients and their general relationship to geothermal potential.
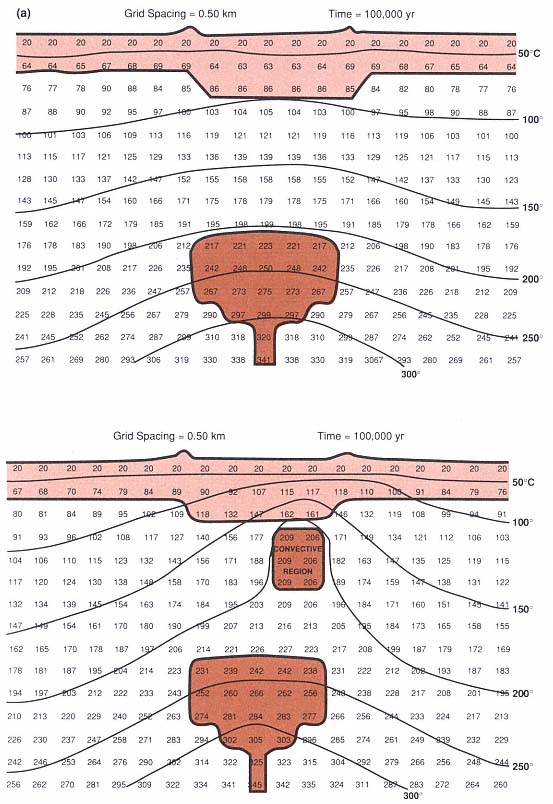
Fig. 2.7
(a) Results of heat flow calculation for a 2.5-km-wide magma body (dark shading) at a depth
of 4.0 km below a caldera filled and surrounded by volcanic rocks (light shading). This problem is
similar to that outlined in Fig. 2.5. The top plot depicts purely conductive heat flow;
the bottom plot includes the effects of a convective region (dark shading) below one side of
the caldera. The numbers in the grid show rock temperatures (°C) and temperature contours
after 100,000 yr of cooling.
Fig. 2.7
(b) Plots of calculated thermal gradients at 100 and 200 ka of
cooling compare conductive and convective gradients for locations 5 km from the caldera
and within the caldera itself. Note the high gradient for convective heat flow in the upper 1.0 km;
if projected to greater depths, this gradient would give false predictions of maximum temperatures.
Hot Dry Rock Geothermal Energy
Most of the geothermal heat associated with volcanic fields is contained in rocks some distance from zones of formation and fracture permeability. For example, the Valles caldera in New Mexico has an estimated resource base of 8,425 × 1018 J (Smith and Shaw, 1975); of that resource base, the hydrothermal component is ~90 × 1018 J. This component represents a great deal of energy, but it is only ~1% of the entire resource base (Brook et al ., 1978). In most geothermal systems associated with volcanic fields, ~95% of the thermal resource is hot dry rock; exceptions are geothermal systems in carbonate rocks where the permeability is high.
The world's very substantive hot dry rock resource can be developed if attempts to create man-made hydrothermal circulation systems are successful. The basic concept involves drilling a hole into a thermal anomaly, fracturing the rock by stimulation techniques, and drilling a second hole into the fractured rock adjacent to the first well (Smith et al ., 1975). Water is circulated down one well, percolates through the mass of hot, fractured rock, and is extracted at high temperatures from the second well. Hot dry rock experiments have been studied in several countries, but the most extensive experiments are being conducted at Fenton Hill, just outside the west rim of the Valles caldera in New Mexico. These experiments were successful with a circulation loop through fractured rock at a depth of 3 km, where the bottomhole temperature is 197°C; present experiments are testing a similar loop at a depth of 5 km in rocks with a temperature of ~320°C. New concepts being explored will develop this source of alternate energy, which is referred to as heat mining (Armstead and Tester, 1987).
If a conventional hydrothermal well penetrates high-temperature zones with no fluids, an attempt should be made to open existing pathways or create new fractures by using stimulation techniques such as pressurizing the well with pumped fluids. If this procedure does not work, a hot dry rock system can be realistically considered: the first well will have provided a great body of data about the geology and thermal regime that can be used to design a manmade geothermal system.
Water/Magma (Hydrovolcanic) Interaction: Field and Laboratory Aspects
Recognition and study of hydrovolcanic features in a volcanic field is an important step in locating and characterizing a potential geothermal resource. These features indicate not only a potential magmatic heat source but also the possible existence of groundwater. Water is generally the dominant volatile constituent in volcanic systems. It is also the chief geothermal "working fluid" because its volume changes, which occur with varying temperature and pressure, produce thermodynamic work. In this context, water is required to transfer thermal energy from the earth to the point of exploitation, whether for direct use or production of electricity. Thus, abundant groundwater is necessary for development of a geothermal resource except in cases of hot dry rock resources, where water is artificially supplied to the thermal reservoir.
Carbon dioxide is another common volatile substance in volcanic systems. Like water, it may interact with magma, but because of its phase relationships, it cannot be considered a condensible gas in most geological environments, and thus its heat-transfer qualities must be addressed separately. The presence of carbon dioxide can greatly alter water/magma interaction and the heat convection to the earth's surface.
In Chapter 1, we introduced hydromagmatism and hydrovolcanism as general terms to describe the physical and chemical
Fig. 2.8
Temperature-depth diagram depicting several thermal gradients and their corresponding influence
on geothermal gradients at the earth's surface. This diagram shows the range of typically observed
steam fields (hatched) and the near-surface perturbations of geothermal gradients that are caused
by groundwater and aquifers.
(Adapted from Rowley, 1982.)
processes that develop where magma and magmatic heat interact with ground or surface water in magmatic and volcanic environments, respectively. There are many geologic terms that refer to specific aspects of these processes, such as hydrothermal, phreatic, phreatomagmatic , and hydroclastic (see Glossary, Appendix G). In addition, the text of Fisher and Schmincke (1984) explains in detail various terms that relate to the interaction between water and magma, magmatic heat, and lava. In the following discussions, we will review the aspects of hydrovolcanism that greatly affect development of a geothermal reservoir. Hydrovolcanism, recognized for over a century, has recently been more widely acknowledged in field relationships and as a theoretical basis for interpretation of volcanic activity.
Basic Concept
Initial ideas about the role of ground and surface water in volcanism developed during the last century. These perceptions were formed particularly through observations of unusually explosive periods of Hawaiian volcanism, during which ground-water entered rifts along which normal lava fountaining had occurred (Jaggar, 1949), as well as through examination of fragmental basalts found where lava had entered water (Fuller, 1931). Three well-documented eruptions during the late 1950s and early 1960s brought an increased awareness of hydrovolcanism: Capelihnos, Azores (Tazieff, 1958; Servicos Geologicos de Portugal, 1959), Surtsey, Iceland (Thorarinsson, 1964), and Taal, Philippines (Moore et al ., 1966). Fisher and Waters (1970), Waters and Fisher (1971), and Heiken (1971) expanded the concept of phreatomagmatic eruptions characterized by steam-rich eruption columns, base surges, and typical landforms such as maars, tuff rings, and tuff cones. As a result of this work, numerous 20th century phreatomagmatic eruptions are now recognized—most of them have formed maar-like craters (for example, Self et al ., 1980). We also now realize that after cinder cones, phreatomagmatic vents (tuff rings, tuff cones, and maars) are the most abundant terrestrial volcanic landform.
An interesting paradox has emerged in studies of hydrovolcanism: interaction between magma (lava) and water can be passive, explosive, or even both in situations where all other conditions are apparently the same. This anomaly is illustrated along the southern coast of Hawaii, where in some cases lava flowing into the ocean quenched passively to form pillow lavas and in other cases it was explosively fragmented during quenching to form tephra cones along the beach (Fisher, 1968). Explanations of this paradox have benefited enormously from information derived from analog phenomena such as industrial accidents in which a molten substance such as iron has caused an explosion when it was rapidly introduced to water. This type of situation is a potential safety problem, for example at nuclear reactors (Witte and Cox, 1978). The term commonly used for the industrial analog, fuel-coolant interaction (FCI), can be applied to volcanic processes involving the interaction of two materials, one at a temperature above the boiling point of the other—where the interaction varies from passive quenching and film-boiling circumstances to explosive situations in which the two materials mix and exchange heat at catastrophic rates.
Heiken (1971) studied a number of phreatomagmatic volcanoes in southeastern Oregon and correlated the volcano morphology with abundance and depth of groundwater. As summarized in Table 2.3, characteristic volcanic landforms range from low-profiled tephra rings surrounding a wide crater to steep-sided tephra cones with relatively smaller craters. The former type are termed tuff rings (or maars if the crater extends below the level of the prevolcanic ground surface); the latter type are called tuff cones (Fig. 2.9). Sheridan and Wohletz (1981; 1983a) extended this characterization
of hydrovolcanic landforms by recognizing that they form parts of polygenetic volcanoes, such as composite cones and calderas in which characteristic tephra accumulations of tuff cones and rings may be found (see Chapter 1).
Of the various types of tephra deposits produced by hydrovolcanism, pyroclastic surge (base surge) deposits are most distinctive (Fisher and Waters, 1970; Wohletz and Sheridan 1979). The four hydroclastic-tephra bedforms illustrated in Fig. 2.10 include (a) breccias formed at the vent by explosions or in distal regions by laharic remobilization, (b) sandwaves that show a variety of dune-like bedding structures ~1 cm thick (Crowe and Fisher, 1973; Schmincke et al ., 1973), (c) massive beds that may resemble small pyroclastic flows, and (d) planar beds. In general, these tephra bedforms are deposited by pyroclastic surges, but fallout and pyroclastic flows also contribute to deposition of hydroclastic tephra. Identification of the depositional mechanisms requires careful examination of features such as those listed in Table 2.4.
Because of the variety of possible textural features found in any hydrovolcanic deposit, it is helpful to characterize the tephra facies described in Table 2.5. Some facies relationships depend on the type of vent structure; for example, facies relationships for pyroclastic surge deposits surrounding monogenetic tuff rings (Wohletz and Sheridan, 1979) include near-vent sandwave facies, massive facies at intermediate distances from the vent, and planar facies at distal portions of the deposit. In contrast, Frazzetta
|
||||||||||||||||||||||||||||||||||||
et al . (1983) showed that Vulcano, a composite cone with relatively steep slopes, has near-vent planar facies, massive facies on cone slopes, and sandwave facies at distal portions of the deposit at and beyond the base of the cone. In most cases, the positive designation of a tephra facies in hydrovolcanic deposits will require a detailed analysis of bedform textures (Fig. 2.11). Recognition of these facies relationships can help locate a buried or exhumed vent structure, as related by Crisci et al . (1981).
Wet and Dry Facies Relationships
From field observations, we have realized a significant concept about the textural relationships of various hydrovolcanic tephra deposits. Wohletz and Sheridan (1983) discuss in detail the existence of two fundamentally different types of hydrovolcanic tephra deposits: dry and wet. This designation reflects the physical state of the tephra when it is emplaced: dry deposits show little textural evidence of the presence of moisture, and wet deposits show sedimentary, textural, and diagenetic evidence of wet emplacement. Table 2.6 summarizes the field observations that help characterize these two types of deposits.
The significance of wet and dry characterization for hydrovolcanic tephra deposits will become clear during the following discussions of field relationships, theoretical eruption and emplacement models, and the development of hydrothermal systems in country rocks surrounding vent areas.
Fig. 2.9
Hydrovolcanic landform vs geohydrological environment. In unsaturated environments, basaltic
volcanism commonly produces cinder (scoria) cones by eruptions of relatively low energy.
In areas of abundant water, eruptions vaporize the fluid, which results in explosive activity and
the formation of tuff rings and cones. In deep water, extrusions of basalt are passively
quenched and form pillow lavas.
(Adapted from Wohletz and Sheridan, 1983a.)
Hydrovolcanic eruptions disperse tephra in clouds of steam. Where water is abundant, the expansion of steam occurs in the steam dome (a two-phase region), and an appreciable amount of condensed water is emplaced with the tephra. Where water is less abundant, the steam expands in its superheated region and is more readily separated from tephra during emplacement so the deposits remain relatively dry. Observations of the eruptions of Surtsey volcano illustrate this expansion process (Thorarinsson et al ., 1964). Tephra and high-pressure water vapor were erupted in plumes called "cock's tails" or "cypressoid" jets. The water vapor was not visible until it reached lower pressure after the jets had traveled several hundred meters from the vent. At that point, saturated steam was visible in the jets of tephra, indicating that it condensed in the steam dome. This steam was carried along with the tephra jets until their emplacement on the slopes of the emerging volcano. Some of the water vapor separated earlier from the jets as optically transparent, superheated steam. It later
Fig. 2.10
Four major textural types of hydroclastic deposits
produced by explosive hydrovolcanic eruptions.
Explosion breccias are typical of near-vent
tephra deposits, whereas sandwave (dunes),
massive, and planar bedded tephra deposits are
common to pyroclastic surges and flows (Wohletz
and Sheridan, 1979). Another textural type,
the laharic breccia, forms by liquefaction of these
deposits if there is an abundance of condensed
steam or rainfall.
|
||||||||||||||||||||||||||||||||||||||||
|
||||||||||||||||||||||||||
became visible as it cooled and condensed in the atmosphere, rising as billowing steam clouds above the jets.
Other observations mentioned by Wohletz and Sheridan (1983) support the hypothesis that the physical state of water/steam during eruption is determined by the mass ratio of water to magma interacting in the vent. This hypothesis has evolved as detailed studies of many hydrovolcanic vents around the world have documented the dependence of eruptive energy, tephra dispersal, and the resulting vent landform on the water:magma mass ratio (summarized earlier in Chapter 1). Figure 2.12 illustrates typical hydrovolcanic bedforms and their deduced water:magma mass ratios.
Through the interpretation of deposits, one can show that many volcanoes demonstrate cyclic eruptive behavior (Chapter 1), in which the water:magma mass ratio varies with time. Sheridan and Wohletz (1983a) noted two trends at many volcanoes. A dry trend, typically found in tuff rings, is indicated by deposits that show a decreasing abundance of interacting water with time so that final eruptions can be entirely magmatic. A wet trend is illustrated by tuff cones in which the initial eruption is magmatic and the final bursts are so wet that tephra form lahars as they are emplaced. Using the information gained from these observations, it is possible to place constraints on both the water:magma ratio during the course of an eruption and the availability of water for potential hydrothermal systems associated with the volcano.
Fig. 2.11
Pyroclastic surge facies as designated by bedform statistics. Section S-7 represents the sandwave
facies with abundant dune bedforms; U-4 is a massive facies example showing planar, massive, and
dune bedforms; S-1 is an example of planar facies with mostly planar and massive bedforms.
Section U-8 is ambiguous; after detailed analysis of bedform transitions by Markov analysis
(Wohletz and Sheridan, 1979), it is classified as sandwave facies. Bedform types are shown as
P (planar), M (massive), or S (sandwave), as defined in Fig. 2.10. Occurrences of these types are
further numbered from the base of the deposit.
(Adapted from Wohletz and Sheridan, 1979.)
Polygenetic Volcanoes and Calderas
The phenomenon of hydrovolcanism is not associated solely with eruptions at small, monogenetic volcanoes. The following descriptions illustrate the significance of hydrovolcanic processes in (a) wide-spread tephra deposits from silicic calderas, (b) the development of wet and dry cycles at composite cones, (c) the evolution of calderas, and (d) pyroclastic episodes during the eruption of domes of intermediate to silicic composition (see Chapter 5).
Taupo
The Taupo volcanic zone of New Zealand's North Island is one of the best studied examples of silicic volcanism. An important hydrovolcanic feature of this volcanic field is the extremely widespread, fine-grained silicic tephra deposits, especially those from the Taupo volcanic center (Healy, 1962; 1964).
|
||||||||||||||||||
Self (1983) presented an extensively documented account of the Wairakei eruption (20,000 ka), which produced the Oruanui Pumice Formation (Vucetich and Pullar, 1964) and the Wairakei Breccia, both of which are part of the Wairakei Formation. Self addressed the exceptionally fine grain size, wide dispersal, high content of accretionary lapilli (up to 33 wt%), and irregular thickness distribution—features that Self and Sparks (1978) noted as indicators of silicic, phreatomagmatic (Phreatoplinian ) volcanism. Figure 2.13 illustrates the stratigraphy of the Wairakei Formation, which consists of interbedded, fine-grained pyroclastic fall and flow deposits as well as two main phreatoplinian phases that were followed by ignimbritic phases. Member 1 has a median diameter of 4.0 f (0.064 mm) even near the source and is representative of the typical phreatomagmatic materials shown in Fig. 2.14.
Heiken and Wohletz (1985) described volcanic ash samples and their phreatomagmatic textures from this section. Through interpretation of tephra deposits, Self (1983) illustrated the eruption sequence and phreatomagmatic factors of the Taupo eruption (Fig. 2.15). More detailed descriptions of geothermal studies in the Taupo region are given in Chapter 4.
Vulcano
The Island of Vulcano in the Aeolian archipelago of Italy is a classic example of hydrovolcanic activity. The Fossa cone of Vulcano has been historically active and poses an ongoing hazard (Keller, 1980). Mercalli and Silvestri (1891) observed the most recent eruptive episode and described the eruption phenomena now termed Vulcanian . Frazzetta et al . (1983) built on the work of Sheridan et al . (1981) to interpret the detailed stratigraphy of the cone and show how hydrovolcanism contributed to the five most recent episodes of volcanism; their summary of the Fossa tephra stratigraphy is illustrated in Fig. 2.16. These authors further proposed that all five episodes of volcanism were characterized by a cyclic eruption pattern that consists of the four stages shown in Fig. 2.17.
(1) Initial quiet, fumarolic activity was stimulated by heat transfer from (possibly) two magmas of differing compositions that rose below the volcano.
(2) A triggering event initiated a mixing of the two magmas, which was followed by further rise of the mixed magma to the surface where it contacted ground-water. The resulting hydrovolcanic eruptions of pyroclastic surges
comprised chilled, nonvesiculated tephra that progressed from wet to dry.
(3) As the groundwater source was separated from the magma by a steam envelope, the eruptions became magmatic, expelling vesiculated tephra interspersed with the chilled tephra.
(4) The cycle's final stage is marked by eruption from the pumiceous cap of the magma and, later, extrusion of an obsidian-cored lava flow. Frazzetta et al . (1983) interpreted the products of the most recent eruptive cycle with respect to water:magma ratios, as shown in Fig. 1.22.
Fig. 2.12
An idealized hydrovolcanic deposit section
illustrating typical bedding textures and
bedforms and their inferred water:magma mass
ratios (Rm ). Initial eruptions, represented by
the basal pumice fall, involved little or no
external water; however, in later eruptions,
the stratigraphic section records bedforms
that indicate increasing water:magma ratios.
For ratios >1.0, caused by eruptions into a
standing body of water, pillow lavas/breccias
and peperites are usual, as are lahars, which
commonly occur in eruptions of high
water:magma ratios on land.
Vesuvius
The ejecta deposits of another long-active and much-studied volcano, Vesuvius, indicate that hydrovolcanic activity is significant during its eruptive cycles (Barberi et al., 1981; Rosi and Santacroce, 1983). The AD 79 eruptions of Vesuvius are among its best documented in terms of actual observations (Pliny the Younger, 1763; Radice, 1972), deposit descriptions (Sigurdsson et al ., 1985), and interpretations of eruption mechanisms (Sheridan et al ., 1981). Figure 2.18 shows representative tephra stratigraphic sections from archaeological excavations at three Roman sites that were devastated by
Fig. 2.13
Wairakei Formation tephra stratigraphy for
locations within 20 km of the vent in Lake
Taupo, New Zealand. Members 4 and 6 (m4,m6)
were previously named the Oruanui Pumice
Breccia and Wairakei Breccia, respectively.
(Adapted from Self, 1983.)
Fig. 2.14
Grain-size characteristics of the Wairakei Formation (Self, 1983). (a)Median diameter (Mdf ) ) vs sorting
coefficient (s
f ) is shown for the various members (m1,m2,..) illustrated in Fig. 2.13; also noted are
textural types, including accretionary lapilli (crushed), lithic/pumice-rich ignimbrite, and base surge.
The dashed field represents pyroclastic flows. (Adapted from Wright et al ., 1981.) (b) Grain-size
fractions for m4 and m6: the dashed field represents pyroclastic flows; coarse variant shown by
symbols. (Adapted from Walker et al., 1980.) (c) Grain diameter frequency curves for fallout products
of m2 and m6 show gradual loss of coarse products with increasing distances from the source
(curve numbers in kilometers). (d) Cumulative probability distribution of size fractions (f ) for Plinian
and phreatoplinian deposits is compared to the distribution of a representative m3 sample.
(Adapted from Carey and Sigurdsson, 1982, and Walker, 1981.)
the eruptions. Fallout deposits of white and gray pumice from early magmatic eruptions were followed by hydromagmatic products emplaced as surges, pyroclastic flows, and lahars—all containing abundant lithic ejecta derived from carbonate aquifer rocks that underline the Somma Vesuvius at a >2-km depth. Figure 2.19, the model presented by Sheridan et al . (1981), interprets the stratigraphy and illustrates the effects of hydrovolcanic activity during the devastating phases of the eruption. Accretionary lapilli, abundant in the upper portions of the tephra stratigraphy, were studied in detail by
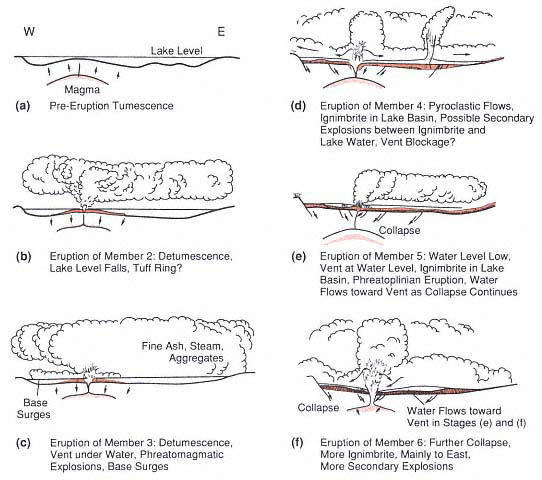
Fig. 2.15
Wairakei eruption model showing the sequential stages or eruption of the various
members and periods of lake water/magma interaction.
(Adapted from Self, 1983.)
Sheridan and Wohletz (1983b), who described possible mechanisms for their formation in wet eruption plumes.
Contrasting hydrovolcanic behavior is evident in the early-stage interaction with water at Vulcano and the late-stage interaction shown at Vesuvius. One general explanation for this contrast is the overall hydrologic setting of these volcanoes: Vulcano is an island edifice characterized by abundant near-surface groundwater, whereas Vesuvius is built on a sedimentary platform with a deep aquifer system. Access of water to the vent system at Vulcano gradually decreases during eruptive episodes as magma congeals along vent walls where water initially infiltrates. At Vesuvius, access of groundwater to the magma chamber and vent conduit is initially limited by thermal metamorphic rocks that have sealed fractures. However, as the conduit and chamber wall rocks are fractured by expansion of magmatic gases early in Plinian eruptive episodes, groundwater gains access to the magma, especially after overpressures in the magma body and conduit have fallen below the local thermally perturbed hydrostatic
Fig. 2.16
Composite stratigraphic section illustrates
the hydrovolcanic cycles of the Fossa volcano
at Vulcano, Italy. The Pietre Nere, Palizzi,
Commenda, and Pietre Cotte cycles all show
a progression from hydrovolcanic eruptions to
emplacement of lava flows.
(Adapted from Frazzetta et al ., 1983.)
pressure. The behaviors exhibited at Vulcano and Vesuvius are generally termed shallow and deep hydrovolcanic eruptions, respectively; the former becomes dryer and the latter becomes wetter as eruptions progress.
Throughout the entire Latium volcanic province of Italy, hydrovolcanism has been a vital component in the development of caldera complexes such as those of Vulsini, Vico, Sabatini, Albani, and the Phlegraen Fields. Broad, low-profile calderas with widespread, fine-grained silicic tephra characterize these volcanic areas. Because of their geothermal importance, we will describe them in detail in Chapter 4.
Petrography of Hydrovolcanic Tephra Constituents
Hydrovolcanic tephra may show aspects of both magmatic and hydrovolcanic origin; in such cases, petrographic inspection is necessary to determine the relative proportions of the two endmember processes. Fisher and Schmincke (1984) used the terms pyroclastic and hydroclastic to distinguish products of magmatic and hydrovolcanic explosions, respectively. Table 2.7 reviews the salient features of hydroclastic products.
Hydroclastic tephra are generally distinguished from pyroclastic tephra by their fine grain size. However, this distinction is not always apparent, especially in hydroclastic tephra sampled at near-vent locations where fine fractions have not been deposited. Figure 2.20 shows plots of sorting vs median diameter for four characteristic tephra bedforms produced by hydrovolcanic activity. Although these statistics are often
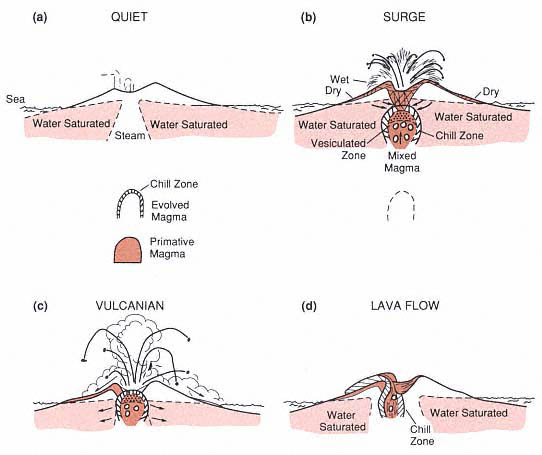
Fig. 2.17
This schematic model of typical Vulcanian eruption cycles at Vulcano is based upon interpretation of
stratigraphic successions shown in Fig. 2.14. Activity progresses from (a) quiet fumarolic emissions to
(b) magma vesiculation and surge eruptions caused by primitive magma intruding into older evolved
magma and interaction with groundwater. (c) The development of a steam chimney above the magma
reduces direct contact between water and the melt; steam explosions eject comminuted older lavas and
some pumice, producing surge and fallout deposits. (d) The final stage is marked by eruption of a
pumice fall and emplacement of a lava flow from the chilled zone of the magma body.
(Adapted from Frazzetta et al ., 1983.)
sufficient to characterize hydroclastic tephra, we advocate further analysis of size distributions by the techniques described by Sheridan et al . (1987) to separate subpopulations from the overall sample distribution. This method involves the detailed analysis of wet and dry sieve data and sample separation procedures described in Appendix A.
Constituents of hydroclastic tephra, including glass, crystals, and lithic fragments in various proportions, are sensitive to the emplacement mechanism and magma composition. Figure 2.21 illustrates the variety of tephra constituents that characterize tuff rings and tuff cones. One of the most distinguishing features of these tephra is the amount of glass alteration in samples of wet and dry hydrovolcanic facies. Basaltic glass readily alters to palagonite, a complex combination of zeolites and smectites; rhyolitic glass alters to hydrated glass, which can crystallize to fine-grained quartz, potash feldspar, and clays. Although such alteration generally occurs in any tephra deposit through weathering and diagenetic processes, stratigraphic
Fig. 2.18
Representative stratigraphy of AD 79 pyroclastic deposits exposed in archaeological excavations
along the coastal side of Vesuvius; FA = pumice fallout, FL = pyroclastic flows, and S = surges.
The basal white and gray pumice fallout was from early magmatic eruptions, and the upper
pyroclastic flows and surges are products of later hydrovolcanic eruptions.
(Adapted from Sheridan et al ., 1981.)
Fig. 2.19
Model of AD 79 Plinian eruptions at Vesuvius. This model, temporally and phenomenologically
constrained by accounts of Pliny the Younger (Radice, 1972), shows (a) the initial Plinian column
eruption, (b) the decline to intermittent magmatic and hydromagmatic explosions, and (c) the
terminal hydromagmatic phase that produced wet pyroclastic flows and surges. The beginning
of hydromagmatism, during the intermediate stage, is associated with the failure of magma
chamber walls, which added a thermally metamorphosed lithic constituent to the tephra and
allowed aquifer waters to flow into the chamber.
(Adapted from Sheridan et al ., 1981.)
information supports the conclusion that the alteration can also result when abundant hot water vapor is emplaced with the deposit.
Weathering and diagenetic effects, including the posteruptive saturation of tephra deposits by rain or groundwater, make it difficult to evaluate the timing of palagonitization and hydration; however, pertinent stratigraphic information can be useful (Fig. 2.22). Where fresh and altered tephra appear in alternating layers above the groundwater table, a strong argument can be made that alteration took place at the time of tephra emplacement. Proximity of altered tephra to a vent or fault is indicative of postemplacement alteration by hydrothermal fluids. Diagenesis below the groundwater table can be assessed for a region by determining the lateral extent of altered tephra and the presence of alteration zones that cross bedding planes.
Wet deposits can be distinguished from dry ones by the degree of glass alteration. Figure 2.23 shows that palagonitization of basaltic tephra is a function of median grain size, but for diameters <0.1 mm, palagonitization is most prevalent in samples from wet facies bedforms. This observation is not surprising if one considers the results of experiments with palagonite formation that demonstrate a strong dependence on temperature (Fig. 2.24a). Palagonitization also has a significant effect on glass chemistry; bulk chemical analysis of partly palagonitized tephra may show that its composition is considerably different than that of its parent (Fig. 2.24b).
Analyses of clast morphology by optical and electron microscope also provide important data for classifying tephra as pyroclastic or hydroclastic (Heiken, 1971; Heiken and Wohletz, 1985). Table 2.8 summarizes clast morphologies that are useful in understanding the eruptive mechanism (grain shape), transport or emplacement process (edge modification), and water abundance (clast alteration/palagonitization). Wohletz (1987) described these features for several examples of hydrovolcanic associations.
|
||||||||||||||||||||||||
Fig. 2.20
Grain sizes of hydrovolcanic tephra deposits of different bedding textures are shown by plots of
sorting coefficient (s
f ) vs median diameter (Mdf ). Whereas pyroclastic surge bedforms (sandwave,
planar, and massive) range in median diameter from 2.0 to 0.063 mm, fine-ash beds demonstrate
the intense tephra fragmentation capability of hydrovolcanism with median
diameters of 0.063 to 0.022 mm.
(Adapted from Sheridan and Wohletz, 1983a.)
Fig. 2.21
This triangular diagram of hydrovolcanic tephra
constituents shows the relative contribution of
fresh glass, altered glass, and crystal and lithic
material. Fields for tuff rings and cones reflect
the relative proportions of these constituents in
different bedforms. The greater relative
abundance of altered glass for tuff cones
attests to the greater abundance of water in
the erupting system.
Fig. 2.22
Example of stratigraphic and structural settings for altered (palagonitized and hydrated) tephra
deposits. (a) Altered tephra (cross-hatched) may exist around a vent area as a result of hydrothermal
circulation. Such alteration is relatively insensitive to tephra bedding planes, but it does not show
lateral continuity away from the vent. (b) Palagonitization and zeolitization below a groundwater
table show lateral continuity and may cross bedding planes between tephra of different
depositional character. (c) Alteration may be structurally controlled along faults through which
hydrothermal fluids have migrated. (d) However, when tephra alteration occurs rapidly during
eruption and emplacement and before cooling, the altered tephra may be intercalated with
relatively fresh tephra layers. This alteration is relatively insensitive to
the groundwater table and initial dips of the strata.
Experimental and Theoretical Aspects of Hydrovolcanism
Much of our qualitative and quantitative understanding of hydrovolcanic processes has developed from experimental and theoretical studies of the water/magma interaction mechanism. As a brief review, we summarize several studies that are applicable to geothermal energy exploration.
Results from Experiments
Water/magma interaction belongs to a broad class of physical and chemical processes termed fuel-coolant interaction (FCI). Our research has focused on applications of FCI theory to water/magma interactions, and we describe results of our experimental studies that bear upon interpretation of hydrovolcanic products.
In their experiments, Wohletz and McQueen (1984) and Sheridan and Wohletz (1983a) used thermite as a basaltic magma analog because it readily fit experimental requirements. The thermite reaction (Fe3 O4 + 8/3Al « 4/3Al2 O3 + 3Fe + heat) produces a molten mixture of crystals and liquid at temperatures in excess of 1000°C; the viscosity and density are similar to that of basaltic magma. The molten thermite was brought into contact with water within several different pressure vessels that were constructed in such a way that variations of
Fig. 2.23
Percent of glass palagonitized vs median grain size for hydroclastic tephra. Trends are shown for
bedforms in both tuff rings and cones. In general, there is a decrease in palagonitization with
decreasing grain size, except in the case of massive and planar bedforms in tuff rings. This trend
reflects the decrease in porosity as a function of grain size; however, anomalous tuff ring samples
point to the likelihood that massive and planar bedforms are typical of wetter eruptions.
pressure, temperature, and interaction energy (Buxton and Benedict, 1989) could be quantified (Fig. 2.25).
The pulsating ejection of fragmental debris, which ranged from passive to explosive, was studied for a variety of water:thermite mass ratios, interaction pressures, and contact geometry. Figure 2.26 summarizes these experiments, which could be interpreted as analogs to volcanic activity. One interesting observation was that the water:magma mass ratio was a dominating factor of the interaction phenomena. By quantifying the energy of the interaction as a ratio of measured mechanical energy to initial thermal energy (Fig. 1.21), Wohletz and McQueen (1984) developed Fig. 2.27 to summarize the spectrum of hydrovolcanic activity.
Fig. 2.24
(a) Thickness of palagonite skin on basaltic glass
samples as a function of alteration time at
different temperatures. The rapid increase in
alteration with temperature argues that at high
temperatures (several hundred degrees), glass
alteration to depths of several micrometers may
take place in minutes or less.
(Adapted from Furnes, 1975, and Moore, 1966.)
(b) Chemical variations between basaltic
glass and palagonite samples are normalized
to titanium accumulation. Dashed lines
indicate idealized chemical losses expected from
passive gain of TiO2 , which increases with
palagonite maturation. Data for glass/palagonite
pairs from submarine alteration (

conditions (

exchange of major element oxides
with H2 O and K2 O.
Grain sizes of fragmental debris from these experiments show a strong relationship to explosive energy: with more efficient interaction between water and melt, finer explosion debris (experimental tephra) is produced (Fig. 2.28). By assuming simple conductive heat transfer between the melt and water, it is possible to make some interesting predictions about hydrovolcanic activity. Figure 2.29 shows the quenching time for tephra as a function of median diameter. By assuming that conductive heat transfer in these experiments reflects the more complicated process that occurs in nature, one may infer from hydrovolcanic bedforms some aspects of the energetics of eruptions that produced the tephra. For example, tephra deposited as sandwave
beds likely resulted from more explosive interactions than those that produced other bedforms.
Size and shape studies of experimentally produced tephra have also provided some insight into the mechanisms by which magma and water come into close contact—a necessary condition for the explosive exchange of thermal energy. Wohletz (1983) used inferences from grain-shape analysis to describe some of these mechanisms, many of which are driven by dynamic instabilities that grow at interfaces between the magma and water. These instabilities develop from differences in density, surface tension, viscosity, and the relative velocity of the water and magma. Growing instabilities, caused by rapidly fluctuating steam-film jackets at the water/magma interface, mix the two and gradually fragment the magma. This quasistable mechanism increases the contact surface area between magma and water, and the subsequent heat transfer is enhanced to rates that can sustain an explosion.
Some of the characteristic grain shapes of experimental tephra shown in Fig. 2.30, including blocky shapes, irregular and convoluted fluidal shapes, spheres, ribbons, and shell-like shards, can be used to interpret interaction and mixing mechanisms.
Because chemical alteration of tephra is a characteristic feature of hydroclastic products, Taylor and Wohletz (1985) conducted experiments to investigate the chemical processes in hydrovolcanism. An interesting but perhaps not surprising aspect of these experiments concerned oxygen isotope exchanges. Like magma, thermite is relatively rich in heavy oxygen (d 18 O @ 160 /00 ). During interactions between thermite and water typical of the meteoric composition of groundwater (d 18 O @ -120 /00 ), Taylor and Wohletz expected that some exchange of the oxygen isotopes would deplete the 18 O composition of the experimental tephra (based on previously measured diffusion constants of 10-4 to 10-9 cm2 /s); however, results (shown in Fig. 2.31) revealed considerable depletion of 18 O. These results indicated an exchange of up to 30% of the oxygen in the thermite—a very dynamic chemical reaction considering the length of the experiments (several seconds or less).
As discussed by Heiken and Wohletz (1987), enhanced oxygen isotope exchange can be expected for water/magma interactions in which the surface area of the magma is increased by many orders of magnitude. The behavior of oxygen suggests that other ionic species may also diffuse at effectively high rates, rapidly altering the chemical composition of finely fragmented magma during a
|
|||||||||||||||||||||||||||
Fig. 2.25
Five experimental designs were used by Wohletz and McQueen (1984) to simulate hydrovolcanic
activity with a thermite (Al2 O3 + Fe) magma analog: (a) sand burial, (b) confinement, (c) water box,
(d) central vent, and (e) bottom vent (lift-off). The basic design promoted contact of molten thermite
with water within a confined vessel after the thermite melted through the aluminum partition that
initially separated the two. A burst valve, designed to fail when pressure exceeded a specified limit,
allowed venting of the high-pressure steam and fragmented thermite. Pressure transducers recorded
vapor production in the vessel, and high-speed cinematography documented
the ejection of fragmented melt through the vent.
Fig. 2.26
In this summary of hydrovolcanic experiments, four basic interaction phenomena, consisting of melt
fountaining, unsteady blasts, steady production of steam and ejecta, and the nonexplosive quenching of
melt into globular shapes (blobs), are correlated to volcanic activities and the water:melt mass ratio (Rm ).
(Adapted from Wohletz and McQueen, 1984.)
hydrovolcanic eruption and thereby producing altered tephra deposits. Studies by Hildreth et al . (1984) and Lipman and Friedman (1975) documented such behavior in large silicic systems during caldera-related eruptions. Smith (1988) found that fresh, pumiceous samples of postcollapse rhyolite of the Long Valley caldera, California, show d 18 O @ 00 /00 , in contrast to +6.7 to +7.40 /00 values for obsidian, which are typical of most unaltered volcanic rocks. This result indicates about a 33% exchange of oxygen between meteoric water and the rhyolite in the formation of pumice—a conclusion supported by field evidence of a gas-rich and relatively low-viscosity extrusion. A conclusive piece of evidence for the hydrovolcanic origin of tephra is their oxygen composition if they are not affected by weathering and diagenesis.
Fig. 2.27
Scaled kinetic energy relative to the initial melt thermal energy is shown as a function of
water:magma mass ratio. Ranges are indicated for Strombolian, Surtseyan (hydrovolcanic), and
submarine activity as well as for corresponding landform and deposit bedforms.
(Adapted from Wohletz and McQueen, 1984.)
Predictions Based on Theory
It is evident from our experiment results that one can employ theoretical physics to make accurate predictions for hydrovolcanic explosions (for example, Buchanan, 1974). One prediction that is strongly supported by the energy measurements shown in Fig. 1.21 is the relationship of explosive energy to water:magma mass ratios. In Chapter 1, we outlined a method for quantifying explosive energy that is based on thermodynamics: the method assumes that magma and water reach thermal equilibrium before explosive expansion of the water. By using a temperature-entropy diagram (Fig. 2.32), one finds that—depending upon the temperature and entropy of the initial equilibrium point—expansion of water can follow one of several thermodynamic paths. The most complex of these paths occurs during its expansion, when water maintains a temperature similar to that of the hot magma fragments. In this case, the simple isentropic expansion of water is not followed; instead expansion has a strong isothermal component that is determined by the mass ratio of magma fragments entrained and in thermal contact with the water during expansion.
As is shown in Fig. 2.32, expansion of a high-pressure mixture of water and magma may take place in the steam dome, the
Fig. 2.28
Log efficiency (the ratio of steam mechanical energy to melt thermal energy) as a function of the
median grain diameter in fragmented melt. Small-scale (several grams of melt) laboratory
experiments (
and coarser grain sizes than large-scale (100 kg of melt) experiments (hatched) performed
by Wohletz and McQueen (1984). Data fall within theoretical ranges of heat flux to steam from
thermite melts (bold lines). Maximum measured laboratory heat fluxes (Buchanan, 1974) indicate
resulting grain diameters between 0.125 and 0.004 mm.
Fig. 2.29
Log reciprocal cooling time vs grain diameter
and log specific surface area. The shaded area
represents times predicted by conductive cooling
models; the circular fields show ranges of median
grain diameters for common hydrovolcanic
bedforms: F = fallout, P = planar, M = massive,
and S = sandwaves. Median grain diameters for
magmatic eruptions are commonly in the lapilli
range, and the onset of vapor-explosion
decrepitation of grain size is idealized near grain
diameters of 1.0 mm.
(Adapted from Wohletz, 1983.)
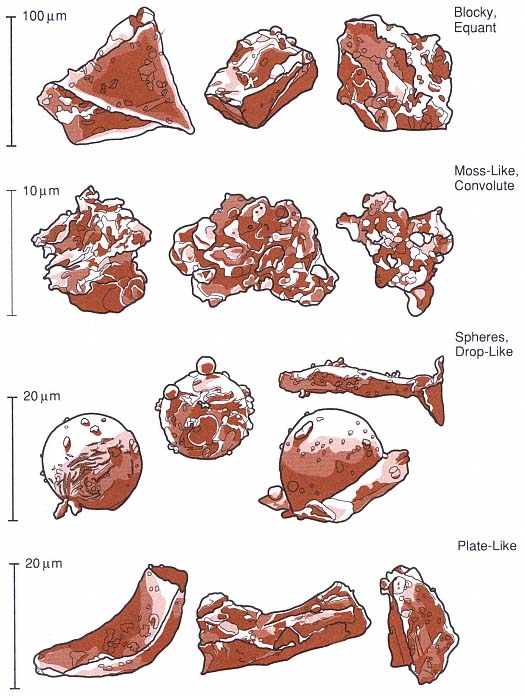
Fig. 2.30
Sketches of four types of grain shapes observed during experiments in hydrovolcanism. Blocky and
plate-like grains are thought to be produced by brittle failure of the melt when it is subjected to
strong stress waves. Moss-like, drop-like, and spherical grains are likely produced by fluid
instabilities at water/melt interfaces:
(Adapted from Wohletz, 1983.)
Fig. 2.31
Oxygen isotopic ratio [Eq. (1-10)] vs Rm
(water:melt ratio) shows the strong depletion
of heavy oxygen (18 O) observed in experimental
products (

with water (
that if the oxygen isotope ratio can be confidentially
measured for hydrovolcanic materials, Rm can be
constrained. However, the effects of
weathering and the temperature at which
isotopes are exchanged in volcanic products
can complicate isotope measurements.
(Adapted from Taylor and Wohletz, 1985.)
superheated steam field, or both. Expansion within the steam dome (saturated) results in wet-steam explosions, which are of lower energy than those in the superheated field. Wohletz (1986) showed that for saturated expansions, the steam fraction (x2 ) of the ejected water in the eruption (which forms eruption columns and pyroclastic flows and surges) is calculated by
where xe = the steam fraction at initial thermal equilibrium, Te = the temperature of that equilibrium [Te = (mw Cvw Tw + mm Cm Tm )/(mw Cvw + mm Cm )], mw and mm = the mass of water and magma, respectively, Cpw and Cvw = water's specific heats at constant pressure and constant volume, respectively, Cm = the magma specific heat, T2 = 373 K (assuming saturated expansion to
Fig. 2.32
Temperature-entropy diagram for vapor expansion in hydrovolcanic eruptions. From
its initial state (

it is in thermal equilibrium with magma. With decompression, the water expands
along one of several paths, maintaining thermal equilibrium with fragmented magma,
to its final state (

liquid, two-phase (2f ), and vapor fields are indicated, as are points a'[where a super-
critical water and tephra mixture expands into the two- phase (steam dome) field] and
b' [where the mixture expands out of the two-phase field into the superheated steam
(vapor) field]. The four expansion paths shown constrain the amount of magma heat
converted to steam expansion work; these paths are determined by the initial water:
magma mass ratio. (Adapted from Wohletz, 1986.)
1 bar), and Hlv = the enthalpy of water vaporization. For superheated expansions, the final temperature (T2 ) is given by
where f = (mw Cpv + mm Cm )/mw R, R = the gas constant, and expansion occurs from the initial pressure of thermal equilibrium (pe ) to p2 = 1 bar (atmospheric) pressure.
In practice, one finds that expansion might proceed from the superheated field into the saturated field—or the reverse—making the calculation more complicated. The conversion efficiency or ratio (e c ) of the magma's thermal energy to explosive kinetic energy (the explosive efficiency) is found by dividing
the change in the water/magma mixture's internal energy (D Umix ) by the magma's initial thermal energy [mm Cm (Tm -298)], where
for superheated expansion, xe = x2 = 0.0 and Vlv = the volume change from liquid to vapor. This calculated value gives the maximum theoretical efficiencies for the semi-isothermal cases (Wohletz, 1986) of water expansion, in which the expanding water maintains the same temperature as the entrained pyroclasts. Figure 2.33 shows a plot of those efficiencies as a function of water:magma mass ratios (logarithmic) in which maximum explosive efficiencies are reached where ratios are between 0.1 and 1.0 (about equal volumes of water and magma). Figure 2.33 also provides a comparison of this efficiency curve in which the mass fraction of water condenses from the expanding mixture (1-x2 ). It is apparent that for eruptions of maximum energy, all water is converted to superheated steam, but with increasing amounts of water, energy gradually decreases and saturated liquid content rises sharply. For mass ratios >2.0, eruptions are very wet and most of the high-pressure vapor condenses to liquid as pressure decreases to atmospheric levels. At that point, the erupted tephra, usually wet and sticky, forms lahars during emplacement.
Building on the theoretical arguments of Colgate and Sigurgeirsson (1973), Wohletz (1986) described how growth of what are termed Rayleigh-Taylor and Kelvin-Helmholtz instabilities controls the heat transfer rates and grain sizes of magma fragments during hydrovolcanic eruptions. The interface between water (liquid and vapor) and magma can be unstable if the lighter fluid accelerates toward or across the heavier one. In the case of Rayleigh-Taylor instabilities, when the interface becomes perturbed, wavelets grow in amplitude (h t ) with time as h t = cosh(na t), where na is a function of acceleration, wave number, fluid densities, surface tensions, and viscosities. This instability growth occurs only when the wavelet size is greater than a critical wavelength (l crit ; Bellman and Pennington, 1954):
where s s = the surface tension of the magma, a = the acceleration of the water toward the magma surface (imparted by collapse of a vapor film), and r w and r m = the water and magma densities, respectively. If a spectrum of l larger than l crit grows and detaches to form magma fragments, the most abundant fragment sizes are Ö 3 l crit , and a characteristic bell-shaped size-frequency distribution results.
After an initial period of instability during which water and magma are mixed, vapor explosion may occur by superheat vaporization (Fauske, 1973) or thermal detonation (Fauske, 1977; Board et al ., 1975; Rabie et al ., 1979). Superheated water may remain in a metastable state until it attains its spontaneous nucleation temperature at ~570 K (Reid, 1976). After heat transfer raises the water temperature to that point, homogeneous vaporization causes a spontaneous vapor explosion. In the case of thermal detonation, a shock wave propagating through the coarsely mixed magma and metastable water leaves a fine fragmentation of magma and sudden vapor expansion in its wake; this sequence of events is analogous to classical Chapman-Jouguet detonation (Courant and Friedrichs, 1948).
During thermal detonation, the shock wave differentially accelerates the water and magma phases and fragments the magma in proportion to the relative velocity (urel ) between the two phases. For a particular combination of density, initial magma fragment size, drag coefficient, and surface tension, the differential acceleration causes magma fragmentation in less time than is
Fig. 2.33
Theoretically calculated condensed water fraction and maximum isothermal efficiencies vs Rm .
The fraction of initial water that condenses to liquid after magma/water interaction increases with
Rm,, and at Rm = 3.0, little or no steam remains after interaction with magma and
expansion to atmospheric pressure.
required for the two phases to reach velocity equilibrium. If this situation occurs, the detonation is sustained; however, several factors can mitigate this process, including divergence of the shock wave, mixture inhomogeneities, and reflected waves. Wohletz (1986) approximated final magma fragment sizes (rm ) resulting from thermal detonation during water/magma interaction as
for which urel is predicted by Chapman-Jouguet theory (Landau and Lifshitz, 1959) and D Rm is the absolute value of the difference between the water:magma mass ratio and its optimum explosive ratio (~0.3). In general, both the fluid instability/superheating and thermal detonation theories predict the fine grain sizes observed in hydrovolcanic tephra (Fig. 2.20).
The tephra deposit textures of dry and wet surges, pyroclastic flows, and lahars strongly depend on the wetness of erupted materials. Figure 2.34 is a plot of the water volume fraction of hydroclastic deposits as a function of the initial mass ratio of water interacting with magma during the eruption. The plotted curve is based on the assumption that all condensed steam is emplaced with the tephra. Eppler (1984), Pierson (1986), and Arguden and Rodolfo (1990) recently reviewed lahar formation with specific attention to the tephra deposit water contents required. Where the pore water content of deposits increases beyond 20 to 30% by volume, tephra deposits are very cohesive and can maintain the steep bedding planes typical of wet surge deposits. If deposit water content nears saturation (within a few percent of total pore space—50 to 60% by volume), tephra deposits behave like a Bingham fluid and move as lahars (Eppler, 1984). This behavior is predicted for hydroclastic tephra that are produced by eruptions whose water:magma mass ratio is >1.0. Because a great deal of steam can separate from the tephra in the eruption plume before tephra emplacement, the Rm values on the x-axis of
Fig. 2.34
Volume fraction of liquid water in tephra deposits of hydrovolcanic origin as a function of Rm .
Where Rm is <0.4 deposits are dry; where Rm is >0.4 but <1.0, deposits are wet and very cohesive;
and where Rm is >1.0, tephra deposits can contain enough liquid water to behave like lahars.
Fig. 2.34 are the minimum required for the observed tephra deposit texture.
Because the steam formed during hydrovolcanic eruptions progressively decompresses, cools, and condenses during tephra emplacement, tephra in flows and surges become wetter with increasing runout distance (time) from the vent. Whereas most dry, superheated steam might separate from tephra during emplacement of surges and flows, saturated steam gradually condenses on individual pyroclasts; therefore, tephra emplaced with saturated steam is likely to become wet and sticky—as field observations verify. This hypothesis suggests that some hydroclastic tephra deposits might show facies changes with increasing distance from the vent: dry surges near the vent, wet surges at intermediate distances, and lahars in distal parts of the deposit. This facies distribution and the corresponding runout distance of tephra deposits should be sensitive to the wetness of the eruption and the water:magma mass ratio. At one extreme, dry eruptions are expected to produce surges and flows of dry facies types over the total runout distance; at the other extreme, very wet eruptions, such as those observed at Surtsey, might expel laharic tephra.
To evaluate this wet/dry facies hypothesis, we calculate the temporal change in water vapor density with expansion—from an initial high-pressure, high-temperature state (denoted by the subscript e in above calculations) to saturated or superheated steam at atmospheric pressures. This change in water vapor density is further promoted by the cooling that occurs as surges or flows entrain cold air. From the continuity equation, we write:
for one dimension (r) in which r g = the water (liquid or gas) density, ve = the ejecta
velocity, and t = time. The approach taken to solve Eq. (2-15) is analytical to make use of as much field data as possible. We calculate the first term (the temporal derivative) on the left side of this equation by using the chain rule to evaluate four related derivatives. A solution for mass conservation is achieved when the product of these derivatives is balanced by the value of the second term (the advective derivative) in this equation.
A numerical procedure was written to calculate the solution for various initial mass ratios, erupted volumes, and runout conditions. The runout is based on energy line approximations (Sheridan, 1979; Malin and Sheridan, 1982); initial velocities are constrained by the collapse height of the erupted column or, in the case of blast eruptions, the multiphase sound speed of the steam/tephra mixture (Kieffer and Sturtevant, 1984). The partial derivatives required for the temporal term of Eq. (2-15) include
In the expressions of these derivatives, r b and r p = the bulk density of the pyroclastic flow (or surge) and particle densities, respectively; q p = the particle volume fraction; the gas density = r g = (r b - q p r p )/(1 - q p ); a and vo = the flow acceleration and initial velocity, respectively; and rr = the radial runout of the flow (rf = the final runout distance), which is dependent on the flow volume (V). The flow volume is, in turn, temporally dependent upon ideal behavior of the gas, for which pVg = t = constant; g = the isentropic exponent that varies with q p (Kieffer and Sturtevant, 1984); and p is assumed to decrease linearly with time.
Equation (2-16) models the expansion of gas as a function of q p : the gas attains atmospheric pressure as q p increases to a level at which grains are in continuous contact (q p = 0.6). Equation (2-17) models the radial increase of q p , as discussed in Wohletz and Sheridan (1979) and as numerically modeled by Valentine and Wohletz (1989). The radial runout distance of the flow is given as a function of flow volume in Eq. (2-18); r b cannot be greater than 1.5 Mg/m3 . Finally, the flow volume shown in Eq. (2-19) is an expanded differential form of the ideal gas equation.
The product of [Eqs. (2-13) through (2-16)] can be integrated with time for solutions converging to equal -¶r g ve /¶ r (note: ¶r g ve /¶ r = ¶r g /r g ¶ r + ¶ ve /ve ¶ r) for continuity. The results of such an analysis are considered only semiquantitative, but they provide a conceptual model for water vapor condensation in a pyroclastic flow or surge. Figure 2.35 illustrates the results for pyroclastic flow deposits of 1 and 10 km3 volumes. This model has only been field tested qualitatively, and two important assumptions are implicit in the above analysis: (a) the bulk density of the flow or surge is always dependent upon the local water (liquid/vapor) density, which ignores depositional effects, and (b) q p decreases from a minimum near the vent to a maximum of 0.6 at the distal reaches of the deposit.
Fig. 2.35
Conceptual results of condensation calculations, based upon solution of Eqs. (2-16) through (2-19),
depict the runout distances of tephra deposits of 1- and 10-km3 volume from respective
vents of 0.1- and 0.5-km diameter as a function of Rm . The transitions from dry to wet to laharic
deposits occur at varying distances from the vent, depending on the amount of steam
that cools and condenses within pyroclastic flows and surges.
The preceding discussions have outlined some of the predictions theory provides for water/magma interaction. Water: magma ratios are strongly tied to the energy of hydrovolcanic eruptions and are manifested by volcanic landforms, the degree of tephra dispersal, tephra grain sizes and alteration, and textural features of deposit wetness. Quantification of these manifestations serves to constrain the thermal energy and water abundance in a volcanic system. These factors are fundamental criteria for evaluating the likelihood that a geothermal system has developed within and/or near a volcanic area. The following discussions illustrate geothermal applications of hydrovolcanic theory.
Geothermal Importance of Hydrovolcanism
Field, experimental, and theoretical aspects of hydrovolcanism profoundly influence our understanding of the development, location, and nature of geothermal reservoirs in volcanic fields. Tephra stratigraphy, bedform analysis, and grain size and textures are pertinent geological information that can be interpreted to help determine the hydrologic conditions in a volcanic field. Detailed petrographic analyses of lithic constituents in the ejecta can also reveal the nature of the stratigraphic and thermal regime below a volcano; some examples of geothermal studies in Italy provide excellent documen-
tation of the ways pyroclastic rocks have been employed to locate hydrothermal reservoirs. Finally, with knowledge of basement stratigraphy and aquifer locations, the theory of hydraulic fracture can be developed to show how a secondary permeability developed in basement rocks allows convection to prolong the transfer of residual magmatic heat to aquifers.
Tephra Stratigraphy: Geometry and Depth of Reservoir Rocks
The availability of groundwater and its depth have significant influence on the stratigraphy of hydrovolcanic tephra deposits (Heiken, 1971; Barberi, 1985; Barberi et al ., 1988). In general, where drilling information has located aquifers in volcanic fields, the aquifer depth can be correlated to types of volcanic eruptions. Figure 2.36 shows a hypothetical basin in which the aquifer is shallow or nonexistent at its margins and located at great depth near the basin's center. Eruptions of basic magma through the shallow aquifer form monogenetic structures such as single maars or tuff rings; the aquifer is gradually depleted until eruptions are no longer explosive. The magma then tends to congeal in the conduit, which eventually stops activity. If magma intersects a deep aquifer, it interacts with water under greater pressures; this delays the formation of vapor until the mixture approaches the surface, where it forms frothy ejecta that erupts in a Plinian fashion. The deep mixing does not deplete the aquifer, so repeated eruptions can occur before the magma solidifies. The surface expression of such hydrovolcanism might be a caldera complex with numerous
Fig. 2.36
An idealized cross section of a basin in which magma has erupted through rocks of varying
saturation. Where aquifers are shallow, monogenetic landforms such as single maar craters
probably form. However, if the aquifer is deep enough to surround a magma chamber, prolonged
interaction between the magma and water produces polygenetic landforms such as calderas with
numerous tuff rings and cones. In contrast, at locations where magma erupts without interacting
with an aquifer, lava flows and cinder (scoria) cones are the usual volcanic landforms.
tuff rings and tuff cone structures (however, we emphasize the fact that not all calderas are related to hydrovolcanism). Where erupting magma encounters no groundwater, activity is confined to lava-flow emplacement and perhaps some Strombolian scoria cone eruptions.
In shallow hydromagmatic eruptions (interaction within several hundred meters of the surface), the characteristic eruption shown schematically in Fig. 2.37 develops. The idealized stratigraphy illustrated in Fig. 2.38 reflects a gradual decrease in the amount of water interacting with the magma. With initial abundant water supplies (water:magma ratio >1.0 by mass), hydroclastic eruptions might begin with phreatic bursts that produce mud slurries, lahars, and peperite deposits. As the eruption progresses, less water feeds the rising magma (water:magma ratio @ 0.5 to 1.5), and discrete explosions of wet steam and tephra deposit cool, wet pyroclastic surges. Later the water:magma ratio reaches levels (water/magma < 0.5) appropriate for very energetic eruptions of superheated steam and tephra that produce highly inflated, hot and dry pyroclastic surges capable of depositing sandwave beds. Final eruptions deposit fallout tephra and lava flows as the water supply is cut off from the magma conduit.
Deep hydromagmatic eruptions (interaction at depths from several hundred meters to several kilometers) follow a different pattern; the one described here develops a Plinian eruption sequence. Figure 2.39 depicts a Plinian eruption conduit passing at depth through an aquifer and displaying a magma fragmentation level that is receding down the conduit with time. Barberi (1985) hypothesized that in this eruption water/magma interaction will not begin until the fragmentation level has receded below the depth of the aquifer and conduit pressure falls to values less than hydrostatic. Before this stage, overpressure in the conduit is greater than hydrostatic so aquifer water does not flow into the conduit; however, after the fragmentation level passes through
Fig. 2.37
When magma erupts through a shallow aquifer (dots), the aquifer is quickly depleted;
consequently, the eruption becomes dryer in character and forms monogenetic,
maar-tuff ring structures.
the aquifer, pressure in the conduit may fall below hydrostatic and water/magma interaction will begin. Proof of this hypothesis depends upon whether the aquifer water is really at hydrostatic pressure and whether the erupting gas-pyroclast mixture above the fragmentation level has a pressure gradient below hydrostatic.
Delaney (1982) demonstrated that when saturated rocks are heated by nearby magma, pore pressures increase sufficiently to drive hydrologic flow in the direction of least resistance (see Table 2.9). In cases where the magma is more permeable than the aquifer, the heated pore water might be forced into the magma. This hypothesis fits many observed tephra sequences in areas where information is available from drilling (Barberi, 1985; Barberi et al ., 1981). Barberi (1985) illustrated his model for deep water/magma interaction with a series of diagrams that
Fig. 2.38
This idealized depositional sequence for a shallow hydromagmatic eruption shows tephra
deposits of decreasing water abundance; such an eruption may end in solely magmatic
eruptions of pumice, scoria, or lava.
(Adapted from Barberi, 1985.)
Fig. 2.39
In deep hydromagmatic eruptions, strong magma interaction with a deep aquifer begins after
the fragmentation surface recedes down the conduit to the depth of the aquifer. Decreased
gas pressure in the conduit above the fragmentation surface allows pore pressures in the aquifer
to drive water into the conduit. At right, the sequence of eruption styles is correlated with
the gradual migration of the fragmentation level (expansion waves) down the conduit.
(Adapted from Barberi, 1985.)
|
||||||||||||||||||||||||||||||||||||||||||||||||||||||||||||||||||||||||||||||||||||||||||
show the progression from a Plinian over-pressured eruption column (Kieffer, 1984a, 1984b) to a pressure-balanced eruption column to a Phreatoplinian eruption phase; during this process, the fragmentation level in the conduit has receded to the depth of the aquifer (Fig. 2.40).
Figure 2.41 illustrates the idealized tephra depositional sequence from a deep hydrovolcanic eruption. Initial tephra deposits are magmatic Plinian pumice falls that blanket topography. At the intermediate stage, the eruption enters its hydrovolcanic phase (Phreatoplinian), which is marked by surge and blast deposits filled with lithic fragments from the aquifer. The final stage is characterized by emplacement of pyroclastic flows that may show many features similar to those of wet surges (such as accretionary lapilli). It is possible for the pyroclastic flow stage to be marked by periods of dry and wet expulsions of tephra that feed the pyroclastic flows, so some parts of the deposit may show entirely dry products and others may show more influence of water/magma interaction. An example of such behavior can be interpreted from the pyroclastic flow and surge deposits of the Laacher See volcano in Germany. The repeated phreatomagmatic depositional cycles found by Fisher et al . (1983) within the pyroclastic ejecta at Laacher See are attributed to varying degrees of water/ magma interaction. The degree of water/ magma interaction in our present interpretation is a function of the fragmentation level depth in the conduit: when it fluctuates above and below an aquifer, eruptions cycle between wet and dry.
Pyroclastic rocks can be used to interpret the geometry of aquifer rock units at depth below a volcanic field, as is depicted in Fig. 2.42. In this hypothetical case, the aquifer rocks are a potential geothermal reservoir. A crescent-shaped caldera wall is exposed on one side. The caldera-forming pyroclastic flow shows two major facies: (a) a coarse-grained tuff with pumiceous and a few lithic fragments in the northern portions of the outflow sheet, and (b) a fine-grained lithic-rich phreatomagmatic (hydrovolcanic) tuff in the southern portions of the outflow sheet. Tuff ring and cone vents are found along part of the caldera wall and along fault trends that extend southeasterly out of the caldera. In addition, lava flow vents are evident outside the caldera in the outflow sheet. Using the distribution of hydrovolcanic products, it is possible to infer the geometry of a saturated basement rock unit. Apparently, the caldera erupted at the intersection of an east-west fault structure and a northwest-southeast-trending one. Ring vent eruptions to the north of the fault were dry and dispersed magmatic products northward; eruptions south of the fault must have involved water from the aquifer to produce hydrovolcanic eruptions that dispersed phreatomagmatic tephra southward. The limits of this saturated reservoir rock can be further constrained along the northwest fault trend between the smaller hydrovolcanic vents and those that extruded lavas. Examples of such interpretations from the Sabatini and Albani volcanic fields of Italy are described in the following section.
Summarizing hydrovolcanic eruption sequences and aquifer depths, Fig. 2.43 is a plot of the water:magma ratio as a function of median tephra grain size. Very fine grained tephra deposits are an earmark of hydrovolcanic activity; theoretical arguments supported by field observations have determined that the finest grain sizes correlate to water:magma rations near 1.0, which are best suited for development of economically significant hydrothermal systems. Further support for this argument is developed in the following sections, which discuss such features as country rock fractures and thermal regimes—information that can be derived from detailed analysis of the lithic fragments contained in tephra deposits.
Fig. 2.40
Sequences of pressure gradients around the conduit for a Plinian eruption involving a deep aquifer. (a) Initial
eruptions are highly overpressured at the vent, causing blast conditions that involve both a
supersonic jet with a Mach disk structure (Kieffer, 1984b) and the eruption of ground surges.
(b) As the fragmentation level recedes down the conduit, the transition from a choked, sonic-speed flow
(M » 1) to one at supersonic speed (M > 1) occurs at depth, allowing eruption of a jet near atmospheric
pressure and development of a Plinian column that produces fallout deposits. For these first two eruption stages,
conduit pressure (dotted line) is greater than hydrostatic, which precludes the flow of much water from
the aquifer into the conduit. Wherever the conduit pressure is greater than lithostatic, conduit erosion will
add lithic fragments from that stratigraphic level to the erupted mixture. (c) When conduit pressure falls
below hydrostatic, water from the aquifer mixes with the magma to produce deep-seated hydrovolcanic
eruptions; abundant lithic fragments from the aquifer rock are emplaced in pyroclastic flows and surges from
a now-collapsing eruption column.
(Adapted from Barberi, 1985.)
Fig. 2.41
Idealized stratigraphy of deep hydromagmatic
eruption products, showing transitions from
early magmatic eruption of pumice fallout to
intermediate stages of hydromagmatic eruptions
of surge blasts to dry or wet eruptions of
pyroclastic flows (with accretionary lapilli).
(Adapted from Barberi, 1985.)
Lithic Ejecta: An Important Geothermal Prospecting Tool
Lithic ejecta can provide information about the (a) subvolcanic stratigraphy, (b) aquifer depth and physical properties, (c) aerial extent of the fluid reservoir in a volcanic region, and (d) chemical and thermal regime of rocks at depth. An in-depth study (for example, Barberi et al ., 1988) involves the collection of tephra samples, petrographic microscopic point counts of lithic constituent abundances, comparisons of the abundances with the stratigraphic position in both the tephra deposit and the regional rocks, and x-ray analyses of alteration assemblages found in lithic fragments.
Figure 2.44 schematically illustrates a hydrovolcanic eruption upward through a varied stratigraphic section that consists of three principal rock units. The interaction of water and magma occurs in aquifer rock unit 2, and subsequent eruptions excavate rock unit 1. Through analysis of the resulting tephra deposit, depicted in Fig. 2.45, the basement stratigraphy can be reconstructed. In this case—an eruption sequence that becomes wetter with time—the lowest tephra units contain mostly lithic fragments from the upper rock unit (unit 1) because it is excavated as the crater is formed. Later magmatic pumice-fall units might contain a small percentage of lithic fragments (< 10% by volume); lithic fragments from the deepest unit (unit 3) are most abundant because that unit is fractured by magma intrusion. When the hydrovolcanic dry eruption begins, lithic abundances increase by 5 to 20 vol%; those from the aquifer unit (unit 2) nearly equal those from the other two stratigraphic units combined. Final, wet eruptions produce the greatest abundance of lithic fragments (10 to 50 vol%), most of which are from the aquifer unit.
A good example of the correlation between basement stratigraphy and lithic fragments comes from geothermal investigations on the island of Nisyros, Greece (Barberi, 1985). Figure 2.46 shows the eruptive sequence and a correlation between its lithic constituents and the basement lithology encountered in a geothermal well. The hydromagmatic phases of the eruption produced dune-bedded pyroclastic surge deposits in which lithic fragments came from deep, permeable rock units, whereas the magmatic pumice fall units have lithic fragments from units higher in the basement stratigraphy in which little permeability was found. In this case, the hydroclastic tephra provide evidence of permeable rock units at depth. In addition, the lithic constituents of the hydroclastic units show alteration mineral assemblages that indicate elevated temperatures existed in the permeable strata.
The thermal regime of basement rocks is also reflected by lithic constituents found in pyroclastic strata. By careful study of the paragenesis of alteration minerals in lithic fragments, including stable isotope variations (for example, 18 O and 13 C) and fluid inclusion analysis (such as Cl-, SO4 , B, NH4 , and SiO2 ), it is possible to surmise not only the geochemical nature of hydrothermal fluids at depth but also their evolution with
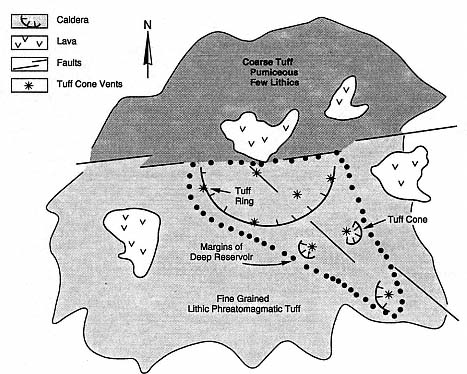
Fig. 2.42
Hydrothermal reservoir geometry (dotted line) inferred from a geological map showing
areas underlain by dry (pumiceous) and wet (phreatomagmatic) volcanic products.
A pyroclastic flow has been erupted from a caldera; it is pumiceous in its northern
regions but lithic-rich and fine-grained in its southern portions. Tuff ring and tuff
cone vents exist within the region underlain by the hydrothermal reservoir, whereas
lava flow vents are outside that region. The caldera lies at the intersection of two fault
systems. The east-west fault system marks the northern boundary of the hydrothermal
reservoir, presumably as an aquitard, and the southeast-northwest-trending fault
apparently localizes the aquifer along its southern extent. Because the caldera straddles
the northern boundary of aquifer rocks, eruptions from its northern side are dry,
whereas those from its southern side are of a phreatomagmatic character.
Fig. 2.43
Hypothetical water:magma mass ratio (Rm ) as
a function of the near-vent median grain size of
pyroclastic rocks. Where median grain sizes of
tephra are finest (between 0.1 and 1.0 mm),
the inferred water: magma mass ratio is
between 0.3 and 1.0. In this range of Rm ,
the hydrothermal potential—and therefore
the economic significance—is greatest.
Fig. 2.44
Sketch of a hydromagmatic eruption through basement stratigraphy consisting of three rock types:
1 and 3 are of arbitrary lithology, and rock 2, a limestone aquifer where the water/magma interaction
occurs, is thermally metamorphosed near the volcanic conduit. The abundance of lithic fragments
carried within the ejecta are shown by rock type. Type 2 is most abundant, because of the
explosive fragmentation that occurs in the aquifer. Lithic type 1 is greater than lithic type 3
because it represents near-surface rocks eroded from the conduit walls by
the pressurized mixture of steam and tephra. Lithic type 3 is least abundant
because its deep lithology is little affected by the erosive power of upward migrating magma.
time and thermal regime. In the example from Nisyros (Fig. 2.46), the four zones of secondary minerals found in the geothermal well include—with increasing depth—argillic, argillic-phyllitic, phyllitic-propylitic, and propylitic mineral assemblages, the lowest three of which show up in lithic fragments from the tephra deposit. Figure 2.47 reviews basic hydrothermal alteration facies and equilibrium temperatures represented by the mineral assemblages that characterize each facies. Secondary mineral assemblages in volcaniclastic rocks are also good indicators of burial depth (Viereck et al ., 1982). Glass shards commonly alter during diagenesis to zeolites, feldspars, opal-ct, and quartz as well as smectite clays and consequently can indicate temperature and burial depth (Fig. 2.48).
Excellent examples of the use of hydrovolcanic tephra and lithic constituents in exploration for geothermal reservoirs are provided by studies in the Latium volcanic province of Italy. This area (shown in Fig. 2.49) includes the Vulsini (Latera) volcanic complex, Vico volcano, the Sabatini volcanic complex, and the Albani volcanic complex, all of which exhibit important hydrovolcanic features (De Rita et al ., 1983).
Fig. 2.45
An idealized stratigraphic section produced by
the eruption illustrated in Fig. 2.44. The basement
stratigraphy is represented by lithic fragment
abundances that are sensitive to eruption
sequence. Initial, dry pumice eruptions promote
nearly equal abundances of types 1 and 3 as
a result of vent widening and the relatively
large area of contact between the magma
and type 3. Conduit pressure is too great to
allow much cavitation of rock type 2. As
eruptions become hydromagmatic, the
abundance of type 2 increases significantly.
Funiciello et al . (1976) and Funiciello and Parotto (1978) described the correlation between sedimentary lithic ejecta in pyroclastic deposits of the Albani and Sabatini regions. Figure 2.50 is a sketch geologic map of the Alban Hills south of Rome. The dominant feature of this area is the Tuscolano-Artemisio caldera and the distribution of its phreatomagmatic ejecta, which is mainly to the west of the caldera. In surrounding areas, the sedimentary basement rock, consisting of Mesozoic to Cenozoic marine rocks, is exposed and is also represented by lithic fragments in the tephra of the volcanic field. The abundance of these lithic fragments and the locations of hydrovolcanic vents allowed Funiciello and Parotto (1978) to reconstruct the substrate below the volcanic complex (Fig. 2.51). The hydrovolcanic vents are located above a structurally high block of water-saturated continental shelf and basin rocks. North-northwest faults crossing this block have contributed to fracture permeability.
A second example from Italy is the Sabatini/Cesano region described by Funiciello et al . (1976). In the eastern part of the volcanic field, the authors were able to distinguish both shallow and deep aquifers. In shallow interactions, hydrovolcanic vents were monogenetic maar craters with a diameter of 1 km or less, whereas deep interactions produced poorly defined maar structures and complex caldera structures. These caldera structures appear to represent the coalescence of several maar vents that eventually collapsed together to form a single caldera. An example of this sequence of events is the Baccano caldera, whose walls expose hydrovolcanic tephra from numerous vents (see also Fig. 4.21). Fine tephra, exposed in ridges of phreatomagmatic tephra agglomerates, have a high chloride and sulfate content that is inherited from the deep hydrothermal reservoir fluids involved in water/magma interaction. In addition, ejecta analysis by scanning electron microscopy and energy dispersive x-ray
Fig. 2.46
An example of lithic stratigraphy determined by correlations with a geothermal well in Nisyros,
Greece. The eruptive sequence shown is a magmatic-phase pumice fallout on a paleosol
substrate that is overlain by dune- and massive-bedded hydromagmatic tephra capped
by a lava. Lithic fragments from the magmatic-phase deposits correspond to impermeable strata
that are logged in the geothermal well, whereas the lithic fragments in the hydromagmatic-phase
deposits correspond to deeper, increasingly permeable strata. Hydrothermal alteration observed in
the geothermal well increases downward from argillic (A) through argillic-phyllitic (AF),
phyllitic-propylitic (FP), and propylitic (P) to thermally metamorphosed rock (TM).
(Adapted from Barberi, 1985.)
Fig. 2.47
Review of hydrothermal alteration facies
and characteristic mineral assemblages shown
as a function of depth and temperature.
Fig. 2.48
Burial diagenesis of zeolites and clays. (a) This flow diagram shows the development of authigenic
zeolites (shaded boxes) and silicates from silicic glass during burial diagenesis and metamorphism.
(b) In this chart of mineral assemblages in a thick section of marine silicic volcaniclastic rocks,
zones I to IV indicate increasing burial depth. Zone I is characterized by partial alteration of silicic
glass to montmorillonite and opal-A/opal-CT. Zone II shows additions of alkali zeolites formed by
reaction of silicic glass with interstitial water. The transition to Zone III (where alkali zeolites are
transformed into analcime, heulandite, and laumontite) occurs at temperatures of 84 to 91°C.
The transition to Zone IV (analcime transformed to albite) occurs at temperatures of
120 to 124°C and marks a gradation into the thermal metamorphic regime.
(Adapted from lijima, 1978.)
analysis allowed Funiciello et al . to classify secondary mineral paragenesis and determine the most recent temperature and chemistry of deep reservoir fluids involved in the hydrovolcanic eruptions. Their schematic geologic map (Fig. 2.52) was created from lithic ejecta analyses, which show excellent agreement with geophysical studies of regional gravity, electrical resistivity, and heat flow (Fig. 2.53).
The Funiciello et al . (1976) study constitutes a major step toward the application of volcanology to geothermal prospecting. They stated that
"As a first approximation, we assume that the surface covered by products of recent phreatomagmatism, rich in ejecta from the deep sedimentary basement, delimits the minimum dimensions of a potential geothermal field. As a second approximation, the study of the sedimentary ejecta allows [us] to reconstruct the stratigraphic and structural characters of the sector where the phreatomagmatism occurred. This [study] makes it possible to interpret the paleogeographic and tectonic evolution of the area and to fit it within the regional geology."
With respect to thermal regimes, Funiciello et al . (1976) added:
"Furthermore, if a sequence of phreatomagmatic products in several layers is available, the comparative investigation of the mineralizations in the different layers supplies indicators on the evolution of the hydrothermal field in the time."
Volcanic Hydrofractures
The concept of hydraulic fracturing (hydrofracture ) was introduced to the petroleum industry as a technique to increase the fracture permeability of oil and natural gas reservoirs (Clark, 1949). Because of its successful application in the increasingly important secondary petroleum recovery from tight formation rocks, Hubbert and Willis (1957) cited the technique as a major development in petroleum engineering. Although hydrofracture is historically an artificial means of stimulating a well, there is growing geological evidence that essentially the same process happens naturally in certain geologic situations where fluid over-pressures at depth are sufficient to cause either the widening of preexisting fractures or the failure of rock in the direction of greatest principal stress. These geologic conditions can occur near sites of magma intrusion and extrusion. Such a volcanic hydrofracture is geothermally significant where it increases the effective permeability of host rocks near a heat source and thus allows significant hydrothermal circulation (Knapp and Knight, 1977; Norton, 1984).
Numerous publications have suggested that hydrofracture occurs naturally during some magma intrusions in the earth's crust. Fehler (1983), Julian and Simpkin (1985), Chouet and Julian (1985), and Chouet (1986, 1988) attributed long-period seismic events and harmonic tremor to fluid-driven fracturing. Foulger and Long (1984) observed tensile crack formation in geothermal areas of
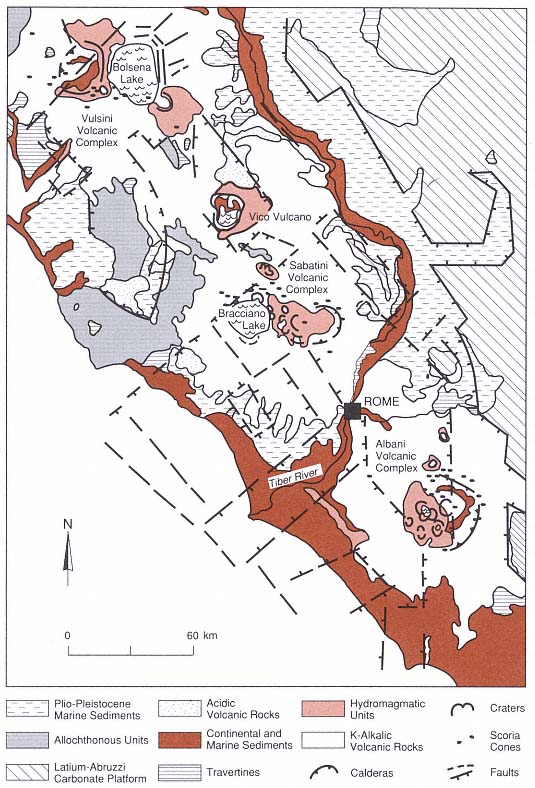
Fig. 2.49
Sketch geological map of the Latium volcanic area in central Italy. The sedimentary basement rocks
consist of the Latium-Abruzzi carbonate platform rocks, the Umbria-Sabina successions and Tuscan
Nappe, and the allochthonous Liguridi and Subliguridi complexes. The volcanic section includes
acidic and K-alkalic volcanic rock units and the major caldera associations of the Alban Hills,
Sabatini, Vico, and Vulsini areas. Widespread hydrovolcanic units are found in each of
these caldera areas.
(Adapted from De Rita et al ., 1983.)
Iceland, and West et al . (1978) attributed ground tilt around La Soufrière de Guadeloupe in 1976 to hydrofracturing by pressurized phreatic fluids. Leet (1988) modeled harmonic tremor caused by the hydrothermal boiling—a source mechanism that does not require movement of magma. Thus, some geophysical evidence strongly supports the concept of volcanic hydrofracture.
Theoretical Background
Hubbert and Willis (1957) discussed the mechanism of hydraulic fracture and emphasized the importance of regional stress. Failure that results in faulting occurs at a critical relationship between the greatest and least principal stresses (s 1 and s 3 , respectively), where
s is the normal stress and t s is the shear stress acting across a plane perpendicular to the s 1 and s 3 planes at some angle a s to s 3 . Using a Mohr diagram, one can then determine a combination of s and t s at which failure occurs. Mohr envelopes of rock failure (Jaeger and Cook, 1976), given by t s /s = tan f f , where f f = the internal angle of friction, must be experimentally determined; however, at lower pressures, brittle failure envelopes are approximated by
where t o = the zero normal-stress shearing strength of the rock. Where rock pores are occupied by fluids, the effective normal stress (s eff ) is decreased so that s eff = s - pp , where pp = the pore-fluid pressure. Hubbert and Willis (1957) noted that under normal hydrostatic conditions the effective vertical stress (s z ) is slightly more than one-half the overburden pressure (Sz = r gh). In regions experiencing normal faulting, s 1 is nearly vertical and equal to s z ; s 3 is horizontal and probably between one-half and one-third s z (s 3 = n /(1-n ), where n = Poisson's ratio for rock. On the other hand, in compressed regions that are characterized by thrust faulting and folding, s 3 is vertical and equal to s z ; s 1 is horizontal and between two and three times s z . Hydraulic fractures generally propagate in the direction of greatest principal stress. Horizontally oriented fractures will form only where the fluid injection pressure (ppi ) is greater than the effective vertical stress (s z ); vertical hydrofractures can form in regions of extension where ppi @ (Sz + 2pp )/3.
Zoback et al . (1977) conducted laboratory experiments on hydraulic fracturing of rocks to find the breakdown pressure (pb ) of various rocks:
The tensile strength of rock (Ts ) should equal pb - 2s 3 for nonporous rocks, but in fact, pb must be corrected for viscous hydrodynamic losses controlled by pressurization, flow, and leakage rates (along preexisting fractures). For example, Zoback et al . measured pb in triaxial experiments that ranged from 27 to 54 MPa for gabbros and 20 to 34 MPa for
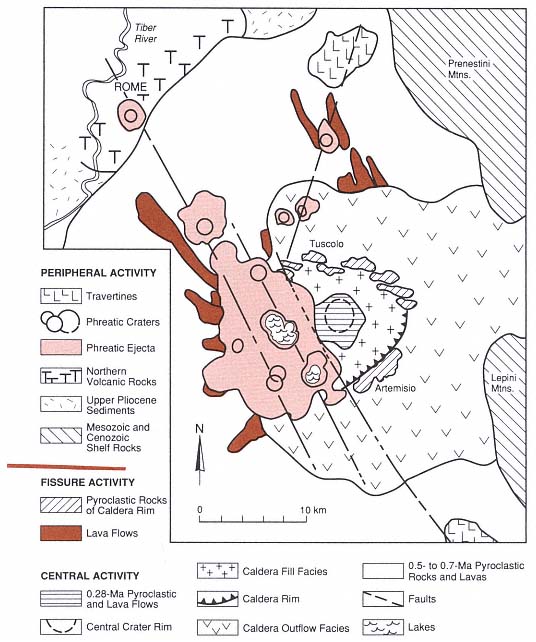
Fig. 2.50
Sketch geologic map of the Alban Hills volcanic group and the Tuscolano-Artemisio caldera.
The oldest volcanic rocks are associated with a composite cone, dated at 0.5 to 0.7 Ma, which
overlies upper Pliocene to Recent sedimentary rocks, Mesozoic and Cenozoic shelf-to-basin
successions, and Mesozoic shelf-edge facies rocks. Of major interest to geothermal studies
are the phreatic craters and ejecta (peperini), which contain lithic fragments that
reveal the basement structure. The youngest volcanic rocks are lavas and
pyroclastic rocks in the caldera center, dated at 0.28 Ma.
(Adapted from Funiciello et al ., 1976.)
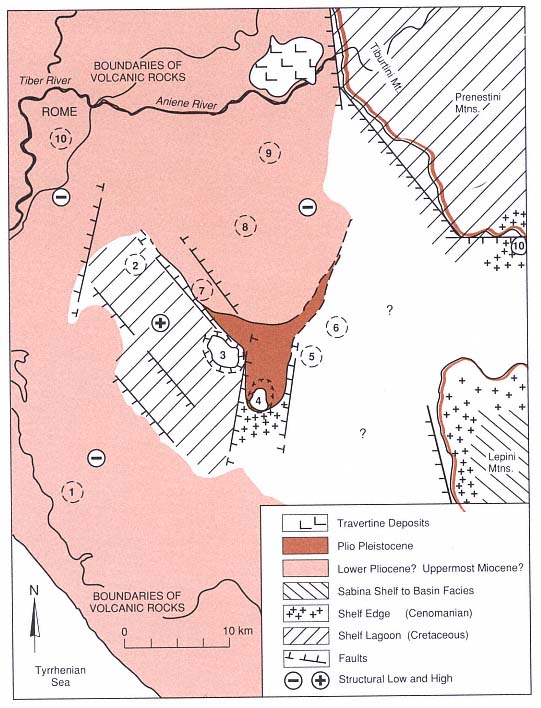
Fig. 2.51
Alban Hills sedimentary basement geology was reconstructed from the distribution of sedimentary
lithic fragments observed in hydroclastic tephra. This reconstruction was useful in siting geothermal
exploration wells, which located a permeable, saturated rock strata that could contain a hydrothermal
system. Numbers refer to volcanic centers: (1) Procula-Pomezia, (2) Ciampino, (3) Albano, (4) Nemi,
(5) Vivaro, (6) Doganella, (7) Valle Marciana, (8) Prata Porci, (9) Gabi, and (10) Campidoglio.
(Adapted from Funiciello et al ., 1976.)
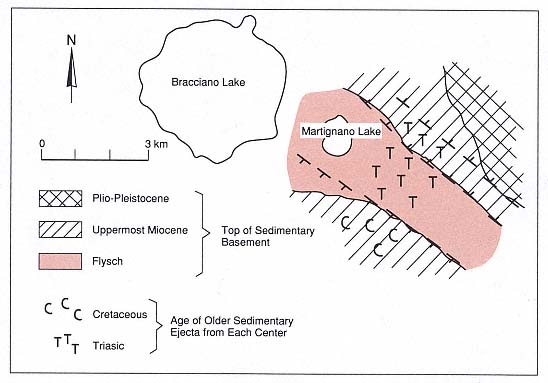
Fig. 2.52
Schematic of Sabatini basement geology reconstructed from distribution of lithic fragments in
hydroclastic ejecta. The map shows a northwest-southwest-trending horst (outlined by strike and
dip symbols) of Triassic flysch bounded on both sides by Miocene sedimentary rocks.
(Adapted from Funiciello et al ., 1976.)
sandstones when the pressurization rate was varied from 0.2 to 3 MPa/s, respectively. For the sandstones, pb increased to a range of 33 to 55 MPa when the rock was prefractured, which demonstrated the effect of fracture leaks. In all cases, fracture initiation pressures, which were measured at the onset of rock acoustic emissions, were less than pb (Fig. 2.54).
Howard and Fast (1970) reviewed other theories of hydraulic fracture and the results of oil-field studies, including the effects of fluid viscosity and pressure, pressurization time, and injection rate on the fracture width and area around well bores (Figs. 2.55 and 2.56). Solid materials such as sand and organic materials—called proppants —are added to fracturing fluids to increase viscosity and to hold fractures open. By tunneling into fractured areas, Warpinski et al . (1981) observed the effects of proppants on hydrofractures. Contrary to theory, the fractures were neither restricted nor terminated by rock interfaces, even where Young's modulus varied by a factor of 15 for a rock contact. However, fractures did propagate away from regions of high in-situ stress such as layers of tuff that were more highly compacted and altered. When different colors of sand proppants were used in sequences of hydraulic fractures, some fractures showed bedding and cross stratification. Kern et al . (1958) experimented with the movement of sand as a proppant in fractures. They found that beds are formed as sand accumulates by cohesion on the fracture surfaces. The nature of the bedding depends on the changes in fluid velocity with time, in a manner similar to that of
sedimentation in flume studies. Bedding sets at various orientations to the fracture wall are evidence of multiple pulses of fluid. These observations have been supported by geological studies of intrusive fracture fillings (Heiken et al ., 1988) and pyroclastic dikes (Curtis, 1954).
Knapp and Knight (1977) considered the effect of a temperature rise in saturated, porous rock around a hot pluton. Pore fluids change volume with varying temperature and pressure:

where a = the isobaric coefficient of thermal expansion and b = the isothermal coefficient of compressibility. Because the a for fluids is much greater than the a for rocks, these authors studied the effects of differential thermal expansion between pore fluids and enclosing rocks. For pores of fixed volume, the derivative of fluid pressure with respect to temperature is
a /b , termed the pressure coefficient , ranges between 1 and 3 MPa/°C for water in the earth's crust; it reaches a maximum at temperatures between 100 and 300°C at lithostatic pressures <800 MPa (Fig. 2.57). By plotting pore fluid pressure vs depth for various geothermal gradients (Fig. 2.58), one finds that s eff may fall to values less than zero; fracturing of rock is expected if s eff is less than the tensile strength of rock [from Eq. (2-23)]. In regions near a cooling intrusion, a zero effective pressure front will propagate away from the intrusion, which results in fracture of the host rock, increased rock permeability, and increased convective heat transport. This zone of fracturing and strong convection moves upward because of buoyancy forces, as was explained by Williams (1936) and McBirney (1959; 1963) for occurrences of breccias and tuff-breccias in and around volcanic necks and intrusions. Knapp and Knight (1977) used this
Fig. 2.53
Geophysical structure of the Sabatini area is
reflected by heat flow, gravity, and electrical
resistivity maps (Baldi et al ., 1975). These maps
demonstrate similar structural interpretations,
which support those obtained by studying
the lithic ejecta (Fig. 2.52).
(Adapted from Funiciello et al ., 1976.)
Fig. 2.54
Graph of pressure vs time for sample deformation
measurements during triaxial loading experiments
in which rock specimens were hydraulically
fractured. Sample deformation and acoustic
emission activity begins when the borehole
pressure reaches pi , the initial fracture pressure;
sample breakdown occurs when the borehole
pressure reaches pb . Acoustic emissions in
fluids correspond to the seismicity typical
during hydraulic fracturing events in the earth.
(Adapted from Zoback et al ., 1977.)
model to show how thermally induced hydraulic fracturing can produce micro-earthquakes—a characteristic feature of geothermal areas and active volcanoes.
Norton (1984), in his theory of hydrothermal systems and related rock fracturing, showed how variations in the transport properties of water can result in apparent discontinuities in the physical state of convection and secondary mineral deposition. For example, in Fig. 2.59, rapid changes are visible in the water's heat capacity, kinematic viscosity, and coefficient of thermal expansion near its critical point. Heating at this range of temperatures might result in (a) rapid solution and precipitation of various minerals, (b) oscillations in fluid heat and mass transport, and (c) rapid rock failure. Where hydrofractures occur around intrusions, as described in the theory above, convective heat transfer is augmented by the fracturing. If the fracturing front propagates away from the intrusion with time, convective hydrothermal systems manifested at or near the earth's surface may not indicate hotter, more active systems at depth. As we pointed out earlier in our discussion of heat flow, it is not possible to project to depth with confidence the thermal gradients affected by convection. Norton (1984) pointed out that behind the fracturing front/convective zone, which migrates away from the intrusion, thermal decline is accompanied by secondary mineral deposition that seals fractures. As a result of these hydrothermal processes, the last vestige of hydrothermal activity is close to the earth's surface and there is only minor activity near the intrusion.
The above discussions about pore-water pressurization and heating around an intrusion cover the long-term effects of rock fracture and subsequent development of a hydrothermal system. In contrast, when Delaney (1982) modeled the short-term effects of heat transfer to porous saturated rock, he found that pore water is not heated along a constant-volume pressure path because water diffuses more rapidly than heat does. He tabulated solutions for pore-pressure increases as a function of porosity and permeability. He also considered situations in which magma intrudes into near-surface rocks (Table 2.9); phase transitions from water to steam generally occur, the pressure increases exceed lithostatic pressure, and host rock failure is likely. Figure 2.60 depicts a case in which the magma is more permeable than the host rock. Where the magma volatile overpressure is low, the pressure gradient near the intrusion is negative and water mixes into the magma—a situation that leads to intrusion brecciation and hydrovolcanism.
Fig. 2.55
Graph of fracture area vs fluid viscosity
predicted for an assumed set of reservoir and
hydraulic fracturing conditions, where
permeability (k ) = 10 mD, porosity (f
p ) = 20%,
pumping rate (Qf ) = 25 BPM, total
volume = 20,000 gal. @ 75.7 m3 , fracture
clearance (W) = 0.2 in. (» 5.1 mm). Two curves
show the effects of differential pressures (D p) of
1000 psi (Curve 1) and 500 psi (Curve 2). The
fracturing fluid coefficient (Cf ) is the fluid's
temporal variation in velocity divided by the
square root of time and is a function of viscosity
and relative permeability. The use of English
units is common to petroleum literature.
(Adapted from Howard and Fast, 1970.)
Fig. 2.56
Effect of pumping rate and fracturing fluid coefficient (Cf ), as defined in Fig. 2.55, on fracture
radius. Solid curves show observed fracture radius at volume fluxes of 2.5 and 25.0 BPM
(0.0066 m3 /s and 0.066 m3 /s, respectively). Dashed curves show the percentage of fluid volume
lost to the formation. Fracturing conditions are constant for total volume of 20,000 gal. (75.7 m3 )
and fracture clearance (W) of 0.2 in. (5.1 mm).
(Adapted from Howard and Fast, 1970.)
Fig. 2.57
Plots of pressure coefficient [a /b = (dp/dt)v ]
(a) over a range of water temperatures and
pressures and (b) as a function of geothermal
gradients and depth. The
the critical point of water and its attached
line going to lower temperatures is the two-
phase boundary curve. In (b) an + marks the
depths at which the critical value of a /b is
reached and where effective pressure vanishes.
(Adapted from Knapp and Knight, 1977.)
In addition to brecciation and rock fracture, surface ground tilt is a well-documented phenomena in hydrofractured well bores. Studying the size of hydraulic fractures, Sun (1969) showed the relationship between surface uplift and the thickness of a grout sheet that was injected into a horizontal hydraulic fracture at depth around a well bore (Fig. 2.61). Pollard et al . (1983) examined surface deformation above near-surface intrusions and modeled the rock displacement. In Fig. 2.62, their model is compared to measured data from the Kilauea rift zone in Hawaii. The topographic expression of magma injected as dikes at depth is a surface uplift with an axial depression. Calculated contours of maximum principal stress around a buried dike (Fig. 2.63) show that the regional stress field is perturbed in such a way that s 1 is horizontally directed near the sides of the dike. This prediction explains why hydrofractures can extend horizontally from some intrusions even though the regional s 1 is vertical.
Fig. 2.58
Pore-fluid pressure vs depth for several
geothermal gradients; the lithostatic pressure
gradient for a rock density of 2.75 Mg/m3 is
indicated by the dashed line.
(Adapted from Knapp and Knight, 1977.)
Fig. 2.59
Variation of physical properties of water at (a) 30 MPa (300 Bars) and (b) 60 MPa (600 Bars) pressure
as a function of temperature; sharp inflections and discontinuities appear near critical temperatures.
Vertical axis is nondimensional; units of measure are shown for each curve. Cp = heat capacity at
constant pressure, µ = kinematic viscosity, a = isobaric coefficient of expansion, b = isothermal
coefficient of compressibility, and a /b = pressure coefficient [(dp/dt)v ].
(Adapted from Norton, 1984.)
Size of Hydraulic Fractures
Using the assumption that rocks deform as linear elastic bodies, several theories have evolved for predicting the width and length of hydraulic fractures. Figure 2.64 is a schematic representation of a hydrofracture propagating from a fluid reservoir such as a well bore or a magma body. Two important aspects of fracture calculations are (a) the pressure required to overcome rock compressive stresses and rock strength and (b) the pressure losses resulting from viscous fluid flow in the fracture.
Geertsma and Haafkens (1979) calculated a simple relationship of fracture size [width (W) and length (L)] from fracturing fluid pressure (ppi ), based on the theory of England and Green (1963):

for which W is a function of distance (x), the point where the fracture narrows into a tip at a distance L [L - x = the length of the fracture tip; a measure of fracture tip asperity is included in the last term on the right-hand
Fig. 2.60
Solutions to transient heat flow from magma to wet sediments. Top: Illustration of fluid flow lines
(arrows) as well as thermal, pore pressure, and water density gradients for (a) a short-term thermal
pressurization flow that occurs shortly after initiation of heat transfer (a); and (b) a long-term
buoyancy flow that occurs when pressure gradients caused by gravitational forces are dominant.
Bottom: (c) pressure; and (d) normalized pressure gradients for three possible boundary conditions
between the magma and the host rock. p = pressure, p¥ = pressure at infinite distance,
pi = initial pressure, a
m = magnitude of thermal expansion, Dd = ratio of penetration depths for
thermal (k
t ) to hydraulic (w ) diffusivities, h = Boltzmann variable, and x = distance.
(Adapted from Delaney, 1982.)
Fig. 2.61
Map and cross section showing vertical and aerial extent of experimental hydrofracture around well
bore. (a) Plot shows surveyed data and curve calculated by Sun (1969).

northwest-southeast traverse,
southwest traverse. (b) Plan view of surface uplift shows contours in millimeters (dashed lines),
the extent of grout sheet injected during hydrofracturing (solid line, survey traverse points (

and core hole locations (
(Adapted from Sun, 1969.)
Fig. 2.62
Calculated and measured surface deformation over buried dikes on Kilauea summit and southwest
zone. (a) Data (
results of theoretical vertical uplift. (b) Plot of theoretical horizontal stress vs distance
shows regions of compression and tension. (c) Data from Duffield et al. (1976) for intrusive
event of May 15-16, 1970, showing measured stations (
are projected on a trend of N37°W (solid line). Duffield calculated that the intruded
dike is 3000 m long, 0.8 m thick, 400 m high, and 400 m below the Earth's surface.
(Adapted from Pollard et al ., 1983.)
Fig. 2.63
Calculated contours of maximum principal
stress around a vertical dike that cuts a vertical
plane. The dike is 100 m high and its center is
at -75 m; it is subjected to a driving pressure
of 1 MPa under a lithostatic gradient of
0.025 MPa/m intrusion. Dashed curves are
trajectories of minimum principal stress along
which secondary fracturing might occur. At
depth, hydrofractures extending out from the
dike would propagate perpendicular to
the principal stress contours.
(Adapted from Pollard et al ., 1983.)
side of Eq. (2-26)]. v = Poisson's ratio; µs = the shear modulus; and D p = ppi - s eff . Although this formulation is designed for vertical fractures, it also applies to horizontal fractures where s 1 is horizontally directed. However, this solution does not account for viscous losses of fluid flow in the fracture and fluid losses to the host rock—problems that require complex treatments and yield relatively small dimensional differences.
Sun (1969) solved for fracture dimensions by calculating ground surface uplift caused by hydraulically induced fractures around well bores. By assuming a thin, disk-shaped fracture and an equilibrium distribution of stresses and displacements in a semi-infinite medium, he built on Green's (1949) analysis of fracturing in an infinite medium. Using an image method to represent the boundary conditions at the free (ground) surface, Sun (1969) calculated displacements—and therefore, fracture dimensions—from general equations of equilibrium for an isotropic elastic body (Love, 1939). The resulting solutions for the relationships among fracture dimensions, fluid pressure, and host rock elastic properties are
In these equations, E = Young's modulus; v = Poisson's ratio; and Q = the fracture volume. In the analysis of fracture volumes, four unknowns (pf , x, L, and Q) can be found by simultaneous solution of Eqs. (2-26) through (2-29), providing one can obtain the host rock properties and depth at which fractures are found (h).
Spence and Turcotte (1985) provided a more rigorous solution to a fluid-driven fracture. They considered fracture of an elastic medium, which is sensitive to the critical stress intensity at the fracture tip, as well as viscous losses of fluid flow in the fracture (approximated by lubrication theory), where the fluid viscosity is sufficiently large and the flow is laminar (Schlicting, 1979). The spatial and temporal fluid pressure distribution pf (x,t) must be such that the faces of the fracture close smoothly at its tip (Barenblatt, 1962):
where µs = the shear modulus; v = Poisson's ratio; Wh = the crack half-thickness; s = a point on the crack surface a small distance from the crack's end; and

Stress intensity factors have been tabulated for various rocks (for example, Clifton et al ., 1976, and Schmidt and Huddle, 1977). Combining expressions for fluid flux and mass conservation produces the Reynold's equation for flow in the crack:
where µ = the fluid viscosity. Spence and Sharp (1983) found solutions by using a numerical similarity technique to model the combined effects of elastic behavior and fluid flux. Spence and Turcotte (1985) found two sets of solutions, depending upon whether a nondimensional stress intensity factor (g k ) is large or small:
where Qf (the fluid volume flux) is expressed for two dimensions rather than three.
Fig. 2.64
Schematic illustration of a hydrofracture includes dimensions important to hydrofracture calculations:
depth in well bore (h), well-bore radius (rw ), fracture width as function of distance and time
[W(x,t)], fracturing fluid velocity (vx ), and total length of fracture (L).
(Adapted from Geertsma and Haafkens, 1979.)
Figure 2.65 illustrates the fracture-tip asperity as required by specification of g k . Large g k corresponds to situations in which the rock's fracture resistance is large compared to the viscous resistance to fluid flow—as it is in the case of a wide elliptical crack profile. Small g k is generally applicable to geologic systems in which the fracture resistance is negligible compared to viscous resistances—as is the case if viscous fluids are forced through a narrow crack with a sharp tip that can easily split the rock. The solutions for this latter situation, in which Af expresses the two-dimensional, fracture-fluid flux, are
Fig. 2.65
Fracture tip asperity as a function of the
nondimensional stress intensity factor (g
k )
depends on whether fracture resistance of the
host rock is large (g
k >> 1) or small (g
k <<1)
compared to viscous resistance of fluid flow
(Spence and Turcotte, 1985).
Results obtained by using the above equation set show good agreement with those obtained from Eqs. (2-26) through (2-29).
Field Examples
The relationships between hydrofracture features discussed above have been used to interpret tephra-filled fractures surrounding a buried dike that was cored near Obsidian Dome in California (Heiken et al ., 1988). Hulen and Nielson (1988) studied hydrothermal brecciation encountered in a well that was cored on the southern margin of the Valles caldera in New Mexico. These examples illustrate two different approaches to understanding volcanic/hydrothermal fracturing.
The Inyo Domes are a recent chain of rhyolitic tuff rings, phreatic pits, and domes on the edge of Long Valley caldera in eastern California (Miller, 1985). The US Continental Scientific Drilling Program explored the possibility that two of the domes, Obsidian Dome and Glass Creek flow, are connected by a buried dike. In addition to proving the dike hypothesis, the core hole intersected several sets of fractures containing juvenile magmatic fragments at various lateral distances up to 130 m from the dike (Figs. 2.66 and 2.67). The fractures, found in quartz monzonitic country rock, were filled with as much as 20% poorly vesiculated, rhyolitic shards, most of which were <1 mm in diameter. The rest of the fillings were mineral clasts and fragments of the quartz monzonite. The fractures ranged in width from millimeters to 8 cm; 0.4 cm was the average width. The ubiquitous cross bedding of clasts, the likelihood of preexisting sheet fractures, and similarly filled fractures found in bedded basalt intersected by a core hole under Obsidian Dome suggest that these fractures are horizontally oriented (Fig. 2.68).
Heiken et al . (1988) used the analysis of a stress field around a dike (Fig. 2.63), as presented by Pollard et al . (1983), and Eqs. (2-26) through (2-36) to calculate hydrofracture conditions at Obsidian Dome (Fig. 2.69). The calculated overpressures of 5 to 10 MPa and fluid viscosities of 0.20 to 0.8 Pa-s correlate with either phreatomagmatic or magmatic fragmentations that produce slurries of steam, water, and solid-particle mixtures. The overall blocky, poorly vesicular textures of the pyroclasts, their dominantly rhyolitic composition, and surface alteration features strongly support the phreatomagmatic origin: late-stage phreatomagmatic eruptions that preceded dome lava extrusion.
Hulen and Nielson (1988) found breccias at a depth of 826 to 856 m in VC-1 core hole, which is located along the intersection of the Jemez fault zone and the ring-fracture zone of the Valles caldera. The tectonic
breccias are contorted, crushed, and sheared, unlike the hydrothermal breccias, which lack frictional textures but show matrix flow foliation and clast rounding—features characteristic of fluidization (Wolfe, 1980; Kents, 1964)—as well as intense alteration. Evidence of five stages of secondary mineral paragenesis to a quartz-illite-phengite-pyrite assemblage (typical of temperatures in excess of 200°C) and a fluid inclusion homogenization temperature of 189 to 283°C were used to model the hydrothermal brecciation.
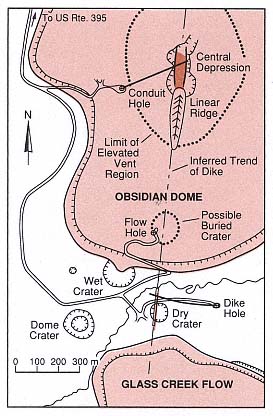
Fig. 2.66
Map of Obsidian Dome scientific drilling project.
Rhyolite lava domes of Obsidian Dome and
Glass Creek Flow are shown in shaded pattern;
lava flow front scarps are designated by
hachured line. The dashed line connecting the
two lava domes is the projection of the dike
found by drilling to pass at depth between
the domes. Core samples and hydrofracture
calculations discussed in the text are for the
(1) dike core hole that is located between the
two domes and slanted down to intersect the
dike at depth, and (2) the conduit core hole
that is slanted down to intersect below
Obsidian Dome's central depression.
(Adapted from Heiken et al ., 1988.)
An extensional state of stress can be inferred for the formation of the VC-1 core hole breccias found along the well-studied Jemez fault zone (Aldrich and Laughlin, 1984; Dey and Kranz, 1988). Hydraulic rupture in such a case is expected where pp exceeds s 3 by an amount equal to the rock's tensile strength, as was discussed earlier. Hubbert and Willis (1957) show that this situation can be approximated by
Assuming that ph (hydrostatic pressure) approximates that of the boiling point at depth and that pp = pb (the formation break-down pressure), Hulen and Nielson (1988) estimated pb at 7.5 MPa, which is similar to the fluid injection pressure (ppi ) used in the hot dry rock hydraulic fracturing experiments recently conducted at nearby Fenton Hill (Murphy et al ., 1983). Figure 2.70 shows the results of this model in a plot of depth vs temperature for boiling under hydrostatic and lithostatic loads; this plot also contains the homogenization temperature of fluid inclusions. Either fluid temperature increases or a transient confining pressure decrease during fault movement might cause fluids to reach pb .
Summary: Volcanological Interpretation
Several different but naturally related processes might stimulate fracturing of potential geothermal reservoir rocks: (a) magma intrusion, (b) hydrothermal circulation, (c) magma degassing, and (d) hydrovolcanic processes. For the hydrovolcanic (phreatomagmatic) case, the series of schematic illustrations in Fig. 2.71 depicts the formation of a hypothetical fractured geothermal reservoir underneath a volcano.
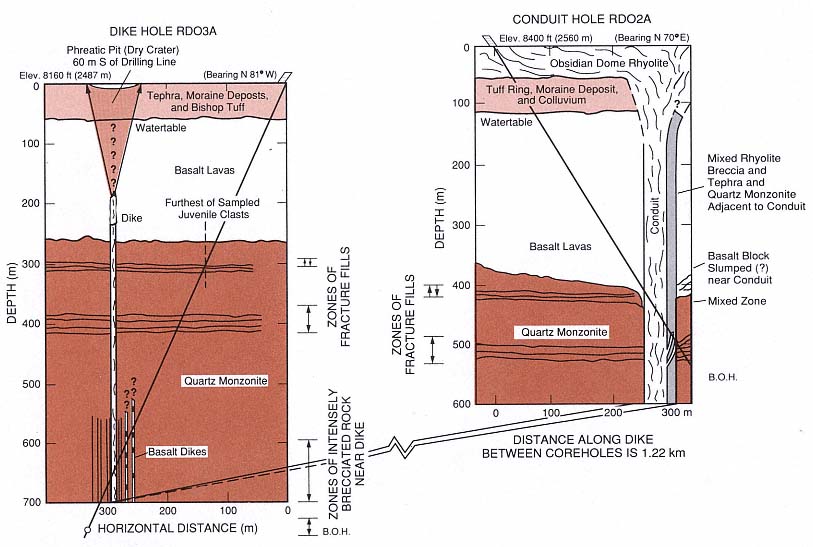
Fig. 2.67
Cross section of dike and conduit core holes showing natural hydrofractures as wavy horizontal lines at depths of 300 to 500 m.
(Adapted from Heiken et al ., 1988.)
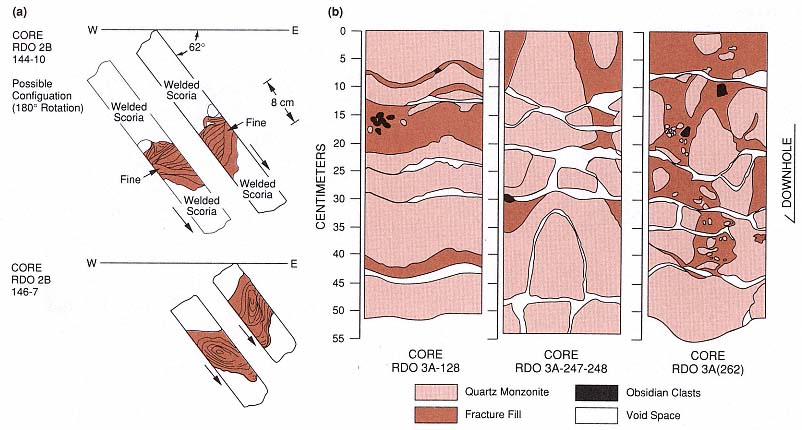
Fig. 2.68
These sketches of cores containing clastic fracture fillings were made by mapping core surfaces on velum wrapped around
the core.(a) Orientation of core segments taken 5 and 1 m west of the conduit that was intersected by the conduit core hole.
The gray, cross- and convolute-bedding fillings range in thickness from 7 to 40 cm. Of the two possible orientations shown,
the lower of each set best fits the bedding texture. (b) Core maps showing fracture fill,
host quartz monzonite, obsidian clasts, and void space.
(Adapted from Heiken et al ., 1988.)
This scenario combines aspects of all four processes listed above. The initial intrusion of a gas-rich magma moves upward along a fracture, opening the fracture with its fluid-rich top. This slow mechanism of crack propagation (termed "stress corrosion" by Anderson and Grew, 1977) is related to rock breakdown by the corrosive crack-tip fluids and rapidly varying pressure brought on by nucleate boiling along the crack walls. At some point, degassing of the magma might drive a hydrofracture into near-surface, poorly competent aquifer strata. The initial Plinian eruptions are driven by exsolving gases under high pressure. With increased fracturing, the aquifer rock fails catastrophically and allows water to mix with the magma, which results in dry phreatomagmatic eruptions. The eruptions gradually become wetter as more water is supplied by the increasingly fractured aquifer. At some stage, the extrusion of magma ceases—perhaps in response to chilling by the aquifer. By this time, hydrothermal circulation is well developed, and fluid from the aquifer continues to transfer heat from the intrusion below the volcano.
The geothermal potential of such a system has only been tested in a few areas (for example, Funiciello et al ., 1976; Barberi, 1985), and its overall importance depends upon a number of geologic controls:
· age and size of the subvolcanic intrusion,
· presence of a sufficient aquifer,
· porosity and permeability of basement rocks,
· fracture strength of basement rocks,
· tectonic regime and location of preexisting fracture systems, and
· clay content of host rocks and the degree of hydrothermal alteration.
In conclusion, we offer the simple model illustrated in Fig. 2.71 as an example of one of several different volcanic processes that develop fracture permeability in basement rocks and promote hydrothermal circulation.
Fig. 2.69
Solutions for hydrofracture at Obsidian Dome, illustrating a model for volcanic hydraulic fracturing.
(a) Hypothetical contours of maximum principal stress (Pollard et al ., 1983; see Fig. 2.63) indicate
the horizontal propagation of hydrofractures from the dike as they intrude into the granodiorite
(quartz monzonite) host rock. (b) Calculated values of fluid overpressure required to form
hydrofractures as a function of depth for the upper and lower set of fractures observed in the dike
core hole. (c) Calculated fracture dimensions and average observed fracture widths for several
different depths. (d) Calculated fluid viscosities required to form the observed fractures.
(e) Calculated fracture formation velocities. Fracturing may have occurred in spurts, causing the
fractures to propagate several meters at a time.
Fig. 2.70
Hydrothermal brecciation model of Hulen and Nielson (1988). This depth vs temperature plot shows
the boiling point curves under hydrostatic (ph ) and lithostatic (pl) pressure, as well as that
required for hydrofracture (pb ). For hydrofracturing that begins at 515 m, path AB follows
pressure buildup and subsequent fracturing as a response to increased temperature; path AC
represents hydraulic rock rupture in response to a rapid pressure release.
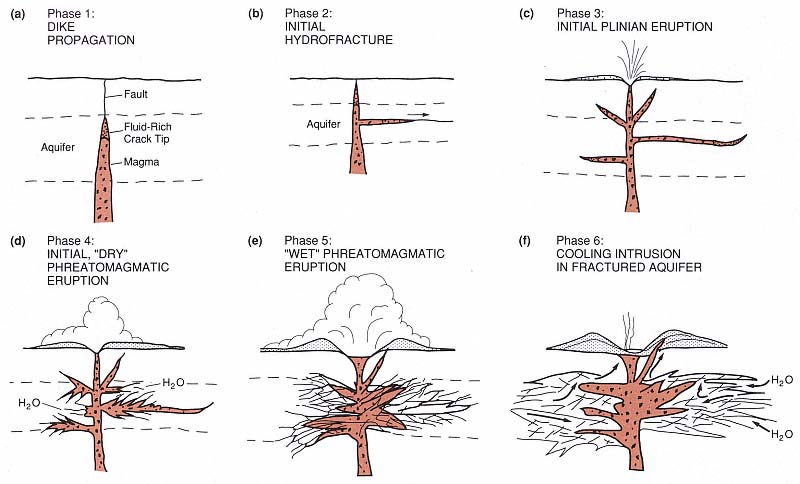
Fig. 2.71
Schematic sequence illustrating the six-phase development of a fractured geothermal reservoir under a phreatomagmatic volcano.
Phases 1 through 3 are hypothesized from the studies of Obsidian Dome discussed in the text (Heiken et al ., 1988).
Phases 4 and 5 reflect the findings of Barberi (1985) for phreatomagmatic eruptions through a deep aquifer;
the tephra deposits record increasing water interaction as the eruption progresses, presumably as a response to the
increased fracture permeability of aquifer rocks induced by hydrofracturing. Phase 6 illustrates posteruptive
cooling of magma intruded below the volcano. Hydrothermal circulation in the aquifer around the intrusion,
greatly enhanced by the magma-induced hydrofracturing, may develop a geothermal reservoir.
Chapter 3—
Surface Manifestations of Geothermal Systems
The surface manifestations of a geothermal system in a volcanic area are generally the features that first stimulate exploration. Consequently, the recognition, mapping, and evaluation of these features are important in the second stage or prefeasibility study, during which the geothermal potential is evaluated. The prefeasibility stage also involves sampling fluids and gases to be studied by hydrogeochemical techniques that help estimate the temperatures and compositions of hydrothermal reservoir fluids.
The most obvious expression of a geothermal reservoir occurs when fluids leak to the surface along faults and fissures or through permeable rock units. Depending on the reservoir temperatures and discharge rates, these surface manifestations take the form of seeps, fumaroles, hot springs, boiling springs, geysers, phreatic explosion craters, and zones of acid alteration. In addition, there are deposits of silica sinter, travertine, and/or the bedded breccias that surround phreatic craters. In this chapter, we describe the most common geothermal features seen in hot-water systems and vapor-dominated systems; Appendix A presents in detail the methods for mapping these features.
Hot springs are the most visible manifestation of hot-water geothermal systems that transfer heat to the ground surface (White, 1973). Some spring groups directly overlie a geothermal system and therefore may be used to locate drilling sites. However, springs may also discharge at the surface after flowing many kilometers down gradient from a hydrothermal reservoir; such outflow plumes can be misleading—they have a finite thickness, perhaps 0.5 to 1.0 km, and they overlie colder groundwater. Drillholes that penetrate these hot-water plumes show an increasing temperature
with depth in the upper part and then a rapid temperature decline at the bottom.
Chemical analyses of spring waters, considered along with the volcanic structure and hydrologic regime, will provide the data needed to interpret the degree of mixing between cold groundwater and an outflow hot water plume from a geothermal reservoir (Ellis and Mahon, 1977; Goff and Shevenell, 1987). Hot springs can act as an excellent guide for geothermal drilling if (a) the water analyses indicate there is minimal mixing with cold groundwater and (b) the geologic structures (for example, a crater) imply that the hot springs overlie a thermal source and maximum reservoir temperatures can eventually be reached through drilling.
Reservoir temperatures for hot-water systems show a considerable range: <90°C (low temperature), 90 to 150°C (intermediate temperature), and 150 to 240°C (high temperature) (White and Williams, 1975). The temperature of a hot spring will not exceed that of the boiling temperature of water at the altitude of that spring. The salinity of hot water systems can range from 0.1 to 3% (Renner et al ., 1975).
Vapor-dominated reservoirs—generally more than 85% steam—are ideal geothermal resources but, unfortunately, they are less numerous than hot-water systems (Truesdell and White, 1973; Ingebritsen and Sorey, 1988). Although such systems have been developed in many parts of the world (for example, the Geysers geothermal area of California), little is known about what lies under them; one known possibility is high-chloride brine. Usually these reservoirs occur where there is very high heat flow but low water recharge.
Near-surface gases from vapor-dominated reservoirs condense to form acids, which leach rocks in the spring area. These areas are characterized by bleached rock, acid-sulfate springs, and no chloride waters; acid springs may be accompanied by mudpots, geysers, and fumaroles (Renner et al ., 1975).
Hot Springs and Geysers
Very few hot springs on this planet have not been developed in some way. As spas, hot springs have offered comfort to mankind throughout the millennia; as an alternate energy source, hot springs are increasingly being considered for more practical uses. Hot springs range in size from seeps that produce barely enough hot water for bathing a few individuals to the awesome thermal areas of Yellowstone and the North Island of New Zealand, where hot water and steam are used for heating domestic buildings, heating greenhouses, and generating electricity.
Employed in geothermal exploration, hot springs provide a useful glimpse of the buried reservoir of hot water and/or steam. The thermal energy output (Et ) from a spring or group of springs can be calculated as noted by Goff et al . (1987):
where Vf = the volume fraction of geothermal water downstream from the hot springs (if all water issuing from a spring group is from hot springs, Vf = 1); Cpw @ 4.2 MJ/m3 or 4.2 kJ/l; Hr = the enthalpy of reservoir fluid; Tf = temperature (°C) of the hot springs; Ha = the enthalpy of water at ambient temperature; and Ta = ambient temperature. If cold spring water is mixed with geothermal fluids, one must know the chemistry of those waters to estimate the percentage of geothermal fluids. [For hydrogeochemical analysis and interpretation, see, for example, Henley et al . (1983) or Ellis and Mahon (1977).]
Although they are geologically rare manifestations of geothermal systems, geysers are spectacular. In his book on geysers and geothermal energy, Rinehart (1980) points out that a geyser is essentially a hot spring that periodically becomes hydrodynamically and thermodynamically unstable. These features have traditionally been classified as
either (a) fountain or pool geysers of hot water from which blobs of superheated water suddenly rise to the surface and explosively flash or (b) column or cone geysers that form cones or protuberances of silicic sinter above narrow subsurface tubes; these tubes are filled with water that periodically flashes to steam and emptying the tubes, which are later refilled.
Similar in mechanism to several types of hydrothermal eruptions, column or cone geysers are distinct because of their cyclic behavior. Only a rare set of hydrothermal circumstances provides the required combination of an underground water chamber with a conduit leading to the surface, water temperature and flux, and a surface opening of the size necessary for a geyser eruption.
Kieffer (1984a; 1989) has studied Old Faithful geyser in Yellowstone National Park, Wyoming, to better understand geyser eruption mechanisms and the associated microseismicity. Eruptions at Old Faithful produce a column of steam and water up to 50 m high that lasts from ~1.5 to 5.5 min. These eruptions, which occur every 40 to 100 min., emanate from a flared fissure ~1.5 by 0.6 m wide that is surrounded by a mound of silica sinter 4 m high and 50 by 70 m wide. The water reservoir is ~22 m below the ground surface. Hot water fills the conduit to within 6 m of the surface before an eruption. Apparently, the hydrostatic pressure of water in the conduit subdues its boiling, but growth and collapse of steam bubbles generates acoustic noise that resonates in the conduit, producing microseismicity that is similar to harmonic tremor. An eruption begins when vigorous boiling at the top of the conduit spills the water over the vent rim. This boiling unloads underlying water and triggers its vaporization. As steam is ejected, deeper levels in the conduit are unloaded in a feedback process until the conduit is emptied and recharge begins again.
Siliceous Sinter Deposits
Deposits of siliceous sinter are common to many high-temperature hydrothermal areas. The mound-like or terraced deposits are associated with boiling hot springs and serve as excellent indicators of the presence of hydrothermal reservoirs with temperatures of >175°C (Fournier and Rowe, 1966). To form siliceous sinter deposits, fluids from alkaline hot springs must have enough silica in solution to become saturated with amorphous silica as they cool from 100 to 50°C. Rimstadt and Cole (1983) described three steps in the formation of siliceous sinter:
(1) quartz-saturated hydrothermal fluids in the reservoir rise to the surface where they cool and become supersaturated with amorphous silica;
(2) amorphous silica particles nucleate to produce a colloidal suspension; and
(3) amorphous silica particles are agglomerated and cemented as amorphous silica precipitates between particles, as is illustrated in Fig. 3.1.
White et al . (1964), in a classic study of the Steamboat Springs thermal area, Nevada, devised the classification of sinters summarized in the next two sections.
Single-Stage or Primary Sinters
Thin-bedded opaline sinters are thought to have been formed by primary deposition of silica on broad discharge aprons (Fig. 3.2). The fluids have a high content of dissolved silica, were discharged at near-boiling temperatures, and evaporated quickly.
Geyserite or banded opaline sinters , most abundant on sinter cones, are deposited either by geysers or by vigorously spouting springs. Water with a high silica content at or above boiling temperatures is ejected; it cools and evaporates quickly, precipitating silica at the moment the water reaches the ground surface. These deposits are characterized by fine banding and a botryoidal or "knobby"
Fig. 3.1
Amorphous silica solubility at 25°C as a function of the radius (r) of the particles.
For particles with a positive radius of <0.05 µm, the solubility is noticeably greater
than the bulk solubility. If the negative radius of curvature in the embayment be-
tween two particles is <0.05 µm, the silica solubility is less than the bulk solubility
and the rate of silica precipitation will be accelerated—cementing them together.
(Adapted from Rimstadt and Cole, 1983.)
habit. White et al . (1964) noted that this sinter type is particularly useful in geothermal exploration because it is always deposited close to former spring vents and fissures.
Bedded opaline sinter with plant casts that lie parallel to bedding indicate that the plants were dead when incorporated into the sinter. In some situations, the casts are perpendicular to the bedding planes, implying that there was cooler water in the pools and plants continued to grow during silica deposition.
Cellular opaline sinter is deposited on the algae-covered discharge aprons of active hot springs. The rounded or oval cells are formed when gas is released from algae and other organisms. When a spring stops discharging, algal growth dries up and the deposit disintegrates into dust, and therefore cellular opaline sinter is rarely preserved in older deposits. Other types of cellular sinter are associated with filamentous bacteria that survive at temperatures of 70 to 90°C.
Flocculated silica deposits are soft and usually poorly preserved.
Multiple-Stage Sinters
Fragmental sinter , the most common opaline sinter, breaks easily into fragments when deposits dry out and are exposed to weathering and frost action. This fragmental debris may remain in place or be transported by wind and water. If younger, sinter-depositing springs flow over or through these deposits, they may become a cemented sinter breccia.
Opaline sinter is formed when opal is deposited by percolating thermal water. All of the previously described sinter types decrease in porosity after they are buried by younger deposits through this deposition. In some sinters, the process produces massive, glassy opal. On a microscopic scale, the cavities are filled with banded opal, which leaves geopetal structures.
Chalcedonic sinter is the most common within older deposits. During late-stage solution and deposition, chalcedony and quartz are deposited and earlier opal phases are at least partly recrystallized.
Sinter cement is an intermediate stage between clastic sediments and sinter deposits. Because hot springs often occur along rivers, sinter-cemented alluvial gravels are fairly common.
Form and Extent of Siliceous Sinter Deposits
Where hot springs issue from point sources, sinter deposits are cone-like or mounded. If water issues from a line of springs—most likely along a fault trace—nearly flat-lying, terrace-like deposits are formed downslope, becoming thinner with distance from the springs, as is depicted in Fig. 3.3. The terraces are topped by scattered sinter cones or ridges; ridges mark hot spring locations and are commonly associated with open fissures that break the terrace surface. Grey, white, or tan sinters that are bedded to massive and friable to dense and hard make up these terraces. By mapping layered sinters at
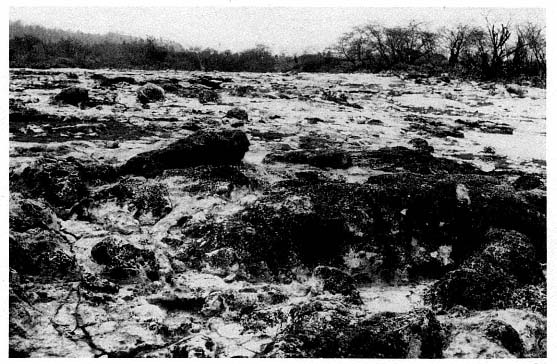
Fig. 3.2
Layered and knobby silica sinter terrace at San Ignacio, Honduras, deposited as overlapping low fans
from springs located along a fault. Springs are issuing from fractures developed in the hard, brittle sinter.
Beowawe, Nevada, Rimstadt and Cole (1983) found that each sinter terrace is composed of overlapping delta-shaped deposits and that each delta begins at a spring. These beds are nearly flat (dipping <10°). As each spring becomes choked with sinter, water begins to flow laterally through the sinter terrace to discharge at its flanks. The flank deposits dip more steeply (10 to 20°).
Siliceous sinter deposits range in magnitude from small mounds that cover a few square meters to terraces that comprise many square kilometers; thicknesses range from a few centimeters to tens of meters.
Travertine
Meteoric water, heated either around magma bodies or during deep circulation along faults, reacts with carbonate rocks and liberates CO2 . The hot waters are subsequently cooled as they mix with cooler groundwater and reach chemical equilibrium with the aquifer rocks at ~70°C (Bargar, 1978). If the water reaches the ground surface through fractures, CO2 escapes and the water becomes supersaturated with CaCO3 ; precipitation of the carbonate forms travertine near or above the ground surface. Distinctive mounded travertine deposits form around these springs, which have temperatures ranging from ~30 to 100°C.
Travertine deposits are indicators of geothermal reservoir temperatures that may be too low to generate electricity but may have direct-use applications such as for greenhouses or hot-water heating for nearby communities. Ellis and Mahon (1977) described potential problems with well-scaling that these deposits may also represent.
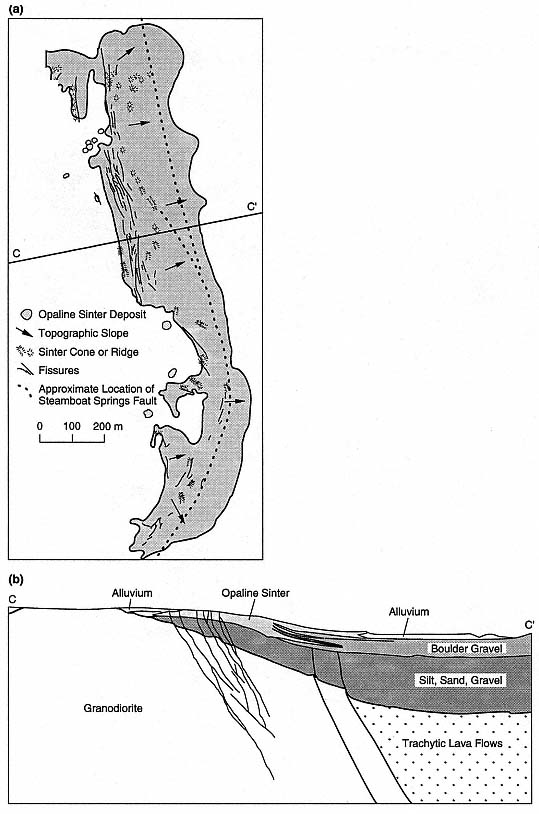
Fig. 3.3
(a) Simplified map of the youngest opaline sinter terraces at Steamboat Springs, Nevada, showing
the relationship between the elongate, narrow terrace complex and the parallel Steamboat Springs
fault (dotted line). (b) Cross-section through Steamboat Springs geothermal area.
(Adapted from White et al ., 1964.)
Although the hydrothermal reservoir immediately below travertine deposits might not have impressive temperatures, it could point toward a much hotter reservoir nearby. For example, Goff and Shevenell (1987) found that waters of the carbonate-depositing springs at Soda Dam, New Mexico, originate as outflow from a hotter intracaldera hydrothermal system located 10 to 12 km northeast of the dam. The outflow plume is diluted by groundwater, and therefore cooled, before it surfaces at Soda Dam.
Travertine ranges from a dense, banded rock, in which the banding is parallel to the fissure/spring orifice, to a porous, layered carbonate that dips away from the orifice. These outward-dipping layers may decrease in thickness with distance: from banded layers several meters thick near the spring orifice to laminae less than a millimeter thick hundreds of meters downslope from the spring. On close examination, travertines consist of mostly fine-grained (2- to 20-µm) sparry calcite, but they may also contain micrite (muddy calcite), chert, and clays. Ooids are common. These deposits vary from white to dirty gray but can also have a yellowish or reddish hue as a result of limonite or hematite staining. Travertine deposits sometimes preserve records of other geologic events in forms such as interbeds of clastic sediment or volcanic ash.
Most travertine structures fall into one of the three categories described here.
· Hot-spring cones or towers are formed through deposition by a spring flowing from a single point;
· Fissure ridges are elongate deposits that occur along springs that issue from faults or joints (as shown in Fig. 3.4). These ridges can cross drainages and act as dams behind which flat travertine terraces may be deposited (Bargar, 1978).
· Terraces build up through the accumulation of travertine and clastic sediment behind fissure ridges or as "terracettes" where hot springs flow down steep slopes.
The size and thickness of travertine structures will depend on the length of the spring orifice, flow volume, rate of deposition, and time that the spring has been active. These deposits range from thin coatings to fissure ridges nearly 100 m thick; fissure ridges can be as much as several kilometers long.
Travertine deposition is a geologically fast process. Allen and Day (1935) found that the travertines of Mammoth Hot Springs at Yellowstone Park are deposited at an average rate of 21 cm/yr. When Goff and Shevenall (1987) used uranium-thorium disequilibrium age determinations to interpret the history of the travertine deposit of Soda Dam, New Mexico, they found that the depositional rate has been variable over the last 1 Ma; most of the deposition occurred during three pulses of increased hydrothermal activity in the nearby Valles caldera.
Older Spring Deposits
Useful information about the history of the geothermal system is provided by the extent of these deposits, the relationship of older sinter and travertine deposits to faults or fissures, and the relationship between these deposits and presently active deposits. In fact, the relationship of old spring and fumarole deposits to new ones at Steamboat Springs, Nevada, has provided much of the background for our understanding of the evolution of hydrothermal systems (White, 1968).
Hydrothermal (Phreatic) Craters and Deposits
Steam eruptions that involve little or no juvenile tephra are termed hydrothermal eruptions (Muffler et al ., 1971), phreatic eruptions , or mud volcanoes (White, 1955); they are characteristic of the periodic behavior of many fumarolic areas. These eruptions form small craters, usually less than several hundred meters in diameter, which are
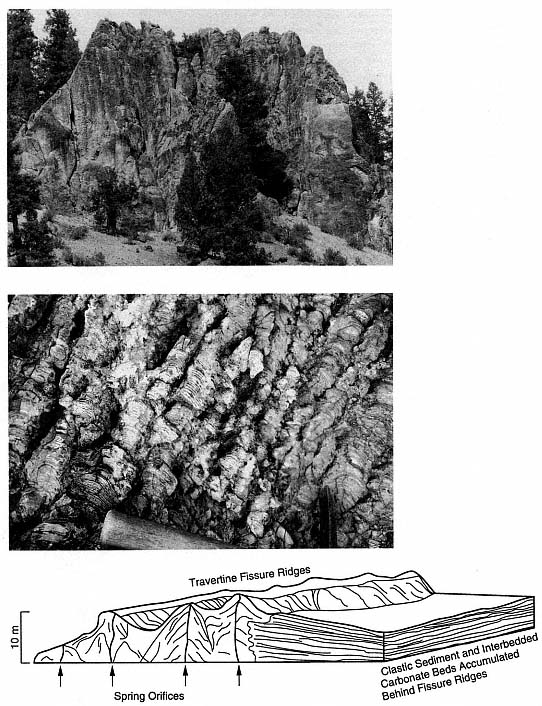
Fig. 3.4
(a) End-on view of 20- to 25-m-high travertine fissure ridge at Monon Hill, Creede caldera, Colorado.
The Creede travertine deposits are located along faults that intersect caldera margins and along
fractures located at the base of a resurgent dome. (b) Algal mounds in a travertine fissure ridge,
Creede caldera, Colorado. (c) Diagram of a travertine fissure ridge, showing the relationship
between springs that rose along faults and fractures and the layered travertine deposited there.
Where the travertine fissure ridge dammed a drainage, carbonate beds extend out as thin
wedges from the fissure ridge and are interbedded with clastic sediments.
surrounded by breccia, surge, and fallout deposits composed of lithic debris.
Hydrothermal eruptions occur in areas where the vapor pressure of geothermal fluids exceeds the hydrostatic boiling pressure for a given temperature. These eruptions take place at a point where the convective rise of geothermal fluids is impeded by a relatively impermeable layer termed caprock (Facca and Tonani, 1967). Caprocks are commonly formed when rock permeability is sealed by the precipitation of solids from geothermal fluids. Where a hydrothermal reservoir has a significant vapor-dominated region, additional over-pressure might be transmitted from the deep, cold-water hydrostatic head (Nelson and Giles, 1985). The vapor pressure of a geothermal fluid receives significant partial contributions from CO2 and H2 S, as well as H2 O. Because the former two gases have lower sublimation temperatures than water does, they can increase the vapor pressure by up to several tens of bars more than that of pure water for any given temperature (Kieffer, 1982; Nelson and Giles, 1985). When expansion of the overpressured fluid is initiated by a trigger such as the chemical breakdown and failure of the caprock or seismic or hydraulic fracturing, the eruption proceeds as a vaporization wave propagates down through the fluid and accelerates the vapor and fluid out through the conduit in a manner similar to that proposed for geyser eruptions (Kieffer, 1982; 1984a; 1989).
Two examples of hydrothermal eruption models, developed by Hedenquist and Henley (1985), are illustrated in Fig. 3.5. The first model is for a shallow hydrothermal reservoir with a temperature of 195°C and a depth of 200 m. The second is for a reservoir with a temperature of 230°C and a depth of 400 m. In both models, a sealed caprock has developed at 100-m depth through deposition of silica—and possibly carbonate where lower temperatures have allowed exsolution of CO2 . Because the overlying rock is sealed, fluid flow may be diverted at some greater depth and may follow another pathway to the surface. As vapor continues to accumulate below the sealed rock, the liquid water surface falls, and vapor pressure from the greater reservoir depths is transmitted to the seal (especially if significant noncondensible vapors are present).
In the case of eruption from the shallow hydrothermal reservoir, the transmitted vapor pressure is just above the lithostatic pressure. When the eruption occurs, hydrodynamic flow through the fracture conduit becomes hydrodynamically choked [u = usonic , as in Eq. (2-5)], and a pressure-balanced eruption occurs. Kieffer (1977) found that water-steam systems have greatly reduced sound speeds, ranging from 1 m to several hundred meters per second. In such an eruption, ejecta will follow ballistic trajectories to form fallout deposits.
For eruption from the deep hydrothermal reservoir, vapor pressure transmitted to the caprock can greatly exceed that required to lift the overburden. Overpressure builds because of the strength of the caprock. When the caprock fails, choked flow in the conduit is at a pressure above the lithostatic pressure and vent erosion occurs. The eruption is overpressured and supersonic at the surface; this circumstance produces blast conditions that form a crater and pyroclastic surges dominate ejecta dispersal.
In both shallow and deep reservoirs—but especially in shallow ones—a triggering mechanism is required to initiate caprock failure. The gradual breakdown of caprock strength through rate-limited chemical dissolution, sudden jarring by a seismic event, rapid heating by magma intrusion, the sudden influx of noncondensible gas, or unloading of overlying material through an avalanche or draining of a lake might trigger failure. An additional mechanism, hydraulic fracturing (discussed in Chapter 2), contributes to the failure of caprocks (Norton, 1984).
Hydrothermal eruption phenomena are strong indicators of active hydrothermal reservoirs. Phreatic craters and their deposits range from pits 1 m across to lake-filled depressions up to 1 km in diameter, as is seen in the example of the Eastern Kawerau Geothermal Field in New Zealand (Fig. 3.6). Ejecta deposits from these eruptions can extend >1 km from the crater center. Studies of lithic clasts within phreatic explosion breccias indicate that the foci for hydrothermal eruptions occur at many depths and have been observed as deep as 350 m (Bixley and Browne, 1988).
Most phreatic breccia deposits are massive, but they may also be bedded and may include graded bedding and pyroclastic surge dunes—features that are indicative of multiple steam blasts (Table 3.1). The massive deposits consist of poorly sorted angular tephra from sub-millimeter size to blocks several meters in diameter in a muddy matrix (Fig. 3.7). Nearly all the lapilli and blocks are hydrothermally altered and/or silicified; the glass has been altered to clay or hydrothermal quartz, and lithic and crystal components are replaced by clays, pyrite, chlorite, and other hydrothermal minerals. Many of the lithic clasts retain their relict textures and may contain several generations of fractures, filled with hydrothermal minerals, that formed in-situ during earlier hydrothermal
Fig. 3.5
Models of hydrothermal eruptions, showing (a) pressure vs depth and (b) a schematic cross section.
Pressure variations with depth of rock overburden (lithostatic), cold, vapor-unsaturated water
(hydrostatic), and hot, vaporsaturated water (saturated liquid) are indicated. The saturated liquid
curve depicts the effect of vapor pressure transmitted from a hot, underlying reservoir. For the
first model, involving a shallow reservoir at a temperature of 195°C, the pressurization history is
shown by a dashed line (A—A'). A gradual buildup of vapor pressure under the silica-cemented
cap continues until its failure, at which time steam erupts through a conduit with choked flow
and emerges at the surface at atmospheric pressure (dotted line). For the second model (B—B'),
which involves a deep reservoir, the transmitted vapor pressure greatly exceeds the lithostatic
overburden at the silicified cap. Ensuing eruptions are greatly overpressured as they emerge
from the vent conduit (dotted line), so that vent erosion promotes
the entrainment of lithic ejecta in expanding fluids.
explosions (Nairn and Solia, 1980). Bedding-plane sags are common; they resulted when blocks ejected during steam blasts impacted the muddy, fine-grained beds deposited earlier.
An analysis of the volume and variety of lithic clasts within a phreatic breccia provides a rough indication of both the stratigraphy under a geothermal area and the reservoir depth. One example of phreatic breccia, described by Espanola (1974), is from a minor hydrothermal eruption in early July 1966 within the Tikitere and Taheke hydrothermal fields of New Zealand:
"The eruption debris reached a maximum thickness of 0.3 m and consisted mainly of finely comminuted mudstone and sandstone with occasional large blocks up to 0.3 m diameter. The remaining debris was mostly pumice breccia and some rhyolite fragments from the Rotoiti Breccia Formation. The debris was found to have flattened the nearby surrounding scrub and damaged the tourist tracks. The old path, which partly encircled the amphitheater containing spring 6, was rendered impassable due to gravity slumping of the amphitheater banks towards the spring. The absence of Mamaku Ignimbrite in the ejecta indicates that the source of the eruption lay within the Rotoiti Breccia, i.e. within 90 m from the surface."
Phreatic craters and their deposits are undisputed indicators of the presence of a high-temperature hydrothermal system and therefore are excellent prospecting tools. If there is a sequence of phreatic breccia deposits, dating each deposit may provide information on thermal pulses that occurred during the history of the geothermal field. Because phreatic eruptions can be initiated accidentally by drilling or failure of a casing in a geothermal well (Bixley and Browne, 1988), these events must be considered potential hazards during the drilling and production processes.
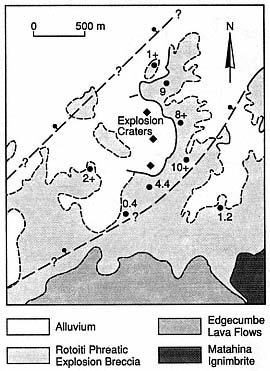
Fig. 3.6
Simplified geological map of the eastern Kawerau
Geothermal Field, New Zealand, showing the
location of phreatic explosion craters, the
Rotoiti phreatic explosion breccia, and normal
faults that traverse the area
(bar and ball on downthrown side).
Thicknesses are shown in meters.
(Adapted from Nairn and Solia, 1980.)
Hydrothermal Alteration
Hydrothermal alteration is a general term embracing the mineralogical, textural, and chemical response of rocks to a changing thermal and chemical environment in the presence of hot water, steam, or gas (Henley and Ellis, 1983). By mapping alteration mineral assemblages at the surface (but more commonly within drillholes), it is possible to locate the zones with highest temperatures, pressures, or permeabilities—all of which are important in geothermal exploration. The same techniques are used to map fossil hydrothermal systems associated with epithermal ore bodies. Epithermal is a
|
||||||||||||||||||||||||
mining term that refers to a hydrothermal mineral deposit (fossil hydrothermal system) formed within 1 km of the Earth's surface in the temperature range of 50 to 200°C (Park and MacDiarmid, 1970).
Figure 3.8 shows the cycle of solution for rocks during water/rock interaction and the deposition of hydrothermal minerals in pore space, both of which greatly affect the physical properties of reservoir rocks and make up the hydrothermal cycle (Elders, 1981). Leaching and fracturing reduce the bulk density and increase porosity and permeability, whereas the deposition of hydrothermal minerals increases the bulk density and decreases porosity.
Characterization and Interpretation
The two basic types of alteration associated with volcanic geothermal systems, acid-sulfate and adularia-sericite are modeled in Fig. 3.9. Acid-sulfate alteration occurs within the uppermost parts of a volcano or along caldera ring fractures where there is abundant, cool groundwater; acid-sulfate water is formed where the groundwater mixes with rising magmatic gases. Adularia-sericite alteration occurs within a flow regime high above or adjacent to a deep heat source and is characterized by neutral pH and alkalichloride waters (Heald et al ., 1987). Alteration rank , used as an empirical indication of temperature and permeability within a volcanic field, is determined through studies of secondary minerals; for example, epidote is an indicator of high temperature and adularia is characteristic of high temperature and high permeability within a hydrothermal system (Browne, 1977).
Many terms used to describe alteration assemblages have evolved in the literature of both geothermal and ore-deposit exploration. Heald et al . (1987) evaluated and correlated these terms and their uses in the two fields to generate the material presented in Table 3.2.
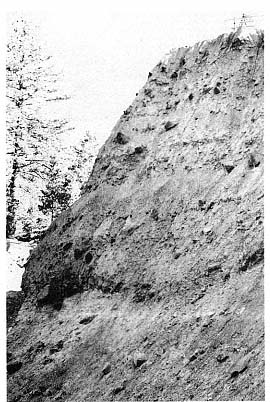
Fig. 3.7
Phreatic explosion breccia on the east wall of
South Crater, Inyo Craters, California. South
Crater is a 100-m-diameter phreatic (and
possibly partly phreatomagmatic) crater that
overlies both rhyolitic and basaltic dikes.
Deposits here are 25 m thick and consist of a
poorly bedded, cross-bedded lithic ash that
contains blocks up to 0.5 m in diameter (lower
half of the deposit) and massive, block-
bearing coarse ash (upper half of the deposit).
Browne (1977) described 51 hydrothermal minerals found in active geothermal systems; some of these minerals also occur in low-grade metamorphic rocks. The water/rock interactions in the system result in alteration of, first, volcanic glass and then a sequence of mineral phases—replacing them, leaching them, or depositing new minerals in available pore space (Browne, 1982). Typical alteration replacement products are listed in Table 3.3. The mineral assemblage depends on temperature, pressure, fluid composition, and permeability,
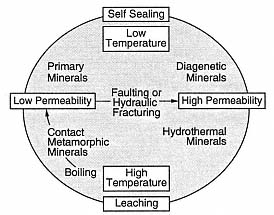
Fig. 3.8
The hydrothermal cycle. This diagram
demonstrates the interplay of water/rock
interaction, deposition of hydrothermal
minerals, and fracturing in a constantly
evolving hydrothermal reservoir.
(Adapted from Elders, 1981.)
and the sequence of mineral alteration and replacement varies from system to system, as is shown in Table 3.4 for several hydrothermal systems.
There is a general relationship between temperature and mineralogy for aluminosilicate alteration minerals (see Fig. 2.47), and mineral suites can be used to interpret temperatures within a geothermal system (Fig. 3.10; Henley and Ellis, 1983). For example, the minerals epidote and wairakite do not appear until 200°C.
During his examination of the geothermal field at Broadlands, New Zealand, Browne (1970) determined that many hydrothermal minerals are of little use in estimating subsurface temperatures and permeability; among these are chlorite, pyrite, calcite, and quartz, which are stable over a wide temperature range. Calcite is strongly affected by underground CO2 pressure. Mordenite, siderite, and cristobalite, which form at low temperatures, and epidote, which forms at high temperatures, are not greatly affected by permeability. Clays, which are excellent indicators of temperature, are not good
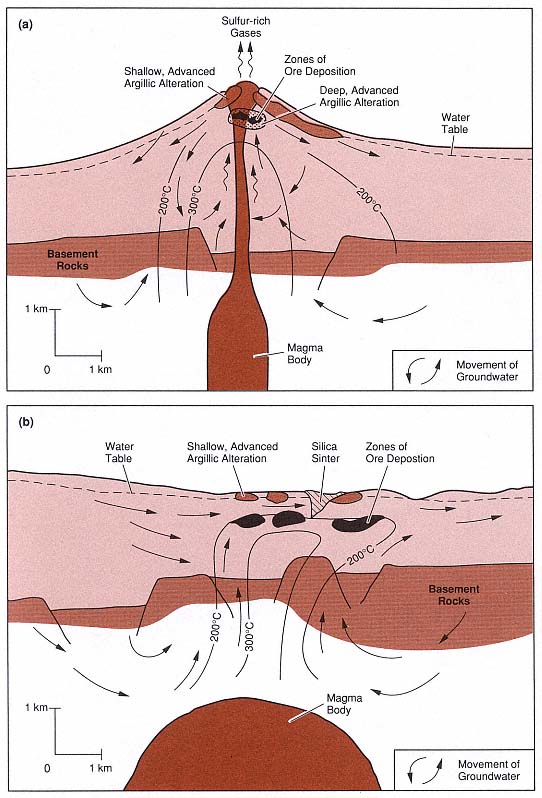
Fig. 3.9
Models of two types of fossil hydrothermal systems that are responsible for epithermal ore deposits.
(a) In the system characterized by acid-sulfate alteration, wiggly arrows represent rising sulfur-rich
magmatic gases; these gases condense and oxidize to form the acid fluids responsible for leaching
and argillic alteration of rocks within the volcano and at the surface. (b) In the system characterized
by adularia-sericite alteration, alkali-chloride waters have a neutral pH.
(Adapted from Henley and Ellis, 1983, and Heald et al ., 1987.)
|
||||||||||||||||||||||||||||||||||||||||||||||||||||
|
||||||||||||||||
Fig. 3.10
Summary of temperature ranges for common
aluminosilicate minerals. Solid lines indicate the
most common temperature ranges for these
occurrences. The three ranges shown for chlorite
are related to the transition, with rising
temperature, from swelling chlorite through
mixed swelling and nonswelling
chlorite to nonswelling chlorite.
(Adapted from Henley and Ellis, 1983.)
|
||||||||||||||||||||||||||||||||||||||||||||||||||
guides to permeability. Browne (1970) found that the most important minerals in hydrothermal surveys are the feldspars, which are sensitive to temperature and permeability. Andesine (the most common feldspar at Broadlands) is altered at temperatures between 70 and 290°C, depending on permeability, to quartz, clay, calcite, albite, or adularia. Albite replaces andesine above 230°C. Adularia may replace andesine completely or may be mixed with albite. Good production zones contain abundant secondary quartz, adularia, and calcite (Table 3.5). At Broadlands, there is a correlation between high steam and water production and the presence of adularia as the dominant feldspar in the reservoir rocks. Browne and Ellis (1970) noted that pyrrhotite occurs above 180°C but is limited to impermeable zones.
In near-surface steam-heated zones of acidsulfate geothermal systems, underground boiling adds dissolved magmatic gases to the steam phase, and oxidation creates an acid condensate above the boiling zone (Henley and Ellis, 1983). The mineral assemblages that are characteristic of acid alteration include kaolinite, alunite, gypsum, opal, and hydrated iron oxides (Steiner, 1977); this assemblage is referred to as advanced argillic alteration.
Temperatures decrease and pH increases outward from the central portion of an acid hydrothermal system, producing a systematic variation in stable mineral assemblages that can be mapped horizontally—or vertically if there are coreholes. These trends are shown in Table 3.6 (Hayashi (1973) and in Fig. 3.11 (Heald et al ., 1987).
Mapping Alteration Mineralogy
The Geological Survey of Japan considers mapping hydrothermal alteration zones an extremely important element in geothermal exploration. Although springs and fumaroles are the most obvious surface manifestations of the hydrothermal system,
|
|||||||||||||||||||||||||||||||||||||||||||||
alteration zones supply additional information that points out the areas of greatest temperature and permeability. Alteration zones can also guide exploration geologists to hidden systems or to ancient spring activity. The mapping process involves systematic sampling across the study area and analysis of mineral phases by x-ray diffraction and petrography. Study areas can range from a general map of altered areas over hundreds of square kilometers—which will often show the relationship of hydrothermal systems to large features such as calderas—to small areas of less than 1 km—where detailed variations in alteration can be documented.
An example of this type of exploration technique is the eastern Hachimantai Geothermal Area, Honshu, where there are many geothermal areas scattered throughout an 800-km2 volcanic field (Geological Survey of Japan, 1986; Nakamura et al ., 1981). Within the field, Nakamura et al ., have established three alteration subzones.
· Silicic subzones are characterized by porous, white or brown siliceous rocks that contain small amounts of alunite and sulphur. These subzones are usually found in the center of the system and can be evidence of strong hydrothermal activity in the past.
· Silicification subzones consist of hard, white, silicified rocks within a band around the silicic zone. This subzone can occur as blocks 0.5 by 0.7 km or as 10- to 50-m-wide veins. The minerals include saponite, chlorite, hydromica, mixed-layer clays, sericite-montmorillonite, alunite, anhydrite, gypsum, calcite, rutile, diaspore, and andalusite.
|
||||||||||||||||||||||||||||||||||||||||||||||||||||||||||||||||||||||||||||||||
· Argillization subzones are the outer-most zones of alteration; they consist of blue-black clays (the color is mostly related to finely disseminated pyrite). The dominant minerals are montmorillonite, kaolin, and alunite, in order of distance from the outer edge of the zone.
In addition to these alteration zones, a pyrophyllite zone, which may overlap the argillized rocks, has formed at higher temperatures and may be an indicator of higher permeabilities. Pyrophyllite is most likely formed within the system if temperatures are >300°C and if the geothermal fluids are acidic at depths of ~1 km.
Figures 3.12a and 3.12b show the distribution of alteration zones, which are identified by the dominant mineral phase, as well as the distribution of fluorine concentrations (another exploration tool). The schematic cross-section of B—B' in Fig. 3.12c was based on wells that were drilled into the vapor-dominated part of the Matsukawa geothermal field; this illustration shows a relationship between the reservoir and surface pyrophyllitic to kaolinitic alteration zones. Wells for the Kakkonda (Takinoue) geothermal field penetrated a water-dominated reservoir in a zone where rocks are mostly altered to montmorillonite (on a regional scale) but are locally altered to kaolinite, alunite, or pyrophyllite.
The examples from Nakamura et al . (1981), cited earlier, are sited in intermediate to silicic calc-alkaline rocks. However, different
Fig. 3.11
Diagram showing the alteration minerals in vein assemblages and the sequence of wall-rock
alteration for acid-sulfate and adularia-sericite-type deposits that occur in fossil hydrothermal
systems. No scale is given because the widths of alteration zones range from
centimeters to tens of meters outward from the vein.
(Adapted from Heald et al ., 1987.)
mineral zonation occurs in basaltic rocks. For instance, Tómasson and Kristmannsdóttir (1972) described three vertical zones in the Reykjanes geothermal area of Iceland, which are listed here in order of increasing temperature:
(1) a montmorillonite-zeolite-calcite zone,
(2) a mixed-layer clays-prehnite zone, and
(3) a chlorite-epidote zone.
The zones are not always clearly defined as a result of cooling and reheating after the invasion of sea water. Subsurface temperatures at a depth of 1 km exceed 200°C.
The date and length of hydrothermal activity in a geothermal system can be determined through potassium-argon dates for clays (Woldegabriel and Goff, 1989). These data can provide interesting and sometimes crucial information on the longevity (and perhaps future) of hydrothermal activity in an area to be drilled and developed. Woldegabriel and Goff (1989) have shown that hydrothermal systems within the Valles caldera of New Mexico became active soon after caldera collapse at 1 Ma and have been active from that time to the present.
The most desirable targets—permeable zones with hot water and steam—are narrow ones and, in some cases, may make up as little as 5% of the entire geothermal system. The size of this target can vary substantially. Figure 3.13 compares 16 epithermal ore bodies (fossil hydrothermal systems; Heald et al ., 1987) and 25 geothermal fields (Rowley, 1982). The areas of geothermal fields, from 0.15 to >100 km2 , are very similar to the areas of epithermal deposits, which range from 1 to >120 km2 . The projected surface areas of production zones within the 16 geothermal fields range from <0.5 to 60 km2 , which is 5 to 15% of the total area defined by hydrothermal activity, rock alteration, and elevated geothermal gradients. These areas
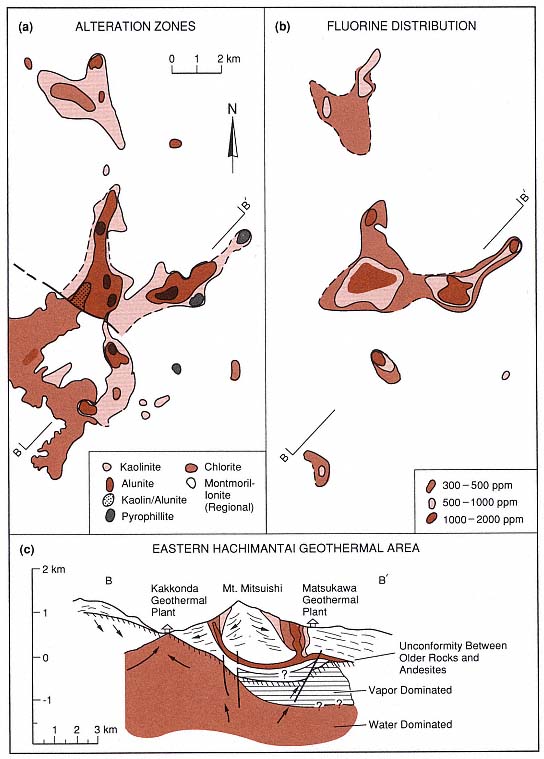
Fig. 3.12
Maps of alteration zones from the eastern Hachimantai geothermal area in Japan. (a) Map of
alteration zones indicates the predominant marker minerals. (b) Distribution of fluorine in
hydrothermally altered rocks. (c) Schematic cross-section of
the eastern Hachimantai geothermal area.
(Adapted from Geological Survey of Japan, 1986.)
Fig. 3.13
Dimensions and volumes of hydrothermal systems
are used to compare ore zones (fossil hydrothermal
systems) and developed hydrothermal reservoirs.
These graphs provide a general idea of the range
of areas and volumes for hydrothermal reservoirs.
(a) Length and width of ore zones. (b) Surface areas
of ore zones and volumes of fossil hydrothermal
systems. (c) Estimated areas of geothermal fields
and actual areas with production wells.
(Adapted from Heald et al ., 1987,
and Rowley, 1982.)
of production are the permeable pathways for hot fluids at the time of drilling. By analogy, epithermal ore deposits encompass the entire area affected by alteration throughout the history of the hydrothermal system; large ore-bearing veins were the main conduits for geothermal fluids and gases. By studying the analogy between active hydrothermal systems and epithermal ore bodies, it is possible to create three-dimensional models of volcanic geothermal systems. The depth of hydrothermal reservoirs ranges from <1 km to perhaps as much as 4 or 5 km. The depths of some of these reservoirs have not been determined. Mining epithermal ore deposits has provided us with the vertical extent and time-cumulative volume of many such ore deposits; they are from 400 to 1,000 m vertically and have volumes of 1 to 132 km3 (Heald et al ., 1987). The largest geothermal systems and epithermal ore bodies are associated with the Earth's largest volcanoes—calderas—which are discussed in the next chapter.
Chapter 4—
Calderas and Their Geothermal Systems
Large eruptions of pumice and ash can cause the collapse of rock that overlies shallow magma chambers, thus forming craters called calderas (from the Spanish for "cauldron" or "kettle"). Calderas range from a few kilometers to 60 km in diameter and are associated with eruptions of several cubic kilometers to several thousand cubic kilometers of pyroclastic material. Caldera-forming eruptions are infrequent—occurring perhaps only once every few thousand years.
The very magnitude of the largest calderas has, on occasion, prevented geologists from recognizing them in the field. However, as early as 1885, Verbeek proposed that the crater left after the 1883 eruption of Krakatau was formed by a collapse accompanying the eruption of large volumes of ash and pumice. Other studies, particularly of older, eroded volcanic fields in the British Isles, led to the conclusion that subsidence followed this type of volcanic eruption. The significant study that brought the collapse mechanism for crater formation into mainstream geology was a review of known calderas by Williams (1941). Williams' review was published concurrently with his study of the Crater Lake Caldera in Oregon (Williams, 1942), in which he linked caldera collapse to the eruption of Mt. Mazama ~7,000 yr ago. In other, related work, Ross and Smith (1961) reviewed the available data for tuff deposits found around calderas and Smith and Bailey (1968) developed a model for caldera formation and structural caldera resurgence, concentrating on the Valles caldera of New Mexico (Fig. 4.1). Since that time, the research on calderas and their deposits has accelerated; today, much more is known about eruption phenomena, caldera-collapse processes, magma-chamber evolution, and the evolution and history of caldera hydrothermal
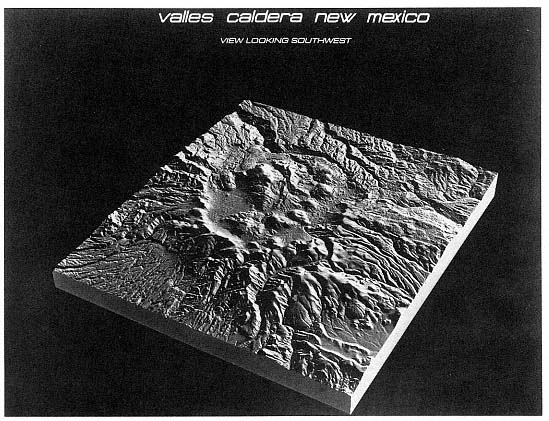
Fig. 4.1
Block diagram of the Valles/Toledo caldera complex in New Mexico. The topographic
depression is 22 km in diameter. The actual collapse crater is 15 km in diameter; its location was
inferred from locations of rhyolite domes erupted after the caldera collapse. The bulbous mountain
near the caldera center is a structural resurgent dome caused by
the buoyant rise of magma after the caldera collapsed.
(Block diagram by Harlan Foote, Pacific Northwest Laboratories).
systems. A particularly useful collection of papers on calderas was published as a special volume of the Journal of Geophysical Research edited by Lipman et al . (1984). In this book chapter, we will briefly review the processes leading to caldera formation, eruption and collapse, and postcaldera activity, including the development of hydrothermal systems.
Intrusion
Silicic calderas are associated with crustal magma bodies, the tops of which are at inferred depths of 4 to 10 km. Geothermal resource evaluation requires information about the depth, shape, size, and age of such bodies that supply heat to geothermal systems. Although most thermal models of these magma bodies are based on cube-, slab-, and cylinder shapes, geological and geophysical evidence indicates that silicic plutons have inverted, tear-drop shapes and are no more than 10 km thick (Bott and Smithson, 1967; Cobbing and Pitcher, 1972). Smith and Shaw (1975) proposed that the pluton diameter is equal to or somewhat greater than that of the caldera ring faults.
Excellent examples of plutonic-volcanic associations, particularly plutonic complexes believed to have underlain calderas, are visible within the Peruvian batholith (Cobbing and Pitcher, 1972; Myers, 1975); these are steep-sided plutons with domical roofs that have intruded into caldera fill and sub-caldera rocks. Collectively, the many various types of plutons emplaced over millions of years make up what is termed a batholith . Thermal metamorphic effects suggest that plutons of the Peruvian batholith were once within 3 km of the surface (Meyers, 1975).
The Uyaijah ring structure of Saudi Arabia consists of a 15- by 20-km oval ring dike, 2 km thick, which surrounds a granite stock and is believed to have underlain a caldera (Dodge, 1979). The pluton appears to have an inverted tear-drop shape similar to those of the Peruvian batholith (Fig. 4.2).
Of the 40 high-level plutons that make up the granitic ring-dike complexes of the Jos Plateau of northern Nigeria, many are believed to have underlain calderas (Jacobson et al ., 1958). Figure 4.3 provides a comparison between this complex and those of the Valles/Toledo complex of New Mexico and the Lake City complex in Colorado. Various periods of pre- and post-collapse intrusion and volcanism that are characteristic of caldera clusters created the Nigerian plutonic complexes. The polygonal shapes of many of these plutons and associated dike systems were controlled by fault and fracture patterns that existed before the plutons were emplaced and before caldera-forming eruptions occurred. Associated with these plutons are glassy, brecciated rhyolitic dikes and uniform rhyolitic rocks that have been interpreted as caldera-fill deposits.
There is increasing evidence, based on geological research and thermal models, that most—or even all—large silicic plutons are underlain, surrounded by, or mixed with basaltic intrusions. Without the heat supplied by hotter mafic magmas, the large, silicic magma bodies cannot rise as crustal diapirs (Lachenbruch et al ., 1976;
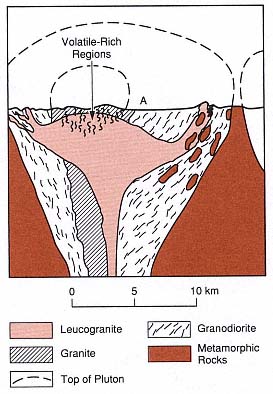
Fig. 4.2
Schematic cross-section of the composite,
subcaldera pluton that makes up the Uyaijah
ring structure in Saudi Arabia. "A" marks the
present-day ground surface. Dodge (1979)
postulated that this pluton once lay
beneath a caldera complex.
(Adapted from Dodge, 1979)
Eichelberger and Gooley, 1977; Hildreth, 1981). The viscosity of a cooling magma body can increase to the point where it stops rising and never reaches the shallow crust to erupt. Many caldera complexes are located in volcanic fields that exhibit bimodal volcanism: the more silicic rocks are in the center of the field overlying a silicic magma body and the basaltic lava fields are located around the flanks. Basaltic magmas trapped beneath a silicic pluton cannot pass through it because they are more dense and thus buoyant rise is suppressed; however, these magmas can rise to the surface along fractures in the brittle crust adjacent to a silicic pluton.
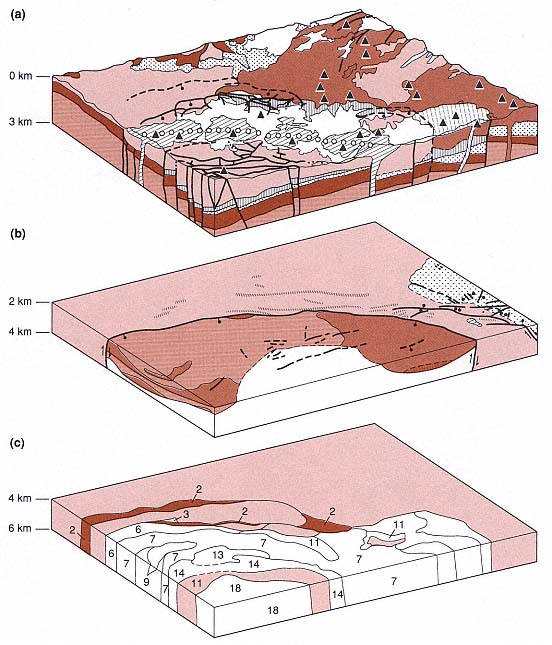
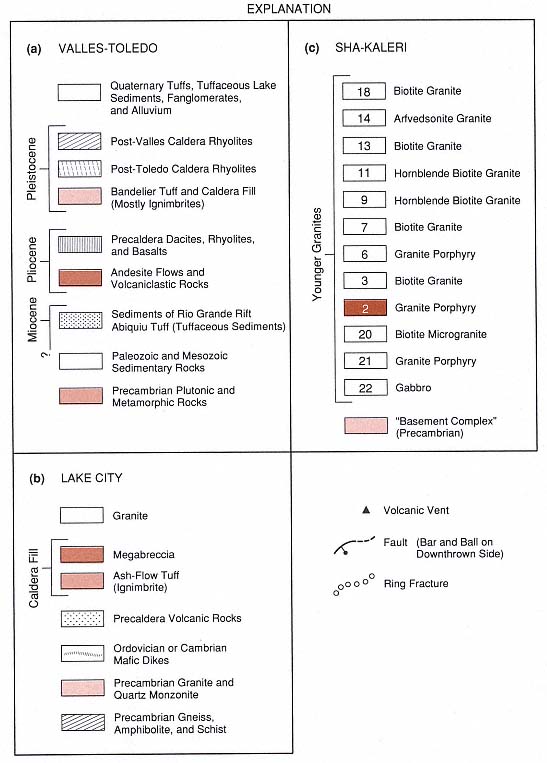
Fig. 4.3
These composite block diagrams schematically represent different levels below a caldera complex and
illustrate an igneous system within the upper 6 km of crust. These examples are from three different areas
where rocks are exposed or have been sampled by drilling. (a) Geologic map and cross-sections of the
north-northeast quarter of the Valles and Toledo calderas of the Jemez Mountains in New Mexico.
The geology is based on data and maps from Smith et al . (1970), Dondanville (1971;1978),
Slodowski (1977) and Hartz (1976).
(Adapted from Heiken and Goff, 1983.)
(b) The Lake City caldera in Colorado is similar to the Valles/Toledo calderas in size
and composition, and its interior has been well exposed by erosion. The upper
surface of the diagram is at a level that was originally ~2 km below the ground
surface present at the time of eruption, 22.5 million years ago.
Tuffs and interbedded breccias of the caldera fill are intruded by a silicic pluton.
(Adapted from Lipman, 1976.)
(c) This diagram is based upon maps of the Sha-Kaleri intrusive complex in northern Nigeria
by Jacobson et al . (1958). Interpreted as a cluster of plutons that were emplaced below a large caldera,
it may be analogous to the plutonic complex that underlies the Jemez volcanic field. The diagram
illustrates the potential complexity of a composite plutonic body below a caldera.
Mount Mazama Volcano, which erupted ~50 km3 of magma 7000 years ago, is a well-documented example of the basalt/rhyolite association required for the rise of a large silicic magma body. Rhyodacitic pumice was erupted first, followed by a mixture of the rhyodacite, crystal-rich andesitic pumice, and mafic-cumulate scoria (Bacon, 1989). When the caldera collapsed during the eruption, Crater Lake caldera was formed. Preeruptive magma temperatures ranged from 880°C for the rhyodacite and early andesite phase to >940°C for the late-erupted scoria phase. Analysis of H2 O in melt inclusions suggests that depth to the magma chamber was 6 km. Using 87 Sr/86 Sr ratios for the eruption products as evidence, Bacon suggested that the magma chamber grew during injection of multiple parent liquids, forming a hot lens between plagioclase-rich cumulates and the overlying rhyodacitic magma. A buoyant, differentiated melt mixed into the overlying rhyodacite and crystal mush to form a new cumulate layer. Basaltic fluids then penetrated the base of the cumulate pile. Had the caldera-forming eruption not occurred, crystallization would have formed a granodiorite pluton overlying a dioritic to gabbroic cumulate.
Large-volume, caldera-forming eruptions usually occur late in the history of a volcanic field. Most of these eruptions have been preceded by smaller scale eruptions of mafic to intermediate magmas—sometimes over periods of millions of years, as was described by Lipman (1984) and depicted in Fig. 4.4. This type of volcanic field may consist of dozens of vents, including those of composite cones, scoria cones, lava domes, and small calderas. Rarely, if ever, has a large, single composite cone collapsed to form a caldera. There are many examples of a complex volcanic field being developed before a caldera is formed, including Crater Lake in Oregon, where Howel Williams developed his caldera models (Bacon, 1983; Druitt and Bacon, 1986), Thira (Santorini) in Greece (Fouqué, 1879; Heiken and McCoy, 1984), and the Valles caldera in New Mexico (Smith et al ., 1970; Gardner et al ., 1986).
Eruption Processes That Lead to Caldera Collapse
Caldera-forming eruptions begin when pressure within the volatile-rich cap of the magma chamber can no longer be contained by the overlying rock. Conduits to the surface may follow faults and fracture systems [see (a) of Fig. 4.5]. In some instances, the main eruption is preceded by phreatic (steam) explosions and by relatively mild explosive eruptions and lava flows. Bacon (1983) described such precursor activity at Crater Lake, Oregon, where a still partly molten lava flow was erupted before the collapse and flowed back into the new crater. Phreatic and phreatomagmatic activity (explained in Chapter 2) may also have been precursors to the main Minoan eruption at Thira, Greece (Heiken and McCoy, 1984), and at Krakatau in Indonesia (Simkin and Fiske, 1983), where there were small ash eruptions for days before the main eruption.
From observation and inferences from field relations, it appears that caldera-forming eruptions last only a few hours or days (for example, at Krakatau in 1883; Simkin and Fiske, 1983), if one does not include smaller ash eruptions or the lava flows that may follow caldera formation. The first and most explosive phase begins with an eruption of volatile-rich magma as pumice and ash, which forms a high eruption column. This phase generally produces fallout or a Plinian pumice-fall deposit (see definitions in Appendix G). Massive or graded pumice beds (with coarser fragments at the base of the bed) drape the countryside. This first phase may erupt from a single conduit or closely spaced conduits, as depicted in part (c) of Fig. 4.5. Plinian eruption phases from a single conduit have been widely documented in isopach and isopleth maps as well as maps of lithic clast distributions (for instance, Hildreth and Mahood, 1986; Heiken and McCoy, 1984; Self et al ., 1986). Volumes of pumice fallout deposits depend upon the overall size of the magma body,
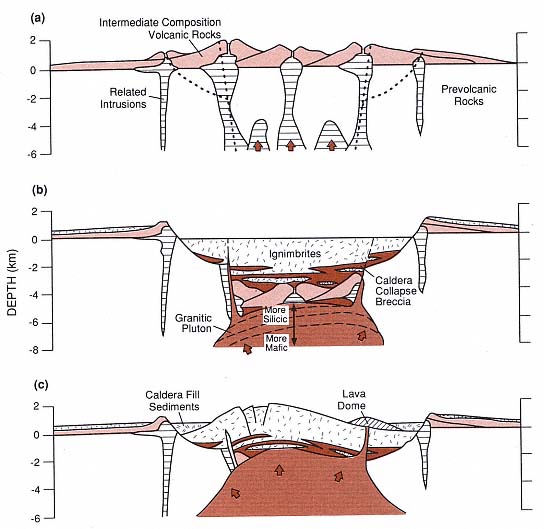
Fig. 4.4
The evolution of a large silicic caldera. (a) Volcanism before caldera collapse. Clusters of composite
cones develop over isolated, small plutons that eventually coalesce to form a large silicic magma
body or heat the shallow crust sufficiently to allow the buoyant rise of a large pluton. The site of
subsequent caldera collapse is marked by dotted lines. (b) Caldera structure immediately after
the eruption of ignimbrites and concurrent caldera collapse. Calderas contain thick tuff deposits
that are interbedded with megabreccias. Dashed lines approximate the compositional zones
developed within the pluton. (c) Caldera resurgence. Welded tuffs and other caldera deposits are
uplifted as a structural dome over the magma body. Postcaldera collapse volcanism and
sedimentation occur mostly along an annulus between the resurgent dome and caldera walls.
Hydrothermal systems develop within the caldera deposits and floor rocks, as well as along
extensional faults that cross the resurgent dome.
(Adapted from Lipman, 1984.)
but when ~20% of the total eruptive volume has been ejected, caldera collapse may be initiated (Smith, 1979). Druitt and Sparks (1984) proposed that when a small fraction of material has been erupted, the pressure within the magma chamber decreases rapidly to values less than that of the lithostatic pressure and the chamber roof begins to collapse catastrophically [parts (c) and (d) of Fig. 4.5].
Fig. 4.5
Inferred stages of eruption and collapse of a large silicic magma chamber and caldera.
(After a drawing by T. McGetchin, 1976)
The rocks overlying a magma chamber roof collapse into the partly evacuated chamber and form new fracture systems, which approximately outline the magma body. Complete or piecemeal subsidence may occur along the fractures, creating ring faults with a concentric pattern. During this stage, eruptions may occur continuously or intermittently along the newly formed ring faults [(Fig. 4.5 (d)]. As blocks that make up the caldera roof begin to collapse, the ring faults may open widely and allow large quantities of pyroclastic material to erupt; these same roof blocks can rotate back into place, closing off the fractures and opening other fracture vents. Roof subsidence not only allows eruptions to occur over long sections of ring faults, but also may displace magma and drive it to the surface (Druitt and Sparks, 1984). It is usually during this stage of the eruption that the hotter but more volatile-poor ash and pumice are deposited around the caldera as pyroclastic flow deposits or ignimbrites, as shown in Fig. 4.6 (Self et al ., 1986; Hildreth and Mahood, 1986). Ignimbrite deposits, located around the periphery of a caldera, form plateaus that slope away from the source. These tuff deposits are usually thickest within and along the edges of the caldera, thinnest at the distal plateau margins, and generally absent on steep slopes. Details of facies changes within ignimbrites are discussed in Chapter 2 and by Fisher and Schmincke (1984).
Caldera collapse occurs during and not after an eruption—an important concept to keep in mind when examining caldera structure and seeking caldera-hosted geothermal resources. Perhaps as much as 50% of the erupted pyroclastic material collects within the caldera crater, especially in the largest calderas where many of the pyroclastic flows never surmount the crater wall; these tuff deposits are usually 1 to 3 km thick and can be as much as 5 km thick (Lipman, 1984, and personal communication). Because their depositional temperatures are 500 to 600°C, the rapidly deposited pumice and ash may be compacted, welded, and altered by remnant gases and heated groundwater. For every ignimbrite exposed around caldera margins, there is a texturally different (welded, devitrified, and perhaps hydrothermally altered)—but correlative—thick tuff sequence within the caldera. Table 4.1 presents the lithologic sequences commonly found in such caldera-fill deposits and correlative outflow deposits.
Figure 4.7 provides an example of intra-caldera ignimbrite deposits interbedded with breccias that formed when unstable caldera walls avalanched into the collapsing Lake City caldera (Lipman, 1975; 1984). Mesobreccias consist of concentrations of small lithic clasts interlayered with the middle and upper parts of the caldera-filling tuffs. Megabreccias are made up of clasts that are generally larger than an individual outcrop; they actually are intact slump blocks located near the bottom of the caldera filling (Lipman, 1975). The slumping that forms megabreccias may leave scalloped topographic caldera walls that extend outward from the ring faults for hundreds of meters or several kilometers. Megabreccia blocks occur at different stratigraphic horizons in a caldera fill, which suggests a piecemeal failure of steep caldera walls during collapse (Meyer, 1989). The slumping of large megabreccia blocks may make it difficult to map the actual caldera wall, as defined by ring faults; in many cases, the topographic caldera wall is located well outside the actual structural caldera. The lenslike deposits of caldera-collapse breccia act as heat sinks within the caldera-filling tuffs: they rapidly cool the adjacent hot ash deposits and locally limit the compaction and welding of glassy pyroclasts.
Near the caldera rim, outflow ignimbrites contain concentrations of lithic clasts called lag breccias (Druitt and Sparks, 1982; Druitt and Bacon, 1986). These lithic clast concentrations (shown in Fig. 4.8) may indicate episodes of caldera-wall collapse or vent widening during explosive eruptions. The ability to recognize caldera-collapse breccias and associated nonwelded tuffs within
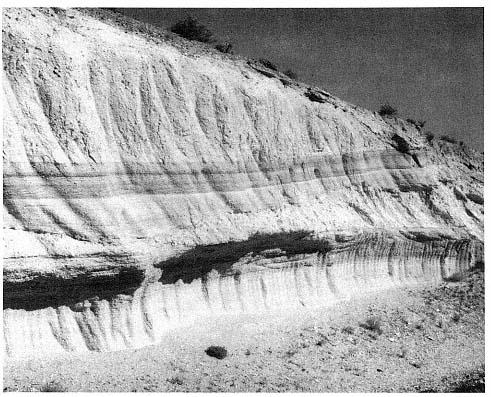
Fig. 4.6
Photograph of a pumice fall and ignimbrite deposit in the Bishop Tuff, Long Valley Caldera,
California. Interstratified surge and pumice fallout deposits are
overlain by a massive ignimbrite.
drillholes and in surface outcrops is important for identifying hydrothermal reservoirs within the calderas because these deposits may be more permeable than the densely welded tuffs that enclose them.
Volcanism, Structural Deformation, and Sedimentation Following Caldera Collapse
Immediately after caldera-forming eruptions, the craters become closed sedimentary basins. Crater lakes may form and the process of fluvial and lacustrine sedimentation begins. If it is adjacent to the sea, the crater is flooded and may eventually be filled with marine sediments. If a caldera wall is breached, the lake drains and a new drainage system is established. Well-bedded lacustrine mudstones and siltstones may eventually fill smaller calderas, but structural resurgence within larger calderas will limit the crater lakes to an annulus between the central structural dome and the caldera wall, like that of the Creede caldera of Colorado, depicted in Fig. 4.9 (Smith and Bailey, 1968; Heiken and Krier, 1987).
Interbedded with the laminated lacustrine mudstones are reversely graded breccias (turbidites from caldera walls), coarse sandstones (fluviatile rocks and small deltas), volcanic ash beds (both ash-fall and pyroclastic-flow deposits), and lavas from postcaldera eruptions.
Mapping and age-dating of caldera-lake sedimentary rocks can provide information
|
||||||||||||||||||
to be used in determining the time and rate of structural resurgence. By employing lake beds as markers, it is possible to measure the amount of deformation during resurgence; for example, Mahood (1980) measured the degree of resurgence of La Primavera caldera in Jalisco, Mexico, by mapping the elevation of caldera lake sedimentary rocks and interbedded tuffs (Fig. 4.10).
The buoyant rise of magma or injection of new magma following a caldera's collapse can be inferred from structural deformation of the caldera floor and postcollapse volcanic activity. Structural resurgence is common in calderas with diameters of 10 km or greater (Smith and Bailey, 1968). Deformation may result in a simple symmetrical dome within the caldera fill, and radial dips within these deposits may
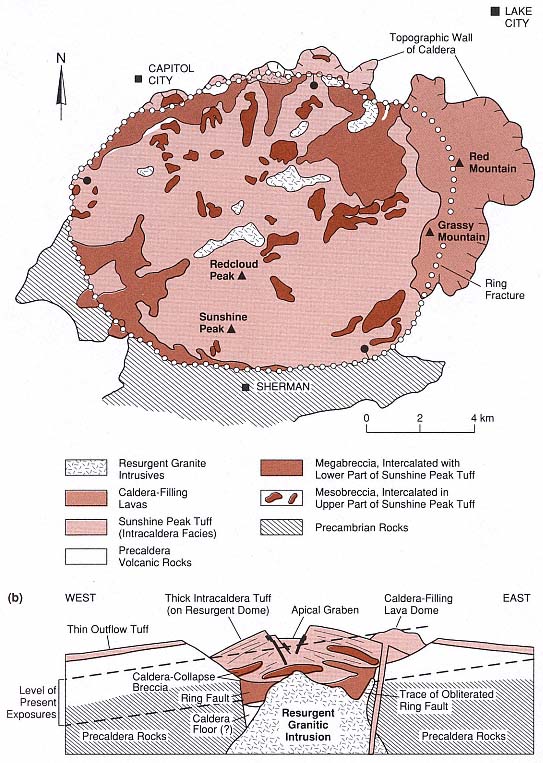
Fig. 4.7
Geologic map and schematic cross-section of the Lake City Caldera of Colorado, showing the
distribution of meso-and megabreccias that are intercalated within thick caldera-fill tuff deposits.
(Adapted from Lipman, 1976.)
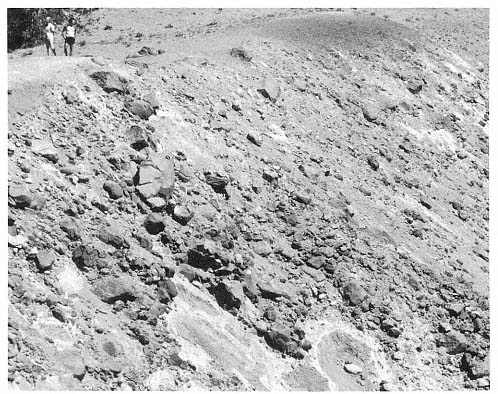
Fig. 4.8
The concentration of boulders and cobbles in the cliff shown here are lava lithic clasts that
make up a lag breccia interbedded with ignimbrites surrounding the Crater Lake caldera in
Oregon. These breccias may have been formed by gravity segregation of the dense lithic
clasts near the crater rim during the caldera-forming eruption of rhyolitic ash. Lag breccias
may be used as markers that indicate periods of caldera collapse during the eruption.
range from a few tens of degrees to 45°, as is shown in Fig. 4.7 (b). However, many resurgent domes are more complex and reflect the precaldera structural control of the caldera's shape. For example, within an asymmetric "trapdoor" caldera (hinged on one side with substantial collapse on the other side), resurgence that takes place adjacent to the bounding faults forms an oval dome parallel to those faults (Nielson and Hulen, 1984). The dome heights relative to the original crater floor range from a few hundred meters to more than a kilometer. Summits of most resurgent domes are broken by "keystone" grabens. The fault orientations of these grabens may be influenced by older structures; for example, they may follow the trend of precaldera faults in rocks underlying the volcanic field, as Nielson and Hulen (1984) noted for the Valles caldera of New Mexico (Fig. 4.11).
The probable resurgent intrusions identified in the deeply eroded calderas of Questa, New Mexico; Turkey Creek, Arizona; and Mt. Aetna, Colorado, rise above the basement rocks and intrude intracaldera tuff deposits (Hon and Fridrich, 1989). Areas of maximum uplift within these calderas are directly above the resurgent plutons. The interface between the fractured caldera floor and the block of densely welded intracaldera tuff allows rising magma to spread out. Hon and Fridrich (1989) inferred
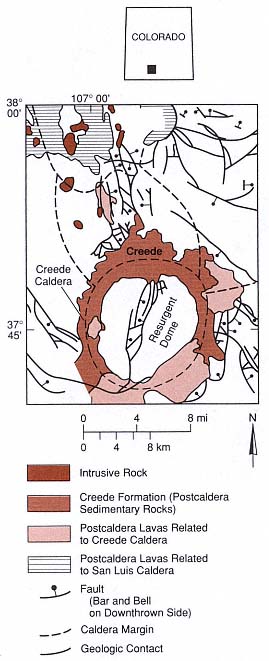
Fig. 4.9
Simplified geologic map of the Creede caldera in
Colorado, showing distribution of the Creede
Formation—tuffaceous sedimentary rocks that
partly filled the annulus (moat) between the
resurgent dome and caldera walls. The same
zone is partly filled by lava domes and flows
erupted after caldera collapse. The Creede
Formation consists of several facies from the
fanglomerate breccias of the caldera walls and
slopes of the resurgent dome, intermediate fluvial
sandstones and gravels, and lacustrine siltstones
of the annulus between caldera walls
and a resurgent dome.
(Adapted from Steven and Eaton, 1975.)
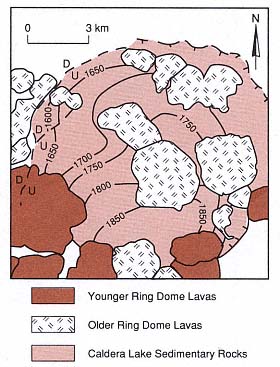
Fig. 4.10
Structural contour map of tuff deposits (known
as the "gaint pumice horizon") interbedded with
caldera lake sediments of the La Primavera
caldera in Jalisco, Mexico; elevation in meters
(from Mahood, 1980). Resurgence was
asymmetrical, with maximum uplift in the
southeastern corner of the caldera.
that initially the resurgent plutons had a laccolithic form but that this form was eventually modified when stoping during subsequent phases produced more or less cylindrical intrusions similar to the central plutons of ring complexes. Those authors also proposed that the resurgence here was more likely related to continued magmatic input (10-2 to 10-3 km3 /year rather than to renewed magmatic pressure caused by vesiculation, as was suggested by Marsh (1984).
Structural resurgence can be a rapid process. At Long Valley caldera of California, Rabaul caldera in Papua-New Guinea, and the Phlegrean Fields of Italy, active deformation of centimeters or meters have occurred over only decades (Newhall and Dzurisin, 1988).
Fig. 4.11
Map of the Valles caldera in New Mexico, showing faults that cross
the caldera complex and faults within the 1-km-high resurgent dome.
(Adapted from Nielson and Hulen, 1984.)
Resurgence can also be an intermittent process in which uplift is followed by alternating subsidence and uplift. Bailey et al . (1976) stated that inferred times for resurgence of older calderas range from <10,000 to ~100,000 years. Although the time required for resurgence obviously varies greatly, for the best-documented modern example, at the largely submarine Iwo-Jima caldera of Japan, the average rate of uplift has been 15 to 20 cm/year since the caldera floor rose above sea level 500 to 700 years ago (Kaizuka et al ., 1989).
Such structural resurgence has a significant effect on the thermal history of a caldera. Thermal gradients within resurgent calderas are higher than in calderas with no resurgence (Zyvoloski, 1987). In addition, hydrothermal systems can develop along faults associated with the keystone grabens that are typical of resurgent domes because fracture permeability is necessary for the meteoric water circulation within densely welded caldera-fill tuffs.
After caldera collapse, small, less explosive eruptions may begin along ring faults or along faults that bisect the caldera. The lavas and pyroclastic rocks erupted are less volatile-rich than the pyroclastic materials of caldera-forming eruptions (Hildreth et al ., 1984). Within most calderas, dacitic or rhyodacitic dome lavas are erupted along the ring faults over periods ranging from a few decades to >1 myr after the initial caldera-forming eruption (Fig. 4.12). Heiken and Wohletz (1987) reported that a variety of pyroclastic rocks are associated with these domes, including hyaloclastic deposits of tuff rings, ash fall beds, and small pyroclastic flow deposits. Postcaldera volcanic activity ranges from eruptions of a few isolated vents to eruptions of postcaldera domes,
cones, and flows that can fill the caldera. Calderas located along volcanic arcs at the plate margins may be partly buried by composite cones that consist of lavas and pyroclastic rocks of intermediate composition; such cones are well-documented throughout Central and South America, in the volcanic fields of Kamchatka in the Kurile islands, and along the Japanese island chain. The magmas supplying postcaldera volcanoes are far less voluminous than the caldera magma body, but they form shallow magma bodies and cause magma-induced fractures that are needed for hydrothermal systems.
Caldera Structure and Shape
The "ideal" caldera, formed during an eruption through homogeneous, unstressed rock units, is circular in plan view and plug or broadly funnel shaped in cross section (Anderson, 1936). However, the upper crust of the Earth is neither physically homogeneous nor unstressed. Caldera structure and shape are affected by prior structural trends, the depth to which the magma body has intruded, the physiographic expression of the precaldera volcanic field, and the energy of the eruption itself. Caldera complexes formed by multiple, overlapping calderas are common.
Figure 4.13 provides a cross-section view for a variety of caldera shapes. The most common caldera type is that of a subsided, semicylindrical block that is marked at the surface by concentric normal faults. In cross-section—shown in (a)—the subsiding block drops along concentric faults piece-meal, resulting in a structure that looks like the step-like seats of a stadium. In most of these calderas, the ring fault marks the actual caldera wall, but the en echelon faults of slump blocks extend out to the topographic rim. Rarely, if ever, are these calderas circular; most are oval or polygonal. The Aira and Ishizuchi calderas of Japan (Aramaki, 1984; Yoshida, 1984) and the Minoan caldera of Greece (Heiken and McCoy, 1984) are polygonal; the caldera walls follow trends of regional faults and fractures present long before those eruptions occurred (Fig. 4.14). Long Valley caldera in California, an east-west-trending oval, is almost polygonal; it is located at the intersection of major north-northwest-trending fault zones that mark the eastern boundary of the Sierra Nevada and an east-west offset in those fault zones. The giant Cerro Galan caldera of Argentina, a north-south-trending elongate oval, is adjacent and parallel to a north-south-trending rift in the Andean altiplano (Francis et al ., 1978). Most calderas exposed by either erosion or drilling fit this general model of a down-dropped block. However, there are variations on the geometry of the down-dropped block or "plug," including those with vertical faults and reverse faults that dip outward rather than inward, as depicted in Fig. 4.13 (c) and (d).
Trapdoor calderas, in plan view, are similar to the plug-like calderas and show the same variation in shape. In cross section, however, they are very different: collapse is asymmetric and one side is much lower than the other [Figs. 4.13(b) and 4.15]. Faults may mark both sides, but one side is more of a flexure or "hinge" than a fault—thus the term "trapdoor."
Nielson and Hulen (1984) and Heiken et al . (1986) interpreted the Valles caldera of New Mexico as a trapdoor caldera. It overlaps the margin of the Rio Grande Rift, where depth to the Precambrian basement is 700 m below the western caldera margin and perhaps as much as 3 km below the eastern caldera margin. In this case, the asymmetric collapse appears to be related to the distribution of underlying rocks and rift margin faults; the competent basement rocks at shallow depths act as the hinge. Many of the intermediate-size calderas in Japan (~10-km diameter), interpreted as funnel shaped, were formed not by the sinking of a cylindrical block but by the piecemeal collapse of roof rock, as is
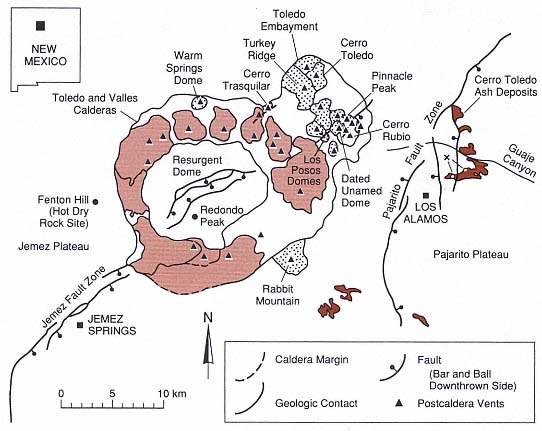
Fig. 4.12
Sketch map of the Valles/Toledo caldera complex, showing postcaldera rhyolite domes.
The stippled pattern represents Toledo-age domes (1.0 to 1.4 myr); the light brown shading indicates
Valles domes that range in age from slightly less than 1 million years to ~100,000 years.
Triangles mark the vents of intracaldera volcanoes.
illustrated in Fig. 4.13(e). An example of this type of caldera is the Shishimuta caldera of the Hohi volcanic zone in Kyushu, Japan (Kamata, 1989). This structure formed during the eruption of the Yabakei pyroclastic flow 1.0 million years ago, during which 110 km3 of tephra were erupted. The Shishimuta caldera is 8 km wide and >3 km deep. Much of the caldera fill is an andesitic breccia made up of fragments and slabs of precaldera rocks, which is overlain by 500-m-thick lacustrine deposits. There is no evidence of structural resurgence at the Shishimuta caldera. Kamata (1989) proposed that the caldera fill is primarily composed of explosively disrupted roof rock and that there is little collapse.
Small calderas, often associated with cones or tuff rings, may form when vent walls collapse into a vent that has widened during an explosive eruption [Fig. 4.13(e)]. Vent wall collapse is common in diatremes, which are the vents for small, explosive eruptions (usually phreatomagmatic) of basaltic, alkalic, or kimberlitic magmas. Such craters, however, are formed by explosive activity and the disruption of vent walls rather than by collapse over shallow magma bodies and therefore rarely have geothermal potential. By strict definition, they should not be termed calderas.
Walker (1984) has proposed that the simplest and most poorly developed
Fig. 4.13
Sketches of possible caldera shapes in cross-
section; both observed and inferred shapes
are presented here. (a) Normally faulted down-
dropped block, observed in most continental
calderas. (b) Trapdoor caldera, in which most of
the collapse occurs along one margin and the
other margin acts as a "hinge." (c) Collapse
along outward-dipping faults, as seen in some
eroded calderas in Great Britain (Anderson, 1937).
(d) Caldera subsidence along piston-like
vertical faults (inferred). (e) Collapse into a small
vent eroded during explosive eruptions, as
exhibited by some maar volcanoes and
kimberlitic diatremes; many volcanologists
would not call these calderas. (f) Simple
downsag, or flexure, without faulting; this
caldera type was proposed by Walker (1984).
(Adapted from Walker, 1984.)
calderas are "downsagged" and have little or no development of ring faults [Fig. 4.13(f)]. Walker's chief example is Lake Taupo in New Zealand, where an enormous eruption, 1800 yr BP, formed a broad, shallow depression 30 km in diameter and 300 to 500m deep. This interpretation must be considered inconclusive because the only evidence is a saucer-shaped surface expression; little is known about the extent or thickness of any possible caldera fill within the Taupo caldera.
Many of the Earth's large calderas are not single features, but caldera complexes, which are composed of adjacent or overlapping craters formed during multiple eruptions. For instance, the Yellowstone region in the United States comprises three overlapping calderas that were formed during three major eruptions that occurred at intervals of ~600,000 years. Calderas of the San Juan Mountains in Colorado, shown in Fig. 4.16, often form clusters with considerable overlap. In many cases, caldera complexes have been mapped earlier as single calderas. One can determine if a crater is composed of one or several calderas by identifying the number and ages of ignimbrites surrounding the crater. If there is only one ignimbrite, it was most likely erupted during formation of a single caldera. If there are multiple ignimbrites with considerable time gaps between eruptions, there is a very high probability of multiple, overlapping calderas. For many years, geologists believed that Toba caldera in Sumatra was formed during one eruption. However, recent work on Toba demonstrated that it is a composite caldera that formed during three major eruptions of silicic ash (Knight et al ., 1986; Chesner, 1988).
Some caldera complexes have formed not as overlapping craters, but through multiple collapses of the same crater. The Valles and Toledo calderas of New Mexico were formed during two major eruptions 400,000 years apart; the eruptions were of similar
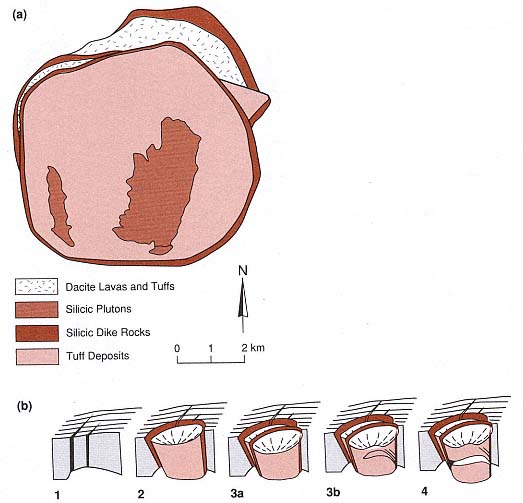
Fig. 4.14
(a) Structural map of the Ishizuchi caldera in Japan. The polygonal shape created during
caldera collapse follows the general structural grain of precaldera rocks. Faults and
fractures present before the caldera-forming eruption often control the caldera shape.
(b) Block diagrams showing stages of development of the Ishizuchi caldera.
(Adapted from Yoshida, 1984.)
magnitude and each deposited pumice falls and pyroclastic flows. These eruptions may have buried several older but smaller calderas. Drilling within the Valles/Toledo caldera complex revealed two main sequences of caldera tuff deposits and several smaller deposits—a pattern that usually correlates with tuff sequences surrounding the calderas. The younger caldera (the Valles) appears to have collapsed along the same faults as the older caldera, so that one lies on top of the other.
Geothermal Systems in Calderas
Large, young calderas and associated volcanic rocks are indicators of potentially immense geothermal resources. Smith and Shaw (1975) estimated that for every cubic kilometer of material erupted, between 3 and 9 km3 of partly molten rock resides below the volcanic field but within the upper 10 km of crust. The geothermal resource beneath a caldera exists as long as eruptive activity continues; in addition, if large silicic crustal magma bodies are
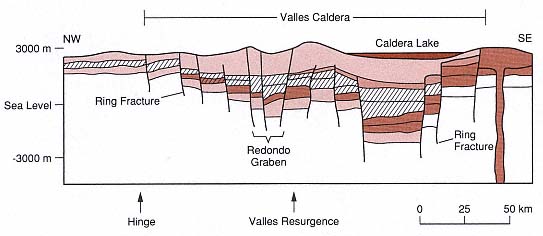
Fig. 4.15
Schematic cross section of the Valles/Toledo calderas of New Mexico. The caldera complex, which
appears to have a trapdoor shape, has a "hinge" on the northwest side where it overlies Paleozoic
sedimentary rocks and Precambrian metamorphic and igneous basement. Most collapse has
occurred along the eastern caldera margin where the caldera overlies the Rio Grande Rift
and a thick sequence of poorly consolidated rift sedimentary rocks.
formed, the resource has a lifetime of several million years after the final volcanic activity (Kolstad and McGetchin, 1978). As will be seen in the case histories discussed here, the magnitude of the accessible hydrothermal system depends entirely on the extent of permeable zones below the caldera or within the caldera deposits. In most calderas containing thick, densely welded tuff deposits, the hydrothermal systems are limited to caldera ring fractures and caldera-crossing faults, which form zones of fracture permeability. Evidence of hydrothermal activity is often seen in the acid-sulfate alteration that occurs at the surface. Acid fluids are formed when H2 S and CO2 escape from the underlying hot water reservoir and are oxidized at shallow depths. Water within these reservoirs is usually heated groundwater from recharge areas within the caldera.
Thermal models of calderas indicate that much of the elevated heat flow is conductive and that convective heat transfer is mostly limited to fault zones. Magma bodies below the larger calderas (>10-km diameter) cool slowly and may be heat sources for up to 2 million years. An example of such a system is the 15-km-diameter Valles caldera of New Mexico, where the most recent major eruption took place 1 million years ago and the most recent intracaldera eruption was 150,000 years ago. Along the keystone graben of the resurgent dome, the temperature is still 341°C at a depth of 3 km (ambient temperatures at a depth of 3 km in this region are ~110°C). Smith and Shaw (1975) estimated that within the uppermost 10 km below the Valles caldera the thermal energy is equivalent to 8425 × 1018 J. For the same caldera, Brook et al . (1975) estimated that the thermal energy of the hydrothermal systems is 81 × 1018 Joule, which is ~1% of the total heat in the system. The remaining heat is present in rock of low permeability (termed hot dry rock ) and in residual magma. For caldera systems, estimates of the amount of heat present as hydrothermal fluid range from 1 to 10%.
Nearly all hot-water circulation within known hydrothermal systems is located along active faults where there is fracture permeability. A comparison of the young Valles caldera and older, well-exposed Lake City and Platoro calderas in Colorado
indicates that hydrothermal alteration within those caldera deposits occurred chiefly along faults and over shallow intrusions (Figs. 4.11 and 4.17). However, in calderas formed during phreatomagmatic eruptions, where the underlying rocks have been highly fractured by hydraulic overpressures and the tuff deposits are nonwelded or only partly welded, there may be considerable formation permeability.
Latium Volcanoes of Italy
The Latium Volcanoes of central-western Italy are a 340-km-long, northwest-trending line of volcanic fields that extends from the Alban Hills near Rome to Bolsena Lake 180 km northeast of Rome (see Fig. 2.49). These fields consist of multiple small vents, including cinder cones, tuff rings, and calderas (De Rita et al ., 1983). Lavas and tuffs are alkalic and consist of trachytes, phonolites, and leucitites that are usually <1 million years old. The Latium volcanic chain is parallel to grabens that were active until mid-Pliocene time (Barberi et al ., 1984). The volcanic fields overlie Triassic and Eocene carbonate rocks, Lower Cretaceous to Eocene flysch deposits, and Miocene to mid-Pliocene clastic rocks. The carbonate rocks have high permeabilities; they served as excellent aquifers that supplied water for large phreatomagmatic eruptions, and now, in several fields, these rocks act as hydrothermal reservoirs. Calderas of the Latium Province were mostly phreatomagmatic; many have low, broad profiles in which the outer slopes are 1 to 1.5°. The thin, extensive ignimbrites surrounding the calderas are made up of fine-grained, nonwelded tuffs. Numerous surge deposits are interbedded with the ignimbrites. Phreatomagmatic eruptions during caldera formation and postcaldera activity within these young calderas is a good indication of the presence of hydrothermal systems.
Fig. 4.16
Calderas of the San Juan volcanic field in
Colorado, showing overlap and clustering of
calderas. For every caldera, there is a large-
volume sequence of ignimbrites within
and surrounding it.
(Adapted from Steven et al ., 1974.)
Latera Volcanic Complex
The Latera complex, consisting of a 10- by 8-km caldera that is oriented north-northeast to south-southwest, lies adjacent to the much larger Bolsena Lake, which may also be a caldera. The complex's oldest volcanic rocks are between 0.9 and 0.4 Ma (Barberi et al ., 1984). Sparks (1975) felt that both Latera and Bolsena are calderas because of their shapes and their association with nine major and six smaller ignimbrites.
At Latera, the most voluminous pyroclastic flows were erupted 0.4 million years ago. It is possible there were multiple collapses of the caldera; this theory is consistent with the presence of multiple ignimbrite units that range from 0.3 to 0.15 Ma. Figure 4.18 shows
Fig. 4.17
Comparison of a young caldera (Valles/Toledo), its active hydrothermal systems, and its surface acid
alteration zones with two older, eroded calderas (Platoro and Lake City in Colorado), their intrusions,
and zones of hydrothermal alteration. In all three calderas, most of the hydrothermal activity has
taken place along faults within caldera-fill deposits and above lobes of an intrusion.
(Adapted from Smith et al . 1970, Dondanville, 1978, and Lipman 1975; 1976b.)
the pyroclastic rock sequences exposed on the flanks of Latera; the sequences consist of interbedded surge deposits and massive pyroclastic flow deposits that include lag breccias. These tuffs are composed of very fine grained ash, which is now altered to clays, zeolites, and iron oxides. The vesiculated tuffs and abundant accretionary lapilli present are all indicators of phreatomagmatic activity. Lithic clasts within the tuffs include metamorphosed mudstones (flysch), trachyte, marble, and tephrite.
Strombolian and Vulcanian eruptions followed caldera collapse within and along the caldera margins. D. De Rita (personal communication, 1985) indicated that Latium volcanoes with a history of phreatomagmatic volcanism during caldera formation followed by magmatic volcanism (in this case, Strombolian activity that formed cinder cones) eventually develop hydrothermal systems of the greatest geothermal resource potential. Intensive hydraulic fracturing may accompany phreatomagmatic eruptions when the main source of fluid is groundwater (see discussions in Chapter 2). This activity creates a large-volume system of fractures that, when associated with a thermal source, can become a hydrothermal system.
To test the observations described above, 14 geothermal wells had been drilled into Latera caldera, one of the Latium volcanoes, by 1985. Latera caldera deposits, which range from 250 to 1500 m thick, consist of coarse tuff-breccias and interbedded pyroclastic rocks and lavas (perhaps megabreccias). The caldera is filled with mostly pyroclastic material erupted during the first caldera-forming activity, as is depicted in Fig. 4.19. The caldera tuffs contain up to 50% basement lithic clasts (flysch). Several geothermal wells have been drilled into the carbonate sequence along a structural high located on the eastern caldera margin. Barberi et al . (1984) reported that they encountered a syenite intrusion—potassium-argon data indicate that it is ~0.86 Ma—close to the caldera center, at depths of between 2000 and 2700 m. This intrusion into carbonates underlying the caldera is marked by a thermometamorphic aureole that contains garnet, idocrase, diopside, and phologopite. The thermally metamorphosed rocks are strongly fractured, and the fractures are partly filled with anhydrite, calcite, epidote, and hydrogarnet.
Of the 14 wells drilled in the Latera caldera, 9 are producing hot water and steam from limestone reservoirs and fractures in the overlying flysch units. The temperature is 150°C at a depth of 1 km, and 210 to 240°C at depths of 2 to 3 km. The production wells are located primarily within the area of youngest caldera collapse where basement rocks are highly fractured.
Baccano Caldera
Baccano caldera is one of several calderas, cones, and maar volcanoes of the Sabitini volcanic complex, which has developed within a graben. Figure 4.20 shows the concentric normal faults that bound a low depression 4 km in diameter. Baccano may be located within the older Sacrofano caldera. The eruption and accompanying collapse of the Baccano caldera occurred, perhaps in stages, during multiple hydromagmatic events between 0.36 and 0.08 Ma. Most of this activity was phreatomagmatic; the water was probably supplied from aquifers in limestones underlying the caldera or from nearby Lake Bracciano.
Ignimbrites and surge deposits are exposed on the caldera rim and outer slopes, where they overlie an 85,000-year-old travertine deposit. The ignimbrites consist of small pumice clasts with accretionary coats of fine ash in a matrix of very fine ash. The surge deposits are rich in mineral clasts and subrounded lithic clasts (phonolitic lava, mudstone, and limestone). All of the pyroclastic deposits are partly altered to clays.
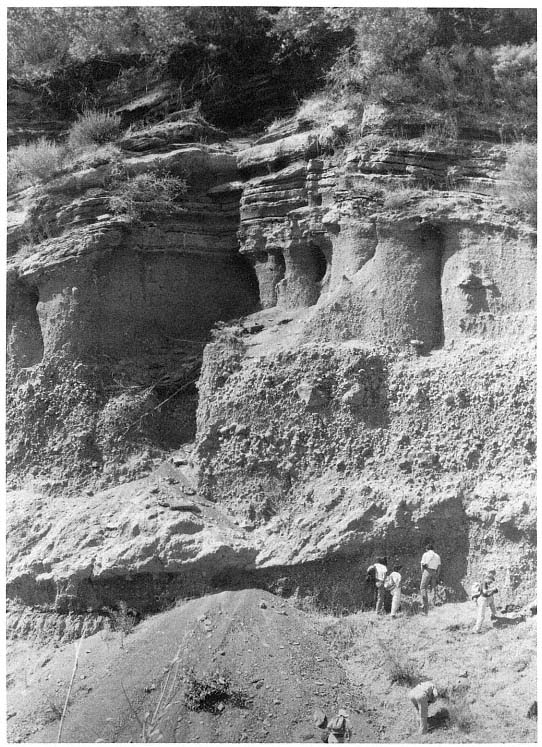
Fig. 4.18
Photograph of the pyroclastic sequence along the flanks of Latera Volcano in Italy, which consists of
interbedded scoria fall, surge, and ignimbrite deposits. The outcrop, along Poggio della Valicella,
follows the western shore of Bolsena Lake.
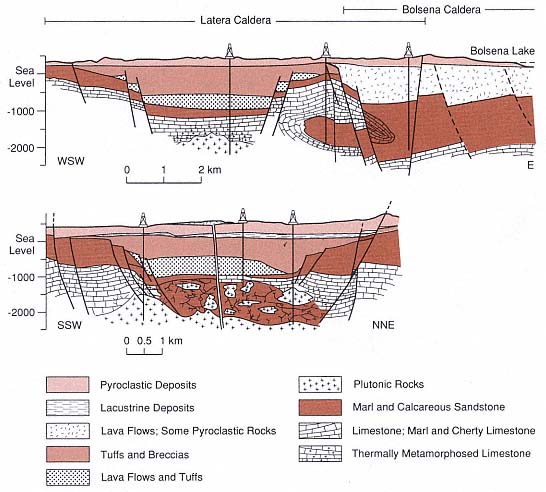
Fig. 4.19
Interpretative cross sections of the Latera and Bolsena calderas in Italy. The caldera-forming
eruptions of these calderas had a large phreatomagmatic component as a result of magmas
interacting with groundwater within permeable limestone units underlying the volcanic field. The main
hydrothermal reservoirs are located within the sedimentary rocks (mostly limestones) beneath
Latera caldera and along one margin within a horst. Cross sections are based upon geologic mapping,
geophysical surveys, and drilling samples. The magma body that provides heat to the hydrothermal
system was intersected by drilling below the center of Latera caldera.
(Adapted from Barberi et al ., 1984.)
Four geothermal wells (C-1 to C-4), with depths of 1400 to 3000 m, have been drilled within the Baccano caldera (Funiciello et al ., 1979). Temperatures of 300°C were measured in drillholes at depths of 3 km. Underlying the caldera are shales, marls, sandstones, and limestones of Middle Cretaceous age; Miocene flysch deposits; Upper Triassic to Oligocene carbonates, including marls, limestones and interbedded chert; and Triassic black limestone. The main hydrothermal reservoir is located in fractured carbonate rocks under a cap of the shaly rocks of the argille scagliose (a thick sheet of chaotic, slickensided clays that was displaced along low angle faults). The reservoir
consists of mixed hydrothermal fluids and shallower groundwater within the caldera deposits (Calamai et al ., 1976).
The Phlegrean Fields in Italy
One of the Earth's more famous volcanic fields is the Phlegrean Fields (Campi Flegrei), which lies adjacent to the city of Naples and forms not only much of the margin of the Bay of Naples but also part of the Campanian Plain. Nearly all the volcanism there has occurred during the past 50,000 years and most of it has been phreatomagmatic. Trachytic magmas rose to the surface to mix with groundwater and/or sea and lake water; this interaction produced volcanic forms that range from small tuff rings to the Phlegrean caldera complex. The information for the following discussion was condensed from papers and reports by Barberi et al . (1978), Cameli et al . (1976), Rosi et al . (1983), Lirer et al . (1987), and Rosi and Sbrana (1987) as well as unpublished work by G. Orsi.
One of the major events in this area was the eruption of the Campanian Ignimbrite 32,500 years ago (Paterne et al ., 1988). This widespread ignimbrite, chemically zoned from phonolite to trachyte, is believed to have had a volume of ~80 km3 (dense rock equivalent). Barberi et al . (1978) and Rosi et al . (1983) proposed that caldera collapse during this eruption left a crater 13 km in diameter that covered what is now the Phlegrean Fields and a portion of the Bay of Naples (Fig. 4.21). Authors have referred to this caldera complex as the "Campanian Ignimbrite caldera" and the "Phlegrean caldera," which we use here. Caldera-fill deposits range from 500 to >3000 m thick and consist of tuffs, tuff-breccias, and nonwelded pyroclastic rocks; these deposits may be partly the Campanian Ignimbrite and partly tuffs from younger explosive eruptions that are interbedded with conglomerates and sandstones (Bruni et al ., 1983).
More recent geophysical research by R. Scandone (personal communication, 1990) interprets a negative gravity anomaly located on the Campanian Plain northeast of Naples near Mount Vesuvius as the source of the Campanian Ignimbrite.
The Neapolitan Yellow Tuff (NYT) and Gauro Yellow tuff (GYT), dated at ~12,000 years BP, are exposed over a large area surrounding the Phlegrean Fields and are also encountered in geothermal drillholes within the caldera complex. Lirer et al . (1987) proposed that the NYT eruption formed a smaller caldera, ~6 km in diameter, that is centered on the town of Pozzuoli and the Gulf of Pozzuoli. These tuff units resulted from the largest multiple, significant phreatomagmatic eruptions since that of the Campanian Ignimbrite. The caldera complex of the Phlegrean Fields is also most likely a composite structure that was formed during several eruptions.
Some of the younger rocks of the Phlegrean fields make up tuff rings, tuff cones, and scoria cones, for which crater diameters range from a few hundred meters to 2 km. The youngest eruption formed Monte Nuovo in 1568 AD, and structural resurgence of the caldera has continued intermittently throughout historical time. The latest activity—between 1970 and 1985 AD—affected much of the Phlegrean Fields. The maximum uplift (240 cm) was centered in the town of Pozzuoli; resurgence is believed to be the result of magma injection at shallow depths. Recent movements along active faults are common throughout the volcanic field. There are numerous surface manifestations of geothermal systems, including the fumaroles and acid alteration found at Solfatara Crater and numerous hot springs.
Drilling within the Phlegrean Fields has revealed a high-temperature hydrothermal system that developed within the siltstones and sandstones of prevolcanic rocks and the tuffs and lavas of the caldera deposits. Temperatures range from 335°C at a depth of 2.5 km to 420°C at a depth of 3.04 km, and the average thermal gradient is 150°C/km.
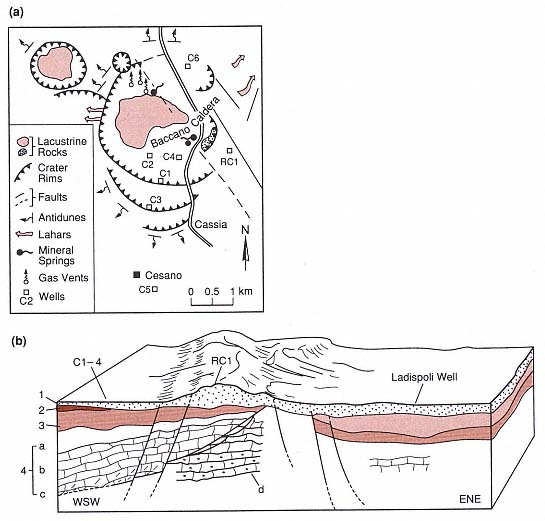
Fig. 4.20
Baccano caldera in Italy. (a) Structural sketch map showing the concentric ring faults around this
small caldera, flow directions of surge deposits and volcanic mudflows (lahars), caldera lake
deposits, and spring and well locations. (b) Cross section through the Baccano caldera (left) into the
larger Sacrafano caldera (right). The caldera is underlain by Mesozoic- and Cenozoic-age limestones
and marls (1 = volcanic rocks; 2 = Neogene-Pleistocene sedimentary rocks; 3 = Argille Scaglisose; and
4 = Mesozoic and Cenozoic sedimentary rocks. a = marl and limestone; b = limestone; c = limestone
and dolomite; d = anhydritic dolomite). Abundant groundwater and permeability within these
units probably provided the water needed for phreatomagmatic activity at Baccano.
(Adapted from Funiciello et al ., 1979.)
Fig. 4.21
The Phlegrean Fields of Campania, Italy. These maps are composites of those by Rosi and Sbrana (1987)
and Lirer et al . (1987). (a) Outlines of the Phlegrean and Neapolitan Yellow Tuff (NYT) calderas within
and around the Bay of Naples and the cities of Pozzuoli and Naples. Submarine topographic contours
are indicated in meters. (b) Volcanic-tectonic sketch map of the Phlegrean and NYT calderas
(the Phlegrean Fields), showing the location of all postcaldera craters and lava domes. Within the
Phlegrean Fields, most of the volcanic activity has been phreatomagmatic; the rising magma
has interacted with groundwater and sea water. The cross section in (c) is based mostly on
data from the deep geothermal wells noted on this map.
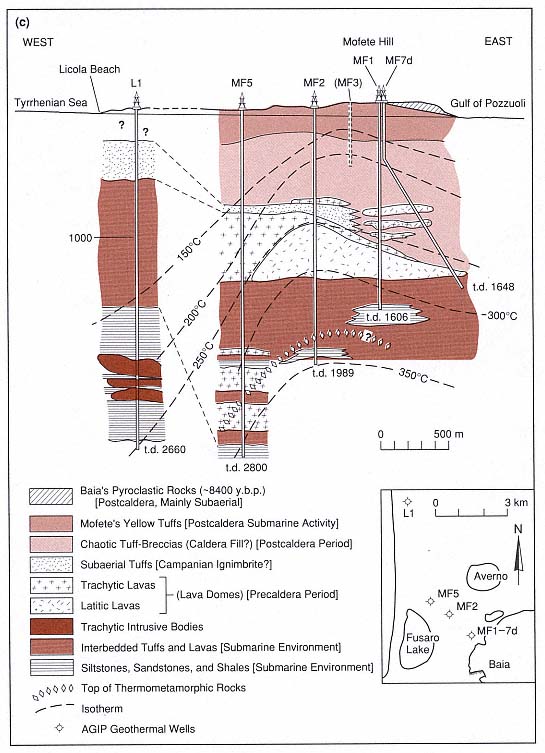
Fig. 4.21
(c) Cross section of the Mofete
geothermal area of the western Phlegrean caldera. The "chaotic tuff-breccias" and
"subaerial tuffs" could be caldera-fill materials that were
deposited during the eruption of the Campanian Ignimbrite.
(Adapted from Rosi and Sbrana, 1987.)
Hydrothermal fluids have risen along the faults bounding caldera structures and those that cross the volcanic field [Fig. 4.21(c)]. With the exception of fluids that rise along these faults, hydrothermal activity has been restricted to deep caldera fill, as is evident from the observation that the upper 500 m of pyroclastic deposits are not altered. These deposits overlie thick zones composed of argillic and illitechlorite alteration products. Hydrothermal fluids circulate within intensely fractured rocks near the caldera center, whereas low vertical permeability is characteristic of the outer caldera margins. Nearly all hydrothermal circulation within the caldera takes place within areas that have fracture permeability. There is no formation permeability except within near-surface aquifers. Thermally metamorphosed tuffs, sandstones, and lavas were found in the deepest wells, where rocks have been replaced by amphibolite-biotite and diopside, scapolite, garnet, and epidote. Similarly metamorphosed rocks have been found as lithic clasts within tuff units of the Phlegrean Fields.
In the Mofete geothermal field located near the western edge of the Phlegrean caldera, Carella and Guglielminetti, (1983) identified three water-dominated reservoirs in which water is the continuous, pressure-controlling system and there is little vapor [Fig. 4.21(c)]. The deepest reservoir, at a depth of 2700 m, contains hypersaline fluids at a temperature of 360°C; the intermediate reservoir, at a depth of 1900 m, contains low-salinity fluids at a reservoir temperature of 340°C; and the shallowest reservoir, between 500 and 1500 m deep, contains low-salinity water at temperatures of 230 to 308°C. The two deep reservoirs are located within thermally metamorphosed pyroclastic and epiclastic deposits; whereas the thick, shallow reservoir is sited within fractured volcanic rocks—mostly lavas—and is capped by tuffs that have been altered to clays.
Taupo Volcanic Zone in New Zealand
Geologic Setting
The Taupo volcanic zone (TVZ) of the North Island of New Zealand is a 250- by 60-km zone of young silicic and andesitic volcanoes that occupies a north-northeast-trending structural depression. The TVZ consists of offshore andesitic composite cones to the northeast, a central section containing at least six caldera complexes, and a southern center consisting of andesitic composite cones. The central part of the TVZ, which is ~125 by 60 km, is mostly made up of silicic calderas and has a geothermal resource of ~2000 MWe Donaldson and Grant, 1978). An assessment of the geothermal resource potential for individual fields in the TVZ is presented in Table 4.2.
The central section of the TVZ reaches elevations of 300 to 600 m and the depth to basement within the graben is 500 to 1000 m below sea level (Healy, 1982). The basement is even lower below the calderas themselves. Rogan (1982) found steep gravity gradients at the TVZ margins and conservatively estimated that the volume of tuffs, lavas, and associated sedimentary rocks within the central TVZ is ~12,000 km3 . Much of the activity responsible for this erupted material occurred during the past 1 million years.
The calderas of the TVZ have been favorable targets for geothermal drilling and development for many decades, but comprehensive volcanological studies of the calderas are more recent (for an excellent summary paper, see Wilson et al ., 1984). We chose to discuss here the well-known Wairakei geothermal field, which is the site of one of New Zealand's largest geothermal generating plants.
|
||||||||||||||||||||||||||||||||||||||||||||||||||||||||||||||||||||||||||||||||||||||||||||||||||||||||||||||||||||||||||||||||||||
Maroa Volcanic Center and Wairakei Geothermal Field
The Wairakei geothermal field is located along the common boundary of the Maroa and Taupo volcanic centers, following north-northeast-trending faults that cross both centers (Fig. 4.22). Maroa has a negative gravity anomaly that Rogan (1982) modeled as a 15- by 10-km basement depression with a volume of 250 km3 below the local base level (-1000 m). Wilson et al . (1984) used magnetic data to interpret the presence of thick caldera deposits in the area.
The Maroa center has developed during the last 250,000 years. Its oldest rocks, the rhyolitic domes of the Western dome belt, appear to have erupted along a basement graben during the same time period in which the central dome complex was erupted. The basin is filled mostly with interbedded rhyolite lavas and poorly to nonwelded ignimbrites. Domes exposed at the surface form north-northeast-trending clusters that are parallel to the normal faults of the area [Figs. 4.22 (a) and (b)] and overlap domes of the Taupo volcanic center. The youngest eruption, (14 to 15 ka) was a small, partly
Fig. 4.22
(see also pages 173 and 174) Maroa volcanic center and Wairakei Geothermal field in New Zealand.
(a) Simplified geologic map showing the location of the two basins (calderas?). Depth to basement
along contour line is ~1500 m. The Wairakei geothermal field and rhyolite domes of Maroa are shown.
(Adapted from Wilson et al ., 1984.)
Fig. 4.22
(b)Structural map of the Wairakei geothermal field shows location of the cross-section depicted in (c).
(Adapted from Grindley, 1965)
phreatomagmatic eruption; this explosive activity was followed by a dome eruption. The summary of eruption activity presented in Table 4.3 was compiled by Wilson et al . (1984).
Within the Wairakei geothermal area, ignimbrites and associated rocks thicken from west to east and into a depression bounded by fault scarps. The area now defined as the Wairakei Basin is part of the Maroa volcanic center. The Wairakei Ignimbrites described by Grindley (1965) are more than 520 m thick and consist of several sheets separated by "pumiceous sediments" (perhaps pumice fallout or surge deposits). Grindley also reported that the younger Huka Group, which Wilson et al . (1984) called the Maroa-derived ignimbrites, includes sequences of "pumice breccia," ignimbrites, phreatomagmatic tuffs, and tuffaceous lacustrine sedimentary rocks. This group thickens from 713 m—over the Wairakei fault-bounded horst—to >1.2 km in the Wairakei Basin [Fig. 4.22 (c)]. Overlying the Huka Group is the "Wairakei Breccia" (Grindley, 1965), which was renamed the "Wairakei Formation" by Self and Healy (1987); these deposits, erupted 20,000 years ago, consist of pumice falls, fine-grained ashfalls, and nonwelded ignimbrites.
The rhyolite domes of the Central Dome Complex and the Maroa-derived ignimbrites have been intersected by drillholes along a northeast-trending line from the western perimeter of the Wairakei geothermal field toward the Central Dome complex visible at the surface. The domes are interbedded with tuffs of the Maroa-derived pyroclastic rocks, and the entire section is overlain by thin deposits of the youngest Taupo ignimbrites.
The greatest hydrothermal activity is located along a 3.2- by 3.2-km northeast-trending horst, which is close to the boundary between the Taupo and Maroa volcanic centers. Grindley (1965) found that much of the geothermal fluid movement is along deep-seated faults running parallel to major horsts and grabens (Fig. 4.22b). Some phreatic craters are also located along fault traces. The greatest permeability is found along fault zones, although there may be some formation permeability within non-welded ignimbrites. Drilling along these faults has intersected hydrothermally altered fault breccias that are cemented by hydrothermal minerals. At Wairakei, the most productive wells are sited on the downthrown side of surface fault traces, whereas wells sited on the upthrown side were less productive (Grindley, 1965). Wells drilled away from faults encountered impermeable, cemented pyroclastic rocks and did not produce geothermal fluids.
There is some difference of opinion about the origin of the Maroa and Wairakei basins. Grindley (1965) interpreted them as volcano-tectonic, with emphasis on the tectonic aspects. On the other hand, Wilson et al . (1984) interpreted the center as a caldera that underlies the central rhyolitic dome complex; these authors comment, however,
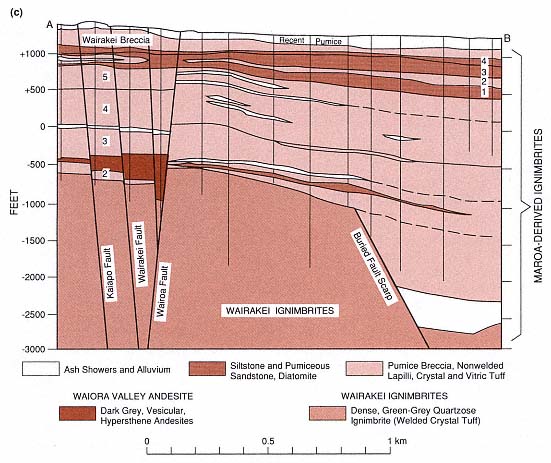
Fig. 4.22
(c) Cross-section through the Wairakei geothermal field, showing increasing thickness of the
Maroa-derived ignimbrites into the Wairakei basin.
(Adapted from Grindley, 1965.)
that there is little surface evidence for such a caldera complex. By examining the data presented by both sets of authors, it is possible to come up with at least one additional interpretation that is based on several points.
· Depths to basement presented by Wilson et al . [Fig. 4.22 (b)] indicate the presence of two overlapping basins: the Wairakei, with a depth to basement graywacke of 2000 m, and the unnamed basin below the central dome complex, with a depth to basement of 2500 m.
· The variety of ignimbrites and associated rocks (the Maroa-derived ignimbrites described by Wilson et al . and the Huka Group and Wairakei Ignimbrite referenced by Grindley) that thicken into the Wairakei basin could be evidence for multiple ignimbrite eruptions and associated caldera collapse.
· There are multiple overlapping calderas in the Maroa volcanic center and two of them correspond to the basins defined by depth to basement.
Whichever the interpretation of the history and makeup of the Maroa volcanic center one accepts, all the indicators for the presence of a geothermal system are here: surface manifestations (including phreatic craters, hot springs, and fumaroles), numerous normal faults, multiple young ignimbrite units, and young silicic domes and flows.
|
||||||||||||||||||||||||||||||||||||||||||||||||||||||||||||
Chapter 5—
Silicic Domes:
Heat Flow around Small, Evolved Magma Bodies
Silicic domes are distinct volcanic structures associated with nearly all types of volcanic landforms; they are perhaps the most common surface expression of evolved magma bodies. Domes and dome complexes are generally found in both early and late stages of silicic caldera evolution. These domes and dome complexes, sometimes the only volcanic feature found in a volcanic field, characterize late stages of composite cone evolution and often form along major tectonic lineaments.
Distinct hydrothermal systems develop below and within silicic domes. The heat source provided by dome lavas is usually short-lived and of little hydrothermal significance, but persistent hydrothermal systems manifested in and around domes are a good indicator of a much larger thermal source at depth below the field. Such thermal sources are commonly moderate-sized, differentiated magma bodies. These hydrothermal systems generally develop in pyroclastic strata and fractured country rocks below the dome that were formed during the initial stages of dome eruption. The systems manifest themselves as fumarolic areas and exhibit extensive hydrothermal alteration in and around the dome. Ishikawa (1970) noted that most geothermal areas in Japan are located in Quaternary volcanic zones, where andesitic and dacitic domes or spines plug crater vents, and in Tertiary volcanic districts that are closely related to intrusions of viscous, acidic magmas.
The following discussions review volcanological characteristics and models of domes as well as their lavas and tephras, the
geothermal systems below that are manifested by these domes, and the relationships among the tectonic setting, magma composition, country rock, and the hydrothermal system. Case histories are drawn from geothermal studies at Coso volcanic field of California, the Usu area of Japan, and the Terre Blanche-Belfond dome complex in the Qualibou caldera of St. Lucia.
Silicic Domes and Extrusion of Viscous Lava
Extrusions of viscous lava form domes in many different volcanic settings during the evolutionary stages of volcanic fields. Because viscosity depends on thermal, compositional, and textural factors, lava compositions from andesite to rhyolite can display relatively high viscosities (105 to 1012 Pa/s; Murase and McBirney, 1973); therefore, the rheology of such viscous fluids is the dominant feature in controlling extrusion mechanisms.
Common Geologic Settings
Table 5.1 lists some common occurrences of domes in various volcanic settings. The most common are lava domes of dacite and rhyolite that form before and after caldera collapse. These extrusions, which generally appear in groups of at least several vents along major structural features such as ring faults and resurgent cores in calderas, are manifestations of larger bodies of differentiated magma at depth. Silicic domes are frequently associated with composite cones in late evolutionary stages (see the discussion in Chapter 7). In these cases, domes form either plugs in the central vent region of the cone or parasitic vents around the flanks of a composite cone. Silicic domes may also occur as isolated extrusions along major tectonic lineaments such as grabens near plate boundaries and rifts. In addition, domes appear in or near explosion craters that are created by gaseous bursts preceding the extrusion of viscous lava.
Evolution and Internal Structure
Figure 5.1 illustrates a common evolutionary scheme for silicic domes. Preceding activity is usually marked by the passive or explosive release of gases at depth above a rising mass of viscous lava. Such a release might be characterized by only fumarolic activity and bulging ground. On the other hand, the gases can be released in violent explosions when high-pressure gases from either vaporized groundwater or the gas-rich top of the magma body burst through the ground surface in crater-producing eruptions. Because of the high viscosity of dome lavas, the extrusion process may continue over periods of months to years. Figure 5.2 depicts types of domes, including both endogenous and exogenous forms. The lava structures formed at domes are distinctive because of the complex rheology as a result of lavas ranging from viscous to
|
|||||||||||||||
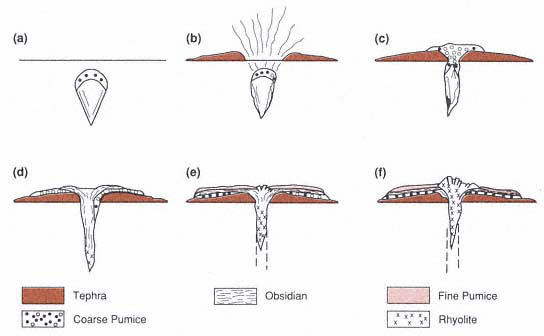
Fig. 5.1
Idealized diagram showing the eruptive evolution of silicic domes. (a) Magma with volatile-rich
pumiceous top approaches surface. (b) Initial pyroclastic eruption in which volatiles and pumice
erupt to form tuff ring. (c) Cessation of explosive eruptions and emplacement of coarsely pumiceous
rhyolite lava. (d) Extrusion of obsidian over coarse pumice. (e) Development of a mantle of finely
pumiceous lava. (f) Final extrusion of crystalline rhyolite.
(Adapted from Fink, 1983.)
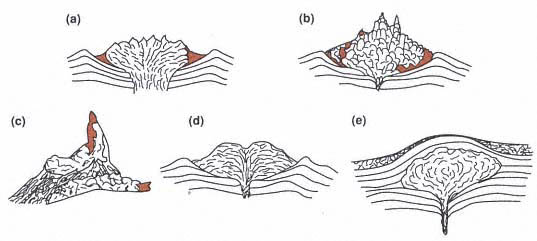
Fig. 5.2
Forms of endogenous and exogenous domes, showing various fracture foliations. (a) Upheaved,
exogenous dome similar to that illustrated in Fig. 5.1. (b) Peléean dome showing vent spines,
blocky fracture, and development of talus aprons. (c) Detail of vent spine of Mont Pelée
(from Lacroix, 1904).
(d) Exogenous dome that discharges viscous flow lobes from a summit vent. (e) Intrusive
dome in which viscous magma body is emplaced just below the earth's
surface and maintains a carapace of upwarped strata.
(Adapted from Williams and McBirney, 1979.)
partly solidified. These lava flows exhibit behavior varying from that of a Bingham fluid to that of a brittle, plastic rock (Shaw, 1972; Hulme, 1974; Fink, 1980a).
The surfaces of silicic lava domes are characterized by a wide variety of textures that produce variations of color, flow layering, crystallinity, and vesicularity. Fractures and foliations in the lava are useful for mapping the surface of domes—and especially for locating the vent area (Fink, 1983; Fink and Pollard, 1983). Figure 5.3 illustrates the development of foliations in lava domes, and Fig. 5.4 shows surface distributions of flow features at an obsidian flow.
Silicic dome lavas generally develop a textural stratigraphy related to their cooling, vesiculation, and crystallization during extrusion (Fig. 5.5; Figs. 5 and 7 in Fink and Manley, 1987). However, such textural features can easily be mistaken for those that develop during the welding of pyroclastic flows. Basal tephra layers are often found because dome extrusions are commonly initiated by pyroclastic eruptions of the gasrich tops of silicic bodies; but a flow breccia, if found above the tephra layer, can distinguish dome/lava-flow stratigraphy from that of welded ash flows. Obsidian layers near the base and top of the flow stratigraphy are similar to the quench vitrophyres that develop in similar positions in welded ash flows. The central portion of dome/lava-flow stratigraphy consists of crystalline lava, which frequently contains lithophysae. This textural type grades upwards into glassy and pumiceous zones that can be mixed into the crystalline part of the flow; in such a complex textural case, it is again difficult to distinguish the lava textures from those of welded pyroclastic deposits. However, scanning electron microscope analysis may differentiate the origin of the complex textural character. For example, vestiges of shard and pumice textures, revealed by electron microscopy, are very flattened and elongated in welded tephra. This distinction is very difficult to observe in rheomorphologically deformed tuffs, and field relationships are used to determine the dome origin of silicic volcanic rocks (Bonnichsen and Kauffman, 1987). Fink and Manley (1987) noted that small domes display little textural variation and usually display structural evidence of their vent geometry. This is not the case for larger silicic lava extrusions because they can exhibit all the textural features discussed above.
Fink and Manley (1987) discuss three principal steps in the development of textures in silicic lava flows and domes.
(1) Crystallization and the accompanying release of magmatic volatiles is strongly related to cooling rate and flow stresses.
(2) Microcracks, formed during the lava's advance, allow gases to escape upward.
(3) Quenching of the upper surface creates a crust of high yield strength that resists flow deformations.
These three processes result in the formation of a gas-rich, low-density layer below the crust that can rise buoyantly. This layer eventually may break through the surface crust, producing the banded appearance of silicic lava flow surfaces. Bonnichsen and Kauffman's (1987) summary for the development of rhyolite lava flow textures is shown in Table 5.2.
Tephra Deposits Associated with Silicic Domes
Pyroclastic activity accompanies most phases of dome growth and is manifested as explosive activity. Newhall and Melson (1987) analyzed explosive activity during volcanic dome growth with respect to history, rate of growth and petrologic controls. Heiken and Wohletz (1987) reviewed dome-related tephra deposits and proposed four main types of eruptions (Fig. 5.6):
(1) Plinian and phreatomagmatic eruptions preceding dome growth,
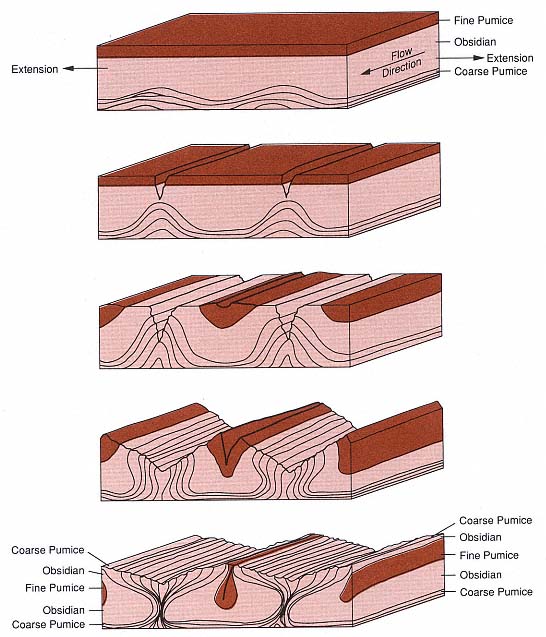
Fig. 5.3
Schematic diagram of lava foliation development. Successive block diagrams show the gradual rise of
coarse pumice diapirs while fractures propagate into the flow along the axes of flow and diapir
anticlines. Fink (1980b) reported that the diapirs form in response to a density inversion between
the relatively dense obsidian overlying the coarse pumice at the base of the flow.
(Adapted from Fink, 1983.)
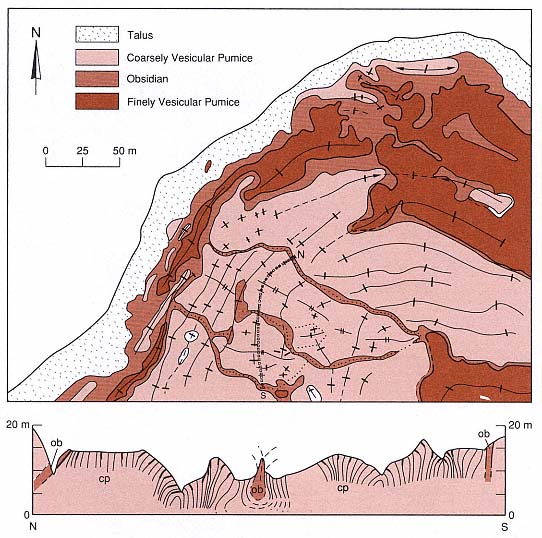
Fig. 5.4
Illustration of the surface geology of a rhyolite flow. This map depicts the northwestern lobe of
the Little Glass Mountain flow in northern California; the cross-sectional profile is from north to
south along the line

and the coarse pumice diapirs are denoted "cp."
(Adapted from Fink, 1983.)
(2) periodic Vulcanian explosions during dome growth,
(3) Peléean and Merapian activity resulting in dome destruction, and
(4) phreatic explosions during hydrothermal and fumarolic activity.
Table 5.3 summarizes the characteristics of tephra produced by these types of eruptions, and they are discussed in more detail here.
Initial Plinian and Phreatomagmatic Eruptions
Magmatic and hydromagmatic eruptions, which commonly herald new extrusions of dome lavas, create tuff rings and cones around vent craters. These eruptions follow depressurization of the gas-rich rising magma and its interaction with ground and surface water.
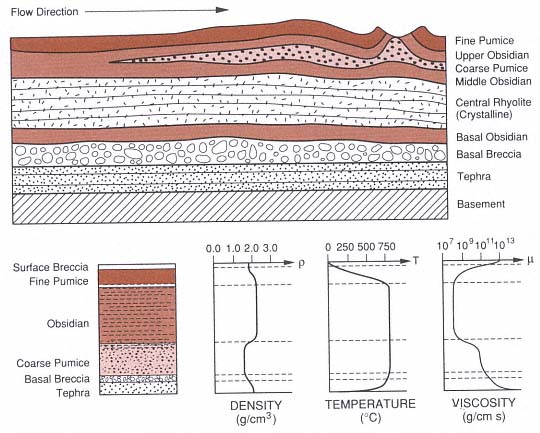
Fig. 5.5
Textural stratigraphy of dome lava. The cross section shows rhyolite lava-flow stratigraphy resulting
from the eruption scenario outlined in Fig. 5.1. The profile of density, based upon actual
measurements, shows an important density inversion at the top of the coarse pumice that
promotes coarse pumice diapirism. The temperature profile is calculated by conductive cooling,
assuming a constant internal temperature, and it shows a steep surface gradient that causes
fracturing. The viscosity profile is based on the laboratory measurements of Friedman et al . (1963).
(Adapted from Fink, 1983, and Fink and Manley, 1987.)
Figure 5.7 schematically illustrates tephra production that precedes dome formation. Magmatic eruptions produce pumice and ash deposits of a Plinian type, whereas phreatomagmatic (hydrovolcanic ) explosions result in fine-ash dispersal during pyroclastic surges and flows, which creates a tuff ring. Such eruptions usually produce most of the tephra associated with domes, but Heiken (1978b) found that their volume generally is relatively small (<0.1 km3 ) to moderate (1.0 km3 ). Near the vent, these tephra are well bedded and capped by lavas from the dome. Where the tephra extend several to tens of kilometers away from the vent, fallout layers are the most common expression.
Vulcanian Eruptive Cycles
Occurring during both growth and destructive phases of dome activity, Vulcanian eruptions tend to be periodic—especially where dome growth is prolonged by new magma
|
rising into previously constructed domes and plugs. Well-documented examples of such activity come from Soufriere of St. Vincent in the West Indies (Shepherd and Sigurdsson, 1982), and the type locality of the Fossa Cone on the Island of Vulcano, Italy (Frazzetta et al ., 1983). Typical tephra deposits consist of ash and lapilli falls, thinly bedded coarse and fine ash, dry and wet surge beds, and lahars. Distinctive of Vulcanian tephra are coarse ash deposits that contain blocky fragments of obsidian, older lavas, and poorly vesicular glass. Pumice fragments tend to be deposited during later stages of the eruptions when new magma reaches the surface and becomes highly vesicular. Most tephra erupted during Vulcanian dome destruction are those typical of hydrovolcanism (Fig. 5.8).
The cyclic activity of Vulcanian tephra production at domes is closely related to both the periodicity of magma rise within the volcano and vent-clearing explosions that provide a pathway for the new magma through older dome lavas. Such cycles are typical of composite cones in late stages of evolution (see Fig. 2.16) when sequences of wet, and then dry, hydrovolcanism are followed by magmatic pumice eruptions and finally by silicic lava emplacement. In areas of coalescing domes, such as ring fracture areas, the cycle may only occur once, leaving a blanket of tephra over older dome lavas.
|
|||||||||||||||||||||||||||||||||||||||||||||
Peléean and Merapian Dome Destruction
Tephra deposits found on the flanks of silicic domes developed from disintegration of the extruded lava either closely following or years after its extrusion (Peléean and Merapian, respectively). Such deposits consist of poorly vesicular lithic pyroclasts that were derived from partly to completely solidified lavas emplaced as block and ash flows. Some examples of these products are provided by the 1902 eruption of Mont Pelée, Martinique (Fisher and Heiken, 1982) and the block and ash flows of the 1930 dome collapse at Merapi, Java (Neumann van Padang, 1931). Figure 5.9 illustrates two types of dome destruction, both of which began with the brittle failure of lava. At Mont Pelée, the recently extruded lava spine was apparently highly charged with gas trapped in vesicles; when the lava crumbled, the vesicles violently discharged gas—and thus drove the comminution of the lava. At Santiaguito dome in Guatemala, the front of a silicic lava flow collapsed and disintegrated into a pyroclastic flow because of trapped gases (Rose et al ., 1976). The mechanical strength of the lava can degrade, which produces explosions; this situation is often connected to fumarolic activity. Hydrothermally altered lithic fragments are common in tephra of Peléean and Merapian activity.
Phreatic Eruptions
Phreatic explosions usually produce craters in the vent and fumarolic areas of silicic domes and lava flows. They also produce mantling layers of fine-grained tephra, explosion breccias, and small tuff rings and cones. Although phreatic tephra do not generally contain juvenile components, it is understood that phreatic activity can be a precursor to magmatic eruptions, as is shown in Fig. 5.10. The tephra most frequently associated with favorable geothermal prospects in domes are accidental lithic fragments that are strongly
Fig. 5.6
Stratigraphic relations of dome tephra. Four principal occurrences are schematically illustrated:
(a) Plinian and phreatomagmatic eruptions of tuff rings and cones (shown with overflowing lava
plug), (b) coalescing domes with phreatic and phreatomagmatic carapaces, (c) Plinian, far-field
pumice falls and flows, and (d) Peléean avalanches and Vulcanian intercalated tephra (flank
deposits) at polygenetic domes and composite cones.
(Adapted from Heiken and Wohletz, 1987.)
Fig. 5.7
Schematic illustration of initial Plinian
and phreatomagmatic eruptions
(a) in an initial Plinian stage and
(b) followed by phreatomagmatic explosions.
(Adapted from Heiken and Wohletz, 1987.)
altered and coated with clays. In many cases, phreatic tephra deposits are limited to areas where strong hydrothermal activity has led to a build-up of high-pressure steam below or within a sealed caprock. Failure of the caprock results in steam explosions and the formation of phreatic pits and ejecta layers.
Hydrothermal systems associated with silicic domes take on configurations that are controlled by dome stratigraphy and structure as well as the structural setting of the region. Even though the heat contained in dome lavas may be relatively insignificant, that provided by an underlying differentiated intrusion can drive hydrothermal convection if sufficient water is present. Because water is a fundamental component of eruptions of silicic domes, in this chapter we will reiterate its function and expression in eruption phenomena and then illustrate its subsequent hydrothermal behavior through hypothetical models.
Hydrothermal Systems Associated with Domes
Role of Water in Dome Eruptions
In the above descriptions of dome-related tephra, water from either meteoric or magmatic sources is the primary volatile phase that leads to pyroclast formation. Magmatic water is widely recognized as a primary phase that contributes to the formation of pumice and promotes Plinian tephra emissions. The same water has a profound effect on the development of dome lava textures such as flow foliation, crystallization, vesiculation, and fumarolic (vapor-phase) alteration. The latter effect is especially important in weakening the dome and making it vulnerable to future phreatic or Merapian bursts that produce tephra. On the other hand, meteoric waters also contribute to fumarolic and phreatic activity, and it may be difficult to distinguish its effects from those of magmatic water.
Because water is of such consequence in hydrothermal systems, it is important to identify any evidence of its presence in the dome. The best evidence is hydrovolcanic activity, which is common in the pyroclastic activity that precedes dome extrusion. However, meteoric water is also vital for Vulcanian activity during dome growth. The presence of lahars on dome flanks is most reliable in identifying the presence of meteoric water, whether from rainfall or from saturated conditions of fractured, porous lavas beneath the dome. In the case of either magmatic or hydrovolcanic explosive activity, tephra layers provide avenues for water circulation in hydrothermal systems that are driven by residual magma heat below the dome.
Heiken and Wohletz (1987) discussed the migration of magmatic and meteoric water in dome magma systems as a diffusion process and emphasized that this process can proceed at many different rates, often
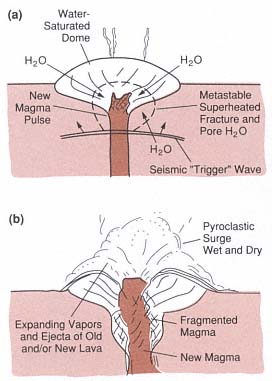
Fig. 5.8
Schematic illustration of Vulcanian tephra
associated with dome destruction in
(a) preeruptive and (b) eruptive stages.
(Adapted from Heiken and Wohletz, 1987.)
well above those established by laboratory measurements (Shaw, 1972). High effective diffusion rates are expected for hydrovolcanic situations in which meteoric water diffuses from host rocks into the rising magma to cause magma/water interactions such as explosive phenomena and the pervasive chemical alteration of tephra. The development of lithophysae and vaporphase alteration and crystallization, which are generally attributed to magmatic water diffusion in extruded lava, can proceed at rates higher than those expected for slow molecular diffusion because of fracture flow of vapors produced by degassing and devitrification of glass to nonhydrous phases. We mention these processes to emphasize the importance of recognition of the presence of water in silicic dome systems.
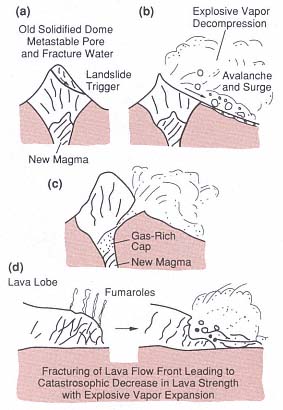
Fig. 5.9
Schematic illustration of Peléean and Merapian
dome destruction. (a) An initial failure of the
dome leads to a landslide followed by
decompression of trapped vapors, which
produces a rapidly moving pyroclastic avalanche
and surge. (b) This scenario, described by
Fisher and Heiken (1982), can be promoted by
intrusion of volatile-rich magma, which may vent
after dome failure (c). (d) Destruction of lava
flow fronts that are weakened by fumarolic
activity also produces block and ash flows,
as proposed by Rose et al . (1976).
(Adapted from Heiken and Wohletz, 1987.)
Geothermal System Models
The following discussion of geothermal systems associated with domes presents some possible models for hydrothermal circulation that reflect conditions observed in the field, some of which have contributed to exploitable geothermal systems. These models include systems associated with
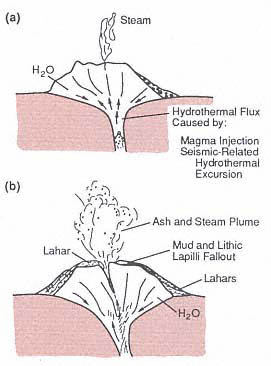
Fig. 5.10
Schematic illustration of phreatic tephra
associated with silicic domes. (a) A passive
fumarolic stage might be enhanced by a rapid
change in hydrothermal flux so that (b) vigorous
vapor emission opens a vent and discharges
lithic ash and lahars (Heiken et al ., 1980)
(Adapted from Heiken and Wohletz, 1987.)
· tephra aprons surrounding domes,
· cratered domes,
· faulted domes,
· dome complexes,
· caldera ring fault domes, and
· caldera resurgent extrusive domes.
The models highlight the importance of pyroclastic materials in locating hydrothermal systems. Each of these dome types may be modeled by the heat flow program discussed in Chapter 2.
A review of pyroclastic rock physical properties indicates that pumiceous materials range in bulk density from 200 to 1200 kg/m3 , and
bedded ash—often less vesicular because of its hydrovolcanic origin—may range from 1000 to 1500 kg/m3 . If a particle density of 2300 kg/m3 is assumed, pumice has a void space between 50 and 90%; bedded ash varies from 35 to 60% void space. The primary permeability of pyroclastic rocks is provided by both vesicles and intergranular spaces. Whitham and Sparks (1986) showed that at temperatures >150°C, the pumice vesicles are effectively interconnected and readily allow absorption and movement of water. However, the primary permeability of pyroclastic materials can rapidly decay during hydrothermal circulation because circulation promotes the solution of glass and the redeposition of silica and secondary minerals that effectively seal the tephra.
Tephra Aprons
Figure 5.11 depicts a hypothetical dome extruded over a tephra collar that resulted from initial explosive eruptions. The collar extends down into the vent area and defines the crater and tuff ring apron onto which lava was extruded. Porous tephra allows hydrothermal fluids to rise convectively. The heat source is a magma conduit below the dome; water in the country rock below the dome promotes heat convection upward into the tephra. In this situation, fumarolic activity at the base of the dome demonstrates the existence of the hydrothermal system, which is locally capped by dome lavas. The dome lavas have a lower permeability and do not permit much heat transfer.
Cratered Domes
Figure 5.12 depicts a second hypothetical case: a dome with a crater formed by either Vulcanian or phreatic activity that was driven by intrusion of magma below the dome. Below the crater, a region of strongly fractured lava and breccia provides a pathway for the convective rise of hydrothermal fluids from the cooling magma at depth. Here again, the water supply is from country
Fig. 5.11
Schematic illustration of geothermal system in
which a vapor-dominated zone is concentrated
in the porous tephra apron. This very
hypothetical system is based on heat
transported convectively from a magma
chamber at depth below the dome upwards
along the vent conduit.
rock into which the magma has intruded. In such a situation, the dome will have a mantle of Vulcanian or phreatic tephra that provides evidence of the explosive origin of the crater. By examining the isotopic and chemical nature of fumarolic gases and rock alteration in the crater, it is possible to determine the origin of the vapors, whether solely magmatic (and hence limited) or meteoric and of potential economic significance.
Faulted Domes
Figure 5.13 presents a dome cut by a fault that has triggered collapse of the dome— perhaps in a Merapian fashion. The fault has fractured lavas and basement rock sufficiently to allow strong convection of hydrothermal fluids into the dome. The fumarolic alteration of fault breccias and related pyroclastic breccias is evidence of the convective heat source. In this case, the tectonic activity has altered heat flow from depth and, where residual magmatic heat exists below the dome, the faulting provides a new circulation pathway.
Dome Complexes
Where numerous dome extrusions have occurred in a volcanic field (for example, along the ring fault system of a caldera or within a graben), lavas and dome-related tephra layers overlap. The lavas act as caprocks and the pyroclastic layers serve as geothermal reservoirs. Figure 5.14 illustrates such a situation in which heat from the youngest eruptive activity drives hydrothermal circulation below: steam reservoirs exist at some depth below the dome and in older tephra layers. In areas consisting of many overlapping dome extrusions, high conductive heat flow at the surface may indicate a convective system at depth.
Caldera Domes
Two cases of caldera-related dome extrusions are depicted in Fig. 5.15. In one case, domes along the ring faults manifest magma intrusions at depth that control the
Fig. 5.12
A cratered dome may have a prolonged
fumarolic stage during which a convective
system develops within the crater conduit in
response to a new magma body
intruded at depth.
overall heat flow toward the margins of the caldera. In the other case, resurgence of the caldera creates a structural or extrusive dome that may produce hydrothermal convection towards the center of the caldera. In the first instance, recharge of the hydrothermal system is strongly controlled by the hydrology of the down-thrown region of the caldera, which acts as a ground-water concentrator or trap. In the instance of the resurgent caldera, the hydrothermal system is recharged from higher topographic regions surrounding the caldera. Both of these models are simplified, but they demonstrate the way convective heat flow in calderas can develop in diverse manners. There is no simple rule-of-thumb that is adequate for determining where to explore in a caldera. The existence and locations of young silicic domes are helpful in predicting recharge and outflow areas of possible hydrothermal systems.
Fig. 5.13
Tectonic activity at a relatively young dome
produces fracture pathways along newly
activated faults; this activity allows deep
circulation of meteoric water downwards to a
still-hot magma body at depth. Such a faulted
dome may develop vigorous fumarolic activity
as a surface manifestation of a subsurface
hydrothermal system, but gradual sealing of
the fractures by alteration minerals and silica
will eventually slow the fluid convection.
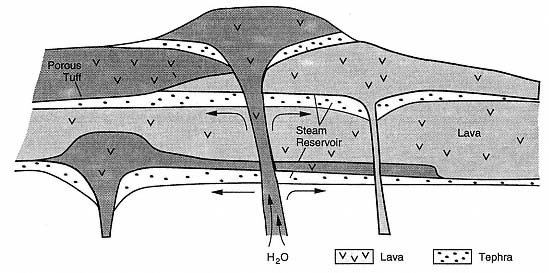
Fig. 5.14
Dome complexes form when lavas overlap their related pyroclastic sheets. The stratigraphy of a dome
field is characterized by various potential hydrothermal reservoirs in porous and formation-permeable
pyroclastic strata that are capped by one or more impervious lavas. Most recent dome eruptions
result from renewed thermal infusion from related magma bodies at depth. Vapor-dominated reservoirs
characterize upper pyroclastic horizons, whereas deeper ones may be brine-filled.
Fig. 5.15
Caldera domes form both (a) along ring fracture zones of calderas and (b) within the resurgent cores.
The character of caldera-fill materials and their formation permeability works in conjunction with
caldera faults to allow deep circulation of meteoric water. The magma conduits below such zones
probably occur directly above the caldera magma chamber, where it is closest to the surface.
Because silicic caldera magma bodies are relatively large, hydrothermal systems developing below
related dome structures may have prolonged activity and high heat flux.
Structural Influences
In addition to the localized stratigraphic and volcanic structure that influences the development of geothermal systems associated with domes, regional structure and tectonics can also strongly affect these hydrothermal systems. Six structural settings for domes and their effect on the development of hydrothermal circulation are (1) caldera faults; (2) extensional block faulting; (3) tectonic plate convergence; (4) basin fill; (5) intrusive deformation, sector grabens, and radial faults around volcanoes; and (6) volcanic fracture systems. These features, four of which we briefly discuss here, are of more regional significance than the models discussed above.
Caldera Faults
Figure 5.16 shows the pattern created by the intersection of regional linear faults with the ring faults of a caldera. In this example drawn from the Qualibou caldera on the island of St. Lucia in the West Indies (Wohletz et al ., 1986), the youngest domes are expressions of caldera resurgence. The regional and still active fault system controls the location of fumarolic activity
Fig. 5.16
Structural control of domes associated with
calderas is generally related to regional fault
trends and caldera ring fractures. Because
regional faults may remain active long after
caldera tectonics have declined, the most
recent dome activity will be found
along such faults.
near the young extrusions. Young faults are important because they maintain a fracture permeability in rocks that otherwise are sealed by secondary minerals and silica. Where regional faults intersect caldera ring faults, greater fracture permeability can also be expected. Although the presence of young dome lavas and pyroclastic materials is useful for determining a potential geothermal area, it is the structural elements that are the most significant when actually locating a hydrothermal system.
Block Faulting and Grabens
Strongly developed block faults can localize extrusive features such as domes. Figure 5.17 depicts a hypothetical dome that is emplaced along the margins of a graben deeply filled with several kilometers of sediments. The hydrology of the graben is influenced by both the topographically high recharge areas in surrounding horst blocks and the deep, permeable graben fill. Such a situation promotes not only deep circulation of meteoric waters but also the development of extensive hydrothermal convection along margins of the intrusive body below the dome. In such cases, it is difficult to characterize the geothermal potential as either volcanic or tectonic. Block faulting in extensional areas may result in a thinner crust and greater heat flow so that deep circulation of meteoric water alone can develop a geothermal system. However, the same tectonic regime is typical of volcanic systems that develop in rifts.
Intrusive Deformation
Silicic domes indicate the existence of intrusive bodies at depth. Figure 5.18 illustrates a situation in which a laccolith is associated with a dome in a compressed tectonic region. The laccolithic intrusion has domed and created concentric and radial faults in the country rocks above it. An intrusion such as a laccolith or a buried
dike can produce small phreatic craters (Miller, 1985; Fink, 1985) of structural features of localized extensional surface deformation (Mastin and Pollard, 1990).
Henry and Price (1990) described laccolithic doming associated with caldera formation in the Christmas Mountains of Trans-Pecos, Texas. Most of the magmatism in this area is expressed as small (1- to 4-km-diameter) laccolithic intrusions that commonly involve high-silica, peralkaline rhyolites and quartz trachyte. These intrusions have formed structural domes of steeply tilted sedimentary strata. Field relations show that these domes were emplaced along ring fractures during the evolution of larger caldera structures. Numerous sills occurring around the flanks of the laccolithic domes are cut by radial faults that probably formed in response to the deformation associated with dome intrusion.
Basin Fill
A basin filled with lahars shed from a dome on the basin margin is shown in Fig. 5.19. Lahars can be impervious to fluid flow because of the cementation mechanisms promoted by ash carried in lahars. In the model shown, the lahars have capped pyroclastic materials erupted earlier from the dome. Hydrothermal circulation below the dome is confined within the pyroclastic strata, and hot water flows from the dome into the basin below the laharic apron. In such cases, lahars mask the geothermal system at depth and geophysical or geochemical methods are needed to confirm the existence of the system in the basin.
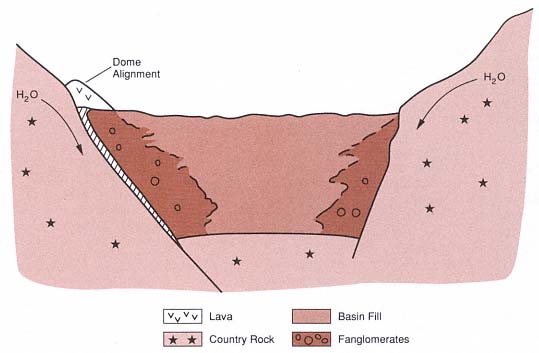
Fig. 5.17
The block faults that bound basins in extensional terranes frequently have long histories and deep
extensions. This structure may be accompanied by sufficient crustal heat flow to cause crustal
melting (for example, by basalt intrusion) and silicic dome emplacement. Deep circulation of meteoric
water from the horst highlands through the graben-filling sediments can promote hydrothermal
activity within graben-bounding fault breccias and along intrusions (hachured) below domes
(v pattern) that were extruded along these faults.
Fig. 5.18
Intrusive deformation associated with domes is
manifested by uparching and fracturing of rocks
above a laccolith. Hydrothermal circulation
can then develop around and above
the laccolith as it cools.
Coso California Geothermal Field
The Coso volcanic field is in eastern California on the western edge of the basin and range province of the western United States. About 35 km3 of volcanic rocks have erupted and overlie principally Mesozoic plutons associated with the Sierra Nevada batholith; The Coso volcanics range in age from ~4 to 0.04 Ma and vary in composition from basalt to rhyolite. Pleistocene rhyolitic domes are the major volcanic features, and these are cut by numerous normal faults that may reflect late Cenozoic extension. Along some of these faults within the dome field, fumaroles and hot springs provide evidence of a high geothermal gradient. Recent geothermal development by the California Energy Company, Inc., resulted in nearly 90 wells. The first production well, drilled to a depth near 2000 m, had a bottomhole temperature of ~340°C and produced dry steam. At this time, with drilling operations still under way, nine power plants have been completed and are online with a net capacity of 230 MWe. The Coso volcanic field exploration is considered one of the best documented investigations of a silicic dome system in the world. We summarize here the work of Bacon and Duffield (1980) at Coso as an example of a geothermal system developed in Mesozoic basement rocks below silicic domes.
Geologic Setting
The Coso range is a horst block immediately east of the Sierra Nevada range in eastern California. It is covered by a veneer of ~400 km2 of mostly lava flows and domes of late Cenozoic age. Early geologic exploration (Ross and Yates, 1943; Dupuy, 1948) identified mercury, which has been mined in fumarolically altered rocks near rhyolite domes; numerous subsequent studies have described pyroclastic and volcaniclastic deposits, the general stratigraphy, potassium-argon ages, and geothermal phenomena. Duffield et al . (1980) documented both the relationship of the volcanic rocks to an underlying granitic basement (Fig. 5.20), which is exposed within the volcanic field and along its margins, and the nature of a late Cenozoic extension, which is marked by north-northeast-trending normal faults that have produced considerable uplift of horst block under the range.
The geothermal system has developed in a Mesozoic basement of dominantly granitic plutons and subordinate mafic plutons and metamorphic rocks associated with the Sierra Nevada composite batholith. Late Tertiary and Quaternary volcanic rocks drape over the basement. Duffield et al . (1980) used potassium-argon and obsidian-rind techniques to determine that ~35 km3 were erupted between 4.0 and 0.04 Ma (Fig. 5.21). These volcanic rocks include 38 separate domes and flows of phenocryst-poor, high-silica rhyolite, most of which are likely younger than 0.3 Ma.
The oldest lavas, alkalic basalt flows, are the most voluminous and widespread of Pliocene volcanic rocks (Fig. 5.22) and were erupted from cinder cones onto a relatively subdued terrain. They occur as notable stepfaulted flows in the eastern portion of the field. These lavas are overlain by Pliocene andesite, dacite, rhyodacite, and rhyolite flows and tuff. Andesite and dacite occur as parts of polygenetic volcanoes in which dacite flows, shallow intrusive masses, and pumice are interlayered with andesite flows and
Fig. 5.19
Basin-filling clastic rocks shed from a growing
silicic dome can provide a permeable formation
for a hydrothermal reservoir—especially when
continued down-warping of the basin allows
it to be filled with impervious sediments such
as lahars. These lahars efficiently hide the
geothermal reservoir, which develops at
some distance from the volcano.
cinders. Rhyodacite is found in widespread pumice fall and lava flows, and Pliocene rhyolite forms a nonwelded pumiceous ash flow that is intercalated with sedimentary volcaniclastic rocks of the Coso Formation.
The youngest volcanic rocks are Pleistocene in age and consist of contemporaneous alkalic basalt and high-silica rhyolite (Bacon et al ., 1980). Most basalt vents are marked by partly eroded cinder cones that fed one or more lava flows on the east, south, and west sides of the rhyolite field. Pleistocene rhyolites compose the 38 steep-sided domes as well as some short, thick flows whose surfaces are notably perlitic and pumiceous. Bacon et al . (1981; 1984) inferred that the rhyolite magma (total extruded volume @ 1.6 km3 ) erupted from a chemically stratified magma chamber, which formed when mantle-derived basalts partially melted crustal rocks. Most domes have extrusive volumes of <0.3 km3 and are located within and/or above tephra rings that were formed by the initial explosive phases of dome eruption. The tephra from these dome eruptions have a total volume of ~0.3 km3 and consist of well-bedded obsidian, pumice, and rhyolite clasts and minor amounts of lithic fragments from basement rocks. Accretionary lapilli and impact sags provide evidence that the tephra are in part hydrovolcanic. Tuff rings average about 600 m in diameter, and rim deposits range from several meters to 30 m thick. Most of the rhyolite field is mantled by tephra similar in character to those in the tuff rings. The first production well completed by California Energy is collared within the tuff ring of dome 53 near the Devil's Kitchen fumarolic area (Fig. 5.23). Intensely fractured Mesozoic basement rock encountered by the well can be attributed to several processes, including hydraulic fracturing associated with hydrovolcanic explosions that occurred during the initial eruptions of this dome, thermal stresses exerted by elevated heat flow, and ongoing tectonic movement. Other geothermal wells are being bored in the area around dome 53.
Using the distribution of silicic vents, the volume of extruded magma, gravity and seismic surveys, and heat flow measurements, Bacon et al . (1980) predicted that a silicic magma body ~5 km in diameter and >1 km thick (a total volume of at least 20 to 30 km3 ) underlies the Coso volcanic field at a depth of at least 8 km. It is possible that the silicic magma body may still be partially molten, if one applies the reasoning that the most recent basaltic eruption occurred as late as a few thousand years ago and that such extrusions are evidence that heat was supplied to the magma body from an underlying mafic reservoir. Bacon (1982) indicated that the ages of extrusive rocks (Friedman, 1976), plotted in Fig. 5.21 with respect to cumulative volumes, show a trend that suggests these eruptions will continue in the future.
Figure 5.24 illustrates three sets of faults in the Coso Range (Duffield and Bacon, 1979; Roquemore, 1980) that indicate principally late Cenozoic crustal extension; outward dips of the Coso Formation demonstrate considerable uplift of the range during Pliocene time. A west-northwest-trending set of apparently vertical faults are well developed in the southern and western parts of the range. This fault set is an expression of
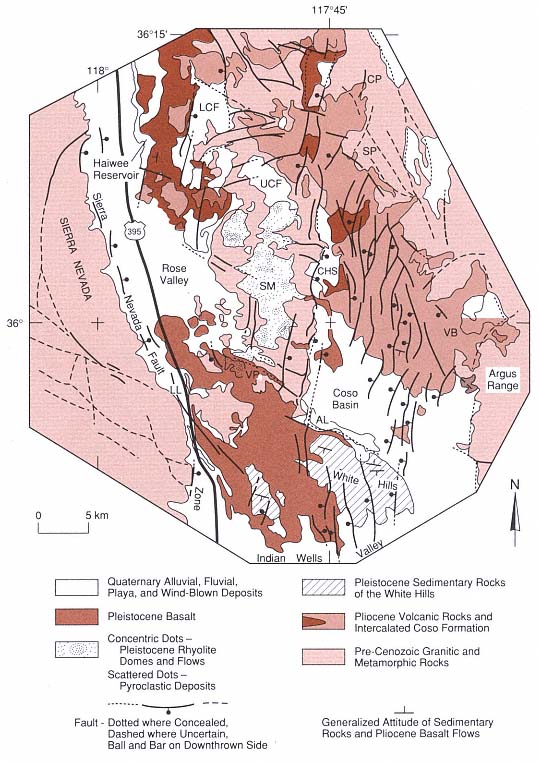
Fig. 5.20
Geologic map of the Coso volcanic field of California, showing distribution of major rock units and
faults. Abbreviated locations: CP = Coso Peak, LCF = Lower Cactus Flat, UCF = Upper Cactus Flat,
SP = Silver Peak, CHS = Coso Hot Springs, SM = Sugarloaf Mountain, VB = Volcano Butte,
VP = Volcano Peak, AL = Airport Lake, and LL = Little Lake.
(Adapted from Duffield et al ., 1980.)
Fig. 5.21
Rock volumes and compositions vs radiometric age for the Coso volcanic field. Volumes were
calculated by using the geological map area and cross-sectional exposures and allowing for
material removed by erosion. Volumes of pyroclastic rocks were converted to dense rock
equivalence by multiplying by 0.5. Exponential thickness decreases with distance were
applied to pyroclastic deposits. In the last 4 Ma, ~35 km3 of lava has been erupted, of
which 31 km3 erupted before 2.5 Ma ago.
(Adapted from Duffield et al ., 1980.)
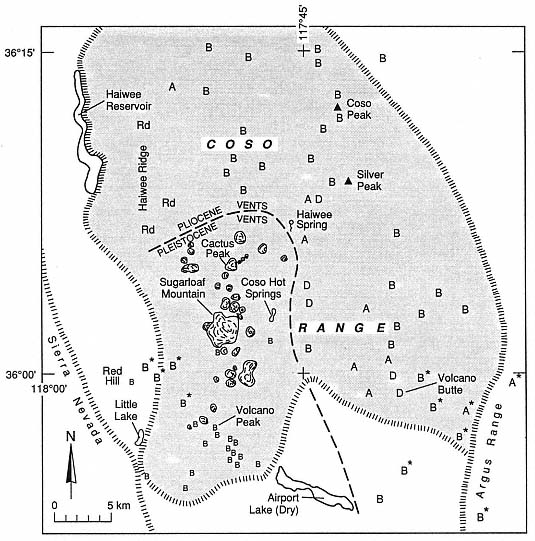
Fig. 5.22
Distribution of eruptive vents in the Coso volcanic field of California. The locations of vents are
shown by letters designating the composition of materials erupted: B = basalt, A = andesite,
D = dacite, and Rd = rhyodacite. Asterisks denote the location of
Late Pliocene and early Pleistocene vents.
(Adapted from Duffield et al ., 1980.)
regional structure and, although these faults do not offset Pleistocene rhyolite, some of the silicic domes are aligned along their strike. The basin and range morphology of the Coso range is developed along north-to northeast-trending normal faults. These faults cut the horst onto which the rhyolites have been erupted and form en echelon sets that are consistent with north-northwest right lateral shear. In Fig. 5.25, information from Bacon et al . (1980) shows that the Quaternary maximum horizontal compression follows this northeast trend. This interpretation arose from consideration of the distribution of domes and application of the stress analysis suggested by Nakamura (1977). Arcuate faults present in the northern and northeastern parts of the field are approximately
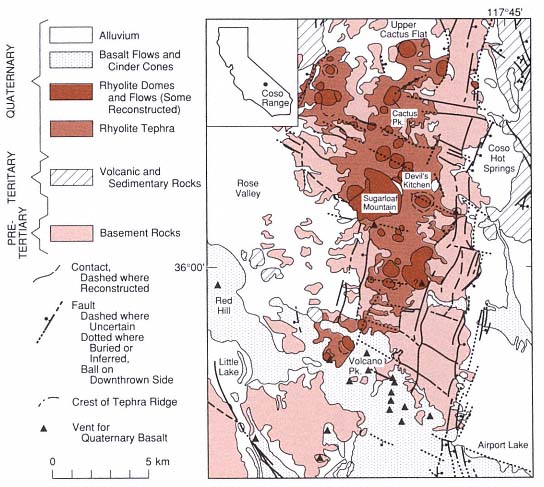
Fig. 5.23
Generalized geological map of the principal geothermal area in the Coso geothermal area. Coso Hot
Springs emanate along major graben-bounding faults, whereas geothermal drilling has focused on
the region around Sugarloaf Mountain rhyolite dome and the Devil's Kitchen fumarolic area. Hulen
(personal communication) reports that drilling in regions around these
vents has encountered intensely fractured basement rock.
(Adapted from Bacon et al ., 1980.)
concentric around the geographic center of the field and dip inward toward this center. This set of faults was originally interpreted as part of a caldera structure (Austin et al ., 1971; Koenig et al ., 1972), and more recently, Roquemore (1980) has attributed their origin to strike-slip movement; however, Duffield (personal communication, 1990) is not convinced by either of these interpretations. The step-faulted terrane in the eastern part of the volcanic field near Airport Lake (see Fig. 5.23) is attributed to downwarping and down-faulting in response to late Cenozoic crustal extension that caused an effective decoupling of that terrane from a block-faulted terrane to the west and south. Figure 5.26 depicts the step-faulted terrane that forms a graben structure and its relationship to the horst on its west side onto which the rhyolite domes have been extruded. An ongoing study by California Energy indicates that new interpretations of structural relationships will be required to fully understand Coso's geothermal system.
Hydrogeochemistry
Most present-day surface thermal activity is concentrated within and immediately east of the Pleistocene rhyolite field, apparently along an east-northeast-trending zone between Sugarloaf Mountain and Coso Hot Springs—a zone mapped as a fault by Hulen (1978). Coso Hot Springs consists of fumaroles and intermittently active, acid-sulfate springs and mud lakes that emanate from a north-northeast-trending fault along the east side of the main horst block. Surface flow is related to local precipitation, but water samples from a 125-m-deep well are alkaline and chloride rich (~3,000 ppm of chloride); the bottomhole temperature was 142°C (Austin and Pringle, 1970). South of this area are laminated siliceous sinter and travertine exposures that are evidence of older, widespread thermal springs. Fumaroles of Devil's Kitchen, occurring in the tuff ring of dome 53, are noted for their present-day deposition of sulfates, sulfur, and cinnabar. Although these surface expressions are not chloriderich and are typical of a high-level, vapordominated system, the chloride-rich waters from wells in this immediate vicinity indicate that at depth there is a hot-water-dominated hydrothermal reservoir (White et al ., 1971).
Fig. 5.24
Detailed structural map of the Coso Range and adjacent area, showing distribution of faults.
Location abbreviations are those used in Fig. 5.20; shaded patterns denote rhyolite domes.
(Adapted from Roquemore, 1980.)
The hydrothermal system at Coso is apparently controlled by fractures in the Mesozoic granitic and older metamorphic basement rocks. Water samples from two wells of this system were analyzed by Fournier et al . (1980), and their chemistry is summarized in Table 5.4. Although the chemical analyses show variability that can be attributed to evaporative concentration, water/rock reactions at different temperatures, and different sample preservation and laboratory procedures, the samples exhibit essentially the same chloride content, and water of relatively uniform composition is found throughout the permeable rock underlying the Coso area sampled. The chloride content also indicates a hot-water-dominated rather than a vapor-dominated system.
Geophysical Character
Numerous geophysical techniques have been applied to the geothermal exploration of the Coso area: heat flow measurements, microseismicity and teleseismicity, gravity, magnetics, and electrical resistivity. Taken together, these methods have provided mutually supportive data that promote the development of a subsurface model to locate and define the nature of the magma
Fig. 5.25
Idealized axis of maximum horizontal tectonic compression of the Coso area is determined from
(a) the orientation of normal faults, location of rhyolite domes, and sense of strike-slip displacement
(inset) in zones of seismic epicenters (Walter and Weaver, 1980). This relationship is compared to
(b) the idealized horizontal cross section of a large volcano (Nakamura, 1977), which shows
the effect of a differential horizontal stress on dike propagation (curves) from a region of magma
storage and ascent (shaded) underlying the Sugarloaf Mountain area. Dikes fed the outlying domes
around the Sugarloaf Mountain area (shown by heavier lines).
(Adapted from Bacon et al ., 1980.)
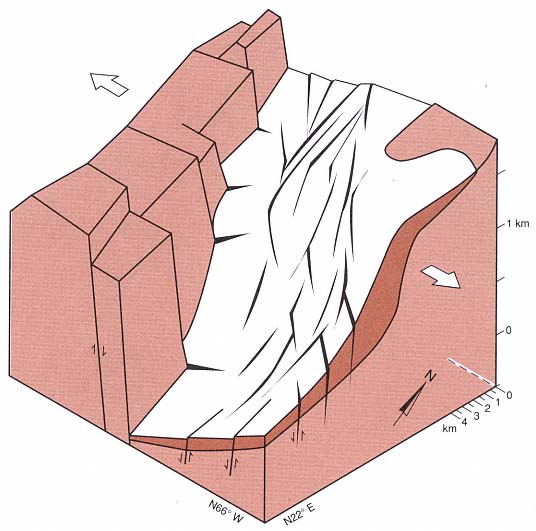
Fig. 5.26
Generalized block diagram illustrating the step-faulted terrane (dark lines and wedges) and block
faulting in the Coso Basin near Airport Lake (see Fig. 5.20). Pleistocene rhyolite domes have
erupted on the horst; the step faulting has developed in response to Cenozoic crustal extension
(arrows). The cenozoic basement is shown by light stipple and Pliocene volcanic rocks are dark
stippled. Coso Hot Springs emanate along the northeastern extension of the western graben-
bounding fault, and geothermal drilling is mostly on the crystalline horst
(Adapted from Duffield et al ., 1980.)
heat source as well as determine the structural and lithological control of heat flow.
Combs (1980) reported the results of thermal gradients measured in 25 shallow-depth and 1 intermediate-depth boreholes in addition to thermal conductivity measurements on 312 core and cutting samples from the igneous and metamorphic basement rocks. Figure 5.27 shows equilibrated thermal gradients for shallow boreholes where temperatures ranged from 25.3 to 906°C/km. The high gradients are a product of thermal convection by hot water, and the low gradi-
|
||||||||||||||||||||||||||||||||||||||||||||||||||||||||||||||||||||||||||||||||||||||||||||||||||||||||||||||||||||||||||||||||||||
ents are caused by conduction of heat away from dikes that fed domes and lava flows. Figure 5.28 shows isotherms at 5- and 10-m depths. These data correspond to terrain-corrected heat flows that range from 1.6 to 23 heat-flow units (HFU; 1 HFU = 41.84 mW/m2 ). Background measurements for the region are between 1.6 and 2.4 HFU. Heat-flow contours enclose the area being developed for geothermal energy near dome 53 and Devil's Kitchen (Fig. 5.29). Heat flows near 4 HFU divide the convective regimes of high heat flow from conductive regimes; the 3- and 5-HFU contours in Fig. 5.29 generally parallel regional structure, which suggests that convective heat flow is controlled by the circulation of hot water along fault and fracture systems in the rhyolite dome fields.
As is shown by Fig. 5.30, microearthquakes are common in the Coso Range (Walter and Weaver, 1980); a magnitude 1.0 or greater earthquake occurs almost every day in the region. Zones of seismicity strike radially outward from the rhyolite field, and earthquake swarms show a general northwest trend across the field. Fault-plane solutions show a regional north-south compression. Earthquake depth varies little across the field: most quakes are around 5 to 6 km deep. This trend suggests that the brittle-to-ductile transition does not rise under the field as would be the case if near-liquidus temperatures occurred at a shallow level. However, Young and Ward (1980) did find a shallow zone of high teleseismic P-wave attenuation within the upper 5 km in a region under Coso Hot Springs, Devil's
Kitchen, and Sugarloaf Mountain—probably corresponding to vapor and liquid in near-surface lithologies. Furthermore, Reasenberg et al . (1980) found significant teleseismic-wave delays that were likely caused by a low-velocity body of partially molten rock concentrated from 8 to 17.5 km directly below the region of highest heat flow.
Although gravity data from Plouff and Isherwood (1980) reveal the regional tectonic patterns, they do not predict a mass deficit for a magma reservoir underlying the Coso Range. A magnetic-low area that corresponds to the area of high heat flow near Coso Hot Springs can be explained by a poorly magnetized silicic pluton that crops out inthe area; much of its magnetite may have been destroyed by hydrothermal fluids. Jackson and O'Donnell (1980) reported telluric current and 7.5-Hz audio-magnetotelluric data that reveal major resistivity lows associated with conductive basinfill materials (such as those underlying the region directly east of Coso Hot Springs) and a secondary low trough that extends across the geothermal area (Fig. 5.31).
Volcanological Interpretations
Although none of the data sets is conclusive in itself, taken together, the geological, hydrogeochemical, and geophysical evidence pinpoints the area now being developed as a geothermal resource. However, most of the geophysical conclusions—and
Fig. 5.27
Idealized equilibrium thermal gradient profiles for 24 shallow boreholes at the Coso geothermal area.
Profile numbers refer to boreholes shown in Fig. 5.28. In general, boreholes with high thermal gradients
are located in the immediate vicinity of the Devil's Kitchen and
Sugarloaf Mountain thermal manifestations.
(Adapted from Combs, 1980.)
some of the geochemical ones—are based upon geological field observations. As Duffield et al . (1980) showed in a schematic east-west cross section of the Coso Range (Fig. 5.32), the concentration of young, rhyolitic volcanism on a horst block, the prevalence of phreatic and phreatomagmatic tephra in tuff rings below the silicic domes, and through-going regional faults all point to a region that should be characterized by high heat flow, convective water circulation, and fractured rock. Such is the case for the Coso geothermal field.
Usu Volcano, Japan
Most geothermal fields in Japan are developed around young volcanoes or intrusives. Very few of these fields are associated with basaltic volcanoes. As was mentioned earlier, Ishikawa (1970) states that geothermal areas commonly develop around lava domes of viscous, silicic compositions and that these extrusions plug a crater vent and then prevent gases and heat from freely escaping into the atmosphere. Figure 5.33 indicates the locations of volcanoes on Hokkaido island; Usu volcano is in the southwestern part of the island. The Toya hot springs are of particular geothermal interest because their development at the foot of Usu volcano was well documented during the emergence of the Meiji-Shinzan cryptodome in 1910.
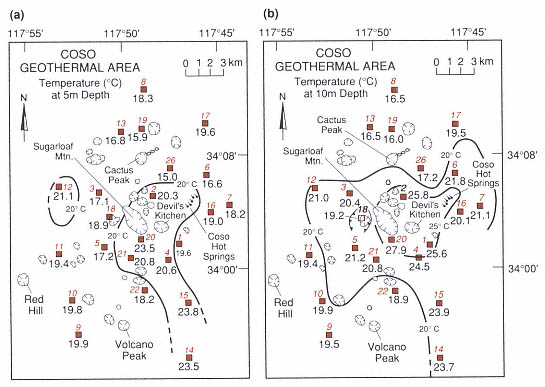
Fig. 5.28
Temperatures at depths of (a) 5 m and (b) 10 m for shallow heat flow boreholes in the Coso geothermal
area. The colored numbers and symbols refer to boreholes referenced in Fig. 5.27, and the numbers
below the symbols are measured temperatures (°C). Note that isotherms shown by solid lines are
concentric to the Sugarloaf Mountain and Devil's Kitchen thermal areas.
(Adapted from Combs, 1980.)
Fig. 5.29
Heat flow contour map for depths <65 m in boreholes and generalized geology of the Coso
geothermal area (taken from Duffield et al., 1980). Borehole heat flow values are shown beside each
borehole (
to Duffield et al. (1980). Fumarole areas are stippled; heavy solid lines are faults (bar with ball on
downthrown side); and hachures outline areas of internal drainage (Moyle, 1977).
(Adapted from Combs, 1980.)
Fig. 5.30
Number of earthquakes vs depth for Coso volcanic field. The · and

geothermal-related earthquakes in the geothermal area shown in Fig. 5.29.
Most earthquakes are at depths between 5 and 6 km.
(Adapted from Walter and Weaver, 1980.)
Geology
Usu volcano is a truncated composite cone (Katsui et al ., 1981) located on the southern margin of Toya caldera (Fig. 5.34). During historic times, three dacite domes and seven cryptodomes formed on Usu. The 1910 activity included phreatic explosions that produced a zone of 45 craters on the northern foot of the volcano, and a number of hot springs formed along this zone just after the eruptions (Fig. 5.35). The 1910 activity was apparently initiated when magma intruded into a shallow region of abundant groundwater. Subsequent eruptions at Usu from 1943 to 1945 (Showa-Shinzan dome) and from 1977 to 1978 (Usu-Shinzan cryptodome) were well documented. Repeated hydrovolcanic activity during these eruptions resulted in numerous vulcanian explosions as well as new fumarolic areas, and magmatic bursts produced widely dispersed
pumice falls (Fig. 5.36). The 1977 to 1978 activity consisted of two major stages: (1) paroxysmal magmatic pumice eruptions in August 1977 and (2) phreatic and phreatomagmatic bursts beginning in November 1977 and continuing intermittently for nearly a year.
All of the historic eruptions involved calcalkalic rhyolite that, in general, gradually decreased in silica content to dacitic compositions. Katsui et al . (1978) has interpreted this change in composition as evidence of progressive downdraw of a compositionally zoned magma chamber.
Geophysical Properties
Regional gravity studies (Yokoyama, 1964) mainly show the anomaly of the Toya caldera (Fig. 5.37), but seismic observations such as those related to the Showa-Shinzan eruption (Minakami et al ., 1951) revealed shallow hypocenters beneath Usu (Fig. 5.38). Minakami et al . (1951) distinguished three types of volcanic tremors—all of low frequency. "A-type" tremors have a predominant period of ~0.3 s, clear S waves, nearly constant amplitudes at various epicentral distances, and hypocenters deeper than 0.5 km. "B-type" tremors are recorded for shallow hypocenters; they have predominant periods from 0.2 to 0.6 s and unclear S waves. "C-type" tremors, which occur during extrusion of lava, are also called harmonic tremors .
Hydrogeochemistry
The first hot spring produced at Usu after the 1910 activity had a temperature of 42°C, but wells drilled later show higher water temperatures, which increase from near the lake to the explosion crater zone where water temperature is 85°C and the Cl- content is 4.261 g/l (Ishikawa, 1970). Fukutomi (1960) recognized two types of hot springs: Type I, found near Meji-Shinzan, has Cl > SO4 > HCO3 and Type II, at greater distance from the young cryptodome, has SO4 > HCO3 > Cl. The major cationic components of each are very similar; that is, Na >> Ca > Mg. Because the water level in the explosion craters is nearly the same as that of Lake Toya, Nakamura (1962) suggested that the hot-springs water originated from the lake and was heated by the cryptodome Meiji-Shinzan. Definite changes in the temperature and chemistry of hot springs were documented before the most recent activity at Usu, and these changes apparently coincide with the monthly frequency of volcanic earthquakes (Fig. 5.39).
Differences in tephra chemistries noted in the eruptions from 1977 to 1978 are also geochemically significant and useful (Kondo et al ., 1979). Pumices from the first-stage magmatic eruptions are grayish-brown in color (SiO2 = 53.91 to 57.55 wt%), weakly alkaline, and rich in water-soluble Ca2+ and Na+ , but poor in water-soluble Cl- and

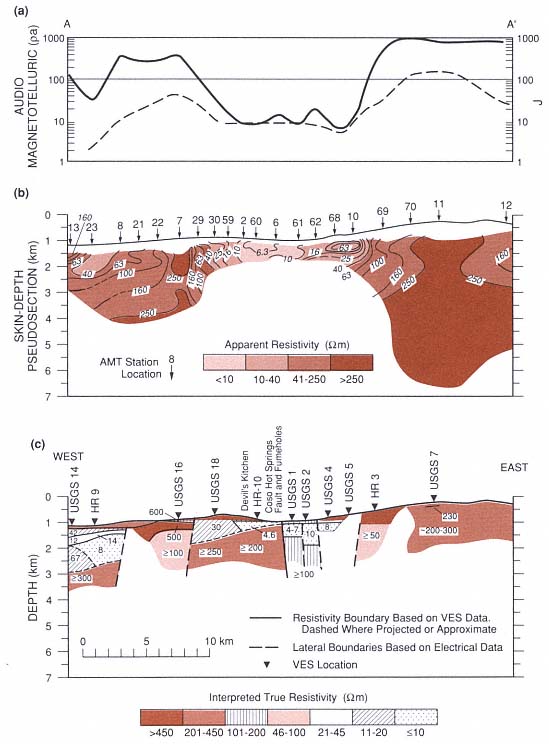
Fig. 5.31
East-west electrical cross sections from Rose Valley across Devil's Kitchen, Coso Hot Springs,
and Coso Basin (see Fig. 5.20). (a) Audiomagnetotelluric (AMT) at 7.5 MHz (heavy line) and Telluric J
(dashed line). (b) Pseudosection skin depths and apparent resistivities from AMT soundings, whose
locations are shown by numbered arrows. (c) Interpreted depths and true resistivities from
Schlumberger vertical electrical soundings, whose locations are shown as HR (Furgeson, 1973)
and USGS (Jackson and O'Donnell, 1980). A section of conductive alluvial deposits occurs in
Rose Valley (west side) and Coso Basin. A secondary resistivity low, occurring in the geothermal
area between Devil's Kitchen and Coso Hot Springs, is caused by a shallow conductive zone that is
interpreted as hydrothermally altered basement rocks containing saline geothermal water.
(Adapted from Jackson and O'Donnell, 1980.)
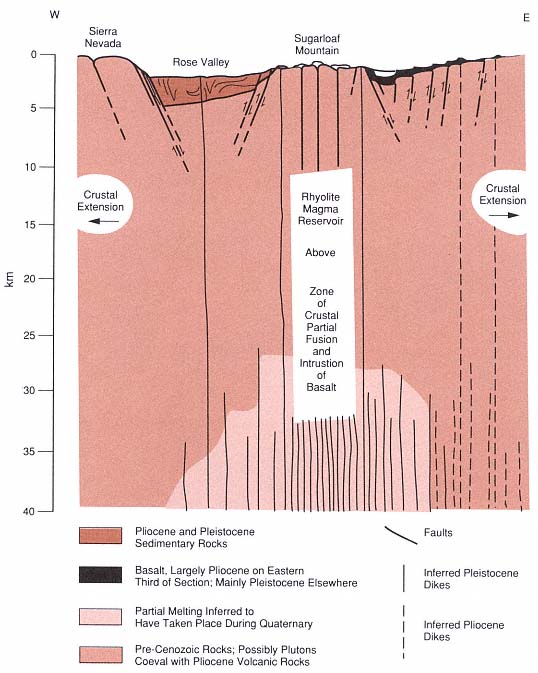
Fig. 5.32
Schematic east-west cross section of the Coso Range through Sugarloaf Mountain. The horizontal
scale is equal to the vertical scale, and there is some surface topography exaggeration. This section
summarizes the geological and geophysical interpretations for the origin of high heat flow from a
rhyolite magma chamber under a horst of crystalline basement rocks on which rhyolite domes have
been extruded. This interpretation emphasizes the fact that the geothermal heat emanates not from
the young domes themselves, but from the postulated underlying magma chamber.
(Adapted from Duffield et al ., 1980.)
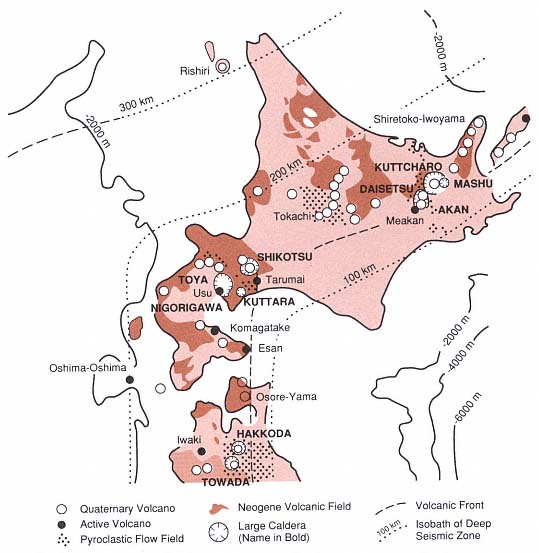
Fig. 5.33
Volcanoes of Hokkaido, showing the Toya caldera and Usu volcano in the southcentral
portion of the island just west of the volcanic front.
(Adapted from Katsui et al ., 1981.)
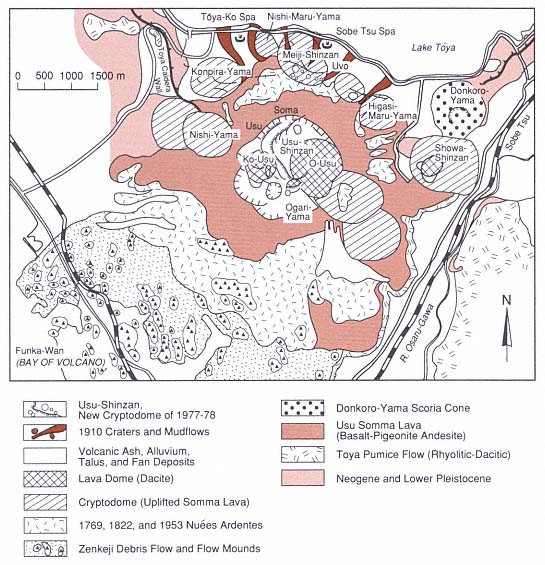
Fig. 5.34
Geologic map of Usu, located on the southern margin of the Toya caldera, which is occupied by Lake
Toya. Usu is a collapsed composite volcano with a small summit caldera that is filled by several dacitic
domes and flanked by the Showa-Shinzan dome and cryptodome. The dome eruptions of Ko-Usu,
O-Usu, and Showa-Shinzan, as well as 7 other cryptodomes of Usu, occurred in historic times.
(Adapted from Katsui et al ., 1981.)
Fig. 5.35
Map of phreatic explosion craters formed during the 1910 activity at the base of Usu volcano.
The Toya hot springs, formed in 1962, became major geothermal direct-use features. This map was
drawn before the eruption of Showa-Shinzan volcano just south of Nishi-Kohan.
(Adapted from Ishikawa, 1970.)
Terre Blanche-Belfond in St. Lucia
The dacitic domes of Terre Blanche and Belfond grew in response to resurgent volcanic activity that occurred in the middle of the Qualibou Caldera on the island of St. Lucia, 20,000 to 40,000 years ago (Tomblin, 1964; Wohletz et al ., 1986). The geothermal potential of Sulphur Springs at the base of Terre Blanche was recognized early by Bodvarsson (1951) and Robson and Willmore (1955). An initial exploration project at Sulphur Springs began with seven wells that were drilled to depths up to 726 m (Merz and McLellan, 1976). Temperatures in these wells exceeded 200°C, and steam and geothermal brine were encountered in four of the wells. This exploration project was terminated because of a lack of fracture permeability in some wells, high CO2 content in the steam, and economic difficulties. Recent drilling performed for the St. Lucia government by a consortium of supporters has added two deep wells, one of which is located at the base of Terre Blanche dome and has a projected capacity of ~8 MWe.
Geology
Volcanism has occurred over the last 8 Ma in southern St. Lucia. In the area of the Qualibou caldera, 5- to 6-Ma-old basaltic lava flows are overlain by 0.75- to 1.0-Ma-old andesitic and dacitic composite cones, upon which lie caldera-related rocks: andesitic to dacitic tephra falls and pyroclastic flows of ~0.04 Ma as well as intracaldera dacitic lava domes and tephras of ~0.02 to 0.32 Ma (Fig. 5.40). Figure 5.41 is a map of the caldera showing the locations of geothermal wells between the dacitic domes of Terre
Blanche to the north and Belfond to the south. Sulphur Springs, the main area of geothermal manifestation, consists of boiling acid springs and fumaroles. The springs extend along a zone of strongly altered rocks that are located on the trace of northwest-southeast-trending regional fault between its intersections; there is an arcuate caldera-collapse fault along Rabot Ridge on the west and an approximately north-south fault splay that cuts the western side of Terre Blanche.
Figure 5.42 shows a cross section along line B—B' of Fig. 5.41. This section illustrates the substructure of the caldera and the caldera infilling of lavas and tuffs associated with Terre Blanche and Belfond. The most recent, well-dated volcanism (20,900 to 34,000 yrs; Wright et al ., 1984) caused the partial phreatomagmatic destruction and cratering of the Belfond dome; it also produced a southerly directed pyroclastic surge and flow deposit that formed a tuff-ring deposit over the southern margin of the dome (Wohletz et al ., 1986). Because fallout from this eruption does not drape Terre Blanche (although the fallout dispersal axis trends north-northeast and is up to 30 m thick in the caldera), it appears that the extrusion of Terre Blanche may postdate Belfond. The numerous phreatic explosion craters between Terre Blanche and Belfond apparently are aligned along caldera and regional faults. Detailed mapping of faults in
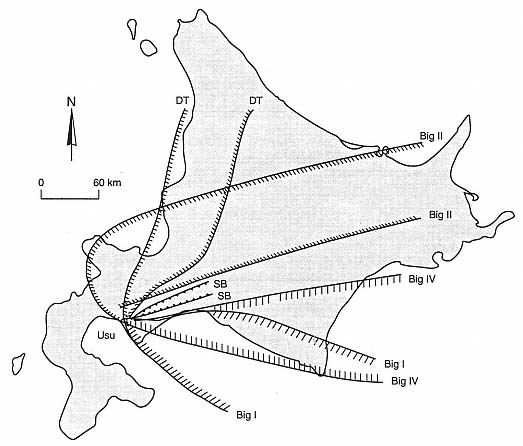
Fig. 5.36
Map of the distribution of tephra from Usu Volcano during the August 1977 eruptions indicates
the extent of measured ash falls from several major episodes of
activity called the Big I, Big II, Big IV, DT, and SB.
(Adapted from Katsui et al ., 1978.)
Fig. 5.37
Regional Bouguer gravity near Usu, showing the anomaly associated with the Toya caldera. Gravity
contours and measured gravities are given in milligals.
(Adapted from Yokoyama, 1964.)
Fig. 5.38
Distribution of seismic hypocenters of A-type
(circled dots) and C-type (small dots) earthquakes
in plan view and along cross sections A-A'
and B-B'. Minakami et al . (1951) related the
clusters of shallow C-type hypocenters just
under the summit of Usu (at the intersection of
the cross sections) and on its eastern flank
to magma movement in a
conduit below growing domes.
(Adapted from Minakami et al ., 1951.)
the caldera is limited by the thick cover of pyroclastic debris from these late stage eruptions. Steam found in well 7 (see Fig. 5.41) was encountered at depths and in lithology that coincide with those of the tuff ring under Terre Blanche, which is exposed on its northeastern side. The steam field underlying Sulphur Springs is thought to have developed in the fractured lavas and breccias of precaldera andesites.
Geophysical Properties
Electrical surveys of the Qualibou caldera have been successful in identifying major faults and general structural features at depth that were predicted by geological cross sections. Greenwood and Lee (1976) completed dipole-dipole resistivity profiles with penetration to 700 m that indicated surface anomalies of conductive rock along linear features corresponding to faults. Ander (1984) extended these data to nearly 2.5 km below Sulphur Springs. Apparent resistivities plotted as a pseudosection in Fig. 5.43 show a resistivity high that corresponds to dacite lavas below the Belfond dome and resistivity lows that are thought to represent conductive geothermal brines along the northern and southern caldera rim faults as well as a deep brine reservoir beneath Sulphur Springs. The higher resistivity zone at an intermediate depth below Sulphur Springs corresponds to depths where wells intersected steam-producing strata; this anomaly is likely produced by dry steam, which is poorly conductive. Gandino et al . (1985) also present gravity data that apparently delineate a positive gravity anomaly in the caldera structure—the result of a relatively dense caldera fill; their audio-magnetotelluric data indicate deep electrical discontinuities related to major faults.
Hydrogeochemistry
Geochemical studies of this area have been performed by Bath (1976; 1977), Aquater (1982), and Goff and Vuataz (1984). Consideration of new data and previous studies led
Fig. 5.39
Plot of seismic frequency, hot-spring temperature, and bicarbonate content for the
period 1975 through 1977 at Usu volcano. These three indicators rose
sharply in months preceding the 1977 eruptions.
(Adapted from Katsui et al ., 1981.)
Goff and Vuataz to conclude that a geothermal reservoir underling the Sulphur Springs area consists of an upper-steam condensate zone, an intermediate depth, two-phase zone, and a lower brine zone. Sulphur Springs display chemical compositions (Table 5.5) very characteristic of acid-sulfate systems in which mixtures of steam and other gases condense in the near-surface environment and oxidation of H2 S and H2 SO4 leads to acidic conditions. The springs have relatively low pH, high SO4 , and a low Cl content; divalent and trivalent cations (Ca, Mg, Al, and Fe) dominate Na + K, and most trace elements other than B are relatively scarce. Bath's (1977) brine analyses of well 4 (see Fig. 5.41) show considerable variability because of wet and dry cycling of the flow from the well, which indicates variable steam loss from the brines sampled. Goff and Vuataz (1984) noted that this brine is extremely unusual because the Ca content is twice that of Na by weight and it is very rich in B.
Although drilling encountered temperatures >220°C at depths of 700 m (Williamson, 1979), oxygen isotope composition, gas geothermometry, steam enthalpy, and B abundances indicate brine reservoir temperatures are near 280°C. Figure 5.44 (Goff and Vuataz, 1984) shows a model of the geothermal system beneath the Sulphur Springs area in which geothermal upflow could occur beneath Sulphur Springs and possibly below Belfond—the areas of most recent silicic dome eruptions. Lateral outflow occurs near the surface in the condensation zone, but there is also a strong possibility that it occurs below the vapor zone, where deep brines flow northward and pool against the north caldera-wall
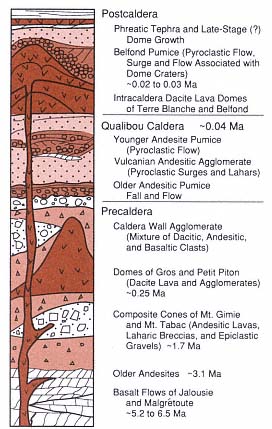
Fig. 5.40
Generalized stratigraphy of Qualibou caldera near
the Terre Blanche dacite dome on St. Lucia. The
stratigraphic section represents a thickness of
~2 km and reflects a general trend from
precaldera mafic andesites and basalts through
intermediate products of caldera-related
eruptions to postcaldera eruptions associated
with silicic dome rock. A vapor-dominated
hydrothermal system is thought to exist in
pumice sections just below the intracaldera
dome lavas, and there is probably a brine
reservoir in the fractured caldera-
fill and precaldera rocks below.
faults. The brine composition indicates it originated from sea water that reacted with basaltic rocks in the subsurface and was subsequently replaced by meteoric water.
Volcanological Interpretations
Young volcanism that filled the Qualibou caldera took the form of dacitic lava out-pourings, which built the Terre Blanche and Belfond domes. This volcanism indicates a magmatic heat source of sufficient size and youth to retain magmatic temperatures at depths of several kilometers or more. Extensive evidence of phreatomagmatic eruptions that postdate the domes is recorded by numerous explosion craters and tephra blankets. Because fragments of the deep basaltic strata exist in the phreatomagmatic tephra and the geochemistry of the brine points to seawater/basalt chemical interactions, it appears possible that a geothermal reservoir formed after dacitic magma intruded into the lower part of the volcanic stratigraphy below the Qualibou caldera (Fig. 5.45). Intersections of caldera ring faults and through-going regional faults have provided fracture permeability along which deep brines have risen. The steam reservoir may exist in still porous and permeable tephra layers and in the caldera fill and precaldera breccias.
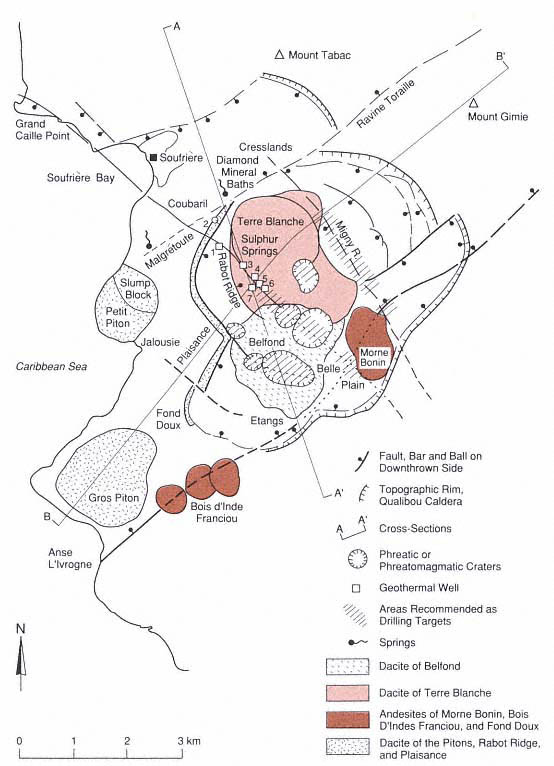
Fig. 5.41
Geologic map of the Qualibou caldera on St. Lucia, showing the major silicic dome complexes of Terre
Blanche and Belfond that were erupted after caldera collapse. Exploratory geothermal drilling (Wells 1
through 7) has concentrated on a regional northwest-southeast-trending fault zone that runs between
these two domes. Note the alignment of two large phreatic craters along this fault zone and those along
the ring fracture that extends through the Belfond dome. The depth to precaldera basaltic rocks in
well 2 is at least several hundred meters less than in nearby well 1, which suggests the location of
a western caldera ring fault that exposes precaldera Piton-type dacites.
(Adapted from Wohletz et al ., 1986.)
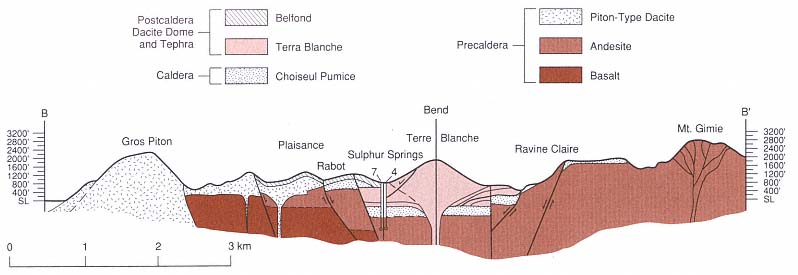
Fig. 5.42
Cross sections along B—B' (see Fig. 5.41) under Terre Blanche dome. Stratifications illustrated at the base of the Terre Blanche
dome denote the pumice-rich tuff ring strata that was erupted before the extrusion of dacite lava. Formation permeability in
these tuffs has allowed a vapor-dominated reservoir to develop. This reservoir is connected by fractures to a deeper brine
zone in the Choiseul Pumice and precaldera andesites below. Geothermal wells 7 and 4 (see Fig. 5.41) intersected these units.
(Adapted from Wohletz et al ., 1986.)
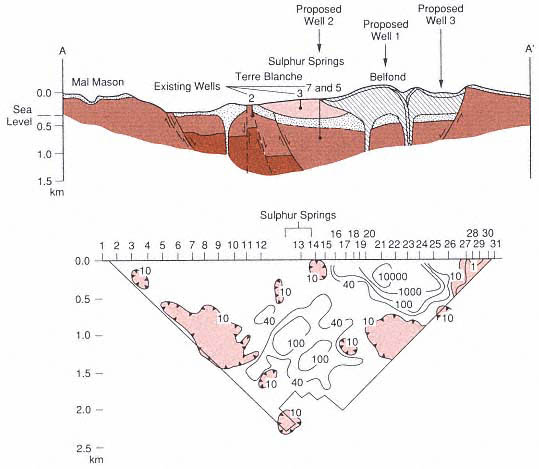
Fig. 5.43
Geophysical resistivity pseudosection along cross section A–A' (see Fig. 5.41) running west of
Terre Blanche and under the Belfond dome. The apparent resistivity high (W-m) under the Belfond
dome represents relatively unfractured dacite lavas, whereas the closed contours of resistivity
lows beneath the north and south caldera margins and below Sulphur Springs are thought to reflect
brine reservoirs. Intermediate resistivity contours below Sulphur Springs at a depth of H1 km probably
indicate the poor conductivity of dry steam. Three exploratory wells were proposed on the basis of
the location of resistivity lows, the geology, and geochemical indicators.
Proposed well 2 produced steam (~300°C) at a depth of ~1400 m.
(Adapted from Wohletz et al ., 1986.)
Fig. 5.44
The hydrogeochemical model of the Terre Blanche-Sulphur Springs area shows a vapor
zone over a brine zone as well as upflow under Sulphur Springs and Belfond. The
condensation of steam and mixing with surface aquifers produce later flow toward
the northern caldera margin, which feeds Diamond Spring.
(Adapted from Wohletz et al ., 1986.)
|
||||||||||||||||||||||||||||||||||||||||||||||||||||||||||||||||||||||||||||||||||||||||||||||||||||||||||||||||||||||||||||||||||||||||||||||||||||||||||||||||||||||||
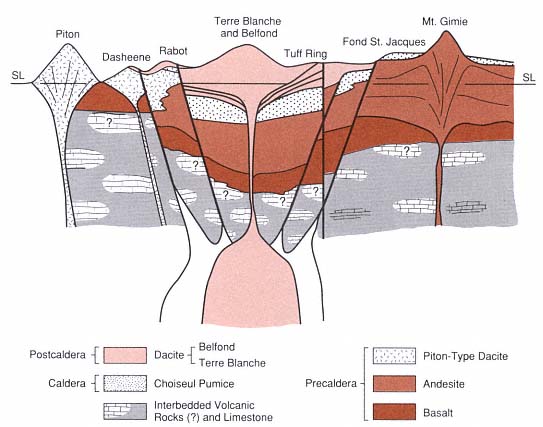
Fig. 5.45
A schematic geological model cross section of the Qualibou caldera from west to east shows (with
some vertical exaggeration) how the dacitic domes have filled in the caldera above the Choiseul
Pumice, which was erupted during caldera collapse. Strong evidence for the caldera structure is
provided by the precaldera basalt that is exposed at the surface near the Piton as well as at many
other locations in southern St. Lucia but is found at depths >1 km in geothermal wells inside
the caldera. The magma chamber is shown as two bodies; the outer one is andesitic and
the source of the precaldera and caldera intermediate rocks, whereas the inner body is
dacitic and represents magmatic resurgence that caused eruption of the dacite domes.
The hypothetical depth of these chambers (~4 km) is drawn from measured geothermal gradients.
Chapter 6—
Geothermal Systems Associated with Basaltic Volcanoes
The most common type of volcanism on Earth is the eruption of basaltic lavas and associated pyroclastic ejecta. The annual rate of magma production for the Earth is ~33.5 km3 ; this estimate by Schmincke (1982) includes both magma intruded into the crust and erupted magma. Basaltic magmas make up ~80%—or 28 km3 of the total volume.
Basaltic magmas originate deep in the mantle and rise quickly to the surface, sometimes carrying solid bits of the mantle along in the form of xenoliths. The lower SiO2 content and higher temperatures of these low-viscosity magmas (most are near 1200°C) allow them to rise buoyantly through narrow dikes in the crust. Unless the magmas have pooled in the shallow crust, as is the case below calderas of most basaltic shield volcanoes, they quickly lose their heat after eruption. Delaney (1987) pointed out that if they are isolated and have fed only a monogenetic cone, basaltic dikes do not provide sufficient long-term crustal heat to drive a geothermal system.
The utility of a basaltic system as a geothermal heat source depends on the rate and volume of intrusion and eruption, which in turn is dependent on the tectonic setting. Basalts erupted along continental rifts can provide a significant heat source if extension rates along those rifts are high and the crust is thin. In many continental rifts, extension rates are low; consequently, eruptive (and intrusive) rates are low and vents are widely spaced in time and space. The narrow dikes feeding these vents cool quickly; however, many such areas of extension may contain geothermal systems that result from the deep circulation of meteoric waters in zones of elevated heat flow.
Vast basalt plateaus present on most of the Earth's continents were formed during periods when lava flows that were tens of meters thick and hundreds of kilometers long filled large basins. Most of these plateaus are old; the most recent major event formed the Columbia River Plateau of the United States during an eruption of 2 × 10⁵ km3 of basaltic lavas between 17 and 6 m.y. ago (Waters, 1961). Plateau basalts like those covering large areas of the north-western United States exhibit no high-temperature geothermal potential.
Basaltic volcanoes within regions of active extension may contain promising geothermal systems. Such regions include the mid-oceanic ridge spreading centers and associated very high temperature hydrothermal systems that cover large areas but are mostly submerged. Where these systems emerge from the sea, as they do in Iceland, numerous high-temperature geothermal systems are accessible. Other basaltic volcanic fields that have excellent potential for geothermal development are the mid-plate oceanic islands like Hawaii, where eruptions occur along rifts associated with large slump blocks that are adjacent to the unbuttressed volcano flanks (Fig. 6.1; Fornari and Campbell, 1987). Continued intrusion and eruption is required to maintain these thermal sources. For example, the upper east rift of Kilauea Volcano on Hawaii has been erupting steadily since observations began in the early 18th century AD Decker (1987) reported that this rift has widened by ~4 m over a 19-year period as a result of 20 intrusions into the summit and the east rift. Christiansen (1987) determined that for every 1 m3 erupted at Kilauea, 2 m3 is intruded. At this rate of extension and intrusion, there is a dependable source of heat to drive hydrothermal systems for some time to come.
The success of geothermal development in basaltic volcanic fields is dependent on an understanding of aquifer locations and regional groundwater movement. Many basalt units in the upper 1 or 2 km of crust are fractured and jointed; they serve as excellent aquifers if they have not been sealed by secondary mineralization. Ash beds, fine-grained sedimentary rocks, and soils interbedded with lava flows often form aquitards for these volcanic aquifers or reservoirs.
Scoria Cones and Tuff Rings
One of the most common subaerial volcanic landforms on Earth is the scoria or cinder cone. Scoria cones are usually formed during single eruptions of basaltic or basaltic-andesitic magmas. Construction of a scoria cone commonly follows the opening of a narrow fissure, a short period of lava fountaining, and (sometimes) a lava flow (Foshag and Gonzalez, 1955; Budnikov et al ., 1975). Soon after the eruption begins, effusive activity is concentrated at one or more points along the fissure. Strombolian or Vulcanian eruptions, consisting of the explosive ejection of bombs, blocks, and ash, continue intermittently for weeks to years. During this period, one or more cones develop through a process of ballistic
Fig. 6.1
(a). Schematic cross-section of the lithosphere beneath kilauea Volcano. The magma ascent
funnel is shown as a region of extensional fractures and magma batches migrating from the
asthenosphere. Variations in stress orientation from the lithosphere and volcanic edifice are shown.
(Adapted from Ryan, 1987a, b.)
(b) Simplified block diagram of the east rift zone of Kilauea Volcano. In one interpretation,
stresses that cause rifting are related to a gravitational collapse of the island's flanks, which allows
intrusion and further widening by dike complexes (A). Other interpretations (B) show the rise of
magma toward the summit of the shield; this movement, cutting across the listric faults, may have
only a minor effect on dike distribution.
(Adapted from Decker, 1987.)
deposition and subsequent slumping when scoria deposits that form the cone exceed the angle of repose, as is shown in Fig. 6.2(a) (McGetchin et al ., 1974). The cone consists of unconsolidated and sometimes welded scoria, blocks, and bombs that make up thick beds dipping outward from the vent at the angle of repose [Fig. 6.2 (b)]. Craters in scoria cones are occasionally modified after they are filled with lavas; in some cases, when leaks develop in the crater walls, dikes and sills penetrate the surrounding scoria deposits (Gutmann, 1979). Lava flows can also erupt from the cone flanks or overflow the crater rim.
Considerable heat is released during the eruptions that produce a cinder cone and its associated lavas. Scandone (1979) estimated that during the 8-year-long eruption of Parícutin in Mexico, 1309 × 106 m3 of tephra and 700 × 106 m3 of lava were erupted; the associated thermal energy was 2.75 × 10¹⁸ J (0.66 × 10¹⁸ calories). This is a substantial amount of heat, but it was deposited above the ground surface and therefore was lost through radiation and convection of heated rain water in the cone.
If rising magma intersects an aquifer or shallow surface water, the resulting volcanic structure will be a tuff cone or tuff ring rather than a cinder cone (Heiken, 1971). Tuff rings are broad, low rings composed of well-bedded, fine-grained tuffs in plane beds and cross-bedded surge deposits [Fig. 6.2 (c)]; poorly exposed tuff ring deposits are often mistaken for fine-grained sedimentary rocks (Fisher and Schmincke, 1984). During the formation of tuff rings by phreatomagmatic or hydrovolcanic eruptions, pyroclastic debris are deposited at relatively cool (~30°C) temperatures because most of the heat is lost in the steam that drives these explosive eruptions.
Most cinder cone fields were constructed by many small-volume eruptions from widely spaced vents, and they do not provide the thermal mass required for a high-temperature geothermal resource. In such areas,
Fig. 6.2
(a). In this diagram of the four major stages in the development of a scoria cone, the numbers refer to
deposits from corresponding eruption stages; only one-half of the cone is shown. During stage 1,
a low-rimmed pyroclastic ring is composed of scoria-fall beds and ballistically emplaced blocks and
bombs. During stage 2, the ring reaches the angle of repose for unconsolidated clastic material;
slumping and avalanching of scoria begins; and the outer slopes of the cone are covered with talus.
In stage 3, the original rim of the cone is destroyed by inward migration of the talus pile. During
stage 4, the talus apron reaches the ballistic limit of the ejecta. The many sizes and shapes of scoria
cones depend on the stage reached as the eruption ended. It is also possible for the crater to fill with
a lava lake and for lava to then spill out of the crater and stabilize the cone slopes.
(Adapted from McGetchin et al ., 1974.)
Fig. 6.2
(b) Cross section of the Rothenberg scoria cone in Germany. Scoria cones are the Earth's
most common volcanic landform above sea level. (Adapted from Houghton and Schmincke, 1989.)
(c) Cross section of a tuff ring formed by the phreatomagmatic eruption of a basaltic magma.
1 = country rock; 2 = explosion breccia; and 3 = bedded tuffs of the tuff ring. Tm = maximum
thickness of the tuff ring at crater rim; Wr = rim-to-rim diameter; We = crater diameter
(excavation width); q
m = maximum outward dip of tuff beds; Lr = tephra runout distance; and
De = excavation depth. Tuffs characteristic of tuff rings and tuff cones are generally fine
grained; most of the ash and lapilli were deposited by pyroclastic (base) surges and not by
fallout. Magma volumes and compositions for scoria cones and tuff rings can be identical.
The differences are caused by the interaction of magma and water, which results in the much
more violent phreatomagmatic eruptions that form tuff rings.
(Adapted from Wohletz and Sheridan, 1983.)
the magmas have risen to the surface from the mantle without forming shallow crustal magma bodies. Crater Flat, in south-central Nevada, has 15 small basaltic centers that were erupted during three phases over a period of 3.7 m.y. (Vaniman and Crowe, 1981). The volumes are small (0.3 to 1.5 km3 for each center), as is the cone density (spacing)—10-3 to 10-4 /km2 . The San Francisco volcanic field is larger: 5000 km2 is covered by a few silicic volcanoes and hundreds of scoria cones. The magma sources for the scoria cones and associated lavas there are deep (15 to 40 km), and volumes of individual eruptions are small (Moore et al ., 1976).
Shield Volcanoes
The giant shields that make up many mid-oceanic-plate volcanic islands may contain geothermal resources. In Hawaii, the shield volcanoes are fed from a central conduit below the summit caldera and from active rifts on the flanks (see the case study of Kilauea Volcano presented in this chapter). Shield volcanoes are constructed of thousands of lava flows (from the sea floor to the summit), which are fed by lateral flow from a summit caldera into dikes along flanking rift zones. Magma erupted from rift vents does not move straight upward from the mantle, but laterally along rifts from reservoirs located below the summit calderas. These lava flows are thin, unless they pond in a caldera, a pit crater, or a valley. When groundwater flowing toward sea level is blocked by dike swarms within active rifts, these "perched" aquifers can supply fluids necessary for a hydrothermal system. Figure 6.3 illustrates the interbedded pyroclastic rocks, paleosols, zones cemented with secondary minerals, and rift dike swarms that form the aquitards confining aquifers within the flanks of shield volcanoes (Stearns and MacDonald, 1946).
Fig. 6.3
Simplified hydrology of a mid-oceanic shield volcano
(Adapted from Stearns and Macdonald, 1946.)
Later in this chapter, we describe hydrothermal systems that have been tapped in shield volcano rift zones. These case studies include geothermal systems currently operating in Iceland and a field being developed along Kilauea Volcano's east rift.
Lava Lakes and Magma Energy—Resources for the Future
Eruptions on basaltic shield volcanoes are often followed by the collapse of summit calderas or pit craters located along the rifts. These craters may be filled with lava from either the eruption that formed them or lava flows that spilled into them during later eruptions. At Kilauea Volcano between 1959 and 1972, eight lava lakes were formed; their thicknesses range from 6 to 180 m and initial temperatures were 1100 to 1200°C. Although these lakes are short-lived (they solidify within a few decades) and potentially hazardous, Colp (1982) has proposed that they be used to develop high-temperature, manmade geothermal systems.
Makaopuhi, Alae, and Kilauea Iki lava lakes in Hawaii have been studied by means of drillholes, geophysical surveys, and thermal models. Kilauea Iki, a pit crater adjacent to Kilauea Caldera, was partly filled with 38 × 106 m3 of lava that formed a lake 110 m deep and 750 m in diameter (Richter et al ., 1970). Data from the 11 holes drilled into the lake over a 16-year-period have indicated that the depth to molten rock has progressed from 4.8 m in 1960 to 45 m in 1976 (Fig. 6.4). The crust has been solidifying at an average rate of 6.7 × 10⁻⁸ m/s (Hardee, 1980). Heat is being released through two zones in the solid crust: a lower, one-phase advective zone and an upper, two-phase convection-advection zone (Fig. 6.5). Temperature measurements indicate a constant temperature of 100°C to a depth of 40 m, below which it increases abruptly to 1070°C at 52 m.
Although many geologists and engineers believe that lava lakes are a potential, short-term thermal resource, the drilling and extraction techniques that would make production wells within these lakes practical have yet to be developed. The difficulties of transferring heat from a lava lake to the surface still must be overcome. For instance, present routine geothermal drilling is limited to temperatures of <250°C. If indeed the technology can be developed, the surface facilities obviously must be portable. At Kilauea Iki, for example, the crater has been partly filled three times since 1832, and it is probable that there will be more eruptive episodes in the near future.
Kilauea Volcano and Kapoho Geothermal Area of Hawaii
The Hawaiian-Emperor Island chain consists of ~107 volcanoes that range in age from 80 Ma at the northwestern end to currently active volcanoes at the southwestern end (Decker et al ., 1987). The islands are remnants of these volcanoes, which rise between 5,000 and 10,000 m above the floor of the Pacific Ocean. The chain was formed as the Pacific plate moved over the Hawaiian hot spot at 9.2 cm/yr (Hawaiian Chain) and 8.6 cm/yr (Emperor Chain) (Clague and Dalrymple, 1987). Subaerial portions of these islands consist of thousands of thin basaltic lava flows and minor deposits of pyroclastic rocks and differentiated lavas. Hawaii, the youngest island in the chain, is made up of five overlapping shield volcanoes, two of which remain active (Fig. 6.6).
The still-active shield volcanoes of Kilauea and Mauna Loa are believed to be made up of a below-sea-level mass of submarine pillow basalt that is interbedded with and overlain by hyaloclastite deposits and subaerial basalt flows. Hill and Zucca (1987) report that under the Kilauea and Mauna Loa shields, the Mohorovicic
Fig. 6.4
Map and cross-section of Kilauea Iki Crater before and after the 1959 eruption. The deep lava lake
has been drilled many times for research purposes and has been the testbed for the U.S.
Department of Energy's magma energy concepts.
(Adapted from Richter and Moore, 1966.)
Fig. 6.5
Models and observations of the thermal history of the Kilauea Iki lava lake. (a) Model of cooling
above a downward-moving thermal front at 2000, 4000, and 6000 days. (b) An early model proposed
to explain the drastic temperature change in the one-phase advective (dry-out) zone. (c) This
summary of the major physical characteristics of the lava lake in 1980 (20 years after the eruption)
shows depth to melt, changes in resistivity, temperature, percent of glass,
and depth (120 m) to the preflow surface (lake bottom).
(Adapted from Hermance and Colp, 1980.)
discontinuity increases from ~10 km (for normal oceanic crust) to 13 and 18 km, respectively. Fast P-wave travel times through rift zones and summit calderas as well as positive gravity anomalies over them indicate that intrusive cores form a significant fraction of these volcanic edifices (Fig. 6.6).
Eight of the youngest and largest islands in the chain make up the State of Hawaii, which is an area of intense urban and agricultural development. A comprehensive evaluation of Hawaii's geothermal resources, conducted by university and federal scientists (Thomas et al ., 1979, 1983), concentrated on calderas and associated rift zones. Much of the work focused on the Island of Hawaii and drew upon the vast research base built by the State of Hawaii, the Hawaiian Volcano Observatory, research drilling programs, and commercial geothermal drilling projects. The report cites an output of 3MWe at the one operating hydrothermal electrical generating plant, which is located at the Kapoho geothermal site on Kilauea Volcano's east rift zone. At this time, a well field is being drilled and a 25-MWe (net) power plant is being constructed in the Kapoho area (Clark and Stewart, 1991).
Migration of Magma and Evaluation of Thermal Sources
As is the case for all hydrothermal systems, geothermal system development in Hawaii depends on an understanding of volcanic heat sources and groundwater. In this area, where there is little surface water and a constant volcanic hazard, geoscientists have achieved a good understanding of both of these crucial aspects. Most of the geothermal exploration on the Island of Hawaii is concentrated on Kilauea Volcano, where the storage, migration, and eruption of basaltic magmas is monitored by the Hawaiian Volcano Observatory's geophysical network.
In this area, magma rises buoyantly along a very irregular network of vertical, roughly cylindrical conduits that are marked at the surface by a caldera. Kilauea Caldera, located at the summit of the volcano, consists of concentric collapse craters, the widest of which is 4.5 by 3 km. Helz (1987) has determined that the picritic (~20% olivine phenocrysts) basalt of the 1959 Kilauea eruption originated at depths of 45 to 60 km and rose to the surface at velocities of 0.58 to 0.77 cm/s; which is fast enough to carry along olivine xenocrysts and aggregates.
Eruptions in calderas and along rifts are spectacular—with lava fountains, fast-moving lava flows, and occasional phreatomagmatic activity—however, most of the magma never reaches the surface but comes to rest in a shallow crustal environment. These magma bodies, located within the uppermost 7 km of the crust, are responsible for the heat that drives geothermal systems on Kilauea. Ryan (1987a,b) addressed the reason most magma comes to rest at shallow levels in the crust in his elegant study on the regions of neutral buoyancy. Ryan integrated seismic and surface deformation data with measurements of the physical properties of rock and magmas under pressure to provide information on the variation of crustal rock densities with depth. Below 9 km, all macrofractures, microfractures, vesicles, and joints are eliminated by bulk compression [Fig. 6.7(a)]. Below 7 km, magma is transported buoyantly within the central conduit and the intensity of hydraulic fracturing is high. Between 7 and 2 km, the in-situ densities of the fractured crustal rock and the magma are similar, and a magma
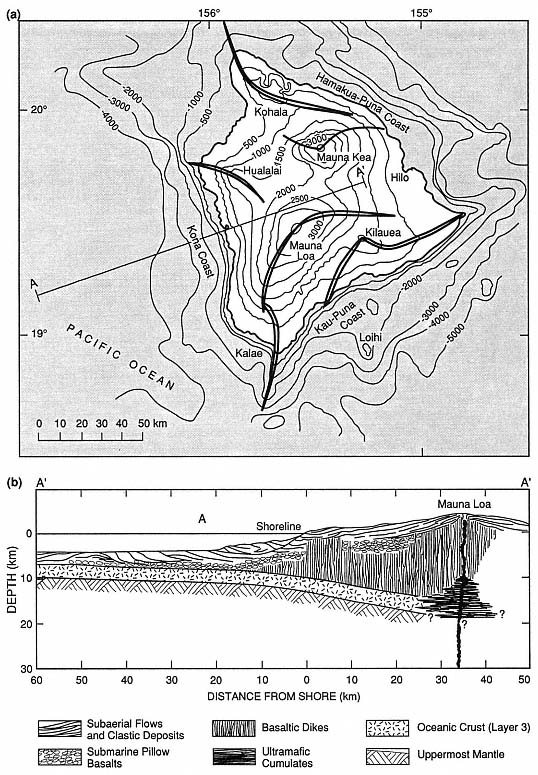
Fig. 6.6
(a) Map of the island of Hawaii shows the major rift-zones of the five overlapping shield volcanoes.
Elevation and depth contours are in 500-m intervals on land and 1,000-m intervals offshore.
(b) This schematic cross-section of the central and western Mauna Loa shield is based on the
P-wave velocity and density models of Hill and Zucca (1987).
body is formed at a point where buoyant rise is no longer possible; the fact that this is an increasingly aseismic region indicates a higher fluid/rock ratio (Fig. 6.7). The center of neutral buoyancy is located at depths of 2.5 to 4.5 km, suggesting a correspondence between the depths at which magma is in mechanical equilibrium with the surrounding rock and the depth of Kilauea's subcaldera magma reservoir. From depths of 0 to 2 km, the deformed and fractured crust allows vesiculating magmas to pass through dikes. As the volcano grows, the summit (subcaldera) magma reservoir and associated rift system is elevated and achieves mechanical equilibrium within the lava shield (Ryan, 1987a,b). The entire igneous system rises with both time and a continuing supply of magma, but it retains the same depths below the volcano's surface. This is an important concept to keep in mind when evaluating thermal sources within shield volcanoes similar to those at Kilauea and Mauna Loa.
Ryan (1987a,b) determined that most magma movement into rift zones from the summit reservoir is at a depth of 3 km—a level of neutral buoyancy. Magma moves rapidly along the rift until the fluid pressure falls below that of the tensile strength of the host rock. Ryan (1987a,b) cites three types of dike formation.
(1) Slow movement of magma, with a gradually enlarging fracture front. The dike top rises toward the surface and the bottom descends at a similar rate.
(2) Rapid movement of magma, during which the dike top rises rapidly and, simultaneously, the base sinks. Subsequent pressure reduction narrows the dike and restricts it to the neutral buoyancy zone.
(3) Pressure differentials within the growing dike form an intrusion shaped like a doubly serrated knife. The "serrations" have amplitudes of 2 to 6 km. Where a rising dike intersects the surface, cracks open and a rift eruption begins, as is depicted in Fig. 6.8.
These models have been developed from data collected over the last 20 or 30 years, when activity at Kilauea volcano has been mostly along the rifts.
A well-exposed analog to Kilauea volcano is the Koolau volcano on Oahu, for which Walker (1986; 1987) described the internal structure. The shield of Koolau was constructed by small but frequent eruptions of basaltic magma. Erosion has eroded the 57-km-long volcano to a depth of ~1 km and exposed the plumbing within its shield. Kailua caldera, located at the southeast end of the Koolau volcano, is analogous to Kilauea Caldera and consists of mainly thick, massive lava flows. It lacks the thin pahoehoe lava flows that characterize the Kilauea shield volcano. Breccias within the 4-km-diameter Kailua caldera may represent either periods of collapse or phreatic blasts. A rift extending northwest from the caldera is composed of ~5100 dikes over its 3.3-km width, as is illustrated in Fig. 6.9. The rift
Fig. 6.7
Earthquake abundance and in-situ density with depth beneath Kilauea volcano.
(a) Distribution of earthquakes beneath Kilauea's summit region, to a depth of 20 km.
The dark pattern refers to the volume beneath the whole Kilauea caldera and the light
pattern refers to the volume beneath only Halemaumau crater. The aseismic
region from 2 to 7 km is believed to have high magma:rock ratios.
(Adapted from Ryan, 1987a.)
(b) In-situ densities of olivine tholeiitic basalt near its liquidus, volcanic shields, and the upper
mantle below Hawaii. The depth region of density crossover coincides with the subcaldera region of
magma storage below Kilauea; based on data from Salisbury and Christensen, 1976; Fuji and
Kushiro, 1976; and Zucca, Hill, and Kovach, 1982.
(Adapted from Ryan, 1987a.)
Fig. 6.7
(c) Schematic diagrams show the evolution of oceanic shield volcanoes such as Hawaii, progressing
from Mokuaweoweo caldera of Mauna Loa volcano (oldest) to the Loihi seamount (youngest).
Low r = low density; Vp = P-wave velocity; and Vs = shear-wave velocity. As the volcano grows,
it carries with it its contractancy profile and regions of fracturing; the region of neutral buoyancy
rises from below sea level to well above sea level.
(Adapted from Ryan, 1987b.)
follows listric faults that dip outward on either side of the Koolau shield. Dikes range in width from <5 to 670 cm, with a median of 53 cm, and typically have glassy, chilled margins and sheetlike cooling joints that are perpendicular to dike margins. These dikes sometimes occur in clusters (or swarms) as wide as 20 m, in which successive members were injected either along the margins or inside preceding dikes. Within such clusters, dikes may make up 100% of the rock.
Most of Hawaii's recent exploration and drilling for hydrothermal development has been along the east rift zone of Kilauea Volcano. The subaerial part of Kilauea is 80 km long and 20 km wide and still growing. [For the most recent compilation of geologic maps, refer to Holcomb (1987)]. Kilauea rises to an elevation of 1240 m above sea level and serves as a topographic barricade to the trade winds and rainfall; as a consequence, the eastern slopes of the volcano are covered with dense vegetation and the southwestern slopes are a desert— an important observation to consider in planning geothermal development. Kilauea is young and very active: 90% of the surface is younger than 1000 years (Holcomb, 1987). Approximately 50% of the volcano surface is covered with lavas that overflowed the summit caldera, but such an event has not occurred for 200 years; 81% of the lava flows are pahoehoe , and aa flows make up a smaller volume. During the last 500 years, periods of sustained summit activity have included only minimal flank (rift) activity. However, when there is little activity at the summit, other than caldera collapse, the flanks are more active.
Kilauea's caldera is actually a collection of nested (but not concentric) calderas, in which the outermost visible caldera is 7.5 by 5.1 km and the innermost (Halemaumau Crater) is 0.9 km in diameter. The subaerial portion of Kilauea's east rift zone is 50 km long and 2 to 3 km wide; the actual rift extends about 50 km further below sea level. Figure 6.10 illustrates the surface manifestations of rift tectonic and volcanic activity: normal faults, open fissures, and pit craters; cinder cones, spatter ramparts, tuff cones, and steaming ground are associated with these features, but are not shown on this map.
Hydrothermal Systems at Kilauea Caldera and Along Its East Rift Zone
A 1.2-km-deep research drillhole, located on the southwest margin of Kilauea caldera, was drilled to a depth just below sea level to test hypotheses concerning the thermal state and groundwater movement near a magma body (Keller et al ., 1979). The drilling operation encountered lava flows as well as a few sills and ash layers. Porosity decreases with depth, which is commonly the result of pore spaces filling with secondary minerals. Permeabilities above the water table are 100 mD to 1 D; below the water table they are <100µD (Zablocki et al ., 1974).
Within the Kilauea well, temperatures of 20 to 30°C are maintained with increasing depth until, at 480 m, the water table is reached. At that depth, temperatures rise rapidly in lavas, which are saturated with brackish water below the water table; the temperatures begin to decrease at a depth of 725 m (Fig. 6.11). Below 725 m, the thermal gradient is conductive and reaches a temperature of 137°C at the bottom of the drill-hole. Zablocki et al . (1974) concluded that if this gradient persists, magmatic temperatures should be found at a depth of 4 km.
Figure 6.12 shows the locations of five deep (>2000 m) and four shallow exploration wells drilled in the Puna District along Kilauea's east rift zone in the 1960s, 1970s, and early 1980s. The first two wells were drilled adjacent to vents of the 1955 eruption, where there is steaming ground. These wells, drilled to depths of 54 and 167 m where the maximum temperatures were 54 and 102°C, respectively, were sited in the unsaturated zone and no geothermal resource was found (Thomas et al ., 1983).
Fig. 6.8
Three-dimensional model of the internal structure of Kilauea volcano. The medium stippled pattern
denotes the structure of the southwest and eastern rift zones that extend outward from the summit
magma reservoir, as well as the main conduit that rises from a depth of 40 km. The reservoir is a lightly
shaded region at a depth of 2 to 7 km. Periodic high-level injection of magma into the rift zones occurs
along the horizon of neutral buoyancy (arrowed pathways) and is associated with the lateral
formation of dikes at 3 km below the volcano's surface.
(Adapted from Ryan, 1987b.)
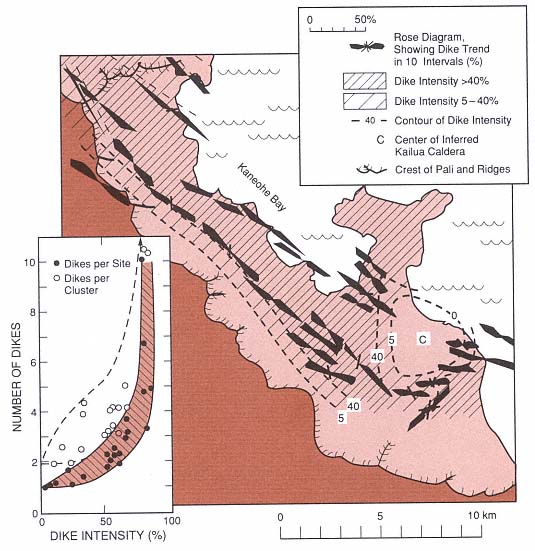
Fig. 6.9
Dike swarms of the ancient Koolau dike complex and Kailua caldera. (the inset shows dike intensity
as well as the number of dikes per cluster and site). This ancient shield caldera and rift zone is
analogous to the modern Kilauea volcano and is used to
interpret the younger volcano's structural framework.
(Adapted from Walker, 1987.)
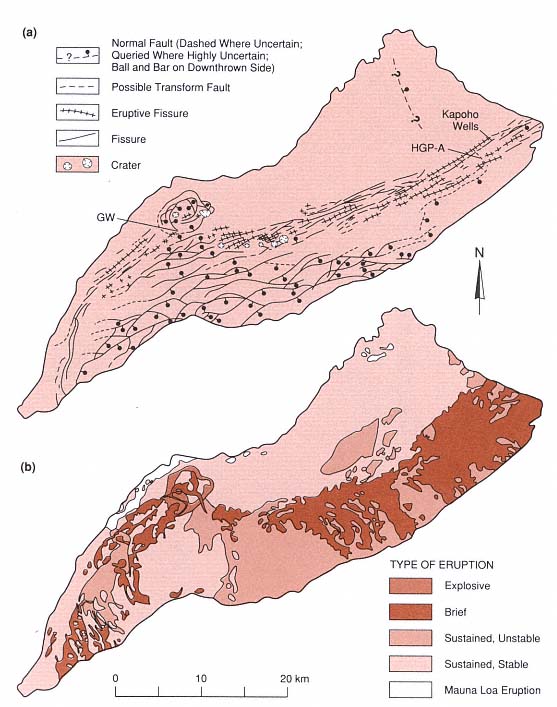
Fig. 6.10
Geology of Kilauea volcano. (a) Structural map depicting Kilauea caldera, pit craters, normal faults,
fissures and eruption fissures. HGP-A is the location of the Hawaii Geothermal Project well in
the Puna District. The Kilauea research drill hole is denoted GW. (b) Map of Kilauea volcano
showing lava flows classified by eruption type.
(Adapted from Holcomb, 1987.)
Fig. 6.11
(a) Cross-section of Kilauea caldera including the Kilauea Research drill hole (GW). (b) Temperature
logs from the Kilauea drill hole. There is no increase in temperature until the water table is reached
at a depth of 480 m. Below 725 m, the gradient is conductive
it reaches a maximum of 137°C at a depth of 1250 m.
(Adapted from Zablocki et al ., 1974.)
Fig. 6.12
(a) The lower east rift of Kilauea volcano indicating the limits of the surface expression of the rift
and the location of groundwater and geothermal wells. Contour intervals are 200 ft. The inset shows
topography, the apparent water table, and self-potential for profile A—A'.
(Adapted from Thomas, 1987.)
In 1976, a government-sponsored well (HGP-A) was drilled near the center of the east rift zone at an elevation of 200 m and ~300 m east of a spatter rampart formed during the 1955 eruption. This well is located near the intersection of the north-east-trending rift and a northwest-trending, right lateral fault mapped by Holcomb (1987). The drillhole is also 28 km west of and 1043 m lower than Kilauea's summit caldera. It was drilled to a depth of 1968 m and has a bottom-hole temperature of 358°C (Fig. 6.13). The reservoir is located in lava flows and dikes, where Stone and Fan (1978) reported three zones of hydrothermal alteration: (a) 675 to 1894 m—montmorillonite, (b) 1350 to 1894 m—chlorite, and (c) 1894 to 1962 m—actinolite and calcite. These authors concluded that the present-day thermal regime is related to recent
Fig. 6.13
Temperature profiles measured in the Hawaii Geothermal Project well HGP-A. The inset is a
conceptual cross section of the lower east rift of Kilauea that depicts fluid circulation across
the rift zone. Thermal waters leaving the rift to the southeast (downslope) form a plume overlying
the colder fluids below. Drilling on the downslope side of the rift would initially encounter hot
fluids but at greater depths would enter cool aquifers.
magma injection. The fluids are slightly saline but have high concentrations of silica and sulfide (Kroopnick et al ., 1978). Thomas et al ., (1983) calculated that the flowing well produces 50,000 kg/hr: 50% liquid (mixed seawater and meteoric water) and 50% steam. An electricity generating plant has been producing 3 MWe . Because the possibility of an eruption close to the plant was considered in its design, most of the equipment is on skids and can be removed if necessary.
At the time of this writing (1991), five production wells have been drilled near HGP-A. Most of these wells are located within the northern edge of the rift, in line
with fractures and a spatter rampart formed during the 1955 eruption and on the slopes of Puu Honuaula, a cinder cone believed to be between 1500 and 10,000 years old. These were drilled to depths of over 2000 m and have bottom-hole-temperatures of 312 to 334°C. The reservoir begins at a depth of ~1200 m and extends to a depth of at least 2250 m; it consists of a basaltic dike complex composed of near-vertical dike swarms, each separated from the other by brecciated wall rock (Clark and Stewart, 1991). The reservoir is overlain by ~750 m of submarine basalt flows with low permeability and by 450 m of subaerial basalt flows, which are permeable and contain an unconfined aquifer (Clark and Stewart, 1991).
The dikes and fractures of the east rift act as guides for fluid flow, allowing hot fluids to rise parallel to the dikes. The rift also dams water from upslope; the apparent water table rises to the near-surface on the north-west side and plunges to a depth of 400 m on the southeast side (Jackson and Kauahikaua, 1987; Thomas, 1987). Much of the potential sea water inflow is also blocked by rift dikes. Within the rift, where there is adequate fracture permeability and depth (~2000 m), the hydrothermal plume can be drilled and developed. Beyond the southern edge of the rift, one well penetrated thermal fluids at shallow depths but reentered cold sea water below the outflow plume from the rift, as is shown in Fig. 6.13 (Thomas, 1987).
Exploration and production drilling has taken place only along the east rift of Kilauea Volcano; this area is accessible and is located on private land (except for the research well that is sited in the National Park). The southwest rift zone of Kilauea and all rift zones of Mauna Loa, Mauna Kea, and Hualalai have not yet been drilled. These resources have been examined only at the surface during the Thomas et al . (1979, 1983) evaluation of the geothermal resources of Hawaii.
Three Geothermal Systems in Iceland: Krafla, Surtsey, and Heimaey Volcanoes
Iceland is located over the Mid-Atlantic Ridge, which is an active spreading center. Regions of active extension and volcanism in Iceland are called the neovolcanic zones and cross the island generally from south-west to northeast. Most volcanic activity occurs along the eastern and western volcanic zones, where plate motion currently averages 1.6 cm/year in either direction and lavas and pyroclastic deposits are erupted at a rate of 0.04 km3 /yr. The largest single historic eruption of basaltic lavas (12 km3 ) occurred in 1783 from the 25-km-long Laki fissure (Sigvaldason, 1974). The active state of this island and the extent of its geothermal resources are reflected in the thermal gradients, which vary from ~160°C/km (heat flow = 300 mW/m2 ) in the fissure swarms to 40°C/km (heat flow = 80 mW/m2 ) in the oldest rocks along the island margins (Pálmason, 1973). Fissure swarms in the neovolcanic zones range from 5 to 10 km wide and are 30 to 100 km long. Each zone consists of nested grabens, where near-vertical normal faults are exposed at the surface. Figure 6.14 illustrates the active faulting, volcanism, and geothermal systems that occur along these fissure swarms.
The economy of Iceland is closely linked to geothermal energy. Half of the population lives and works in buildings heated by geothermal waters. Greenhouses, an important component of the island's agricultural effort, are also heated by hot springs and water from geothermal wells. Many hot water wells have been drilled for direct-use applications, especially around the capitol city of Reykjavik. These waters are pumped from reservoirs located in Tertiary-age interbedded flood basalts and hyaloclastite deposits at depths of 1 to 2 km and temperatures of 86 to 128°C. Hot water is conducted horizontally along the basal contacts
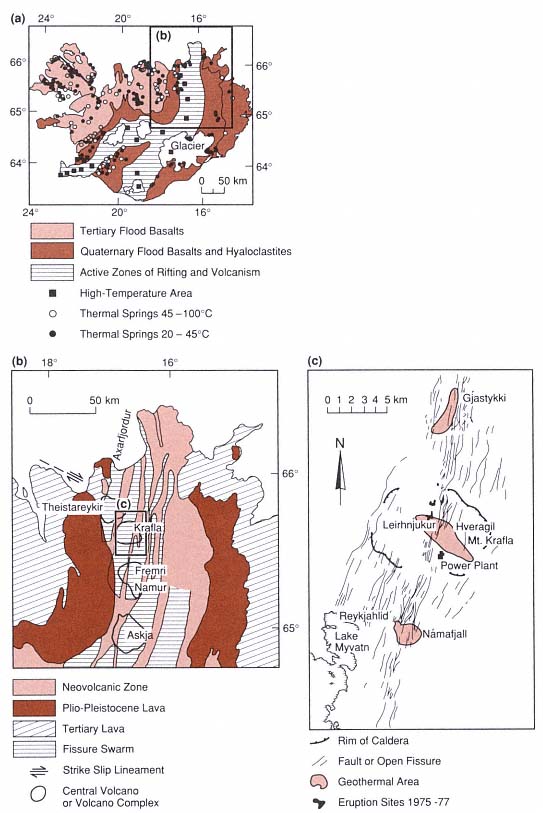
Fig. 6.14
(a) Simplified geologic map of Iceland shows the distribution of
geothermal manifestations and their relation to active volcanic zones.
(Adapted from Fridleifsson, 1979.)
(b) Fissure swarms and central volcanoes of the Northeast volcanic zone of Iceland
(Adapted from Stefánsson, 1981.)
(c) Structural map of Krafla caldera and its active fissure swarms
(Adapted from Stefánsson, 1981.)
of lava flows and vertically along dikes and faults; Bodvarsson (1961) presents hydrologic and chemical evidence that these waters can flow laterally for as far as 50 km.
High-temperature geothermal systems are associated with the young volcanic fields along the active tectonic rifts. Most have temperatures of 200 to 300°C at depths of 1 to 2 km. Bodvarsson (1976) estimated that nearly 400 km2 of Iceland, along the neovolcanic zones, is underlain by high-temperature geothermal systems. The Krafla field, which is representative of these hydrothermal systems, has been developed in and around Krafla caldera in northeastern Iceland, as described in the next section.
Migration of Magma and Dike Formation
Information on the movement, shape, and size of magma bodies below fissure swarms is based on both geophysical measurements during recent eruptions and structural/volcanologic studies of historic eruptions. Magma overpressures result in the beginnings of extension, which in turn lead to magma rise and eruption. Sigvaldason (1987) inferred that during the 1975–1981 Krafla eruptions, magma moved through "holding chambers" at depths of 30, 25, 8, and 4 km. After the eruptions, refilling of these intermediate chambers took ~3 weeks. From the high-level chambers—at depths of 3 to 7 km—repeated lateral magma injections into fissure swarms north and south of the Krafla central volcano initiated a rifting event. [This rifting episode was activated by the subsequent release of tensional stress that accumulated over the plate boundary during the previous 250 years (Tryggvason, 1984)]. The fissure swarm was extended by an 80- to 90-km-long section during this period; the average widening for a fissure during the accumulated 20 discrete events was 5 to 6 m (Tryggvason, 1984). Each extensional event was accompanied by subsidence near the center of the Krafla caldera, which demonstrates the link between the fissure swarms and the high-level chamber below the central volcano.
Tryggvason (1984) determined that the accumulated area of fissure widening during the 1975–1981 Krafla event was ~377,000 m2 . Based on observed ground deformation, he suggested that most of the magma was injected into vertical fissures rather than into sills. Using gravity and elevation measurements, he determined that the volume of magma leaving the reservoir was ~1.75 times that of caldera subsidence. The dike volume (V) is equated with that of magma leaving the reservoir, minus the volume of material erupted. The estimated dike height (h) = ~1.75 V/A, where A = area of horizontal extension by the dike. For the best recorded events at Krafla, calculated dike heights are 2.4 to 2.8 km. The total volume of magma that flowed out of the reservoir into fissure swarms during this episode at Krafla is estimated at 1.08 km3 , of which 1.03 km3 remains in the dikes to become a renewed heat source for the associated geothermal fields. The measured volume of lavas erupted is 0.2 km3 , which is four times greater than the volume predicted. Tryggvason concludes that perhaps the volume estimates of magma leaving the caldera are too low.
Gudmundsson (1986) used his work on the Reykjanes Peninsula of Iceland to develop a method for estimating the volume of magma reservoirs below fissure swarms, as is depicted in Fig. 6.15; his method requires the measurements and assumptions listed here.
· The maximum length for a magma reservoir is taken to be equal to the length of vents in the fissure swarm.
· The width of the reservoir is estimated to be 1.72 times the width of the vents in the fissure swarm; this ratio is based on observations of older dike swarms that are exposed in outcrop.
· A reservoir is taken as an ellipsoid, the volume of which is calculated as V = 4/3 p ah bh ch and the area of which is calculated as A = p ah bh ,
where ah , bh , and ch = the half-width, half-length, and half-thickness, respectively, of the ellipsoid. The half-thickness of the reservoir is calculated by ch = 0.75 V/A, where V = total volume of the magma (both erupted and in dikes).
· The average volume of individual fissure lava flows on the peninsula is 0.11 km3 . Walker (1959) estimated the average volume of a corresponding feeder dike by using the average length of the volcanic fissures (2.2 km), a crustal thickness of 8 km, and an average dike width of 4 m. The estimated volume of a feeder dike here is 0.07 km3 and an average value for ch is 1.5 km (2ch = 3 km). It is likely that only the uppermost 3 km of the reservoir participates in an eruption.
The volume of feeder dikes (~0.07 km3 ) is small, but as a result of intrusions and eruptions every 10 years, the active fissure swarms contain excellent heat sources. Bodvarsson (1976) calculated that in Iceland, heat reaches the surface by conduction (~50%), as erupted magma (~30%), and as thermal waters (~20%).
South of Krafla caldera is Askja-Öskuvatn caldera; Sigurdsson and Sparks' (1978) documentation of the 1874–1875 eruption provides another view of fissuring and dike injection along the fissure swarms. The Askja central volcano straddles a 75-km-long fissure swarm. Magnitude 6 or 7 earthquakes in 1872 marked a new phase of rifting, and by the fall of 1874 the fissure swarm was rifted along a 70-km segment. A graben 1 to 2 km wide was formed, bounded by normal faults with throws of 40 to 60 m south of the central volcano and 10 m north of it. In early January 1975, a major injection of magma into a high-level reservoir was followed by phreatomagmatic eruptions of rhyolitic ash. Caldera inflation was relieved by periodic injections of magma out into the fissure swarms. At the surface, the central fissure is flanked by en echelon spatter ramparts. The Sveinagja lava field covers 30 km2 ; it is
Fig. 6.15
(a) Fractures measured in the western part of the
Thingvellir swarm in Iceland. (b) The width and
throw of three fractures from the Thingvellir
swarm were measured along
the strike of the fissures.
(Adapted from Gudmundsson, 1987.)
located 40 to 70 km north of the Askja-Öskjuvatn caldera and consists of 0.3 km3 of mostly tholeiitic aa and pahoehoe lavas. The estimated volume of intruded magma was 1.5 km3 , which could be accounted for by a single 100-km-long, 5-km-deep, 3-m-wide dike. Fissure widths range from 2.5 to 4 m. In the northern part of the lava field, activity was centralized at an offset in the rift and formed a line of cinder cones.
Brown et al . (1987) used gravity surveys to document the presence of a 20-mGal, north-south-trending anomaly that may correspond with a dense dike swarm below the Öskuvatn-Askja caldera. They also noted that caldera fill is most likely thin and that the caldera's collapse was primarily related to eruptions out along the fissure swarms.
Hydrothermal Reservoirs
Hydrothermal reservoirs in Iceland are usually bounded by lava flow contacts or clay-rich hyaloclastite deposits. Water in aquifers can also pond when dikes act as barriers. By measuring the deuterium content of thermal waters, Arnoson (1976) has shown that the waters are of meteoric origin, although a few systems are charged with seawater. In most cases, water from the highlands percolates into bedrock and flows laterally for distances of as much as 150 km but more usually several tens of km. The water then rises to the surface along dikes or faults. Tables 6.1 and 6.2 summarize potential reservoir rocks and the flow rates through these rocks as sampled by drilling (Friedleiffson, 1975; Tómasson et al ., 1975).
Pillow lavas have a higher effective permeability than any other rock type encountered by drilling in Icelandic geothermal areas (Friedliefsson, 1978/79). Subglacial fissure eruptions produce elongate ridges (mobergs), as shown in Fig. 6.16, that are 1 to 5 km wide, tens of kilometers long, and a few hundred meters thick. The cores of these ridges consist of permeable pillow lavas, but the flanking hyaloclastite deposits can serve as aquitards. Subglacial eruptions are remarkable in that they are able to create both the reservoir and the caprock in one volcano.
Krafla volcano has three high-temperature geothermal fields, which are located
· within the 8- by 10-km Krafla caldera, where the thermal area is outlined by explosion craters, surface manifestations, and altered ground (Fig. 6.17). [Further exploration to define the reservoir included Schlumberger resistivity soundings and analyses of fumarolic gases. In this 35-km2 thermal area, the temperature in a 2-km-deep drillhole reached 345°C (Stefánsson, 1981)];
· 6.2 km south of the caldera along the fissure swarm at Námafjall, where the geothermal area covers 4 km2 ; and
· 5 km north of the caldera, also along the fissure swarm at Gjástykki; surface manifestations encompass an area 1 by 4.5 km parallel to the swarm.
|
||||||||||||||||||
|
|||||||||||||||||||||||||||||||||||||||||||||
Drilling within the low-resistivity zone revealed three main rock units: hyaloclastite deposits, lava flows, and dikes, as shown in Fig. 6.17. Below a depth of 800 m, lava flows are dominant, but from a depth of 400 m to the bottoms of the deepest wells, dikes are more common. The transition depth from zeolite to greenschist facies metamorphism is at ~800 m (Stefánsson, 1981).
In his model of the Krafla field, Stefánsson (1981) identified two hydrothermal zones. The shallowest, extending to 1100-m depth, is water-dominated and has a maximum temperature of 205°C; the basal contact of this zone coincides with the base of a sequence of lava flows. Within the deeper zone—from 1100 to 2200 m (total depth for the deepest well)—the reservoir contains a mixture of
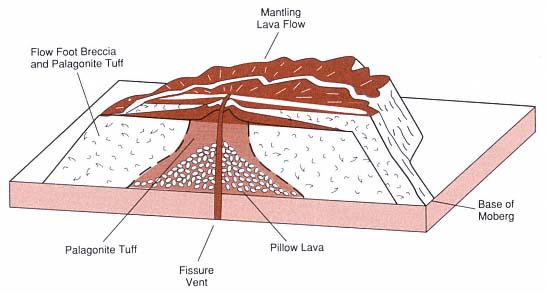
Fig. 6.16
Table mountain, or moberg, formed during eruption of basalt along a fissure under a glacier.
(Adapted from Jones, 1969.)
steam, water, and CO2 . The rocks, consisting of mostly lavas, a granophyre unit, and a dolerite sill, are intruded by multiple dikes. The two reservoirs are connected by a fault and/or a dike. Permeability in the upper zone is 10-11 m2 ; such permeabilities are reflected in the pressure increases and rises in water level during dike injection and eruption (Fig. 6.18). Pressure transients are not observed in the lower zone because the change is absorbed in the two-phase hydrothermal system.
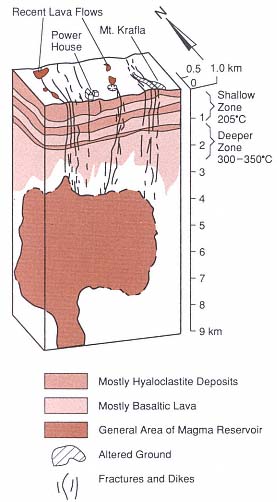
Fig. 6.17
Schematic cross-section of the Krafla geothermal
field and the underlying magma body
(Adapted from Stefánsson, 1981.)
Stefánsson (1981) noted that a severe mistake was made in constructing a power plant before the drilling was completed and the field was tested. As a result, the proposed maximum capacity of 35 MWe was not achieved. An eruption within the caldera also slowed construction work on the facility.
In Iceland, exploration techniques begin with detailed geologic mapping and dating of potential reservoir rocks. Determination of the eruption type is crucial; for example, by locating the vents and mapping facies within rocks erupted from a subglacial volcano, it is possible to evaluate not only the potential heat source, but also the location and extent of reservoir and caprocks. As noted earlier, pillow lavas are excellent reservoir rocks and the associated hyaloclastic carapaces are effective caprocks. All dikes and faults must be mapped for identification (or interpretation) of both thermal sources and potential aquicludes. After potential reservoir rocks have been evaluated at the surface, interpretative cross-sections can be prepared and evaluated by both geologist and hydrologist. An exploration drillhole can then be sited for further evaluation and temperature measurements. The primary targets in Iceland for direct-use purposes are highly permeable rocks that contain fluids with temperatures of > 100°C (Fridleifsson, 1978/79).
Geothermal Potential of Several Small Basaltic Islands
Surtsey
Much of what has been learned during the last 20 years concerning phreatomagmatic volcanism began with the mid-1960s submarine eruptions south of Iceland that eventually formed Surtsey, one of the Westmann Islands (Thorarinsson, 1965; 1966; 1967). The eruption, first noted on November 14, 1963, lasted more than 4 years and ended on June 5, 1967; this eruption formed an island of 2.8 km2 and an elevation of 174 m, which
is shown in Fig. 6.19. The early phases of activity were phreatomagmatic; much of the heat was lost in magma/sea water interactions that generated very energetic steam eruptions. The tephra deposited by these eruptions was barely warm to touch when was deposited as fallout and surges.
In later phases of activity, after a growing tuff ring denied the sea access to the vent, the main activity was lava fountaining, and lava flows that moved across the edges of the cone toward the sea. After activity ceased entirely, Stefánsson et al . (1985) drilled a 181-m-deep borehole on the cone at an elevation of 58 m. The tuff above sea level has a permeability of 1.2 × 10⁻¹⁰ m2 and the system within it is vapor-dominated. Below sea level, the estimated permeability of the basaltic tuffs is 4.1 × 10⁻¹³ m2 , and the tuffs are altered to palagonite (a mixture of smectite clays, zeolites, and iron oxides). No pillow lavas were encountered in this borehole, and the maximum temperature was 140°C at a depth of 104 m. Below this depth, near the contact between the sea floor and the base of the Surtsey cone, temperatures dropped to 40°C within altered tuffs that were cooled by sea water.
During the drilling operation, the borehole crossed a 13-m-thick dike at a depth of 80 m (Stefánsson et al ., 1985; Fig. 6.20). Most likely emplaced during the lava fountaining episodes late in the history of the cone, the dike can account for high heat flow within the cone. Fluids and heat from a tuff ring such as this one could be used for heating water but not for producing electricity; therefore, it is a limited, short-term resource unless the heat source were to be replenished by a new eruption.
Heimaey
Within sight of the new island of Surtsey is the small, populated island of Heimaey, which is an important Icelandic fishing community. On January 23, 1973, a north-north-east-trending fissure, located only 1 km east
Fig. 6.18
Interaction of the Krafla hydrothermal system with rising magma. Changes in the CO2
concentration and pH within wells KG-3 and KG-4 correspond to renewed eruptive activity.
(Adapted from Stefánsson, 1981.)
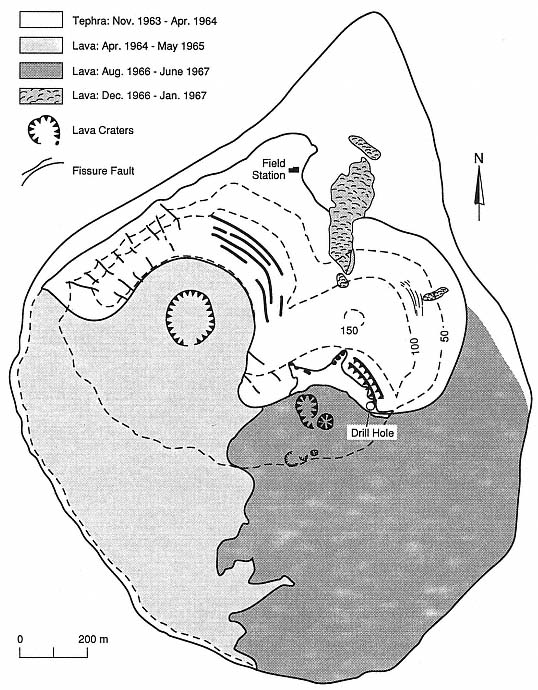
Fig. 6.19
Map of Surtsey volcano indicates the location of the 181-m-deep borehole.
(Adapted from Jakobsson and Moore, 1982.)
of the town center, opened over a length of 1200 m. Lava fountains occurred along the length of the fissure but were soon concentrated at one point (Williams and Moore, 1983). Within 2 days the lava fountaining had covered the island with ash and had constructed a 120-m-high scoria and spatter cone. Over the subsequent 2 weeks, lava fountaining decreased in intensity and a thick lava flow moved toward the edge of town. The 43- to 120-m-thick basaltic lava flow, at temperatures of 1030 to 1055°C, moved into the town and also threatened the harbor entrance.
To save the town and harbor, Icelandic officials were determined to stop the lava flow. Their method was to increase the lava's viscosity by spraying it with cold seawater and to construct a barrier along the flow margin. Seawater was sprayed onto the flow front and distributed across the flow surface at a rate of 1.7 m3 /s, cooling the flow to well below its solidus temperature. Barriers within the flow, which were formed by cooling, caused the flow to thicken. Over a 6-month period, the ~10 × 106 m3 of water sprayed onto the lava flows converted ~6.5 × 10⁶ m3 of molten lava into hot, but solid rock (Jonsson and Matthiasson, 1974; Williams and Moore, 1983).
The eruption ceased June 23, 1973, leaving a lava flow ~1.5 by 1.5 km and ~100 m thick that was overlain by ~5 m of scoria. The residents of Heimaey immediately began to examine ways to take advantage of this heat source. A district heating system was created and after a successful prototype system was tested, construction of a geothermal heating system began. Four 100- by 100-m areas were developed, each consisting of steamwells in the unconsolidated scoria overlying the lava flow and an overlying network of pipes that spray water onto the ground surface. The water seeps into the scoria and the lava flow, is converted to steam, and rises to the steamwell collectors (Fig. 6.21). Each well produces 2.5 MWthermal during normal operations (Björnsson, 1980; Williams and Moore, 1983). By 1982, the entire town was heated by steam from the lava flow.
Réunion Island in the Indian Ocean
The geothermal drilling project on the Island of Réunion in the western Indian Ocean provides an example of where one might not expect to find a hydrothermal system. Piton de la Fournaise, an active basaltic shield volcano on Réunion, was constructed on the southeast flank of an older shield volcano, Piton de Neiges. Fournaise has erupted about every 2 years during the last 250 years (Stieltjes, 1985). Broadly curving faults define a series of large blocks stepping down to the sea (Fig. 6.22); these features were interpreted by Stieltjes (1985) as a caldera and by Duffield et al . (1982) as large gravitational slumps. The faults flank a
Fig. 6.20
Temperature profiles and simplified lithologic
descriptions for the Surtsey borehole. Excess
heat encountered at ~80-m depth is probably
related to a 13-m-thick dike
complex in the core of the cone.
(Adapted from Jakobsson and Moore, 1982.)
Fig. 6.21
Diagram of the emplacement of shallow collectors (steamwells) in scoria deposits overlying a thick
basaltic lava flow from the 1973 eruption of Heimaey, Iceland. Water from surface pipes supplies
the recharge to the solidified, fractured lava flow, where steam is generated and collected in
a steamwell. This geothermal energy source is
successfully operating as a district-heating system.
(Adapted from Björnsson, 1980, and Williams and Moore, 1983.)
broad trough that slopes from the summit elevation of 2600 m to sea level. Kieffer et al . (1977), Duffield et al . (1982), and Stieltjes (1985) propose that the rift zones trend northeast, southeast, and northwest. Historic eruptions have occurred at vents in the summit caldera and along the flanking rifts. The Cratère Bory and Cratère Brûlant form a 1.2- by 0.7-km summit crater complex.
Two geothermal wells have been drilled on Réunion Island. One was sited on the east coast, in the outflow area of Piton de la Fournaise and the other on the older Piton des Neiges volcano. The Fournaise well, drilled on the shield flanks—inexplicably away from the active rifts—reached bottom in a dense gabbro intrusion and was cold. The second well reached rock at temperatures of 200°C but did not produce any fluids.
Geothermal heat sources in basaltic volcanoes rely on frequent but small eruptions. In contrast, along convergent plate boundaries and on the continents, eruptions are less frequent, but heat sources are shallow and large. Chapter 7 discusses the most common volcano type found at these convergent margins—composite cones.
Fig. 6.22
Piton de la Fournaise on Réunion Island in the Indian Ocean.
(a) Map of Piton de La Fournaise volcano Shaded areas indicate rift zones.
(Adapted from Duffield et al., 1982).
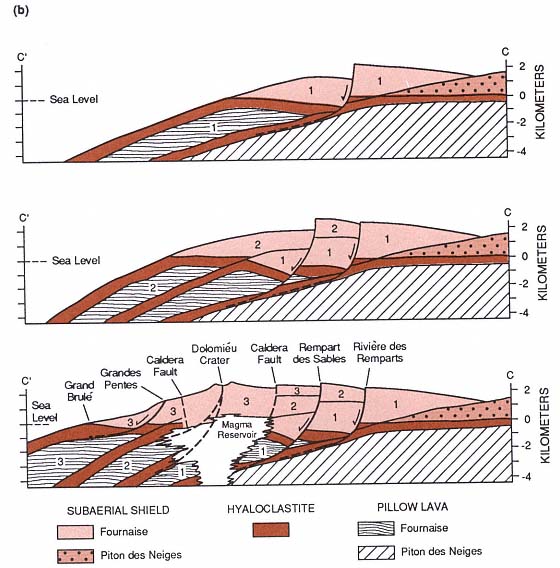
Fig. 6.22
(b) Diagrammatic cross-section C'—C. Features noted 1, 2, 3 refer to major periods of eruptive
activity. Gravity slump blocks from earlier stages are believed to be bounded by formerly active pairs
of northeast and southeast rift zones. A possible future slump block, shown with dashed line,
is located below fracture systems of the presently active rifts.
The position of the magma reservoir is speculative
(Adapted from Duffield et al., 1982).
Chapter 7—
Geothermal Systems in Maturing Composite Cones
The most obvious volcanoes above sea level are the tall composite cones that occur in chains parallel to descending plate margins. Some of the more famous of these volcanoes are Mount Fuji, Mount St. Helens, Krakatau, and Vesuvius. Composite cones are large volcanoes that consist of multiple volcanic landforms such as interlayered pyroclastic rocks, lava flows, domes, and volcanic sediments. Composite cones are also known as stratovolcanoes or stratocones . Hundreds of composite cones overlie the Earth's subduction zones and may mark segmented arcs; they form island arcs and—on land where the crust is thicker—volcanic chains. Magmas are formed in the asthenosphere by the melting of descending plates as well as bits of the mantle and sediments overlying the plate at depths of 80 to 100 km; these magmas then rise buoyantly toward the Earth's surface.
Magmas reach the surface by fracture propagation and subsequent flow through dikes or by diapiric rise of blobs of viscous magma (Marsh, 1978), as is shown in Figs. 7.1 to 7.3. During the early history of a magmatic system, not many of these magma bodies will reach the surface to erupt or even to be emplaced at shallow depths. Magmas lose heat through conduction to adjacent crustal rocks; they become highly viscous and their rise toward the surface is halted. Either multiple periods of dike intrusion or the emplacement of diapiric magma bodies is required to create a zone or chain of heated pathways that enables succeeding magmas to reach the shallow crust (Fig. 7.1). Such a heating process allows larger, more viscous, slower moving magmas to aggregate and form bodies that reach the surface and erupt. However, shallower magma bodies associated with eruptions are ultimately the heat sources for geothermal systems.
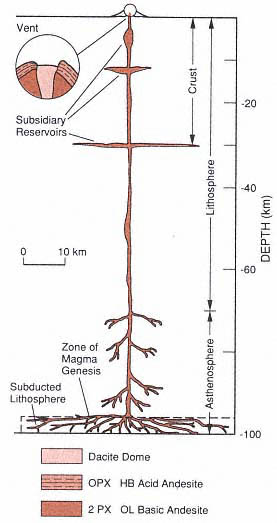
Fig. 7.1
Schematic cross-section for the system of
magma reservoirs below a medium-size composite
cone that is 8 km in diameter and has a volume
of 25 km3 . This cross-section is drawn to scale
except for the reservoir volumes, which are
exaggerated. The 70-km-thick lithosphere is
based on examples from the Aleutian Islands.
This model assumes 25% fusion followed by
80% extraction from a zone of magma genesis
with a volume of 250 km3 . OPX = orthopyroxene;
HB = hornblende; PX = pyroxene;
and OL = olivine.
(Adapted from Gill, 1981.)
Composite cones in volcanic arcs usually evolve with time. The volcanoes grow from individual simple cones into multiple cones, domes, and craters. Magmas become more silicic and explosive, and the volume of individual eruption sequences increases significantly. Networks of dikes, sills, and plutons are more pervasive and provide the structural framework that props up cones and shallow thermal sources. Surface manifestations above these intrusions become more evident, including fumaroles, the acid alteration of rocks in or near the summit crater, and hot springs located along the lower flanks of the cone. The recharge of meteoric water within a cone is important, not only because it contributes to the development of a hydrothermal system, but also because it can mask the thermal anomaly by an outward, rapid, near-surface movement of cold water.
This chapter discusses examples of composite cones and their activity and defines the surface indicators that can serve as guides to the geothermal systems within or below these volcanoes.
Distributions, Volumes, and Compositions
Distribution of Composite Cones in Volcanic Arcs
Volcanic arcs may break into segments, each of which is parallel to the arc trend and contains between two and a dozen volcanic centers (Stoiber and Carr, 1973; Marsh, 1979a; Carr et al ., 1982). Arc segments have been identified by mapping offsets in lines of volcanoes, contrasting volcano shapes and eruption styles, clusters of small basaltic volcanoes located behind the volcanic front near breaks, transverse fault zones, and clusters of large, shallow earthquakes at the segment boundaries (Carr et al ., 1982). Segmentation has been well-documented in Central America (Carr et al ., 1982), the Aleutians
Fig. 7.2
Simplified two-dimensional diagram of a magma supply vs percolation rate model of lithospheric
magmatism. Axes are schematic and depict only the relative magnitudes of supply and the
modification of primitive magma in the systems shown. Asterisks indicate systems thought to be
characterized by the rapid transient injection of basalt at restricted crustal levels, which results in the
generation of rhyolite but little intermediate magma. In contrast, most continental and orogenic systems
may involve a diffuse injection throughout much of the lithosphere as well as subsequent mixing and
crustal mobilization, which in turn produce chiefly magmas of intermediate composition.
The degree of potential magma modification increases with increasing crustal thickness,
compositional contrast, and magma residence time.
(Adapted from Hildreth, 1981.)
(Marsh, 1979b), and the Mariana-Volcano Islands (Meijer, 1982).
Figure 7.4 shows a volcanic arc in Central America where zones interpreted as segments range in length from 55 to 260 km. Table 7.1 presents a comparison of segment length and volume for Central American volcanic arc segments. Stoiber and Carr (1973) reported that the volume of erupted lavas and pyroclastic rocks per kilometer increases with increasing segment length, from 1 km3 /km for the shortest (55 km) to 5.2 km3 /km for the longest (260 km). It has been proposed that arc segments reflect breaks and uneven surfaces within the descending plates (Carr et al ., 1982; Marsh, 1979a, b). Segment boundaries commonly
Fig. 7.3
Schematic cross-sections that depict two possible stages in the development of igneous systems in which tectonic
extension is subordinate and shallow. This model applies to (a) early and (b) intermediate stages of island arcs,
continental margin arcs, and mid-continental igneous systems.
Nearly all the heat for this system is supplied by basalt injection.
(Adapted from Hildreth, 1981.)
coincide with grabens that are oriented perpendicular to the plate boundary. Burkhart and Self (1985) interpreted these grabens as expressions of tectonic extension—rather than segmentation—of the plate.
The distance between composite cones located within adjacent arc segments is fairly uniform, and the volume of material erupted from each center is approximately proportional to that distance (Marsh, 1979a, b). For the Aleutian Island arc, this spacing is ~70 km (Marsh and Carmichael, 1974). Meijer (1982) noted that along the Mariana volcanic chain of the western Pacific, the spacing between volcanic centers ranges from 20 to ~80 km; this spacing is correlative with volcano size: the small volcanoes are the most closely spaced. Within segmented arcs, small, usually monogenetic cones may form at a distance of ~50 km behind and parallel to the volcanic front. These less voluminous cone clusters may develop 3 to 4 m.y. after the beginnings of arc volcanism (Marsh, 1979a).
Volcanic Eruption Rates and Relative Volumes for Magma Types in Composite Cones of Volcanic Arcs
Volcanic arcs and their composite cones contain a full spectrum of magma compositions—from basalt to rhyolite. Temporal variations in these compositions provide clues about the depth and size of the intrusive rocks that were their thermal sources. Compositional variations are affected by the rate of plate movement, the angle of plate descent, irregularities in the descending plate, crustal thickness, and the depth and residence time of the magma reservoirs.
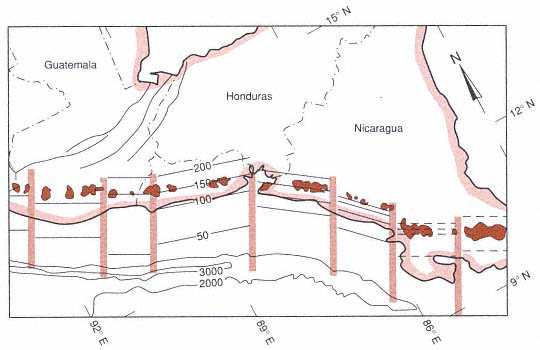
Fig. 7.4
The segmented volcanic front of Central America, in which active volcanic fields are shown as
shaded areas. Stippled vertical bars mark the transverse breaks in the arc. The thin, parallel lines
mark depths to the inclined seismic zones (contour interval is 50 km); offshore 1000-m
contours are depths below sea level.
(Adapted from Carr et al ., 1982.)
|
||||||||||||||||||||||||||||||||||||||||
Another factor affecting the longevity of thermal sources is the extrusion rate for individual volcanoes and volcanic chains. This factor is difficult to evaluate because of the buried eruption sequences, erosion, and widespread distribution of pyroclastic products, but a number of studies have provided enough data to allow general estimates. Nakamura (1974) and Crisp (1984) reviewed data for volcanic output on a global scale and found that subduction-zone-related volcanoes produce from 0.4 to 0.75 × 10⁶ km3 /m.y. Working with individual arcs, McBirney et al . (1974) and Sugimura and Uyeda (1973) concluded that the volume of material erupted for the Cascade Range and Japan, respectively, was ~5 km3 /m.y./km of arc. These general estimates were confirmed in a more detailed work by Sherrod and Smith (1990), who found that the extrusion rates in arc segments of the Quaternary Cascades volcanic arc range from 0.21 to 6 km3 /m.y./km of arc. Variations in the volume of material erupted from volcanoes of the Lesser Antilles and Central America may be related to both crustal thickness and rates of plate convergence; over the last 100,000 years, production rates have been 3.1 km3 /m.y./km of arc in Central America and 4 km3 /m.y./km of arc in the Lesser Antilles (Wadge, 1984). This relationship between convergence rate, crustal thickness, and magma types is shown in Table 7.2.
If an intermediate or silicic magma body—either small or large—is to rise buoyantly to crustal depths, it must be heated from below by basaltic magmas from the asthenosphere. Without this thermal boost, silicic magma chambers cool and solidify; they may never reach the upper crust (Lachenbruch et al ., 1976; Eichelberger, 1978). Fractionation and mixing of basaltic and silicic melts can produce the spectrum of magma types seen in composite cones. These compositional variations are controlled by the rate of magma supply, crustal thickness, rate of magma percolation through the crust, and extrusion to intrusion ratio (Figs. 7.2 and 7.3; Hildreth, 1981).
To calculate the number of shallow crustal magma bodies that might provide heat to geothermal systems, it is necessary to determine the relative volumes of magma types and their ages for each composite volcano and, if possible, for an entire arc. Central Cascade Range volcanism in North America began in the earliest Pleistocene with the eruption of widespread basaltic cones and flows and the construction of overlapping shield volcanoes (McBirney and White, 1982). Activity became more localized at centers from which more andesitic lavas and tephra were erupted. This activity formed the base upon which the large composite cones were constructed during the past million years. The volume measurements of
|
||||||||||||||||||||||||||||||||||||||||||||||||||||||||||||||||||
McBirney et al . (1974) indicated that most of the province consists of basaltic scoria cones and lava flows and that andesitic composite cones make up only 15% of the erupted material. Studies of Mount Jefferson indicate that the early basaltic activity produced >100 km3 , but that the cone-building stages involved only 25 km3 of andesitic magma (Fig. 7.5).
Clark (1983) found that the Three Sisters volcanic complex of the southern Cascade Range was erupted onto a broad base of basaltic lavas (57 km3 ), which included a much larger relative volume of andesite (30 km3 ) and rhyodacite-rhyolite (3.5 km3 ). Rhyodacitic domes erupted during the past 2300 years from aligned vents that cross the summit regions of the complex. These eruptions may have tapped only a small volume of a compositionally zoned, shallow magma chamber of much greater volume (Scott (1987).
By plotting volumes of erupted material vs SiO2 compositions for the Quaternary volcanic rocks of Japan, Aramaki and Ui (1982) demonstrated that changes along the arc may be related to both plate movement and crustal thickness. Arc segments that consist of composite cones, domes, and calderas are mostly andesite-dacite-rhyolite—all of which are indicative of shallow crustal magma bodies. Most of the rhyolitic materials are associated with large calderas. The basaltic segments are made up of pre-dominantly simple cones and lava flows (Fig. 7.6).
Fig. 7.5
Relative volumes of rock types associated with
Quaternary composite cones in the Cascade
Range of North America. (a) Mount Jefferson was
constructed during four main periods of activity;
rock volumes vs SiO2 content for each stage are
shown in the graph. (b) Three Sisters complex,
which is characterized by more siliceous rocks
than Mount Jefferson. Of the two, the Three
Sisters complex has more potential as a
geothermal resource.
(Adapted from McBirney and White, 1982.)
Inferred Intrusive Volumes and Their Depths below Composite Cones
Using a model originally developed for evaluating large-volume eruptions of silicic magmas and subsequent caldera collapse, Smith and Shaw (1975) determined that the volume ratio of magma chambers to erupted material is ~10:1. This conclusion was based on models of magma transport into the Earth's crust, exhumed intrusive-volcanic complexes, petrologic indicators, and geo-physical studies of active igneous systems. The authors later applied this model to the evaluation of all the high-grade geothermal systems in the U.S. Shaw (1985) took this model even further when he calculated volume-periodicity relations for explosive eruption activity in a variety of volcanoes—from composite cones located along plate boundaries to large mid-continental calderas. Most of the magma chambers below andesitic-dacitic cones examined in this study are located within the upper 4 km, and several are within 2 km of the crust.
Crisp (1984) and Wadge (1984) approximated intrusive-to-extrusive ratios for all volcano types, including composite cones and the associated domes and calderas along subduction zones (Table 7.3).
Eruption Phenomena and Deposits at Composite Cones
A composite cone consists of a stack of overlapping volcanic landforms deposited during a wide variety of eruptions that range from mild steam explosions to large Plinian eruptions accompanied by caldera collapse. The type of activity that produces any particular volcanic landform depends upon many factors, such as magma composition, volatile content, volume, and depth to underlying magma bodies, as well as the size and gravitational stability of the cone and its access to ground or surface water.
Composite cones usually evolve through time, as is displayed in Fig. 7.7; each successive eruption involves increased silica content in the magmas, shallower crustal magma bodies, and more energy. This process may last over several hundred thousand years but certainly less than a million years. Thus, many of the Earth's active composite cones are less than 200,000 years old. Mount Shasta in California, with a summit elevation of 3050 m, was constructed by four cone-building episodes during the last 250,000 years (Christiansen, 1985). The evolutionary model described in this section applies to most—but not all—composite cones; volcanoes are far too individual to allow absolute predictions of activity and products. For more detailed views of eruption processes, refer to Williams and McBirney (1979), Fisher and Schmincke (1984), and Heiken and Wohletz (1985).
Immature Stage
Lava Fountaining
Low-viscosity basaltic magmas erupt as lava fountains and basaltic lava flows. The fountains range from a few meters to >600 m in height (Fig. 7.8). They deposit welded spatter (bombs and ash) in either a circular or oval apron around a central vent or as ridges parallel to a fissure. The spray of low-viscosity (<103 -poise) basaltic liquid is driven by expansion of magmatic gases. Basaltic glass pyroclasts from lava fountains range from vesicular bombs a meter or more across to spheres of a few micrometers. The coarser pyroclasts are deposited within a few hundred meters of the vent; finer ash, including filamentous Pele's hair, is swept downwind and deposited as ashfall.
The structures associated with lava fountains are <100-m-high spatter ramparts and scoria cones composed of mixed welded spatter and basaltic ash. Pahoehoe and aa basaltic lava flows overflow from cinder cones and spatter ramparts or from fissures outside
Fig. 7.6
Volume and weight percent of SiO2 from
Quaternary Japanese volcanic rocks. Patterned
portions represent lavas and pyroclastic rocks of
composite cones, lava domes, and pyroclastic
cones. Open portions indicate pyroclastic rocks
associated with large calderas.
(Adapted from Aramaki and Ui, 1982.)
|
||||||||||||||||||||
Fig. 7.7
The evolution and geothermal potential of composite cones.
these structures, as can be seen at Kilauea (Fig. 7.9). These structures are often over-whelmed by lava flows, buried by small lava shields, or cut by pit craters. The volume of the lava flows in these eruptions greatly exceeds that of the pyroclastic rocks.
At this early stage of composite cone development, there are only simple, monogenetic cones composed of basaltic lavas. These may occur singly or in chains along prevolcanic fracture or fault systems. Of course, there are exceptions to this simple categorization; for example, Fedotov (1987) reported that 4750-m-high Kliuchevskoi Volcano in the Kurile-Kamchatka arc of the USSR is a basaltic cone with an annual magma output of 60 × 106 m3 .
Strombolian Eruptions
Explosive bursts of solidified and partly solidified bombs, blocks, and ash are termed Strombolian , from activity at Stromboli Volcano, which is located along the chain of volcanoes that make up Italy's Aeolian Islands. Well-documented Strombolian eruptions consist of "weak to violent ejection[s] of partly-fluid blobs" (MacDonald, 1972;
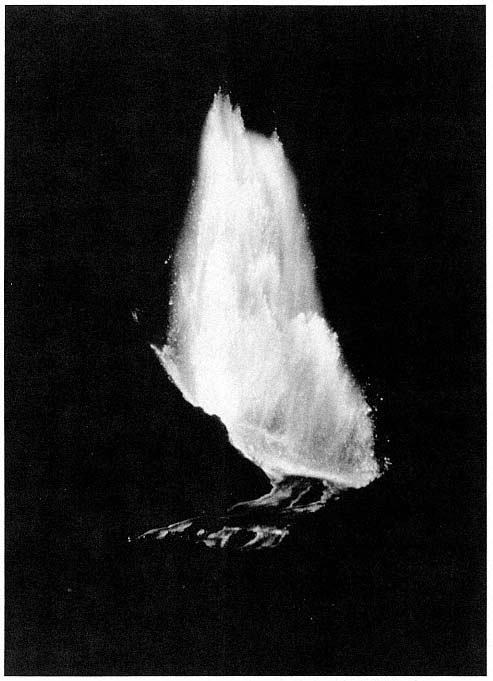
Fig. 7.8
This 300-m-high lava fountain occurred during the 1959–1960 eruption of Kilauea lki
in Hawaii. High flux, accompanied by a rapid release of magmatic gases, caused the
low-viscosity basaltic lava to fountain. This spray consisted of gases and droplets and
clots of lava. Similar lava fountains can occur during the early history of a composite cone.
(Photograph by the U.S. Geological Survey; Richter et al ., 1970.)
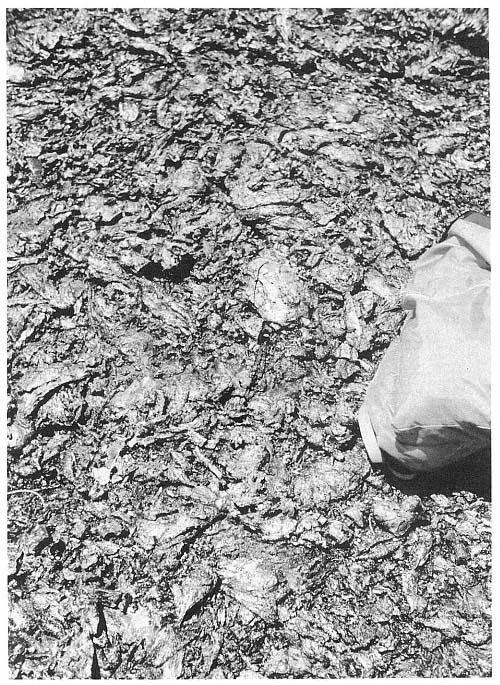
Fig. 7.9
Spatter rampart adjacent to a fissure vent at Kilauea Volcano in Hawaii. Partly molten bombs,
ranging from a few centimeters to several meters in diameter, fall out within a few tens or
hundreds of meters of the vent and form a resistant ridge or ring of welded scoria.
Self et al ., 1974; McGetchin et al ., 1974). Most of the pyroclasts fall ballistically around the vent and build up a scoria cone (Fig. 7.10); finer grained tephra is deposited on the cone and some is carried downwind. Fallout beds accumulate until they exceed their angle of repose, after which avalanches cascade down the flanks and into the crater (McGetchin et al ., 1974). Of the tephra erupted, ~50% is deposited in the cinder cone and 50% is deposited in fallout layers downwind from the cone (Heiken, 1978a).
Activity at scoria cones can rapidly alternate between lava fountaining, Strombolian bursts, and Vulcanian eruptions (discussed in the section on the submature stage of cone growth). Interbedded with the loose scoria fall and avalanche beds of many scoria cones are layers of welded scoria and finer grained phreatomagmatic tephra (for example, at Stromboli).
Pyroclasts in Strombolian deposits range from irregular, smooth-skinned, vesicular sideromelane droplets (basaltic glass) to blocky, crystalline, poorly vesicular tachylite pyroclasts. This spectrum of textural types is found in all size categories—from large bombs to scoria to fine ash.
Magma compositions represented in scoria cones vary from basaltic to basaltic andesite. Lava flows associated with Strombolian activity may be caused by overflows from crater lava lakes or eruptions from the cone flanks, which can even carry away part of the cone. Pahohoe, aa, and block lavas are all associated with scoria cones.
Submature Stage
This stage of growth includes the development of individual vents along lineaments. Magmas are mostly of intermediate compositions that comprise basaltic andesites,
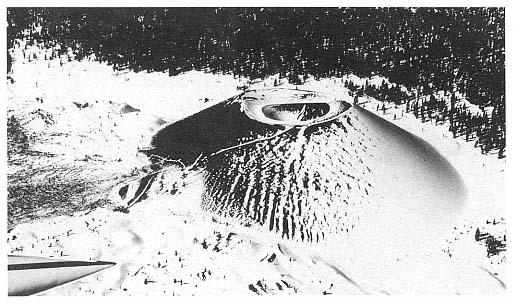
Fig. 7.10
Cinder Cone at Lassen National Park in California. This scoria cone is typical of cones that are
peripheral to the more silicic volcanoes of the Lassen area. Built during several periods of
eruptive activity during the last 400 years, this cone was last active in 1851 A.D. Cinder Cone
consists of outwardly dipping layers of several types of scoriaceous bombs and ash
that were deposited ballistically and by slumping of oversteepened slopes.
andesitic basalts, and andesites. As the volcano grows in elevation, it may affect local weather patterns; heavier precipitation occurring near the summit may saturate rocks or form snowfields and glaciers. With the presence of increased surface and groundwater on the volcano, the potential for hydrothermal activity and phreatic eruptions will also increase. The factors responsible for the trend toward Vulcanian activity are increasingly viscous magma and increasing amounts of groundwater.
Vulcanian Eruptions
A Vulcanian eruption is characterized by the moderate to violent ejection of solid or very viscous lava fragments in short, cannon-like bursts. Ash, fine ash, and gases are emitted and ascend to form a cauliflower-like eruption cloud. The eruption mechanism is not clear, but it appears to consist of alternating magmatic and phreatomagmatic processes. Occasionally, eruptions will shift back and forth between Vulcanian and Strombolian activity. They can produce eruption clouds that rise several kilometers above the vent as well as small pyroclastic flows and surges that flow down the cone flanks. These pyroclastic flow deposits may grade into laharic breccias on the lower flanks of the volcano—possibly as a result of condensation of the steam-particulate mixture. Vulcanian eruptions form scoria cones, craters in composite cones, and lava domes.
Vulcanian deposits consist of large blocks and bombs in a matrix of juvenile and non-juvenile ash. Heiken and Wohletz (1985) determined that the juvenile components may be vesicular (mostly magmatic) or blocky and nonvesicular (mostly phreatomagmatic). Nonjuvenile components are interpreted as fragments of a lava plug in the conduit, bits of dome lava, or fragments from the conduit and crater walls.
Nairn and Self (1978) reported that at Ngauruhoe volcano in New Zealand, cannon-like explosions and subsequent pyroclastic falls and flows resulted when a lava plug was pulverized in the conduit by a combination of magma degassing and vaporization of groundwater.
Volcanic Mudflows (Lahars)
A volcanic mudflow is a mixture of juvenile and nonjuvenile pyroclasts, lithic clasts picked up on the volcano surface, and a silt or mud matrix. Lithic blocks can range from pebble size to slabs that are tens of meters in diameter. Within the fine-grained matrix may be vesicles formed by trapped air or steam. Fisher and Schmincke (1984) and Crandell (1971) provide excellent detailed descriptions of volcanic mudflows.
Volcanic debris flows are nearly always associated with composite cones in submature or mature stages of growth. These flows can be initiated in several ways: (1) condensation of water vapor in cooling pyroclastic flows or surges (Wohletz, 1986), (2) phreatic eruptions of muddy tephra, (3) expulsion of water from crater lakes, and/or (4) snow and ice melt following emplacement of small pyroclastic flows. Lahar is a commonly used Indonesian term for a coarse, poorly sorted volcanic debris flow (van Bemmelen, 1949). Lahar deposits may coat the flanks of a cone, but they are generally confined to the canyons and valleys of the watershed. They may travel for distances of > 100 km if the volume is great enough and the stream gradient steep enough. Where there is a change of gradient—for example at the head of a plain below the volcano—lahars spread out to form fan-like sheets. Because they are generally confined to drainages, volcanic mudflows are interbedded with reworked pyroclastic deposits and eroded lava flows. Surfaces of debris flow breccias of any type can be smooth, but they can also be hummocky when they contain >1-m diameter blocks that have been carried along with the flow, as shown in Fig. 7.11. In most field situations it is difficult to distinguish between laharic deposits and debris avalanche deposits from volcanoes.
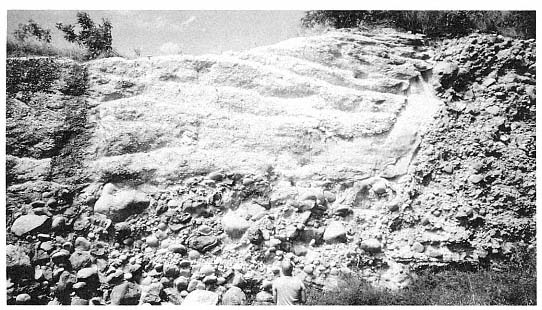
Fig. 7.11
A laharic breccia and a small, valley-filling ignimbrite exposed along the east coast of the
island of St. Lucia in the West Indies. Most of the outcrop consists of a matrix-supported
boulder-rich breccia deposited by a volcanic mudflow (lahar). The steep-walled, flat-floored
ravine cut into the breccia has been filled by a massive ignimbrite (the Qualibou Tuff).
Laharic breccias are massive and consist of boulders in a fine-grained, muddy matrix. Most are reversely graded, but some are normally graded; this feature depends on the bulk density of the fluid as well as the velocity and strength of the mudflow. All such breccias are very poorly sorted and thick-bedded deposits. Trees, shrubs, and grass, frequently ripped up by the mudflows in the upper reaches of a drainage, are carried along with the flow. The plants may or may not be charred, depending upon the volume of hot juvenile pyroclasts in the deposit; if the plants are charred, it might be possible to use carbon-dating techniques on the mudflow.
Mature Stage
At this stage of composite cone development, several new factors are evident.
· Magmas are more silicic, more volatile-rich, and thus more explosive.
· Magma bodies are more viscous, are larger, and are emplaced at shallow depths.
· Shallow hydrothermal systems have developed and there is acid alteration of the cone's core.
· The emplacement of shallow magma bodies and subsequent surface deformation, the great height of the cone, and hydrothermal alteration of interior portions of the cone cause instabilities that may lead to sector collapse. (a sector is a cone section that may fail structurally from summit to base.)
In the mature stages of composite cone development, the balance of construction and destruction is similar to the processes
exhibited during the eruption of Mount St. Helens in Washington: sector collapse, explosive eruptions, and subsequent slow dome growth, which may eventually fill the crater formed by collapse.
Plinian and Peléean Eruptions
Plinian and Peléean eruptions are associated with volatile-rich rhyolitic or dacitic magmas. The eruptions range in magnitude from pumice falls of <0.1 km3 to tens of cubic kilometers. These eruptions produce not only widespread pumice and ash falls but also extensive pyroclastic flows. Most of these eruptions are considered magmatic and are driven by the release of magmatic gases; however, many are also phreatomagmatic. (The best examples of the latter are associated with calderas in Italy and New Zealand.)
Plinian pumice fall and ashfall deposits systematically decrease in thickness with distance from the vent. Elliptical fallout patterns are possible unless there is no wind during the eruption—in which case the pattern is circular. Fallout plane-parallel beds drape the topography and are normally or reversely graded, depending upon the eruption energy, the winds, or both. Figure 7.12 shows a pumice fallout deposit at Tecuamburro Volcano in Guatemala. For a detailed description of all types of ashfall deposits, see Fisher and Schmincke (1984).
Fallout tephra is moderately to well sorted; its median grain size decreases downwind from the vent. Such a deposit is mostly composed of angular, vesicular pumice pyroclasts. The volume of vesicles and phenocrysts and the vesicles' shapes vary greatly between eruptions and even during a single eruption. A characterization of the vesicles and an analysis of phenocrysts can be used to interpret details of magma movement and eruption phenomena (Fisher and Schmincke, 1984; Heiken and Wohletz, 1985).
Pyroclastic flow and surge deposits from Plinian eruptions can be either small-volume deposits—limited mostly to drainages on the volcano slopes—or large volumes—tens of cubic kilometers or more—that form aprons radial to calderas. (Chapter 2 provides detailed descriptions of facies within pyroclastic flow deposits.)
Silicic Lava Domes and Flows
Rhyolitic, rhyodacitic, and dacitic lavas are erupted slowly and form bulbous, steep-sided domes and lava flows close to the vent area (Fink, 1987). Rose (1987) reports that Santiaguito in Guatemala has been erupting dacitic lava flows continuously for >60 years. The flow surfaces are marked by highly fractured, contorted lobes; however, within the flows, the lavas are flow banded, pumiceous and nonpumiceous, and glassy to crystalline (Fink and Manley, 1987). These domes are associated with craters but can also erupt from fissures.
Silicic domes make up an integral part of many composite cones, especially during the mature stages of cone growth. At the Three Sisters volcano in Oregon, for instance, silicic domes and flows and associated pyroclastic rocks erupted from 20 vents and have formed a 10-km-long chain across the summit of South Sister (Scott, 1987).
Domes within the summit craters of composite cones may be purely surficial, spreading out laterally from a rhyolite dike, or may be part of a plug that fills a large conduit to a depth of a kilometer or more. Volcán Santa Maria in Guatemala was cut in half during an explosive eruption in 1902. Twenty years later, a dome began to grow in the crater and has erupted 1 km3 of dacitic lava in 22 distinct flow lobes to date (Rose, 1987). This activity has not restored the ~5 km3 of material lost in the 1902 eruption, but the volcano continues to grow and maintains the cycle of destruction and construction characteristic of composite cones (Fig. 7.13).
The process of destruction was clearly demonstrated by collapse of the northern flank of Mount St. Helens during the eruption
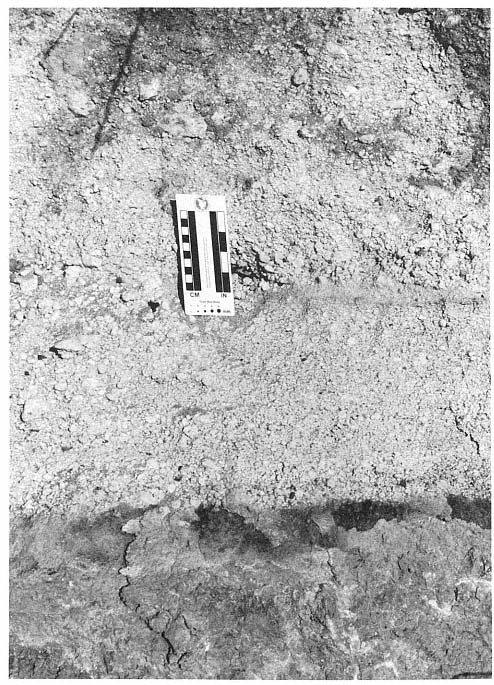
Fig. 7.12
This pumice fallout deposit is overlain by a massive ignimbrite from the same eruption.
An unnamed pyroxene pumice deposit in the Tecuamburro Volcano area of southeastern
Guatemala at this location consists of both a 10-cm-thick pumice fallout deposit, which
drapes underlying topography, and massive ignimbrites, which are thick within valleys
and canyons and thin or absent on ridges and hills.
of 1980. The collapse removed 2.3 km3 of rock as a rockslide and avalanche from the summit and core and left a large open amphitheater-like crater (Voight et al ., 1981). This space is now partly filled by a dacitic dome that continues to grow. This process is slowed only by intermittent periods of destruction or partial destruction by magmatic and phreatic explosions. In the three-year period after the crater was formed, 0.04 km3 of dacitic lava was erupted. Swanson et al. (1987) estimated that if the new magma is erupted slowly and continuously, ~0.01 km3 of dacite will be added each year to the dome (Fig. 7.14).
Kienle and Forbes (1976) noted that during the initial 1976 explosive activity at Augustine Volcano in Alaska, ash falls and pyroclastic flows swept the slopes, removing ~0.1 km3 of dome material. The cylindrical crater was refilled within a few hours by fresh dacitic lava.
Fumarolic Activity and Acid Alteration
Mature composite cones with summits high above the surrounding terrain are the sites for increased precipitation and infiltration of meteoric waters that feed vapor-dominated hydrothermal systems (Healy, 1976). Usually, fumaroles located near the summit form zones of acid alteration in the crater or along faults that cut the crater. Hot springs commonly issue from fractures, faults, or permeable beds near the base of the volcano. This type of hydrothermal system implies the presence of shallow young magma bodies within or below the base of the composite cone.
Explosive Phreatic Activity
If a hydrothermal system is perturbed by the injection of new magma at depth, the result may be explosive steam eruptions without the eruption of juvenile tephra. This type of activity is possible at many types of volcanoes and even in geothermal areas where there is no volcanic activity; however, it is
Fig. 7.13
Cross-sections of composite cones that
contain sector collapse craters.
(Adapted from Siebert, 1984).
most common in mature composite cones. Phreatic eruptions may occur without subsequent activity (such as at Soufrière de Guadeloupe in 1976–1977), or they may be precursors of a significant magmatic eruption (as at Mount St. Helens in 1980). Phreatic eruptions consist of intermittent or continuous explosive steam bursts and can form large craters.
The phreatic ashfalls observed at Soufrière de Guadeloupe are thin, fine-grained deposits with large blocks near the vent as well as small volcanic mudflow deposits composed of hydrothermally altered or weathered lithic clasts and mud (Wohletz and Crowe, 1978; Heiken and Wohletz, 1985). Intermittent explosive phreatic
activity is an important indicator of geothermal potential and is described in greater detail in Chapters 2 and 3.
Models of Composite Cones
To find and develop a hydrothermal system associated with a composite cone, it is necessary to understand the cone's structural framework, intrusive "plumbing," and thermal state. This information must be inferred from clues at the surface such as surface manifestations of hydrothermal activity, the age and composition of the volcano, and its fractures, faults, and hydrology (Sibbett, 1988). The ability to relate surface features to interior structure and thermal state depends on models that have been developed from geophysical models or through the examination of eroded composite cones. A variety of these models are discussed here; each is based on a different approach or tectonic setting.
Models Based on Mapping and Mining of Porphyry Copper Deposits in Deeply Eroded Composite Cones
Branch (1976) studied many composite cones in Papua New Guinea to determine if they contained volcanogenic ore bodies. Branch published a model of composite cones (shown in Fig. 7.15) that was based on his field observations of basaltic to andesitic volcanoes in various evolutionary stages. The composite cones developed over an island arc subduction zone in a region with a relatively thin crust. They were composed of interbedded lava flows, laharic breccias, and other pyroclastic deposits. Eruptive cycles were as short as 1 year or as long as 10,000 years; during the latest growth stages, the cones were permeated with shallow magma chambers, sills, and dikes. Hydrothermal systems developed during later stages extend into the core of the cone and through underlying basement
Fig. 7.14
North-south cross sections of Mount St. Helens in Washington illustrate changes resulting from
the sector collapse and eruption of May 18, 1980, and subsequent dome growth. (a) A pre-eruption
cross section shows: (1) the older volcanic center, consisting of nested dacite domes, pyroclastic
flows, and mudflow breccias, which is cut by dikes; (2) andesitic and basaltic lava flows interbedded
with volcanic breccias and scoria; and (3) several dacitic domes: the summit dome, erupted 370 years
BP and the north slope dome erupted between 180 and 138 years ago). (b) A posteruption cross
section through the crater caused by sector collapse and the avalanche that preceded the most
explosive phase of the eruption. Present-day development of the growing dacite dome within the
crater is indicated. (Adapted from Voight et al ., 1981.)
rocks to form 1- to 2-km-diameter aureoles of hydro-thermal alteration around intrusions. Surface indicators of the hydrothermal system include andesitic, dacitic, or rhyolitic vents; fumaroles and sulfur deposits at the summit; collapse craters; hydrothermal explosion breccias; and a long cone history (>100,000 years).
Sillitoe's (1973) general model for composite cones and associated intrusive rocks was based on his observations of copper-porphyry deposits in the Andes of Chile and northern Argentina—a region where volcanoes overlie thick crust. The hydrothermal systems responsible for deposition of the porphyry copper deposits were established late in the history of the composite cones; subsequently, only dacitic or rhyolitic magmas were intruded and erupted. Observations of these systems at various levels exposed by erosion (or in mine shafts) indicate that large granodiorite plutons are present at shallow depths (~4 km below the summits) during late-stage activity (Fig. 7.16). The chief distinction between these volcanoes and those in island arcs is the difference in crustal thicknesses beneath them; processes within the thick crust of the Andean altiplano ultimately produce large silicic magma bodies that are emplaced at shallow depths.
Giggenbach (1989) developed a similar model for an Andean composite cone, the young, active volcano of Nevado del Ruiz in Colombia. His model was based upon the analysis of gases and waters from Ruiz' fumaroles and hot springs. According to Giggenbach's interpretation, there is a broad mass of crystallizing, degassing magma and rock from ~3 km to >15 km below the summit (the volcano's elevation is 5389 m). Intrusions below Ruiz may be surrounded by aureoles of vapor, a mixture of brine and vapor, and brine. The vapor and vapor-plus-brine aureoles are of the same shape and
Fig. 7.15
Simplified cross section through a "nearly extinct" mature composite cone. This model was developed
by Branch (1976), who studied many composite cones in Papua New Guinea to determine their
potential for volcanogenic ore bodies. The model is based upon studies of
volcanoes in various evolutionary stages.
areal extent as the zone of hydrothermal alteration within a mature andean composite cone, which was proposed by Sillitoe (1973). The model for Nevado del Ruiz has not yet been tested by drilling.
Well-Mapped Examples of Eroded Composite Cones
Composite cones formed during Tertiary time usually have been deeply eroded and their interior structures are exposed. However, these cones are still sufficiently preserved to allow interpretation of the relationship between rock types and the structural framework. The cones we discuss here were chosen because their carefully executed three-dimensional maps with cross sections provide excellent examples of older composite cones.
Broken Top Volcano
At Broken Top volcano, in the southern Cascade Range of Oregon in the U.S., dissection by glaciation has provided a clear view of its interior workings (Crowe and Nolf, 1977). The cone consists of interbedded lava flows, laharic breccias, and other pyroclastic deposits illustrated in Fig. 7.17. The tall cone could not have remained standing without its complex internal framework, which is composed of dikes, sills, and small plutons. Early phases of cone construction were followed by collapse and the formation of a small summit caldera. After further cone construction, the edifice was intruded by plugs, radial and concentric dikes, and sills. Intrusions at Broken Top volcano constitute 5 to 20% of the cone volume.
Tieton Volcano
The Miocene-age Tieton Volcano of Washington has been deeply eroded, exposing radial dike swarms and plugs (Swanson, 1966). Originally, Tieton volcano had a basal diameter of ~11 km and a height of 2.4 km. The composite cone, made up of interbedded breccias, pyroclastic deposits, and block lava flows, overlies a shield composed of andesitic lavas. Within the southern, exposed half of the volcano, 200 dikes form a radial swarm; individual dikes are 2 to 6 m thick, are steeply dipping (70 to 90°), and are mostly andesitic. These dikes would have provided a substantial heat source if they were intruded over a fairly short period of time, but not if they were intruded piecemeal over tens of thousands of years. Such dikes
Fig. 7.16
This idealized cross section of a composite
cone and associated intrusive rocks is based
on observations of copper-porphyry
deposits in the Andes of Chile and northern
Argentina. Hydrothermal systems
responsible for the porphyry copper
deposits were established late in the history
of the composite cone; the intrusion and
eruption of rhyolitic magmas followed. In
this model, which is based on a region
with thick crust, the vertical and
horizontal scales are the same.
(After Sillitoe, 1973.)
Fig. 7.17
A cross section of Broken Top volcano in the southern Cascade Range of Oregon,
in the U.S. The cone consists of interbedded lava flows, laharic breccias, and other pyroclastic
deposits. The cone could not have supported itself without the complex internal framework of
dikes, sills, and small plutons—all of which give tall composite cones their stability.
(Adapted from Crowe and Nolf, 1977.)
Fig. 7.18
Diagram showing typical dike patterns radial
to the central conduit of a composite cone
and the parasitic cones on the volcano
flanks. The dike swarms follow the trend
of maximum horizontal compression.
(Adapted from Nakamura et al., 1977.)
also act as barriers to groundwater flow and thus can "compartmentalize" aquifers or parts of a hydrothermal system.
Volcanoes of the Aleutian Arc and Alaskan Peninsula
In their study of arc volcanoes of the Aleutian Islands and Alaskan Peninsula, Nakamura et al . (1977) mapped radial dike patterns and parasitic cones on volcano flanks. They concluded that dikes and flank vents on composite cones form elongate swarms in regions under compression and that the swarms follow the trend of the maximum horizontal compression (Fig. 7.18). Inference of the location and dimensions of such dike swarms must be made when siting exploration wells because although they provide the heat source, they also may act as barriers to groundwater flow (see Chapter 6).
Nakamura's observations can be applied to many composite cones that exhibit sector collapse. This type of collapse may occur parallel to the dilational stress within the volcano when the volcano's flanks are forced outward (Siebert, 1984). However, it is more likely that the collapse process is related to the shape of the dike-sill complex within the cone. Composite cones devel-
oped in regions with homogeneous stress are supported by a radial framework of dikes and sills, whereas cones developed in regions strongly influenced by the regional stress regime have dikes that are located mostly along a line parallel to the maximum horizontal compression. Parallel dike systems support only the part of the volcano below a line of parasitic vents; unsupported flanks, with only rare dikes or sills, are subject to sector collapse.
Summer Coon Volcano
The mid-Tertiary-age Summer Coon composite cone in Colorado, mapped by Lipman (1968), is a deeply dissected cone in which the nearly circular complex of stocks is exposed, as are the radial dikes shown in Fig. 7.19. These silicic dikes are as much as 4.8 km long and 60 m wide. Remnants of the cone consist of interbedded tuff-breccias and lava flows of mafic to intermediate
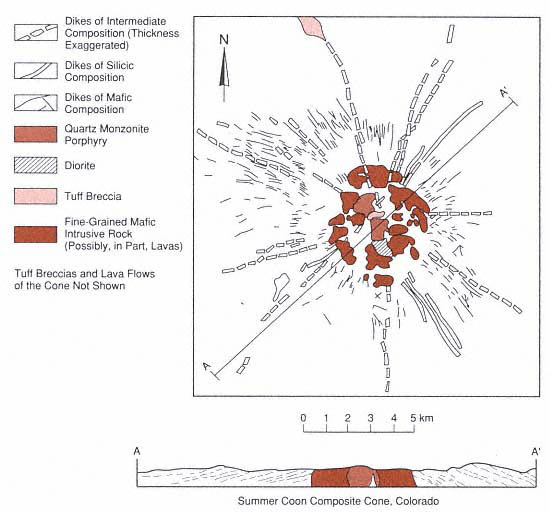
Fig. 7.19
Geologic map and cross section of the mid-Tertiary-age Summer Coon
composite cone in Colorado. This is a deeply dissected cone in which both the
nearly circular complex of stocks and the radial dikes are exposed.
(Adapted from Lipman, 1968.)
compositions. The symmetry of the dike complex reflects fracturing and dike emplacement controlled by stress around the central pluton or plutons and little superimposed tectonic control. The volcano's location on thick continental crust makes the Summer Coon volcano model more similar to volcanoes of the Andean altiplano than to the island arc volcanoes.
Mount St. Helens
Major structural changes to Mount St. Helens in Washington were caused by the sector collapse and eruption on May 18, 1980, in addition to subsequent dome growth. Before the eruption, Mt. Saint Helens consisted of (1) an older volcanic center with nested dacite domes, pyroclastic flows, and mudflow breccias, which was cut by dikes (Fig. 7.13); (2) andesitic and basaltic lava flows interbedded with volcanic breccias and scoria; and (3) dacitic domes (the 370-year BP summit dome and the 180- to 138-year BP domes of the north slope).
After the sector collapse and an avalanche that preceded the most explosive phase of the eruption at Mount St. Helens, an ampitheater-shaped crater remained. The dacite dome within the crater continues to grow (Voight et al ., 1981).
A Facies Model
Ruapehu
Ruapehu volcano in New Zealand, elevation 2797 m, was constructed by four major cone-building phases over the last 250,000 years. The 110-km3 composite cone is characterized by many abrupt lateral and vertical facies changes (Hackett and Houghton, 1989).
The central and flank vents, aligned along a north-northeast-trending lineament, consist of plug- and dome-like intrusions, thin lava flows, welded pyroclastic fall deposits, and vent breccias. Most of the vent areas have been hydrothermally altered. Proximal (near-vent) facies are made up of mostly block lava flows and lesser ashfall and laharic breccia deposits. The near-vent cones were intruded by numerous thin (0.5- to 5-m wide) dikes that are compositionally identical to adjacent lavas.
Hackett and Houghton concluded that the distal (ring plain) facies consists of interbedded epiclastic volcanic deposits that are interbedded with ashfall deposits and fluvially reworked avalanche or volcanic mudflows. This plain forms a 6- to 15-km-wide girdle around the composite cone, which is formed by overlapping alluvial fans. Hummocky mounds on the plain are part of a sector collapse avalanche deposit.
Hackett and Houghton also determined that the cones at Ruapehu are mostly constructed of lavas and domes and that pyroclastic and epiclastic materials are found mostly on the ring plain.
A Model Based on Heat Flow Measurements
Hakone Volcano
Iriyama and Oki (1978) measured temperature profiles in Hakone Volcano, Japan. However, the model was for a composite cone that grew within a small caldera. Hydrothermal activity is most intense in the eastern half of the caldera—probably because recharged groundwater from the lake in the western half of the caldera flows toward sea level in the east (Fig. 7.20). The thermal regime is most likely related to the caldera and not to the overlying composite cone.
Composite Cone Geothermal Systems
As discussed earlier in this chapter, many of the geothermal systems that were believed to be part of composite cones are actually located below the mature cones or are linked to other structures such as calderas and recent extensional faulting. Within the
Cascade Range of the U.S., there are few surface manifestations of hydrothermal activity at young composite cones (Duffield, 1983). Basaltic and andesitic volcanoes are generally not underlain by large, shallow crustal magma reservoirs. Only the most mature of these cones contain known geothermal reservoirs: for example, Crater Lake and Newberry volcanoes in Oregon, where there are young, voluminous, silicic magmas and small calderas.
For many composite cones, the traditional exploration methods such as measuring shallow heat flow, examining surface manifestations (hot springs, fumaroles, acid alteration, etc.), and evaluating electrical geophysical data are not successful (LaFleur, 1983; Wright and Ward, 1983). In most cases, high infiltration rates for rainfall and snowmelt near volcano summits can hydrologically mask any geothermal systems because the summit and slopes are saturated with cold water to depths of 500 m to 1 km. Within the Cascade Range of the western U.S., this phenomenon is known as the "rain curtain" (Swanberg et al ., 1988). Groundwater heated by plutons below Quaternary-age volcanoes of the Oregon Cascades flows laterally into the upper zones of older volcanic rocks on the flanks of the volcanic chain. The result is an area of near-zero shallow conductive heat flow around the young volcano as well as shallow high thermal gradients in the older rocks (Ingebritsen et al ., 1989). In this environment, the only effective exploration/evaluation methods are (a) a search for indirect clues such as youthful silicic tuffs and lavas and phreatic craters, (b) the qualitative maturity index (Fig. 7.6), and (c) intermediate to deep thermal gradient holes.
Proven (Drilled) Geothermal Fields
Meager Mountain
Meager Mountain in British Columbia, Canada, with a volume of 70 km3 and a cone height of 1500 m, comprises nine overlapping andesitic and dacitic volcanic assemblages that range from late Pliocene to 2440 years BP (Souther, 1985). Its multiple vents are aligned along a north-south trend. The volcano overlies a high-relief surface of older plutonic and metamorphic rocks (late Mesozoic to early Tertiary Coast Plutonic complex and late Miocene epizonal plutons). The older rocks consist of andesitic flows and volcanic breccias, and the younger rocks are dacitic flows and domes, ashfall deposits, and ignimbrites.
Warm springs of ~60°C issue from faults within the basement rocks at the base of the volcano. Much of the anomaly is masked by near-surface meteoritic water. Fifteen
Fig. 7.20
This computed temperature profile of
Hakone volcano in Japan was created for a
composite cone located within a small caldera.
(Adapted from Iriyama and Oki, 1978.)
coreholes were drilled on the northern and southern flanks of the volcano (Adams et al ., 1985). Argillic alteration of the basement rocks was detected on the northern slope, but no hydrothermal fluids were found. Below the southern slopes, a plume of hot water (~200°C) rises along north-south-trending faults and along fractures within basement rocks; 233 to 264°C fluids were encountered at depths of 3 to 3.5 km in fractured plutonic rocks.
The hydrothermal resource is fracture-dominated and follows the Meager Creek fault zone, where the host rocks have low permeability and porosity. It is likely that the fluids are heated by subvolcanic intrusive rocks, but the amount of thermal energy contributed by cooling dikes and plugs is not known. The system may be related to deep circulation of fluids along the Meager Creek fault zone. Souther (1985) reported on two drilled reservoirs; the shallow, low-temperature (<140°C) reservoir has been clogged with authigenic minerals and forms a barrier for deeper, hotter fluids; the deeper reservoir, in fractured basement rocks, has temperatures >200°C.
Momotombo
The Nicaraguan Depression in Central America, which lies parallel to a northwest-southeast-trending plate boundary, encompasses most of the Quaternary-to-historical volcanic fields of Nicaragua. Momotombo Volcano, located on the northwestern shore of Lago de Managua, is a 1258-m-high symmetrical cone, with a volume of 12 km3 (Fig. 7.21 and cover photo). Momotombo is a submature composite cone within a northwest-southeast-trending graben and adjacent to a 4-km-diameter caldera. The somma ridge of an undated but older cone is located ~900 m above the base of Momotombo. The youngest rocks here are andesitic lavas that were erupted in 1905 AD (Mooser et al ., 1958).
Surface geothermal manifestations include active fumaroles in the summit crater and hydrothermally altered ground over a 4 km2 area along the southern slope of the volcano. This altered ground follows hydrothermally active, northwest-trending fractures (Figs. 7.21 and 7.22). Drillholes up to several kilometers deep were sited in interbedded andesitic lavas, welded tuffs and ashes, basaltic lavas and ashes, and dacitic lava; the most common rock type is andesitic lithic tuff (Moore et al ., 1982). Some of the rocks have been interpreted as phreatomagmatic—which is certainly possible because Momotombo sits on the shore of Lake Managua.
Maps of the alteration aureoles suggest structural control and fracture permeability within the reservoir and have provided an excellent basis for siting both exploration and production drillholes. Most of the wells with high permeability are within 100 m of a high-angle reverse fault and a right-lateral strike-slip fault. Some of the fractures show signs of secondary brecciation and may have formed by hydraulic fracturing (Moore et al ., 1982). Drilling has determined that there is good correspondence between surface and subsurface structure. The highest temperatures (225°C) are within a lens-shaped reservoir at depths of 244 to 366 m. In 1979, six production wells supported a 30-MWe plant; Rowley (1982) estimated field capacity is 800 MWe , although that is an optimistic estimate.
Ahuachapán
The Ahuachapán geothermal field in El Salvador Central America is associated with the Laguna Verde volcanic complex, which consists of north-northeast-trending lines of craters and small cones. The 500- to 600-m-diameter craters at the summit of these composite cones may be phreatomagmatic. These volcanoes are composed of interbedded andesitic tuffs, lavas, and agglomerates that range from Pliocene to Holocene (a very general estimate by Romagnoli et al ., 1976).
Also associated with the Laguna Verde volcanic complex and north-northwest-trending
normal faults are two major hot spring areas and three fumarolic fields with temperatures as high as 123°C. The geothermal wells located in this area are producing fluids from interbedded pyroclastic rocks and lavas with temperatures of 228°C at a depth of 900 m. Production wells have been drilled to average depths of ~800 m. The fumaroles, hot springs, and most of the drillholes are located near intersections between north-northwest-trending faults and east-northeast-trending faults. Two 30-MWe - and one 35-MWe -capacity electrical generating plants were completed by 1987.
Ohnuma
The Ohnuma geothermal field of Japan is located on the flank of Hachimantai Volcano, an 800-m-high, flat-topped lava shield composed of mafic andesitic lava flows (Kuno, 1962). This immature composite cone, where lavas range from 0.5 to 1.0 Ma, has a volume of ~13 km3 .
Fig. 7.21
Map of Momotombo Volcano in Nicaragua shows the main faults and
areas of alteration, which are marked with a stippled pattern.
(Adapted from Mooser et al ., 1958; Moore et al ., 1982.)
Fig. 7.22
The Momotombo geothermal field is located on the southern slopes of
Momotombo volcano and on the edge of Lake Managua.
(Adapted from Moore et al., 1982.)
Thermal areas marked by geysers, mudpots, fumaroles, and hot springs cover 5 km2 . The hydrothermal system may not be directly related to the composite cone, but rather to an older caldera and a north-south-trending graben. The reservoir is located within highly fractured dacitic and andesitic lavas and interbedded pyroclastic rocks (Nakamura et al ., 1981; Kimbara, 1986). Production wells have been drilled to depths of 1.3 to 1.7 km.
Matsukawa
The Matsukawa geothermal area of Japan is located between the Maru Mori and Iwate volcanoes. The area's largest cone is 800 m high and the volcanic complex has an approximate volume of 45 km3 . This complex includes composite cones, a dome, and a 1.8- by 3.0-km-diameter summit caldera. Kuno (1962) reported that its lava flows and volcanic breccias consist of augite-hypersthene andesite (in the older part of the cone) and olivine andesite (in the main cone). The summit crater contains fumaroles and small areas of acid alteration. This complex is believed to be of Pleistocene and Holocene age.
The geothermal area is marked by a 0.5- to 1- by 7.0-km east-northeast-trending zone of argillization, silicification, and hot springs. The zone overlies a geothermal reservoir at a depth of 1.0 to 1.2 km in fractured welded tuff and shale; there is a caprock of welded tuff (Nakamura et al ., 1981; Kimbara, 1986).
Because the geothermal system is located on the rim of a caldera, it may be only partly related to the cone.
Tamagawa Spa
The Tamagawa Spa of Japan is a group of acidic hot springs located at the western foot of Mount Yake (Yakeyama). Mount Yake is a 750-m-high mature composite cone with a volume of 10 km3 (Kuno, 1962); the cone's 600-m-diameter summit crater contains a small dome and four small explosion craters. There is also a parasitic dome on the southern flank of the main cone. Mount Yake is composed of mostly hypersthene-olivine andesitic lava flows and pyroclastic rocks, and the domes are andesitic. The most recent eruption products are Holocene. This cone may overlie the rim of an older caldera and the hydrothermal system could be associated with that caldera.
The geothermal area (spa) comprises lines of fumaroles, hot springs, and deposits of silica sinter, all of which are oriented east-west and north-south. The springs have temperatures up to 98°C and pHs of <1.2. The main geothermal area is located in a depression that has been interpreted as both a phreatic crater and a landslide. The reservoir is located within fractured Tertiary-age tuff, shale, and andesitic lava (Nakamura et al ., 1981).
Bouillante
The volcanoes of Guadeloupe, in the Lesser Antilles, include composite cones and domes and are located along the north-south-trending spine of Basse-Terre (the high, volcanic portion of the island). Soufrière de Guadeloupe is a dacitic dome with a summit 1467 m above sea level and is the site of historic eruptions that included explosive phreatic activity 1976 to 1977 AD. Eruptions of Soufrière de Guadeloupe have produced phreatic deposits, pyroclastic fall deposits, ignimbrites (mostly nonwelded), andesitic lavas, laharic breccias, and dacite domes. Vatin-Perignon et al . (1984) documented ages from 0.3 Ma to the present.
The summit region of Soufrière, site of the youngest cones and domes, is cut by northwest- and northeast-trending faults, along which there are surface manifestations of the geothermal system such as summit fumaroles and large areas of acid alteration. Hot springs are located around the base of the most recent dacite dome, which was recently modified by phreatic eruptions (Heiken et al ., 1980).
A commercially developed hydrothermal system is located on the island's west coast along a northwest-trending fault and a line of small cones that extends from Soufrière de Guadeloupe down to the coastline (Fig. 7.23). At Bouillante, there are areas of hydrothermal alteration and silicification as well as a 98°C spring. The geothermal reservoir, located within Tertiary tuffs and andesitic lava flows, has both fault (fracture) and formation permeability. Temperatures at a depth of 500 m are >240°C (Demians et al ., 1972; Vatin-Perignon et al ., 1984). Epidote appears in rocks below 100 to 300 m.
Kawah Kamodjang
The fumarole field of Kawah Kamodjang in Indonesia is located in western Java, where its specific association with a composite cone or cones is not clear. The nearby volcanoes of Rakutak, Chihara, Danou, Pangkaban, Gandapura, Masagit, and Guntur are part of a 15-km-long, 4- to 5-km-wide volcanic chain, which is parallel to a graben that trends west-southwest and east-northeast; most faults strike N60°E. The highest cones have elevations of ~1500 m and are composed of well-bedded, massive pyroclastic rocks that are interbedded with thick andesitic flows (Neuman van Padang, 1951; Robert et al ., 1983). Robert et al . (1983) postulated that the geothermal area may be located within a small (2-km-diameter, 500-m-deep), poorly defined caldera.
Fig. 7.23
Sketch geologic map of the western part of the
island of Guadeloupe (Basse-Terre) in the
Lesser Antilles. The Bouillante geothermal
area is located along northwest-trending
faults that extend downslope from the active
volcanic chain of Madeleine-Soufrière.
(Adapted from Gérard et al. 1981.)
Within the 2-km-wide depression is a 1200-m-long, 100- to 700-m-wide zone of fumaroles, mudpots, phreatic craters, and hot springs with temperatures of 80 to 105°C. Six production wells supplying a 30-MWe generator were drilled in small grabens within the larger graben. The drilled reservoir is located within hydrothermally altered, fractured tuffs and lavas, where temperatures reach 200 to 230°C, at a depth of 900 m (Robert et al ., 1983). The main caprocks are hydrothermally altered pyroclastic deposits.
Composite Cones with Possible Geothermal Potential—As Yet Unproven by Deep Drilling
Mount Shasta
Mount Shasta, one of the southernmost of the Cascade volcanoes, is located in northern California. With a volume of 350 km3 and an elevation of 3050 m, this mature composite cone is also the largest Cascade volcano. The summit crater, two older central vents, and a line of flank vents are located along north-south trends (Christiansen et al ., 1977). Large dacitic cones and flows have erupted from both summit and flank vents. A 450-km2 area northwest of the volcano is covered by a hummocky debris avalanche deposit, which Crandell et al . (1984) interpreted as a sector collapse of the main cone ~300,000 years BP.
The cone is made up of equal portions of lava flows and blocky pyroclastic debris, including pyroclastic flow deposits and volcanic mudflows (Christiansen et al ., 1977), most of which are composed of pyroxene-andesite and hornblende-bearing andesite. Basalt is found only below an altitude of 2100 m in cinder cones and small lava flows. Mount Shasta formed during the last 500,000 years, and four periods of cone-building activity have occurred during the last 250,000 years (Christiansen, 1985).
There are summit fumaroles and areas of intense local hydrothermal alteration on each of Mount Shasta's four main cones, but nowhere else. Theoretically, there should be a small hydrothermal system within or below this large composite cone; however, there is no evidence for such a system because of the effective shield established by high flux of cold water from rain and
snow on the mountain. To date, there has been no drilling on Mount Shasta to test for a geothermal system.
Mount Hood
Mount Hood, also in Oregon, is located within a broad graben that follows the summit of the north-south-trending topographic high, which is the backbone of the high Cascades of the Pacific Northwest. Mount Hood was an obvious target for geothermal exploration and research, and a cooperative effort was begun in 1976 by a consortium of federal and state agencies (Williams et al ., 1982).
Mount Hood is a 2200-m-high mature composite cone with an approximate volume of 188 km3 . Eruptions have occurred there over the past 700,000 years; the most recent was less than 200 years ago (Wise, 1969; Crandell and Meyer, 1977). Mount Hood is composed of interbedded thin lava flows and pyroclastic debris (ashfall deposits, ignimbrites, and laharic breccias). Little is known or has been inferred about intrusive rocks in Mount Hood (shown in cross section in Fig. 7.24) except for the "plug" dome that comprises andesitic and hornblende andesitic lava; peripheral cones are composed of basalt.
The only surface manifestations of a hydrothermal system on Mount Hood are summit fumaroles, at temperatures of 50 to 85°C, and areas of hydrothermal alteration surrounding the plug dome. Although 25 shallow wells have been drilled on the flanks of Mount Hood, no shallow magma chamber or large hydrothermal systems were detected; the shallow wells did not penetrate the near-surface outflow zone of cold groundwater.
The deepest geothermal gradient hole drilled at Mount Hood is located on the lower flanks of the volcano near faults in basalt flows that predate Mount Hood; the bottomhole temperature of this well is 120°C at a depth of 1.8 km (Priest, 1982). The thermal gradient of ~60°C/km in this corehole could be related to magmas in the cone, but it also can be explained solely by the high heat flow in this tectonically active area.
Because of the enormous terrain corrections required for analysis, and the presence of a cold groundwater shield below the slopes of Mount Hood, most traditional geophysical
Fig. 7.24
Composite cross section of Mount Hood in Oregon.
(Based on work by Wise, 1968; Williams et al. , 1982; Priest, 1982.)
exploration methods did not reveal the presence or absence of a hydrothermal system. Shallow drilling penetrated some zones of warm water, but most drillholes never reached beyond the cold, near-surface groundwater. There may be a hydrothermal system below this large, young composite cone, but it has not yet been observed.
Mount Adams
Located east of the main Cascade trend, Mount Adams in Washington is a large (~200-km3 ) composite cone with an elevation of 3743 m. The composite cone is near the center of a basalt-to-rhyodacite volcanic field with more than 60 vents of Quaternary age. Flank vents, which occur at elevations of 2000 to 2500 m, are composed of mafic andesitic to dacitic lava flows and block-and-ash flows (Hildreth and Fierstein, 1985). Peripheral basaltic cinder cones and lava flows erupted on the lower flanks have a volume of 70 km3 . Volcanic activity began about 500,000 years ago, and the youngest eruptions took place 3500 years ago; most of the composite cone was constructed between 20,000 and 10,000 years ago.
There are summit fumaroles and warm springs near the base of the volcano. The breccia and scoria core of this cone has been severely altered by acid waters. The 4-km2 area of altered core is a source of avalanches and debris flows because of the gravitational instability of the clay alteration products (Hildreth and Fierstein, 1985).
On the basis of the petrology of erupted materials, Hildreth and Fierstein concluded that it is unlikely there is any significant magma reservoir within Mount Adams. High precipitation (3500 mm/year) makes the mountain an important recharge site and the extremely permeable carapace is saturated with cold water that does not remain long enough to be heated.
Mount Fuji
One of the Earth's most famous composite cones, Japan's Mount Fuji is composed of a group of 3 overlapping cones and 100 peripheral cones. Most of these vents are located along a north-northwest-south-southeast-trending line that is parallel to regional structures (Kuno, 1962; Tsuya et al ., 1981). The 1.5- × 0.7-km summit crater is 750 m deep. Older lavas at Fuji are olivine basalts, whereas the younger cones are composed of andesite and peripheral cones of olivine basalt. The cones comprise interbedded ashfall deposits, lahar deposits, ignimbrites, and lava flows. The complex is ~80,000 years old, and the most recent activity occurred in 1707 AD (Kuno, 1962).
All thermal anomalies on Fuji are masked by movement of shallow groundwater. Yuhara (1974) reported that each year 77% of the precipitation flows out at the foot of the cone and another ~20% is lost by evaporation. Tritium analyses have revealed that water emerging near the base is not old. Shallow aquifers follow scoria-lapilli beds and fractures in lava flows. Impermeable units are mudflow deposits and older basement rocks. Very little of the recharge water enters the volcano's interior to be heated. Mount Fuji has not been drilled for geothermal resource evaluation.
From Yuhara's (1974) observations at Fuji and Mount Yotei (also in Japan), it was determined that recharge into the hydrothermal system of a composite cone may not be adequate to maintain a hydrothermal system. Conditions necessary for adequate recharge will most likely depend upon the structural framework of the individual volcano, its maturity, fault patterns, and the degree of intrusion and hydraulic fracturing associated with dike-sill systems and small plutons. As described earlier, eroded, mature volcanoes in areas with thick continental crust expose large volumes of hydrothermally altered lava and pyroclastic rock.
Discussion
Techniques for the exploration and development of geothermal resources associated with composite cones are still in their
infancy. With the exception of ancient hydrothermal systems within composite cones, which have been studied chiefly in relation to their porphyry copper deposits, we have yet to determine if there are useful geothermal resources associated with most mature composite cones. In the earlier parts of this chapter, we proposed a general concept of composite cone maturity and its application to geothermal exploration and resource evaluation. To determine if reservoirs are present, intermediate to deep drilling will be required for a mature composite cone. Cold groundwater outflow within these cones often mask surface geothermal manifestations as well as the heat flow measurements in shallow drill-holes.
With good reason, successful geothermal sites have been drilled on the lower slopes of (or adjacent to) composite cones at sites where there are surface manifestations of a hydrothermal system. Healy (1976) points out that hot springs occur where heated meteoric water intersects the basal contact between the cone and older rocks. This phenomenon implies the presence of a convective plume within the cone—an inference confirmed by examination of hydrothermal alteration aureoles within eroded composite cones (for instance, see Sillitoe, 1973).
For many the examples cited here, it is not clear if the hydrothermal systems described are related to the nearby older volcanoes or to the overlying composite cones. In each of these instances there are still other interpretations. Several of the cones are sited along caldera rims, where they were formed by postcaldera eruptions, and nearly all of the cones are located along active faults. It is most likely that magma feeding the cones is contributing to the elevated heat flow in the area and that the high cones serve as major recharge areas. It is not clear if the plumbing (intrusions) within these cones is the major heat source for their hydrothermal systems.
In any case, all the tested geothermal systems associated with composite cones that were cited here have the following common features:
· all are located near or below the base or the lower slopes of the cone;
· all have ample surface manifestations of the hydrothermal system, including argillic and acid alteration, silica sinter deposits, hot springs, fumaroles, mudpots and/or geysers; and
· all have reservoirs in highly fractured basement rocks along active normal, reverse, and strike-slip faults.
In addition, some of the cones are located along the rims of underlying calderas and some have phreatic craters or phreatic breccia deposits (Fig. 7.25).
Fig. 7.25
Flow chart for exploration and evaluation of the geothermal potential of composite cones.
Appendix A—
Field Methods in Volcanic Regions
In this book we have focused on the ways field observations of volcanic terrain can be used to locate and evaluate geothermal resources. Keeping in mind that for some geologists, these observations will be their only data sets, we included this appendix to guide the student or geologist who has not yet had a great deal of field experience. This appendix is specifically oriented toward work in volcanic areas and does not include basic instruction such as how to use a compass and clinometer; the reader should consult a handbook on field geology for this type of information (for example, Compton, 1962).
The experienced field geologist may simply ignore this appendix and use the core of this book as a reference.
Preparation for Field Work
Definition of the Problem
The first and perhaps the most painful part of a project is to define the purpose of the field work; this process will guide the planning stages. Geothermal exploration within volcanic fields has two main goals: (a) identifying and evaluating the heat source and (b) locating permeable zones and the hydrothermal system. All vents and their deposits must be mapped and the extent and thicknesses determined. These maps will also serve as a basis for stratigraphic studies—an aspect that will also require samples for petrologic analysis and age dating. The data obtained from this step will reveal the volumes, ages, genesis, and compositions of the rocks, which in turn can be used to interpret the depth and size of magma bodies—the heat source. It is also necessary to map
all structures, including fracture systems, flexures, and faults, and to evaluate their relationship to the volcanoes and areas of hydrothermal alteration. Most hydrothermal systems are associated with zones of fracture permeability; the careful definition of these zones is crucial in locating sites for exploration core drilling. It is wise to work with hydrogeochemists when preparing detailed maps of hydrothermal manifestations such as fumaroles, hot springs, sinter and travertine deposits, and hydrothermally altered ground.
Library Research
Prior geological, geophysical, and geochemical work will be useful in evaluating the area to be mapped and in planning the field study. Spending time in a good technical library will save a great deal of effort and money. Field geologists can gain a substantial headstart by reading all published work, summarizing the portions that might be needed later, and copying the maps. Maps copied from published material can be useful for reviewing previous work when in the field. It is prudent to keep in mind multiple interpretations for the published data; for example, a down-dropped block can be interpreted by one author as a caldera and by another as a graben.
Commercial data bases, usually accessible through libraries for a small fee, provide listings of most publications and reports unless they are truly obscure. By furnishing key words, including the subject and geographic area, one can obtain a comprehensive guide to the literature about a specific area.
If the area to be mapped has already been studied by geologists from mining or oil companies, they may share unpublished reports and data, or these same reports may be on file with the government. (However, it may be that these maps and data are proprietary and not available to you.) There also may be unpublished data available from government agencies and university geologists.
Collecting Geographic Materials
Topographic Maps
It is useful to have copies of every available topographic map and at all scales. If none are available at an appropriate working scale, a good printer can enlarge or reduce the map onto a mylar (plastic) base. If paper copies of the map are to be used in the field, it is a good idea have them waterproofed.
Some countries have digitized topographic maps; if a mainframe computer, a geographic information system, and a large budget are available, it may be possible to obtain the maps on magnetic tape. These can be useful later for preparing final published maps, constructing three-dimensional diagrams of the area, or as a base for all of the field measurements.
Satellite Images and Aerial Photographs
Satellite images, now available for most of the Earth's surface, are essential for mapping large structural features, especially in heavily vegetated regions. (Examples of Earth Resources Technology and Landsat Thematic Mapper images are shown in Figs. A.1 and A.2.) If the region is arid, preliminary geologic maps can be prepared with the help of magnetic tapes of the satellite image and image processing programs. Processed images are sometimes for sale from commercial sources, government agencies, or university research groups. Synthetic aperture radar (SAR) imagery, either aircraft or spacecraft mounted, is useful for mapping structural features and volcanic landforms, particularly in vegetated regions or areas with continuous cloud cover (Fig. A.3).
Aerial photographs, in black-and-white or color, are frequently attainable from government agencies or companies specializing in aerial photography. However, in some countries, the use of aerial photography is restricted for security reasons.
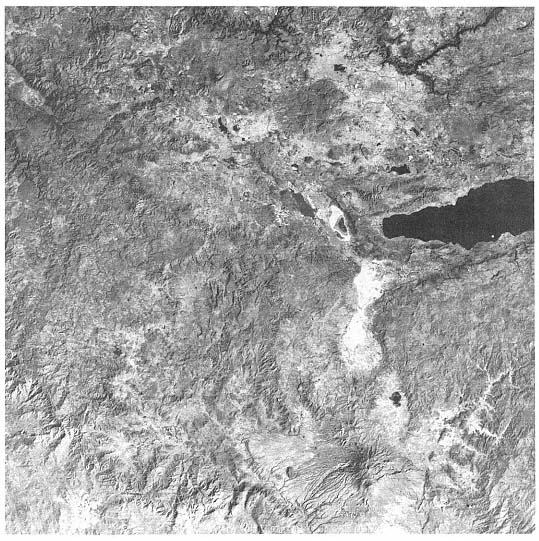
Fig. A.1
Earth Resources Technology Satellite (ERTS) image of the Guadalajara-Lake
Chapala-Volcán Colima region of central Mexico (Band 6). Width of the image is 115 km.
The most prominent feature is the Colima graben, which is oriented north-south and
is visible from Volcán Colima (bottom-center) to its intersection with the east-west
trend of volcanoes and faults. Volcanoes are visible from the area of Lake
Chapala (center right), through the young caldera complex of Sierra La
Primavera (center), to Volcán Tequila (upper left). These images
provide a remarkable overview of the geology of a region.
Land-Ownership Maps
These maps may be available from federal or municipal government offices. When in the field, it is useful—even essential—to know whom to contact before crossing any private property.
Establishing the Stratigraphic Framework of a Volcanic Field
The field methods used in geothermal exploration to establish stratigraphic relationships between volcanic rocks are very similar to those used for sedimentary rocks:
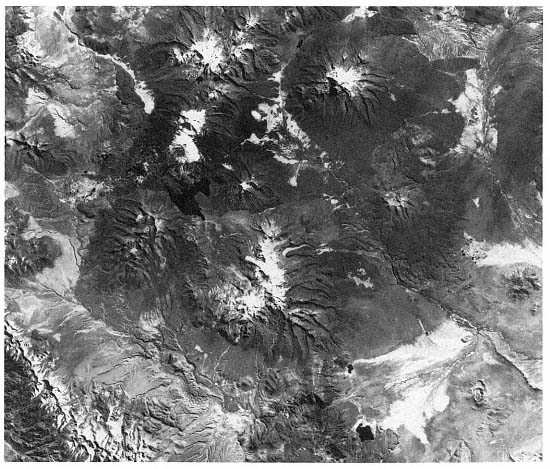
Fig. A.2
Landsat Thematic Mapper (TM) image of an area of northern Chile, on its frontier with Bolivia.
Area shown is 90 by 90 km. In the center is Lago Chungara, which was formed
when a river was dammed by a debris avalanche from Volcán Parinacota (the
snow-covered peak north of the lake). TM images come as color prints and
are extremely useful for mapping in arid regions. This TM image was
prepared by Peter Francis at the Lunar and Planetary Institute in Houston, Texas.
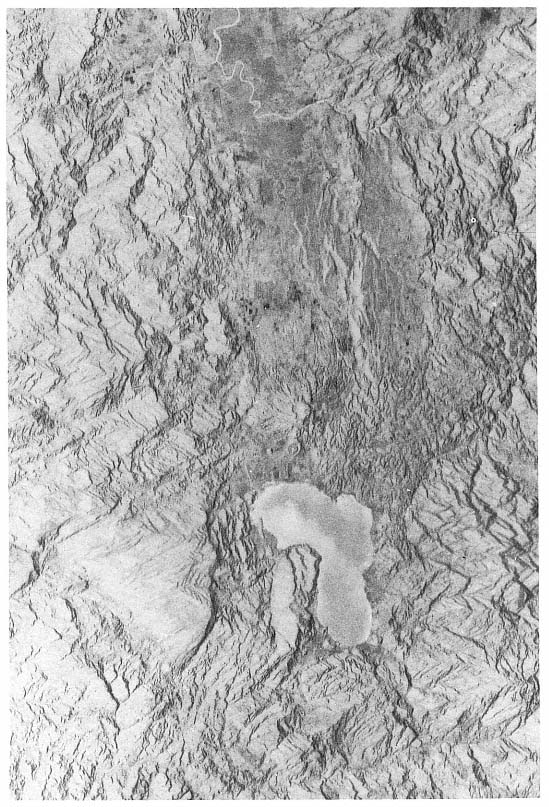
Fig. A.3
Space Shuttle Imaging Radar image of northwestern Honduras,
showing the north-south-trending Sula graben. The lake visible near the
bottom of the image is Lago de Yojoa, which is 5 km wide at the narrow neck;
Yojoa was formed behind a natural dam composed of basaltic cones and lavas
that were erupted in the Sula Graben. North-south-trending faults, which cut
these youthful lavas, are easily identified. Synthetic aperture radar images
such as these are excellent for reconnaissance geologic mapping in regions
with heavy vegetation or cloud cover. This image was provided by Ron Blom
at the NASA-Jet Propulsion Laboratory of Pasadena, California.
careful geological mapping of lithologic units, measurements of many stratigraphic sections, and age-dates for those units. However, rock units within volcanic fields show much more lateral and vertical variation than do units in most sedimentary basins (Fisher and Smith, 1991). They can fill caldera depressions or deep valleys, which means that one might find younger volcanic rocks at a lower levels than older rocks, even if no folding or faulting has occurred. Pyroclastic rocks are formed quickly—initially with abundant kinetic and thermal energy—and are deposited as ashfalls that drape topography, surges that cross topographic highs, pyroclastic flows that follow the valleys, as well as wet surges of cohesive ash that defy the laws of original horizontality when plastered onto vertical surfaces.
The possibilities of facies variations within single depositional units must be considered when mapping volcanic rocks (Fig. A.4). For example, surges and pyroclastic flows can grade outward into volcanic mudflows because of cooling and condensation of steam within the flow some distance from the source. The degree of welding of pyroclasts in the flow units can vary with the unit thickness; dense rocks are found near the vent or in the center of valley fills. For detailed descriptions of facies variations in volcanic rocks, see Fisher and Schmincke (1984) and Cas and Wright (1987).
Field and laboratory observations must be adapted to fit the volcanic field of interest. For example, the approach used for a large basaltic lava plateau would differ considerably from that used to study a group of small tuff rings.
Stratigraphic analysis of volcanoes provides the necessary foundation for all other studies, including petrology, geochemistry, thermal state, and structural framework; without this foundation, sample analysis is nothing more than rock collecting. Table A.1 provides a list of further functions for which various field observations are used.
Approach
A working stratigraphy can be established by considering earlier work as well as the field geologist's own study of aerial photographs or topographic maps. Published stratigraphic studies supply useful information from nearby areas and may include radiometric dates. All of this information should be compiled in a notebook and on a map or photo base. We offer the following suggestions to be considered when entering this stage of field work.
By quickly examining the whole area, one can locate the best exposures, especially those that show contacts between depositional units. If these locations are noted on maps and/or photographs it is easy to return later to measure stratigraphic sections. As stratigraphic data are collected, the information should be entered on working copies of cross sections through the volcanic field. During a field study, geologists' ideas on the stratigraphy will evolve and it will be necessary to revisit some outcrops several times to reevaluate the interpretations.
Obviously, it is preferable to measure sections at the best exposures in unfaulted areas; however, this may not always be possible. The best way to begin is by standing back and looking at the outcrop from a distance to determine the layers or discrete rock units that stand out. They are marked on a sketch or polaroid photograph and their general characteristics are noted, including thickness, texture or structure, and color. This distant view may be useful when unraveling variations from one detailed stratigraphic section to another.
When a section is measured, the attitude (strike and dip) of the rock units is described as well as the rock types and their relation to older rocks, paleosols, and any intrusive rocks. The area traversed while measuring the section is noted on a map or aerial photograph; if neither map or photo exist, a pace-and-compass map of the traverse with distances, slope angles, and
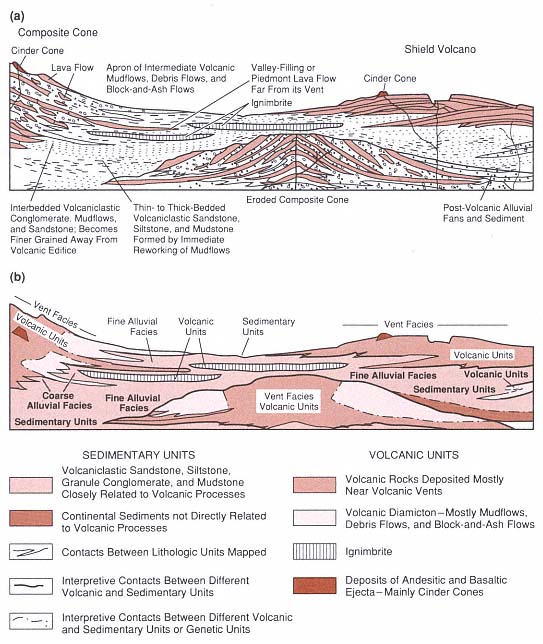
Fig. A.4
Schematic cross sections illustrate (a) facies changes between volcanic units and
(b) time-correlative sedimentary units. These deposits are grouped into map units that are
linked to the eruption or sedimentary processes responsible for the deposit.
(Adapted from Smith, 1987.)
|
||||||||||||
attitudes (strikes and dips) can be useful. An altimeter is employed to determine elevations of the base, top, and important contacts, in addition to elevations chosen from the topographic map. If working as a team, field geologists use a tape measure; if by themselves, a Jacob's staff is helpful. If the stratigraphic sections are very thick, it is possible to confirm thicknesses by using an altimeter or by measuring elevations of contacts on a topographic map.
What should be measured and described? Within the field, rock-stratigraphic units are defined solely on physical differences. Fisher and Schmincke (1984) defined a formation as
"a mappable bed, bedding set or sequence of beds of any thickness set apart from rock units above and below by distinctive physical criteria such as texture, color, lithologic or mineralogic characteristic, or by weathered zones or erosional unconformities; a member is a convenient subdivision of a formation."
Fisher and Schmincke also defined the concept of an eruption unit , which is a deposit from a single eruptive pulse, eruptive phase, or an eruption. A sequence of several eruption units can be treated as a mappable unit or formation. Eruption units can refer to pyroclastic fallout deposits, pyroclast flow deposits, volcanic mudflows, lava flows, and any other deposit from a single eruptive pulse. For detailed information on defining stratigraphic units within volcanic rocks, see Fisher and Schmincke (1984), or Cas and Wright (1987).
If at all possible, a geologist should not create new stratigraphic names, but rather work within existing stratigraphic designations. The rationale for this philosophy stems from experience with such cases as the Wairakei geothermal field of New Zealand. The body of knowledge about the relationship between tuffs and lavas erupted at Wairakei during the last 200,000 years has grown as more field work, drilling, and further geological exploration revealed additional details. As volcanological concepts change and more data are available, rock sequences have been refined and redefined. Over a period of 60 years, no less than 12 different stratigraphic sequences have been described for the same rocks at Wairakei. This melange of stratigraphic names confuses the working geologist to the point of desperation.
Volcanic Rock Units
Volcanic rock units include pyroclastic and epiclastic rocks and lava flows and domes. Ideally, descriptions would go onto graph paper that is taped to a large clip board—making it possible to evaluate relationships
at a glance while measuring the stratigraphic section. However, because rain and wind make it impractical to carry around a bulky board, this is not the usual means of recording field notes. The most logical method is to record field observations and sketches in a waterproof notebook and draw the section later in camp or the office (Fig. A.5). It is far better to take copious notes as well as photos and sketches while in the field than to wish for them later when one is several thousand kilometers from the field area.
Contact Relationships
Understanding the nature of the contact between rock units is critical. One should determine if there is a sharp erosional or depositional contact, a tectonic displacement, a collection of reworked clastic debris, or paleosol. In the case of a depositional contact, one should ascertain whether the deposits drape the underlying topography or are concentrated in channels and valleys. If they are deposited within a valley, it is valuable to measure the size, orientation, and slope of the valley floor.
Color
A color chart is very helpful for maintaining consistency in descriptions of rock-unit color and color variations. (Rock color charts are available from the Geological Society of America.)
Rock-Unit Classification
Volcanic rock units generally fall into the categories of pyroclastic, epiclastic, and lava. In the following sections, we discuss various field observations and measurements that are useful in writing detailed and complete rock-unit descriptions.
Characteristics of Pyroclastic and Epiclastic Rocks
Pyroclastic rocks can be classified by their textural and mineralogical characteristics (see Appendix B). Complete descriptions include important details about thickness, grain size, pyroclast types, bedding sets, grading, clast orientation, flow features, induration and welding, and thermal remanent magnetization. This information is further supplemented by sampling representative clastic rock units for laboratory analysis.
Thickness
Pyroclastic units show thickness variations that are indicative of vent location, deposit type (for instance, fallout, flow, and surge), and the effects of paleotopography (Fisher and Schmincke, 1984). Even where pyroclastic units are not fully exposed, maximum exposed thicknesses can be used in constructing isopach maps. In some cases, thicknesses are estimated from topographic constraints such as scarp heights and bedding dips.
Grain Size
Field estimates of grain size can be made using the Fisher (1961) classification, which parallels the Folk (1966) classification of clastic sediments; both of these can be done with a scale and charts. Actual measurements will be done by sample sieving or thin-section studies in the laboratory, but visual estimates are sufficient for measured sections in the field. Coarser materials, including pumice and lithic clasts, can either be sieved in the field with coarse (>4-cm) sieves or measured and described at an outcrop within a designated area outlined on the rock surface (usually ~1 m2 ). These observations are especially useful in studies of lithic clasts within pyroclastic units. Another technique for recording the textural variations within an eruption unit is to measure the lengths of the five largest lithic clasts and those of the five largest pumices.
Pyroclasts
Most of this detailed work will be done within the laboratory, however, it is helpful while in the field to note pyroclast and lithic
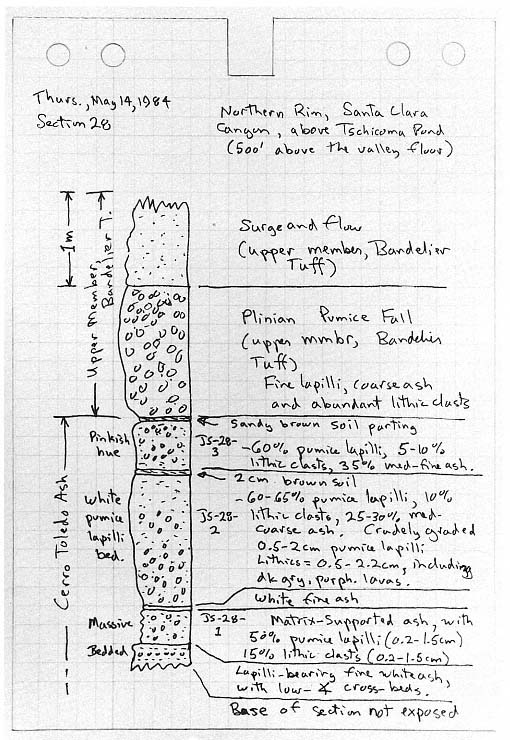
Fig. A.5
An example of notes taken during measurement of a pyroclastic rock sequence.
Field notes should be as complete as possible, including the date, location,
thorough rock descriptions, thicknesses of individual units, and location and numbers
of the samples collected for later laboratory analysis.
clast characteristics that can be used later to identify a specific formation or member: color, shape, percentage of phenocrysts, phenocryst types, and variety of lithic clasts. Lithic clasts include those of lag breccias, mesobreccias, and megabreccias (the two latter types are related to catastrophic collapses such as avalanches from a sector collapse in a volcano or wall collapse within a caldera).
Bedding
Bedform identification is helpful for interpreting the origin of a pyroclastic deposits. Fisher and Schmincke (1984) discussed various bedforms that can be related to different types of eruptions (such as Plinian, hydroclastic, Strombolian), as well as the emplacement mechanism. Where a pyroclastic deposit shows a sequence of bedforms as a coherent unit (bedding set), the sequence can be used with other observations to identify a mappable unit in the field. For example, a specific member might consist of a fine-grained ash fallout bed overlain by a surge bed, two pyroclastic flow deposits, and a volcanic mudflow breccia. Although the thicknesses and degree of compaction and welding within the pyroclastic flow deposits might vary, if the sequence appears to be unique, it can be helpful for correlating units.
Grading
The character of grading in pyroclastic deposits is also indicative of origin. The field geologist should determine whether a bed is massive, normally graded, or reversely graded.
Clast Orientation
Within surge deposits and pyroclastic flows, there may be elongate clasts or accidental debris, such as fossil tree trunks, that can be used to determine flow directions. The orientations of the long axes of as many elongate clasts as possible should be measured and averaged for each field location.
Flow Features
Many surge deposits are characterized by dunes or antidunes. Measurements of implied current directions, descriptions of types of cross-bedding, and estimates of the magnitude of the cross-beds are all useful for evaluating eruption types and processes and for locating vent areas. In pyroclastic flow deposits, flow features should be noted, including thickening in paleovalleys and shadow areas behind paleotopographic high areas where the flow is relatively thin.
Induration and Welding
To establish whether a rock is welded, partly welded, or nonwelded, bulk sample density can be compared to that of a nonvesicular lava of similar composition; welded tuffs have densities similar to those of equivalent lavas, nonwelded tuffs have densities less than half of those for equivalent lavas, and nonwelded tuffs have intermediate densities. To determine if the rock has been indurated or cemented by post-depositional processes, one should look for vapor-phase alteration within pyroclastic flow deposits, matrix cementation by diagenesis or weathering, and secondary clays from hydrothermal activity. Other evidence of induration might be found in the form of fossil fumaroles (pipe-like zones cemented with vapor phase minerals) and compaction features such as vertical concentrations of small lithic clasts (segregation pipes).
Thermal Remanent Magnetization
Most welded tuffs have high magnetic stability and exhibit uniform thermal remanent magnetization (TRM) directions. Polarity determinations of welded ignimbrites can be made in the field with a portable magnetometer (Lipman, 1975).
Sampling
For each distinct unit (but not necessarily from all measured stratigraphic sections),
field geologists collect a sample that is representative of that unit. If the tephra are unconsolidated and coarse grained, they are sieved, the size fractions are weighed, and chunks of the pumice are collected (in addition to a split of the <1-mm fraction that is kept for laboratory sieving). The various lithic clasts are described and samples of each lithic type are collected for thin-section study. If it is appropriate, samples are chosen for radiometric dating and chemical analysis: pyroclastic flows often show subtle compositional stratification that can be related to magma chamber evolution; fallout layers provide widespread time-stratigraphic units; organic matter such as buried tree trunks are very helpful in dating young pyroclastic deposits—these types of samples are always particularly valuable.
Lava Flows and Domes
For lava flows and domes, descriptions should include observations of texture, flow layering, jointing. petrology, overall lava flow type, thermal effects, and thickness. The field geologist also samples representative lava units.
Texture
Textural variations that might be found within flows or domes include differences in vesicularity (size, shape, and orientation), phenocryst content and size, brecciation, and flow foliation or layering. Coarsely pumiceous zones, which have risen diapirically and may have been broken or folded by flow movement (Fink and Manley, 1987), are often distinct features that can be mapped. Variations in relief and vesicularity may be visible on aerial photographs of silicic lava flows and can be used to map flow structures (Fig. A.6).
Flow Layering
Especially in lavas of intermediate to silicic compositions, layering is common and ranges from submicrometer shears to macroscopic bands of dense glass and slightly vesicular glass. Layering attitudes, measured vertically and over the entire lava flow, can provide information about vent locations and the physical properties of the flow.
Jointing
Most lavas are broken into blocks by thermal stresses during cooling. The open fractures or joints are often columnar and form at right angles to the flow surface and base (normal to the isotherms or cooling surfaces). Fracture surfaces are striated; Ryan and Sammis (1978) concluded that striae provide a record of incremental crack advance during stress buildup in the cooling lava (Fig. A.7).
Columnar joints can range from a few tens of centimeters to >1 m wide and can be up to 30 m long in some thick plateau basalt flows. The columns can have as few as three or as
Fig. A.6
Examples of maps and useful observations of silicic lava flows. (a) Sketch map of Little
Glass Mountain in California, made quickly from an aerial photograph. This is a young rhyolitic
obsidian flow for which flow lobes and the direction of flow can be observed by mapping
the ridged and furrowed flow surface; from this information and topographic profiles,
it is possible to locate the vent area. The flow lobes also can be identified through
textural changes; in this example, zones of coarsely vesicular pumice can be mapped.
(Adapted from Fink and Manley, 1987.) (b) Map of Little Glass Mountain that shows
zones of coarsely vesicular pumice (dark areas). (Adapted from Fink and Manley, 1987).
(c) Map of the Watchman dacite flow at Crater Lake in Oregon. Flow patterns
were identified by measuring the attitudes of flow foliation. This method is particularly
useful if no aerial photographs are available. (Adapted from Williams, 1942). (d) Cross
section along the long axis of a silicic lava flow illustrates textural variations, including
coarse rubble scattered over the flow surface, along the flow front, and at the base.
Ragged spines or slabs quite often extend out from the flow or dome.
many as seven sides; most appear to have five or six sides (Williams and McBirney, 1979). Maps of column orientations can sometimes help determine lava flow boundaries, and this is especially useful where outcrops are poor. For example, within a valley-filling lava flow, columns in the center of the valley would be vertical; however, along the valley walls, they would be oriented at an angle and would be perpendicular to the walls, which had acted as heat sinks during cooling of the lava flow. Similar columnar jointing can also be found in dikes, plugs, and lava lakes.
If the lavas are potential reservoir rocks, maps of the size, width, and extent of cooling joints in these flows exposed at the surface may be useful for estimating their permeability.
Petrology
For field identification of lava type, geologists use the petrographic classification with which they are most familiar (such as those illustrated in Fig. 1.3 and Appendix B, for instance), but consistency is crucial. The field descriptions should be the best possible, but it is likely that these will change after thin sections have been examined petrographically, especially in the case of finely crystalline rocks.
Lava Flow Type
If possible, descriptions of the type of lava flow should include its overall texture and morphology. Most basaltic lavas can be identified by the terms pahoehoe, aa , or block lava . Details of basal breccia and lava tubes or channels should be provided if they are visible.
Thermal Effects
To ascertain whether there has been thermal alteration of rocks underlying the lava flow, field geologists look for oxidation of soil layers or older rocks, formation of pipe vesicles during heating of water in soil or bogs, and desiccation of clastic sedimentary rocks (Fig. A.7).
Thickness
In measuring thicknesses, all mappable sub-divisions (eruption unit, member, or formation) and all textural subunits are noted.
Fig. A.7
Cross section of a generic basaltic lava flow, showing some of the basic structural features
that should be described when mapping flows. Flow surfaces, if preserved, present
a variety of textures that range from smooth, ropy pahoehoe to spiny, rubbly aa lavas.
Flow interiors exhibit variations in structure such as different types of columnar joints,
vesicle concentrations, and lava tubes; the presence of these features often depends
on flow thickness and viscosity. Pipe vesicles are formed within flows as they cross
wet ground; rising steam leaves vesicle trains or small tubes that are bent by flow
(a good indicator of flow direction). Lava blocks spalled or extruded from the toe of
an aa lava flow leave lava rubble beneath and in front of the flow.
Thickness is measured from the base of a unit to the level of some significant textural change.
Sampling
Lava samples are critical for developing a sound understanding of the time-stratigraphy for a field area. In addition to providing documentation of the petrogenetic evolution of a volcanic field, carefully selected samples can provide important radiometric dates. To obtain dates and chemical analyses that are reliable, it is important to assess the evident weathering and diagenetic effects as well as phenocryst content of samples.
Correlation of Volcanic Rock Units
The ability to identify and correlate eruption units becomes much more significant if the units are large, extensive, and within a tectonically complex area. If a pyroclastic unit (either fallout deposit or ignimbrite) is to be traced to determine either its volume or its utility as a stratigraphic marker across complex terrain, then correlation criteria must be established. Geothermal exploration within calderas requires that pyroclastic deposits exposed around the margins be correlated with thick caldera-fill deposits; these tuffs are from the same eruption but may have substantially different textures.
An entire branch of volcanology, tephrochronology , has been developed to answer the need for correlating volcanic ash deposits (see, for example, Wilcox, 1965; Self and Sparks, 1981). To correlate ash beds, it is necessary to identify the mineral phases, glass compositions, and particle shapes (such as shard types and pumice characteristics) that are characteristic of each deposit. If the ash is petrographically unique, it is possible to identify it with a hand lens plus a reference sample of the known deposit. If there are several ash beds of similar composition or appearance, it may be necessary to use chemical analyses of the glass pyroclasts, including trace elements, for correlation. Ideally, radiometric age dates are employed, but they are expensive. Bulk chemical analyses are known to be a poor basis for correlation: with increasing distance from the source, the gravitational segregation of mineral phases from a glass-shard-laden eruption plume can change the bulk chemical composition. The refractive indices of glass shards (see Fig. B.1), used at one time for correlation, are not always accurate because glasses change as a result of alteration and hydration in different depositional environments.
Correlation of ignimbrites can be difficult because of facies variations, the degree of welding, postdepositional alteration, and chemical zonation of large-volume eruption units. For example, it is not easy to quickly correlate a nonwelded ignimbrite on the outer slopes of a volcano and a densely welded, hydrothermally altered ignimbrite from the same eruption within the thick caldera fill. Hildreth and Mahood (1986) have reviewed techniques for correlating ignimbrites and conclude that the following observations are the most reliable:
· careful mapping of the whole unit;
· stratigraphic position;
· thermal remnant magnetic directions within welded tuffs and high-precision potassium-argon ages;
· a distinctive suite of lithic clasts; and
· petrographic characteristics within pumice clasts, pyroclast shapes, and unusual phenocrysts.
Lithology and Structure
The characterization of rock samples provides qualitative and quantitative data that are used for interpreting the origin of the rocks and their significance to the overall volcanic structure and geothermal properties. In addition, laboratory analyses of lithological character provide strong tests of field hypotheses. Appendix B outlines various rock classification methods.
Before doing a structural analysis, it is extremely important to properly map faults, showing topographic effects that constrain their dip and strike. In addition to delineation and classification of faults and fractures, the overall volcanic structure must be evaluated. With this information, various rock associations, and the rocks' spatial and temporal variations, it it possible to constrain a probable underlying volcanic structure, as has been described in previous chapters of this book.
The following discussions cover basic aspects of the techniques employed in lithological and structural studies. More detailed information is available in popular petrographic and structural textbooks such as Williams et al . (1982) and Dennis (1972).
Lava Samples
Hand Sample Classification
Because many volcanic rocks are fine-grained, accurate hand-sample classification is often difficult. The color, texture, density, and mineral content are descriptive features that can be used to identify a sample. These macroscopic features are also invaluable for making the field identifications and correlations that are necessary for mapping.
Compositional classification is generally determined by color and phenocryst content, if any. An example of such a classification is shown in MacDonald (1972; p. 458). Mineralogical classification is greatly aided by the use of rock associations, as was described for rock families by Carmichael et al . (1974, pp. 32-37), including the basalts, andesite-rhyolite associations, trachybasalt-trachyandesites, trachyte-phonolites, lamprophyres, and nephelinites. In addition to the sample's phenocryst mineralogy, secondary mineralogy is employed to classify many volcanic rocks, especially those found in areas of geothermal activity. (This subject is discussed more thoroughly in Chapter 3.)
Textural features of samples lend a physical basis for classification to supplement the more chemical nature of mineralogical classifications. For example, textural features of lavas include vesicularity, phenocryst abundance and size, foliation and fracture, and secondary transformations such as hydration, devitrification, and weathering.
In general, a combination of the compositional and textural classifications of lava samples (for instance, aphyric rhyolite; pumiceous, hornblende-biotite dacite; flow-banded andesite) provides a satisfactory, unambiguous method of naming rocks for field and laboratory recognition.
Thin-Section Petrography
Analysis of rock samples by petrographic microscope is the most important laboratory procedure geologists use to supplement the field study; its value lies in part in the relatively simple preparation and facilities required. This work can be accomplished conveniently in the field area with a rock trim saw and lap, quick setting glues or epoxies (Hutchinson, 1974), and a polarizing, petrographic microscope. Petrographic methods, outlined in crystallography texts such as Heinrich (1965), as well as textural descriptions, well illustrated in other texts such as Williams et al . (1982), facilitate the analysis. This analysis usually includes textural classification (for example, aphyric, foliated, or vesicular) and modal analysis of the crystal content, which is quantified by point counts. One possible format for the analysis is shown in the sidebar on this page.
Petrographic analyses may also include scanning electron microscopy (SEM) of thin sections. This procedure requires sophisticated equipment that might not be readily available, but it can be extremely helpful in characterizing and interpreting phase mineralogy and textures in fine-grain samples, especially those that are pyroclastic or have been altered to secondary minerals. Etching samples with acids or by an ion beam greatly enhances poorly developed textures by
selectively thinning the section according to mineral and glass hardnesses (Heiken et al ., 1989).
Whole-Rock and Mineral Chemistry
X-ray fluorescence spectrometry (XRF) and atomic absorption spectrophotometry (AA) are the most widely used methods for obtaining bulk chemical analyses of rock samples. (The methods and analytical problems are outlined by Hutchinson, 1974.) These data are very valuable when combined with petrographic descriptions to characterize volcanic stratigraphy and determine the nature of a magmatic source. For instance, Carmichael et al . (1974) reported that magma evolution through differentiation is revealed by the enrichment in the silica contents of erupted products with time. Samples for bulk chemical analysis must be carefully chosen to obtain a suite of samples for which analyses can be compared. Problems in discerning variable effects of secondary alterations and phenocryst contents can reduce the value of sample data for characterization and correlation.
Mineral compositions provide information to be used in detailed classification schemes that require specificity; for example, discrimination of the anorthite content of plagioclase. Mineral chemistry data also can be applied to calculation of geothermometers and geobarometers (Behen and Lindsley, 1987).
This type of information is typically obtained from thin sections by electron probe microanalysis (EPM); however, mineral separates, obtained when the sample is crushed and prepared for bulk chemical analyses (Hutchinson, 1974), can be readily analyzed by x-ray diffraction (XRD). These separates may be also useful for radiometric dating by mass spectrometry.
Alteration
Alteration mineralogy is an significant aspect of volcanic petrography in geothermal areas
|
(see Chapter 3). Both the traditional XRD powder methods and the SEM are useful for identifying suites of alteration minerals such as clays and zeolites. These suites are typical of hydrothermal alteration environments and therefore can be employed to establish thermal regimes, the likely chemistry of the host rocks, and the nature of hydrothermal fluids. We recommend the review by Henley et al . (1983) for comprehensive instructions on this method.
Pyroclastic Samples
Field Classification
Several classification schemes are provided in Appendix B. Field descriptions include general grain size and sorting, bedding textures, color, and topographic effects on the pyroclastic deposit. More detailed descriptive aspects are discussed in Chapter 2.
Laboratory Analysis
Analysis of tephra samples in the laboratory involves several interdependent techniques that generally do not require elaborate analytical equipment. Figure A.8 is a flow chart that outlines laboratory treatment of pyroclastic samples, including both preparatory and analytical steps. The petrographic inspection follows procedures outlined above for lava samples and can be simply performed with a binocular scope on small sample splits or thin sections of epoxy-impregnated samples. Fundamental measurements comprise granulometry, mode and component analysis, grain shape and texture description, and mineral and glass chemical analysis.
Granulometric Analysis
Grain-size analysis of pyroclastic samples is a standard characterizing technique and, over the last 20 years, has been increasingly used to interpret the origin of samples (for instance, Sheridan, 1971; Walker, 1971; Wohletz, 1983). Granulometric characterization of samples is an especially important tool for correlation and classification in areas where many pyroclastic deposits are encountered. Interpretation is generally needed to determine the eruption and emplacement mechanisms for the deposits sampled.
Sieving is a practical approach for classifying samples in the range of ~16 to 0.064 mm, for which standard screens are readily available (see, for instance, Folk and Ward, 1957). Above this grain size, hand counts of individual fragments are useful; below this size, settling-tube measurements, based on either a pipette method (Folk, 1976) or optical methods such as fluid suspension absorbance measurements can extend the range to near 1 µm. The wide range easily analyzed by screen sieves provides enough data to adequately characterize and interpret most tephra samples. Table A.2 presents class size intervals for clastic sediments and pyroclastic rocks. Because of the broad range of grain sizes represented by pyroclastic materials, it is common to use a logarithmic transformation of grain diameters called the phi (f ) scale (Wentworth, 1922):

for which dmm is the grain diameter in millimeters. Krumbein (1938) showed that on this scale transformation, plots of mass frequency vs phi size approximated a Gaussian distribution, which can be characterized by the use of log-normal statistics:
where d m/d f = the mass per unit interval of f , Ks = a constant to normalize the distribution (usually Ks = 1), s d = the standard deviation in log units, d = particle diameter, and dm = the mode diameter of the distribution.
Tephra size data are useful for various types of interpretation. For example, Sparks et al .
Fig. A.8
Flow chart for laboratory treatment of pyroclastic samples.
(1978) discussed the importance of particle size to terminal fall velocity, which is useful in determining the amount of time required for pyroclasts to fall out of eruption plumes and clouds (Fig. A.9). Carey and Sparks (1986; Figs. 1.13 and 1.14) related maximum clast sizes to distance from source for eruptions of different magnitudes. A plot of median diameter vs distance from the source (Fig. A.10) shows the general fining of pyroclastic samples with distance for a number of different eruptions.
By using single-mode lognormal statistics, Walker (1971) characterized tephra samples of pyroclastic fall and flow origin. Wohletz (1983) described similar size data for pyroclastic surge samples. Sheridan and Wohletz (1983a) characterized size data for numerous samples of hydrovolcanic origin (see Fig. 2.20). Taken together and plotted on a sorting vs median diameter plot (Fig. A.11), these data provide a general interpretation scheme for tephra samples.
Another, more specific example illustrates the application of size data to a stratigraphic section of the Lathrop Wells scoria cone in Nevada that exhibits two main types of eruptive behavior (Wohletz, 1986): early
|
|||||||||||||||||||||||||||||||||||||||||||||||||||||||||||||||||||||||||||||||||||||||||||||||||||||||||||||||||||||||||||||
hydrovolcanic explosions and later Strombolian eruptions (Fig. A.12). Three types of bedforms were recognizable: scoria fall, fine ash layers of undetermined origin, and pyroclastic surge. Figure A.13 is a sorting vs median diameter plot that nicely differentiates between the three bedforms. Because of their relatively poor sorting, it was assumed that the fine ash layers had been emplaced by pyroclastic surge. Furthermore, a plot of median diameter and weight percent of fine ash (Fig. A.14) correlated the fine ash layers with similar size distributions from early hydrovolcanic samples in the cone stratigraphy and thus permitted their classification as hydrovolcanic. This interpretation was supported by a later study of pyroclast constituents, morphology, and surface chemistry.
We believe that size analysis can provide even more information about the history of fragmentation and dispersal of pyroclastic samples through mathematical analysis of individual size-frequency distributions. Sheridan et al . (1987) discussed the typical polymodality of tephra size-frequency distributions and possible types of interpretations. Typically, size-frequency distributions are analyzed as lognormal-type distributions, in which, for any particular sample, one or more lognormal subpopulations may overlap to form the total observed distribution. Because the single-mode lognormal statistics are not strictly applicable to tephra samples, we advocate the subpopulation discrimination technique established by Sheridan et al . (1987), in which microcomputer software can be applied to sieve data for fully characterized sized distributions. More recently, Wohletz et al . (1989) developed a new mathematical distribution, the sequential fragmentation/transport model, that relates distribution shapes to physical
Fig. A.9
Terminal fall velocities for (a) pumice and (b) lithic fragments of varying radii in fluid of
several densities (for example, the lower two curves of each plot are for fallout in air at room
temperature and steam at 1300 K). Vertical dashed lines are shear velocities of 15 to 200 m/s,
assuming a drag coefficient of 0.01; these lines define the rate of fallout of tephra from
an eruption plume and velocities required to suspend the fragments in a pyroclastic flow.
(Adapted from Sparks et al., 1978.)
Fig. A.10
Plot of median grain size vs distance from the source for various tephra deposits.
(Adapted from Fisher and Schmincke, 1984.)
processes of fragmentation and transport sorting, which allows a much more extensive analysis of size data. The distribution is given as
where the normalization constant (Ks ) and the transport distance factor (x/x o ) are set to unity for frequency distributions totaling 100%, g f = a parameter analogous in part to standard deviation, and gf = g f + 2 for fragmentation processes or gf = 2 for transport processes. Because the distribution shapes for the fragmentation and transport forms of Eq. (A-3) are nearly identical and because almost all tephra samples have experienced some sorting by a transporting agent, the gf = 2 form is most appropriate. Figures A. 15 through A.17 show the results when Eq. (A-3) is applied to several tephra samples. In Table A.3, we show observed ranges and expected values of g f for volcanic fragmentation and transporting process.
Fig. A.11
Plot of sorting (s
f ) vs median diameter (Mdf ), showing ranges of values as 1 and 8%
contours for fallout (dashed lines) and pyroclastic flows (solid lines).
(Adapted from Walker, 1971.)
The bold solid line encloses the range of values observed for pyroclastic surge samples
from observations referenced by Fisher and Schmincke (1984); the dotted line
surrounds values of cross-bedded surge deposits.
(Adapted from Fisher and Schmincke, 1984.)
Component Analysis
Tephra samples contain essential juvenile, (meaning new magma), accessory (older volcanic materials), and accidental (subvolcanic basement fragments) components. In juvenile components, fragments of glass, lava, and crystals vary in proportion in a complex fashion that is dependent on the magma composition and temperature as well as the mode of ejection and transport. Glass is often vesiculated and forms pumice or scoria. The three tephra components (glass, crystals, and lithic fragments) can be easily recognized with assistance of a hand lens or microscope. An example from Walker and Croasdale (1972) shows vertical and lateral changes of pyroclast constituents for the Fogo A tephra sampled southeast of Lake Fogo at Sao Miguel in the Azores (Fig. A.18).
An analysis of tephra components is especially important for identifying samples from deposits that have major nonjuvenile contributions. Abundant accidental and accessory lithic fragments are indicative of eruptions that have fractured and excavated rocks from around the magma conduit, as is the case for vent-opening and hydrovolcanic eruptions. A careful count of lithic-fragment abundances for the scoria cone at Lathrop Wells (Fig. A.12) showed the relative abundance of lithic fragments in pyroclastic deposits from hydrovolcanic phases (Fig. A.19). In addition, Fig. A.19 illustrates the relative increases of crystals in pyroclastic surge samples from the tuff ring and fine ashes from
Fig. A.12
Stratigraphic section of the Lathrop Wells, Nevada, scoria cone,
showing sampled intervals.
(Adapted from Wohletz, 1986.)
Fig. A.13
Plot of sorting vs median diameter for samples from the scoria cone described in Fig. A.12.
Fig. A.14
Plot median diameter (Mdf ) and wt% ash <1 mm vs the scoria cone
stratigraphy (shown in Fig. A.12). The peaks in median diameter and ash abundance
for the hydrovolcanic samples are unlike those for the Strombolian
samples, which are products of magmatic eruption.
Fig. A.15
Plots of the size-frequency distribution for a
sample of a planar surge bed from Crater
Elegante in Sonora, Mexico. The upper plot
shows a cubic spline curve fit to the data
points (
modeled distribution (solid curve) made
by adding three subpopulations of SFT
form (dashed curves).
(Adapted from Wohletz et al ., 1989.)
the early and late cone samples, which were interpreted as surge deposits. This increase in crystal concentration is a typical feature of surge-emplaced tephra.
Grain Shape and Texture
For most samples (except those with a high content of fine ash), a hand lens is sufficient to make vital observations about features such as those listed here.
· Vesicularity: the relative abundance and size of vesicles and whether they are spherical or elongated; in most cases, this is a measure of the contribution of magmatic gas
· Angularity: blocky grains with few vesicles—earmarks of phreatomagmatic or phreatic pyroclasts
Fig. A.16
Plots of the size-frequency distribution for
a sample of the proximal bedded deposits
of the Mount St. Helens May 18, 1980
pyroclastic flow. The upper plot shows
a cubic spline curve fit to the data points (
and the lower plot shows the modeled
distribution (solid curve) made by adding four
subpopulations of SFT form (dashed curves).
(Adapted from Wohletz et al ., 1989.)
· Rounding: used to determine the relative degree of transport abrasion and reworking by epiclastic processes
· Surface alteration: indicates weathering or hydrothermal processes; phreatomagmatic pyroclasts from wet surge deposits show abundant alteration coatings.
Grain-shape analysis can be further developed by using an SEM; methods for analysis and interpretation are discussed by Heiken (1972), Wohletz (1983; 1986), and Heiken and Wohletz (1985). The SEM micrographs in Fig. A.20 reveal prominent textural features. Figure A.21 plots the variation of grain textures that proved useful in distinguishing between Strombolian (magmatic) and hydrovolcanic samples from the scoria cone at Lathrop Wells (Fig. A.12).
Fig. A.17
Plots of the size-frequency distribution for a
sample of gray pumice fall from the AD 79
eruption of Vesuvius. The upper plot
shows a cubic spline curve fit to the
data points (
the modeled distribution (solid curve) made
by adding three subpopulations of
sequential fragmentation/transport (SFT)
form (dashed curves).
(Adapted from Wohletz et al ., 1989.)
Tephra Chemistry and Alteration
Bulk chemical analyses can be obtained by x-ray fluorescence (XRF) and atomic absorption (AA) methods, as discussed for lava samples earlier; however, such analyses are not commonly performed because of the secondary alterations typical found in tephra samples. Glass silica content can easily be determined by index of refraction measurements with a petrographic microscope (see Fig. B.1). An x-ray analyzer attached to the scanning electron microscope (SEM) also provides a rapid means by which to obtain relative chemical compositions; using this technique, it is possible to analyze small alteration crystals that cover individual pyroclast surfaces (Fig. A.22). Many types of pyroclastic deposits show variations of glass surface chemistry with stratigraphic position (Fig. A.23). These variations can be interpreted with respect to the degree of secondary alteration (an essential measurement for porosity and permeability), the degree of water interaction during hydrovolcanic eruption, and changes in magma chemistry. In the Fig. A.24 plot of major-element variations for the Lathrop Wells scoria cone (Fig. A.12), the strongest variations occur in hydrovolcanic samples, as is the case for palagonitic constituents and surface alteration textures (Figs. A.19 and A.20, respectively).
Structural Analysis
Identification of geologic structures is a crucial component of field work. Frequently, these structures are most readily observed from stereo pairs of aerial photographs. In the field, definition of fault and vent structures requires careful correlation of rock units and close inspection of outcrop fabrics.
Regional Tectonic Control
Regional structures are related to past and present tectonic conditions such as crustal compression (thrusting and folding) and extension (block faulting, graben formation, and strike-slip movement). In general, regional structure exerts some control over volcanic vent locations and, to some degree, the type of volcanic complex that evolves (for instance, composite cones from compressional regions and scoria cone fields from extensional environments).
Stratigraphic Correlation and Volcano-Tectonic Models
As we discussed earlier, preparation of a detailed stratigraphy is one of the most important aspects of field work. Stratigraphic units in volcanic fields consist of old basement rocks, which are relatively large areally as a result of their sedimentary, intrusive, or metamorphic origin; rocks of petrologic consanguinty, such as older mafic rocks buried by younger intermediate extrusives; and widespread pyroclastic units.
|
Correlation of these units can generally be accomplished in the field by examining out-crop textures and alteration, phenocryst contents, erosion surfaces, and overall rock type. For widespread pyroclastic units, discontinuities in surface elevation and thickness (for example, large thickness variations seen across graben- or caldera-bounding faults) are often used to identify fault locations. Composite cones can show facies such as near-vent intercalations of lava and pyroclastic units that change laterally to distal laharic deposits. Other typical stratigraphic successions for various volcanic field types are discussed in previous chapters (see also Cas and Wright, 1987).
The Map
Because planimetric maps are the most significant and tangible product of geological/volcanological investigations, we place great emphasis on detailed, accurate, and legible maps that portray as much qualitative and quantitative data as possible. The spatial relationships of observations and data collection points are not only the key to understanding the subsurface structure of an exploration property but also necessary in planning drilling operations—especially for issues concerning topographic accessibility. The three-dimensionality of geologic investigations also dictates the need for maps with associated cross-section interpretations. The exercise of producing maps and cross sections is one way to validate spatial observations—the spacial and temporal laws of superposition, topographic control, and cross-cutting relationships must be satisfied by data and observations before the field geologist can produce a technically accurate map. During the map-editing stage, inconsistencies in observations and the completeness of a field study become obvious.
The stages of mapping are well described in classical texts on geological field methods.
Fig. A.18
Median size (Mdf ), sorting coefficient (s
f ), and frequency distribution of pumice (light gray),
crystals (white), and lithic clasts (black) for the Fogo A tephra. (a) These variations show
vertical changes that are documented within a stratigraphic section. (b) These
variations show lateral changes documented within the deposit with
increasing distance from the vent.
(Adapted from Walker and Croasdale, 1972.)
For instance, Compton (1962) discusses the scale and detail, types of data and observations to be included, ways maps address specific themes or problems, note-taking and location protocol, field equipment required, sampling procedures, sample density, and traverse plans.
Generally, mapping is first approached from the reconnaissance level where previous reports and maps are compiled, accessibility is determined, and land ownerships are determined. Many of these issues were covered at the beginning of this appendix. Often maps and orientations provided by previous workers can be compiled into a working reconnaissance map. The mapping process then progresses from observations of type localities for development of the stratigraphic framework to field checking major geological contacts determined by previous work. Most useful reconnaissance traverses are along areas with outcrops, such as streams, roads, ridges, and trails that cross structural and stratigraphic contacts. At the end of the reconnaissance stage, when the area of interest has been placed in a regional context, the size of the area to be studied and the level of detail required can be determined; in addition, specific areas can be selected for detailed mapping.
Fig. A.19
Variation of pyroclast constituents for samples from the scoria cone section shown in Fig. A.12.
The curves depict variations for the size fractions indicated.
(Adapted from Wohletz, 1986.)
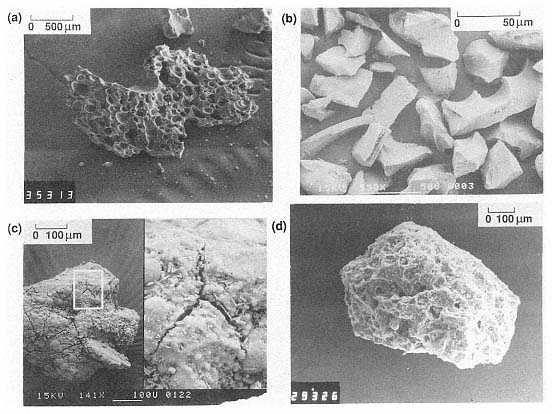
Fig. A.20
SEM photographs illustrating four common pyroclast textures. (a) Vesicularity is well
developed for this pyroclast sampled at Surtsey. (b) Grain angularity is prominent in a
hydroclastic sample from Surtsey. (c) Grain rounding indicates transport abrasion in this
poorly vesicular pyroclast from Kilbourne Hole maar in New Mexico. (d) Surface
alteration coats this pyroclast from the Coliseum Diatreme maar in Arizona.
Scale and Graphic Detail
Topographic maps for most areas are available at scales of 1:250,000 to 1:25,000. The scales of satellite and aerial photo images vary, but satellite images are generally more regional. It is often satisfactory to photographically enlarge topographic base maps for more detailed investigations, but this process can make it difficult to judge absolute distances correctly and triangulation methods will be necessary.
For geothermal fields, the scale of the map may be determined by the size of the volcanic field with which it is associated. For example, if a hydrothermal system strongly interacts with regional aquifers, related hydro-thermal manifestations, geochemical survey points, and sampling locations may extend over regions of up to several hundred square kilometers. In such cases, a large-scale geological reconnaissance map helps identify the geological control of the hydrothermal manifestations and their possible relationships with primary hydrothermal prospects. These large-scale maps are valuable in establishing hydrologic recharge and hydrothermal outflow areas, which are a function of the regional hydrologic gradient. As a part of the geological and hydro-
Fig. A.21
Variation plot for pyroclast textures determined by SEM vs scoria cone
stratigraphy (Fig. A.12). The vesicularity in magmatic (cone-forming eruptions)
samples is greater than that in samples from the hydrovolcanic tuff ring, but
the hydrovolcanic phases show greater grain alteration and blocky (angular) textures.
Pyroclast rounding is increased in samples abraded during surge transport.
(Adapted from Wohletz, 1986.)
geochemical survey, evaluations of the regional groundwater budget often play a major role in modeling the productivity of a hydrothermal system.
When exploration has progressed to the drilling/coring stage and production drilling plans are being considered, a detailed plane-table map showing the target area's topographic contours, geological contacts, lithology, and structures is beneficial. This process may require scales in the range of 1:1,000 to 1:10,000, which will make it easier not only to determine the well site, but also to locate geologic details and project depths accurately.
Thematic Mapping
Geological maps can be very different, depending on the theme of the map—whether it focuses on bedrock lithology, detailed volcanologic or tectonic structure, rock facies determined by chemical or physical properties, or geothermal manifestations. The most useful type of map is
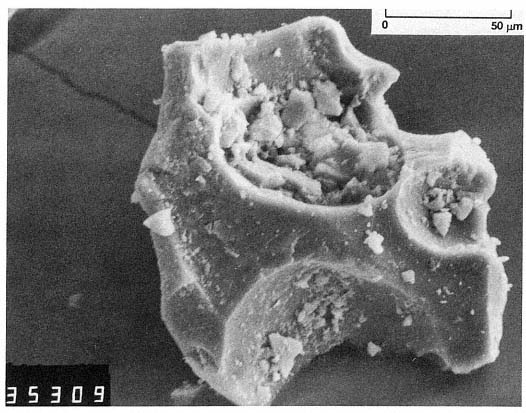
Fig. A.22
SEM of microcrystalline alteration materials coating a vesicular pyroclast from Surtsey.
The mineralogy of these materials can constrain the alteration environment.
geovolcanological and shows aspects of bedrock lithology, volcano structure, and cognate lithologies (suites of rocks all erupted from the same volcanic edifice). A geovolcanological map adds these structural interpretations to more classical geologic base maps. Producing this type of map requires that the field geologists
· recognize related rock types that can be grouped as co-genetic suites related to the evolution of particular vents;
· delineate subunits or facies of rocks that reflect their genesis;
· map geomorphological changes that reflect concealed vent structures; and
· distinguish between regional tectonic structural fabrics and local volcanic ones.
Several map themes we have found particularly useful in specific areas are discussed in more detail below. Creating multiple maps of a geothermal area can be very useful in separating different data sets and observations so they can be judged on their internal consistency; however, multiple maps are also useful as a group when they are over-laid so as to determine areas of greatest data correspondence. (Map overlays will be discussed in the later section on 3-D models.)
Lithological
A geological map that emphasizes only rock data and observations illustrates the greatest number of mapped geological units and structural contacts but places little emphasis on volcanic or tectonic structure. These maps are employed to show rock sample locations and subtle variations in rock properties. However, because the detail can obscure volcanological and structural interpretations, this type of map may not be the most suitable for illustrating key rock and structural elements that control a geothermal system. The geological map of Usu volcano (Fig. 5.34) is typical of a lithological approach that shows variations of rock types according to their age, petrography, and geomorphology.
Structural
A map that emphasizes tectonic and volcanological structure may have some interpretive elements that are based on grouping of lithological units and the delineation of individual volcanic edifices by geomorphological features. Because only major rock units are shown, much greater emphasis is
Fig. A.23
Variation in glass-surface chemistry for samples taken from stratigraphic sections of four
volcanoes: Crater Elegante and Cerro Colorado in Sonora, Mexico, and Panum
Crater and Obsidian Dome from the Inyo-Mono volcanic field of California.
Sample types are designated as fall (F), sandwave surge (SW), massive surge (M),
and planar surge (P). Fall samples are most representative of magmatic compositions
(stippled patterns), whereas the surge samples show hydrovolcanic tephra compositions
that result from the rapid alteration of the magma through its interaction with water.
The vertical line on plots for Crater Elegante and Cerro Colorado separates essentially
magmatic samples (left) and later-erupted hydrovolcanic samples (right).
(Adapted from Wohletz, 1987.)
placed on structural features that affect subsurface conditions and locations of hydrothermal systems. Relative ages and the amount of recent fault movement can be depicted by variable thicknesses of contacts. Figure 5.24 provides a prototype in the detailed structural map for the Coso volcanic field.
Facies
Volcanic facies (lateral and vertical variations in single eruptive units) are manifest as gradation changes in physical or chemical properties. Some examples of mappable facies discussed in previous chapters include
· downslope variations in composite cones, from lavas to lavas intercalated with pyroclastic units to dominantly epiclastic and pyroclastic textures;
· variations in pyroclastic units related to median grain size, sorting, and bedding structures;
· pyroclastic and lava facies of silicic domes;
· contrast between caldera fill and caldera outflow rocks;
· plateau forming, horizontally outcropping rocks of basin fills; and
· dipping and unconformable rock strata of near-vent facies.
Other examples are described by Cas and Wright (1987).
Facies variations shown in plan view can provide information on porosity/permeability relationships that are meaningful when a potential hydrothermal reservoir must be delineated. In other cases, facies variations in some pyroclastic units can point to potential vent areas that have been eroded or concealed under younger units. Wohletz and Sheridan (1979) discussed one example of ways in which pyroclastic surge facies can indicate vent area, and another example, shown in Fig. 2.34, suggests how dry-to-wet pyroclastic rock facies might help constrain the degree of aquifer interaction for a given eruptive unit.
Geothermal Manifestations
Chapter 3 outlined aspects of geothermal manifestations, including thermal spring and fumarole locations, silica sinter and travertine deposits, hydrothermally altered rocks, and phreatic explosion craters and breccias. A map indicating locations of such manifestations is very useful for hydrogeochemical surveys; it not only points to individual sample localities, it also becomes a base map (like that shown in Fig. A.25) for plotting hydrogeochemical samples and subsequent interpretations.
Cross Sections
Construction of cross sections should begin before field work actually commences. The following approach works well to stimulate ideas about the area's geologic history and framework; it also allows the geologist to identify inconsistencies and deficiencies while still in the field.
Topographic Profile
After previous topographic maps, aerial photographs, and any other available data have been examined, it is possible to establish lines for cross sections through critical parts of the field area. If topographic maps are available, the geologist prepares topographic profiles for the cross sections at the same scale used for the working copy of the map. After the profiles are completed, several copies are made with indelible ink on sturdy paper (cross-section paper is good) or plastic mylar (Fig. A.26). No vertical exaggeration is used, especially when sketching in lithologic units and structural features; cross sections with vertical exaggeration are often deceptive and can lead to later problems in siting wells.
Preliminary Interpretation
At this point, the geologist has examined all the older data, aerial photographs, and
Fig. A.24
Variation of major-element chemistry for surfaces of pyroclast samples taken from the scoria
cone described in Fig. A.12. Strong variations are evident in major-element abundances
for the hydrovolcanic, magmatic, and lava samples.
(Adapted from Wohletz, 1986.)
topographic maps and has some preliminary ideas about the structure of the area from geomorphological clues. Folds, faults, and major lithologic breaks are sketched in pencil on the cross-sections (Fig. A.26). Studying these preliminary cross sections can help in planning field traverses.
In the Field
Each evening in the field, appropriate changes are made to the working cross sections, based on the day's lithologic descriptions as well as observations of faults, attitudes, areas of alteration, etc. Sometimes it is necessary to erase an earlier interpretation or add new lines. This messy working cross section evolves, along with the geologist's ideas about the field area (Fig. A.26); the daily review exercise is stimulating and sharpens perceptions for the next day's observations.
By the end of the field season, the geologist has a fairly sophisticated set of cross-sections that are consistent with the geologic map, working hypotheses, and the logical framework within which samples were collected.
Additional Information from Drill Holes
The ultimate test of the three-dimensional view of the field area is a comparison of the map, cross-sections, and data gained through drilling. A proposed stratigraphy, based on field work, is created for the drillers; this exercise helps them prepare a drilling plan and cost estimates. In return, the drilling provides the geologist with hard data about subsurface geological features. As drilling proceeds, numerous changes to the cross-sections may be necessary. On the other hand, well-founded cross sections may be useful for interpreting core or cuttings that are difficult to classify.
The ideal exploration well is a corehole that has been sampled to its full depth. Wireline coring is a proven technology and eliminates guessing about the rock types and the degree of alteration or fracturing. Procedures for the curation and description of core samples are outlined in Appendix F. If no cores are to be collected, careful evaluation of drill cuttings can be useful; however, it is important to take into consideration the limitations of this method when cuttings from different strata are mixed during their rise to the surface and there is a time lag involved. Onsite petrographic identification of cuttings is aided by hand lens and a binocular microscope, but ideally a geologist should set up a simple thin-section preparation system with basic equipment: quick-setting glue (super-glue ) or epoxy to fix the cuttings on a glass slide, a hot plate to set the glue, and a grinder or abrasives to grind down the cuttings mounted on the slide to the appropriate thickness. Because this method takes only a few minutes per thin section, it allows the geologist to keep up with the drilling operations.
When calibrated against core or cuttings, geophysical logs provide critical information on lithologies, temperatures, and permeability (see Appendix F). Integrating these data—perhaps with the aid of a professional well-log analyst—is time-consuming but well worth the effort if the geologist is to understand the third dimension within the geothermal field.
"Final" Versions of Cross-Sections
At this stage, the field geologist has confidence in the cross sections. If the cross sections are to be used in a publications or report, it is desirable to use a technical illustrator for the final drafting. However created, the final maps and cross sections should be drawn on a plastic base or good quality paper that will exhibit minimal expansion and contraction with changes in humidity. One way to avoid many problems is to prepare the cross sections and map with a computer that has computer-assisted design programs or a geographic information system
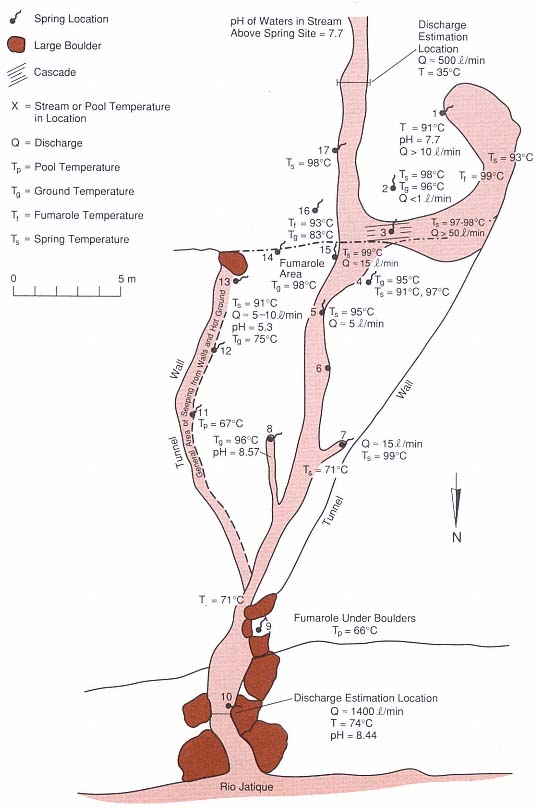
Fig. A.25
Example of a spring map from a site near Azacualpa, Honduras. Descriptions
and measurements of hot springs include details of local landmarks such as streams,
large boulders, and canyon walls.
(Adapted from Eppler et al., 1987.)
program. Distinct patterns or conventional symbols should be used for lithologic units. Horizontal and vertical scales must be included; it is impossible to use either cross sections or maps accurately without clearly labeled scales.
The final cross sections should be laid across the map parallel to the profile lines (Fig.A.26) and several questions should be asked: do the interpretations still appear to be reasonable? Is the scale correct? Do key points on the map (for example, faults) correlate with those same features on the cross section?
The process of creating these maps is lengthy and involves many stages. The last, extremely necessary step is to proof the completed map: checking the data and spelling of place names as well as myriad other details that have been assimilated during the mapping process.
Three-Dimensional Model from Maps, Cross Sections, and Drillhole Data
The final stage of a geovolcanological field study is the compilation of all data, including maps, cross sections, stratigraphic sections, well logs, and rock chemical and physical data. At this stage of a geothermal investigation, if complementary hydrogeochemical and geophysical survey data are available and if there are any drillhole logs, a complete geothermal model might be developed. Cross sections drawn from geovolcanological maps can be greatly enhanced by drill core and cutting information (Appendix F), as discussed above, and the resulting lithological and structural sections can be compared to geophysical lines such as electrical and gravity profiles. This comparison is used in the interpretation of the geophysical data and further constrains the vertical dimension of the geological study. In addition, geochemical surveys suggest areas of recharge and outflow of thermal waters and can constrain rock chemistries of potential reservoirs (Wohletz et al ., 1984).
By developing the superposition and adjustment of the geological, geophysical, and hydrogeochemical cross sections, it is possible to formulate a three-dimensional model. This exercise generally simplifies each of the data sets but produces an internally consistent picture of the subsurface. The degree to which interpretation plays a role in developing a generalized cross sectional illustration depends largely on supporting evidence from analyses and observations that are not typically shown on thematic maps. For example, where hydrovolcanic vents have been mapped, the type and abundance of lithic constituents of pyroclastic deposits indicate the lithology of potential reservoir rocks at depth under the vents. With stratigraphic information, the projected section below the vent can be interpreted and the lithologic and structural character of the potential reservoir can be determined.
This modeling stage can be the most critical stage of a field geothermal study, even if all the desired data sets are not available. A carefully designed model portrays the dominant controlling features of a geothermal system; it is formulated to be easily tested and readily understandable. Such a model combines observed constraints on subsurface conditions with many of the more subtle aspects of field observations that can not always be easily interpreted in their raw form. A model can be a single or several
two-or three-dimensional illustrations or a set of numerical calculations that reproduce the quantitative features of a geothermal system. We emphasize that such a model is a hypothesis—one that can be tested by further detailed geological studies and specific geophysical surveys. The richness of detail portrayed by a model also indicates something about the completeness of the field study. The uncertainties shown by the model are also of great significance because they emphasize missing information and point to potential methods of obtaining that data.
Recommendations and Justification for Drilling
In the final report of a field study, data and observations must be clearly separated from interpretations and conclusions. After documentation of all the studies and their associated conclusions, a formulation of required future work and a summary should be added.
Following an extended field study (whether it has been accomplished by reconnaissance or detailed field work), the project reaches a point when one must justify future work and specify the direction it should take. Field researchers evaluate both their supporting data and their overall inclination about the potential success of a geothermal exploration project. If data and observations are sufficient to produce a three-dimensional model that can be tested by further studies such as geophysical surveys, thermal gradient boreholes, or core drilling, the justification must be succinctly presented and a strategy that will work within this framework should be suggested.
It is our experience that even if shallow thermal gradient wells are indicated, the cost of obtaining core from these boreholes is not a significant additional expense; core information greatly enhances the overall body of data that can be extracted from drilling. The location of these boreholes should be determined by (a) drilling targets specified by various field investigators; (b) ways in which the three-dimensional model can be best tested and augmented by drilling information; and (c) considerations of access and property rights.
The field geologist can also emphasize conclusions about the size of the heat source in locations where young volcanism will allow application of the methods described by Smith and Shaw (1975), which are discussed in Chapter 2. Such estimations are supported by field observations of geothermal manifestations, such as surface heat flow that can be determined from hot spring and fumarolic areas (also discussed in Chapter 3). After the temperature of a potential hydrothermal system is constrained (either through direct, surface-temperature measurements or analysis of hydrothermal-mineral assemblages) conversions of thermal resource to available heat for production and electric power generation can be generalized from graphs shown in Appendix D. Such exercises produce only crude numerical estimations of a geothermal resource, but the information could emphasize the relative potential of a geothermal prospect and help justify or discourage exploration drilling.
The final step in writing a report is a summary that compiles all aspects of the work, including the perceived regional importance; geological, hydrogeochemical, and geophysical conclusions; an overall geothermal model; the projected size and temperature of the potential resource; and recommendations for continuation or culmination of the exploration. Nontechnical language should
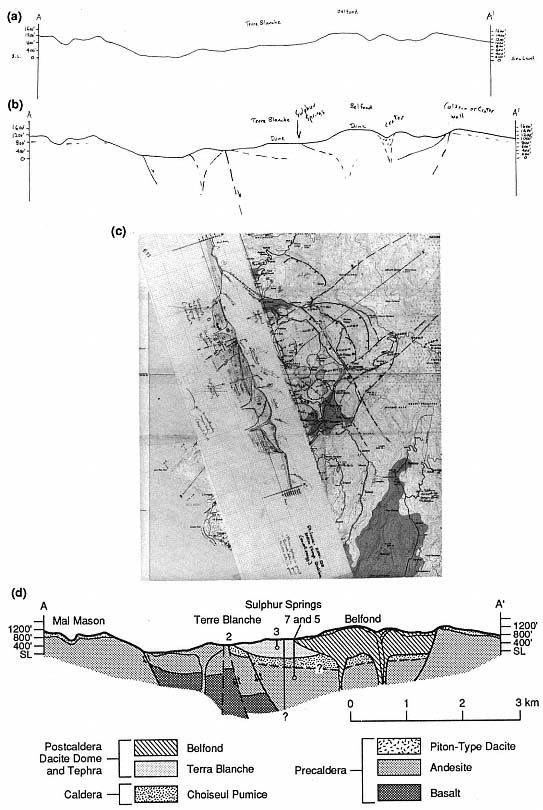
Fig. A.26
Cross-section development shown in stages.
be used wherever possible in this summary because it will be read by individuals of diverse backgrounds. Optimism about the project and its success must be carefully balanced against the data; the possibility that an exploration project does not satisfactorily justify future development is a valid recommendation. If the recommendation is to discontinue a project, it may be necessary to consider culminating work, such as releasing property rights and effecting environmental restoration where field work has infringed (such as might be required if geophysical lines caused topographic modifications or if boreholes must be capped and cemented). On the other hand, if continuation is recommended, aspects of property ownership, environmental restoration (access, governmental restrictions, and logistics), and local operational support should be discussed. These considerations can greatly facilitate promotion of future work.
Appendix B—
Volcanic Rock Classifications and Data
Classification Methods
Classification methods have been developed for pyroclastic materials, lavas, and in some cases, their intrusive equivalents. The following classification schemes are taken from Williams et al . (1982) and Fisher and Schmincke (1984). In general, classification systems include a rock chemistry designation, which may be derived from either a major-element chemical analysis or color and phenocryst content. Some textural classifications are based on hand sample inspection, but in the case of fine-grained rocks and tuffs or rocks that have been altered during diagenesis or metamorphism, it is necessary to use in addition a textural analysis by petrographic or scanning electron microscope.
Chemical Classification
Most volcanic rocks are composed of silicate minerals and glass; notable exceptions are carbonatites, which are composed of carbonate minerals, and rare lavas that are dominated by magnetite or sulfur. The SiO2 content is the most general basis for classification: Silicic (acid) rocks have >66 wt%, intermediate rocks range from 52 to 66 wt%, mafic (basic) rocks have between 45 to 52 wt%, and ultramafic (ultrabasic) rocks <45 wt%. Alkali-silica variation diagrams (see Fig. 1.3) are widely used to classify volcanic rocks. Table B.1 shows average major-element chemical compositions for common volcanic rock types in order of increasing silica content.
A simple petrographic technique can also be used to estimate the SiO2 content of volcanic rocks that contain glass. This technique is based on the decreasing refractive index of nonhydrated glass with increasing SiO2 content; such a relationship is shown in Fig. B.1.
|
||||||||||||||||||||||||||||||||||||||||||||||||||||||||||||||||||||||||||||||||||||||||||||||||||||||||||||||||||||||||||||||||||||||||||||||||||||||||||||||||||||||||||||||||
Williams et al . (1982) demonstrated that a reasonable chemical classification can be assigned to rocks and tephra containing phenocrysts because these minerals have characteristic SiO2 contents that are a key to the bulk composition. Williams et al . (1982) listed the SiO2 contents of felsic and mafic minerals as a useful guide.
Identification of the phenocryst content also makes it possible to use the international classification scheme of Streckheisen (1967), which was discussed in Chapter 1 (Fig. 1.3).
|
Where phenocryst abundances are significant (>4%), the rock name can be prefixed by the names of the significant phenocrysts in order of increasing abundance (for example, hornblende-biotite rhyodacite, pyroxene andesite, and olivine basalt).
Textural Classification
Textural classification can be very detailed, especially if it is determined by petrographic microscopic observation. Williams et al .
Fig. B.1
The range of glass refractive index as a function
of silica content is shown by the shaded
band; the average values for several volcanic
rock types are indicated by dots.
(Adapted from Best, 1982.)
(1982) described and illustrated many textural features of volcanic rocks, but for the sake of simplicity here, we limit lava textural terminology to some hand-sample features (Table B.2).
Pyroclastic rocks in general are called tephra where they are unconsolidated and pyroclastic rock where they are consolidated. In the case of ash-size pyroclasts (see Table B.3), the unconsolidated deposit is simply termed ash , whereas the consolidated deposit is denoted tuff . Fisher and Schmincke (1984) based the textural classification of well-sorted pyroclasts on their granulometric character. For volcanic rocks composed of poorly sorted pyroclasts, Fisher and Schmincke advocated the system shown in Table B.4; however, some samples may contain a mixture of pyroclasts that spans the
|
||||||||||||||||||
size categories (Table B.3), and in that case, the ternary classification system shown in Fig. B.2 is prescribed.
Because pyroclastic rocks are composed of various proportions of vitric, crystal, and lithic constituents of juvenile, cognate, or accidental origin, the classification should also be made according to the proportion of these constituents in a sample, as is illustrated in Fig. B.3.
Finally, where the environment of deposition or mode of emplacement can be determined (as discussed in Chapter 1), classification may include such a designation. For example, tuff deposited in a marine environment is called submarine tuff , which distinguishes it from subaerial or lacustrine tuff. Tuff deposited by fallout is denoted fallout tuff, but tuff emplaced by pyroclastic flow is generally termed ash-flow tuff. Reworked tuff may be aeolian tuff where wind-reworked or fluvial tuff where deposited by a river or a stream. Combining these classification schemes produces terms such as crystal-lithic lapilli tuff, lithic tuffaceous breccia , or lithic-vitric fallout agglomerate .
Density
Volcanic rocks show a range of densities—from <1.0 Mg/m3 for silicic pumice to ~2.9 Mg/m3 for basalt. Because of the degree of vesiculation, crystallization, fragmentation, and postemplacement compaction, it is clear that after eruption, volcanic rock densities change from those of their parental magma. Bottinga and Weill
|
|||||||||||||||||||||||||||||||
(1970) demonstrated the relationship of magma density to composition as a function of temperature. With increasing water content, magma densities generally decrease—as do their vesiculated volcanic equivalents. Table B.5 lists some average densities for common volcanic and intrusive rock types. The densities for intrusive equivalents exhibit maximum ranges for a given composition, whereas those for volcanic glasses fall in the minimum ranges. Because tuffs have pore space as a result of vesicles and intergranular voids, their densities (shown in Table B.5 for silicic rocks) are commonly 40 to 60% of those for their glassy lava equivalents. Vesicles may make up as much as 80% of the volume of pumices, for example.
Porosity and Permeability
Although there is no direct relationship between porosity and permeability, both of these rock properties are extremely important when assessing the reservoir potential of a given rock type. Porosity in volcanic rocks is mainly defined by the abundance of vesicles. In the case of pyroclastic rocks, grain size distribution and sorting determine the packing density of clasts. The porosity of a pyroclastic rock generally imparts a primary permeability; if subjected to hydrothermal fluid circulation, this permeability may change as a result of the dissolution of glass and the growth of secondary minerals. As we said earlier in the section on density, the porosity of pyroclastic rocks may reach 80%, but for fresh, nonaltered pyroclastic rock, porosity is generally in the range of 40 to 60%. Lavas, on the other hand, exhibit porosity only if they are brecciated during emplacement or contain vesicles and other gas cavities such as lithophysae; in these cases, lava porosity is generally <20%.
The bulk permeability of volcanic rocks is a function of primary and secondary permeability. Primary permeability (sometimes called formation permeability ), as discussed above, develops from the original texture of the rock (for example, interconnected pores and vesicles and grain boundaries). In contrast, secondary permeability (sometimes called fracture permeability ) is promoted by rock fracture and foliation, and where it occurs, it is generally the dominant type of permeability. Volcanic rock fracture has numerous origins, such as tectonic movement and proximity to faults, differential compaction that causes stress fractures, cooling contractions, thermal spallation, and eruptive/emplacement brecciation. Typical permeabilities for all rock types range from 10-20 m2 (0.01 µDarcy) to 10-7 m2
|
||||||||||||||||||||||||||||||||||||||||||||||||||

Fig. B.2
Classification scheme for pyroclastic samples
composed of a mixture of fragment sizes;
the term lapilli-tuff is
synonymous with lapillistone.
(Adapted from Schmid, 1981.)
Fig. B.3
Classification scheme for pyroclastic samples
composed of a mixture of constituents.
(Adapted from Cook, 1965.)
|
||||||||||||||||||||||||||||||||||||||||||||||||||||||||||||||||||||||||||||||||||||||||||||
(0.1 MDarcy), as shown in Table B.6. The permeabilities of unaltered pyroclastic rocks should be similar to those of silty and clean sand—in the range of 10-14 to 10-10 m2 (0.01 to 100.0 Darcy).
Geophysical Properties
A set of geophysical properties for a volcanic rock includes its elastic constants, strength, seismic velocity, heat capacity and thermal conductivity, radioactivity, electrical resistivity, and well-log parameters. Although data for many volcanic rock types are sparse, in Tables B.7 through B.13 we list some typical values [chiefly from Clark (1966) and Carmichael (1984)]. However, volcanic rocks show considerable variability in their geophysical properties and these values listed below are provided as examples—useful for rough calculation but not for strict application in geothermal exploration. Needless to say, specific data should be obtained for volcanic rocks in the field of interest.
|
|
|||||||||||||||||||||||||||||||||||||||||||||||||||||||||||||||||||||||||||
|
||||||||||||||||||||||||||||||||||||||||||||||||||||||||||||||||||||||||||||||||||||
|
||||||||||||||||||||||||||||||||||||||||||||||||||||||
|
||||||||||||||||||||||||||||||||||||||||||||||||||||||||||||||||||||||||||||||||||||||||||||||||||||||||||||
|
||||||||||||||||||||||||||||||||||||||||||||||||
|
||||||||||||||||||||||||||||||||||||
|
Appendix C—
Notation
|
|
|
|
|
|
Appendix D—
Conversion Factors, Steam Properties, and Conversion of Geothermal Heat to Electricity
Conversion Factors
Conversion factors shown in Table D.1 are presented as basic equivalents in English, cgs (centimeter/gram/second), and SI (International System) units to facilitate computations in volcanological and mechanical engineering models.
Thermodynamic Properties of Steam
Throughout this book, heat flow through rocks and heat transfer to water are discussed as important concepts to consider when attempting to understand volcanic and hydrothermal behavior. Although water is not pure in volcanic hydrothermal systems and contains variable amounts of dissolved gases, ionic species, and molecular species, it is possible to estimate the pressure/volume relationships of fluids on a first-order approximation by considering the phase relationships of pure water. We recommend using the U.S. National Bureau of Standards steam tables (Haar et al ., 1984), which are published in SI units for temperatures between ambient (273 K) and 1273 K at pressures from atmospheric (0.1 MPa) to 1500 MPa (15 kbar). The quick-reference table in this appendix (Table D.2) lists values for some of these conditions.
|
||||||||||||||||||||||||||||||||||||||||||||||||||||||||
Conversion of Geothermal Heat to Electricity
Production of electricity from a geothermal heat source is limited by the Second Law of Thermodynamics, which specifies that it is impossible to convert all the heat energy from a system into mechanical—hence, electrical—energy (Gokcen, 1975). For an idealized geothermal power conversion process, the total maximum work that can be extracted from a geothermal fluid is often termed availability (B), which is given by

where D H and D S are the enthalpy and entropy differences between ambient conditions and the geothermal fluid's wellhead pressure and temperature; Ta = ambient temperature. Figure D.1 (a) is a plot of D B as a function of wellhead temperature for saturated vapor and saturated liquid cooled to three different ambient temperatures. The actual amount of work converted to electrical power (Wnet ) is a function of the cycle efficiency of the power plant (h c )

Figure D.1 (b) shows typical cycle efficiencies for geothermal plants as a function of wellhead temperature for a range of condensing temperatures. The discarded or reinjected fluids above ambient temperatures are not counted as thermodynamic losses in calculations of cycle efficiency; thus h c can be proportionately larger than the utilized efficiency for some applications (Tester, 1982).
Fig. D.1
(a) Plot of D B as a function of wellhead temperature
for saturated vapor and saturated liquid that have
cooled to three different ambient temperatures.
(b) Typical cycle efficiencies for geothermal plants
are shown as a function of wellhead temperature
for a range of condensing temperatures.
(Adapted from Tester, 1982.)
|
||||||||||||||||||||||||||||||||||||||||||||||||||||||||||||||||||||||||||||||||||||||||||||||||||||||||||||||||||||||||||||||||||||||||||||||||||||||||||||||||||||||||||||||||||||||||||||||||||||||||||||||||||||||||||||||||||||||||||||||||||||||||||||||||||||||||
|
||||||||||||||||||||||||||||||||||||||||||||||||||||||||||||||||||||||||||||||||||||||||||||||||||||||||||||||||||||||||||||||||||||||||||||||||||||||||||||||||||||||||||||||||||||||||||||||||||||||||||||||||||||||||||||||||||||||||||||||||||||||||||||||||||||||||
|
||||||||||||||||||||||||||||||||||||||||||||||||||||||||||||||||||||||||||||||||||||||||||||||||||||||||||||||||||||||||||||||||||||||||||||||||||||||||||||||||||||||||||||||||||||||||||||||||||||||||||||||||||||||||||||||||||||||||||||||||
|
||||||||||||||||||||||||||||||||||||||||||||||||||||||||||||||||||||||||||||||||||||||||||||||||||||||||||||||||||||||||||||||||||||||||||||||||||||||||||||||||||
Appendix E—
Heat Flow (Two-Dimensional Diffusion Code)
Time-dependent heat diffusion expressed by Fick's second law of diffusion [Eq. (2-9); Chapter 2] is an important tool for evaluating thermal resource [Eq. (2-6); Chapter 2]. Because the temporal and spatial variation of temperature in a sequence of rocks of varying character is the desired solution, Eq. (2-9) can be written in a two-dimensional, nonlinear Cartesian form using thermal conductivity (kt ) and temperature (T):
where ktx and kty are the thermal conductivities in the x and y directions, respectively. The following computer program uses a two-dimensional, finite-difference numerical solution based on an algorithm given by Harbaugh and Bonham-Carter (1970). It calculates time-dependent heat diffusion for an array of variable rock properties, using an averaging technique to obtain the spatially varying thermal conductivity coefficients.
Important initial conditions include regional thermal gradient, variation of vertical and horizontal conductivities as a function of user-specified stratigraphy, and time and spatial step size. This code is written for interactive use; results are printed out to an external file as well as to the screen.
The program requests
(1) the number of rows and columns in the array that represents a vertical cross section of the desired model,
(2) the spatial and temporal step for the array, and
(3) the number of rock types.
After the numerical representation of the simulated cross-section is entered by rock type, the array is saved to an external file for
access in future runs. By specifying conductivity coefficients for each rock type, the program calculates effective convective coefficients for locations in which vertical conductivities are greater than horizontal ones. Finally, the program calculates whether the specified time step is small enough to result in stable solutions for the desired mesh.
Source Code Listing
The source code, listed below, is written in VAXÔ FORTRAN, which makes use of virtual memory. Implementation of this program on a personal computer requires a FORTRAN compiler, and the source code may require some changes of array sizes, variable declarations, and assignment of external files. Standard code format requires that each statement is indented at least 7 spaces and line continuation characters (denoted here as '&') are typed in the sixth space of each line.
c............program 2DHF.....................
c........... Two dimensional heat diffusion in heterogeneous
c............materials by solution of Fick's second law
c...........of diffusion, utilizing finite difference technique
c...........of Harbaugh and Bonham-Carter,
c..........."Computer Simulation in Geololgy",
c...........Wiley Interscience, 1970, p. 225
common krock(50,50),temp(50,50),tempi(50,50),
&ntempi(50,50),coefx(50,50),coefy(50,50),ntgradi(50),
&ntemp(1000,50,50),l(50),tempnew(50,50),
&ntgrad(1000,50)
write(5,10)
1 format('1','* * * * * * * 2-D HETEROGENEOUS',
&'HEAT FLOW* * * * * * * * * * * * *')
c....Define grid size and geology..................
write(5,10)
10 format(///,' Enter ncol, nrow, dxy (km), and nrock',/,
&'(number of rock types up to 4, excluding the magma,'/,
&'for the computational mesh:',/)
read(5,*) ncol, nrow, ddxy, nrock
dxy = ddxy* 1.0e+05
nj = ncol/2
write(5,15)
15 format(/,' Enter magma temperature and',
&'regional geothermal gradient (deg C/km):',/)
read(5,*) tm, tg
cv = 0.6
c....Read in geologic stucture and rock characteristics..
50 call grid(nrow,ncol,nrock,tm,tg,dxy,ddxy,cv,coef0,
&coef1x,coef1y,coef2x,coef2y,coef3x,coef3y,coef4x,
&coef4y,conv0,conv1,conv2,conv3,conv4)
c.....Stabilize initial heat flow in grid...........
hfb = 1.0
hft = 1.0
stab = 0.0
call stabil (stab,hfb,hft,nrow,ncol,nj,tm,tg,dxy,cv,
&coef1x,coef1y,conv0,conv1,conv2,conv3,conv4)
c.....Set dt for time step...................
90 write(5,92) hfb,hft
92 format(/,' hfb = ',f7.4,'; hft = ',f7.4,//,
&'What is the time-step (yrs)?',/,
&'If time-step is too large, program will go unstable',//)
read(5,*) dt
dt = dt*3.1536e+7
c.....Reset grid ..................
do 94 i=1,nrow
do 93 j=1,ncol
temp(i,j) = tempi(i,j)
if(krock(i,j).eq.0) then
coefx(i,j) = coef0/cv
coefy(i,j) = coef0/cv
end if
93 continue
94 continue
nt = 1
ntt = 0
factor = dt/dxy**2.0
tmax = 0.0
tmin = tm
itt = 1
write(5,95)
95 format(//,' Grid all set up for calculation,',/,
&'do you wish to continue?<y>')
read(5,'(a)') ano 1
if(ano1.eq.'n'.or.ano1.eq.'N') go to 200
write(5,96)
96 format(",//,10x,' nt',5x,' tmax ',5x,' tmin',/)
c....Begin diffusion loop.........
100 call diffus (stab,hfb,hft,ntt,nt,tmax,tmin,nrow,nj,
& ncol,factor,conv0,conv1,conv2,conv3,conv4)
c....Record every 1000*dt calculation of thermal state.....
id = 1.0/ddxy + 0.5
do 170 i=1,nrow
do 160 j=1,ncol
ntemp(nt,i,j) = temp(i,j) + 0.5
if(i.eq.id) ntgrad(nt,j) = (temp(i,j)-20.0) + 0.5
160 continue
170 continue
write(5,175)nt,tmax,tmin
175 format(10x,i3,5x,f6.2,5x,f6.2)
if(nt.eq.1.or.nt.eq.5.or.nt.eq.(itt*10)) then
write(5,180)
read(5,'(a)') ano
if(ano.eq.'y'.or.ano.eq.'Y') go to 90
write(5,181)
read(5,'(a)') ayes1
if(ayes1.eq.'n'.or.ayes1.eq.'N') go to 190
end if
180 format(//,' Do you wish to change time step? <n>')
181 format(' Do you wish to continue? <y>')
190 if(tm.ge.300.0) then
if(tmax.le.300.0) go to 200
if(nt.ge.199.or.ntt.lt.1000) go to 200
end if
if(ntt.eq.1000) ntt = 0
if(ayes1.eq.'n'.or.ayes1.eq.'N') go to 200
nt = nt + 1
if(nt.gt.(itt*10)) itt = itt + 1
go to 100
c....Write out results, timef (ka).................
200 ncy = nt
nccy = ntt
timef = ((ncy*1000.0+nccy)*dt)/3.1536e+07
tntt = (dt*1000.0)/3.1536e+07
tint = 0.0
space = dxy/1.0e+05
time = 1.0
write(5,250) timef,tmax,nt,tntt
250 format('1',///,' Calculation Complete',/,' ',
&'___________________________________________',//,
&' Cooling time = ',8x,f10.1,' years',/,
&' Maximum magma temperature = ',f5.1,' deg C'/,
&' Number of plots = ',i3,'at',f10.2,' year intervals',//,
&' Do you wish printout of initial geometry? <y>',//)
read(5,'(a)') ano
if(ano.eq.'n'.or.ano.eq.'N') goto 320
c....Initial time plots...............
write(5,309) space, tint, (l(j),j=1,ncol)
do 300 i=1,nrow
write(5,311) i, (krock(i,j), j=1,ncol)
300 continue
309 format('1',' 2-D HEAT FLOW PLOT',//,
&' Grid spacing = ',f4.2,' km',
&' Time = ',f12.1,' yrs ',//,5x,<ncol>i4,//)
310 format('1',' 2-D HEAT FLOW PLOT',//,
&' Grid spacing = ',f4.2,' km',
&' Time = ',f12.1,' yrs',//,
&5x,<ncol>i4,/,' d/km',<ncol>i4,//,' 0',2x,<ncol>('20'))
311 format(",i2,2x,<ncol>i4)
320 write(5,330)
330 format(/,' Do you wish printout of init. temperatures?<y>')
read(5,'(a)') ano
if(ano.eq.'n'.or.ano.eq.'N') goto 350
write(5,310) space, tint, (l(j),j=1,ncol),(ntgradi(j),j=1,ncol)
do 340 i=1,nrow
write(5,311) i, (ntempi(i,j),j=1,ncol)
340 continue
c....Calculated-time plots............
350 if(ano1.eq.'n'.or.ano1.eq.'N') go to 402
360 write(5,370)
370 format('For which time interval do you wish a plot?',/,
&' enter 0 for initial time plot, (-1) for none.')
read(5,*)time
if(time.eq.-1.0) go to 400
if(time.eq.0.) go to 320
ncy = time
nccy = 0
if(ncy.eq.nt) nccy = ntt
tint = (ncy*1000.0+nccy)*dt/3.1536e+07
write(5,310) space,tint,(l(j),j=1,ncol),
&(ntgrad(ncy,j),j=1,ncol)
do 380 i=1,nrow
write(5,311)i, (ntemp(ncy,i,j),j=1,ncol)
380 continue
write(5,390)
390 format(",'Do you wish another time plot?<y>')
read(5,'(a)')ano
if(ano.eq.'n'.or.ano.eq.'N') goto 400
go to 360
400 if(ayes1.eq.'n'.or.ayes1.eq.'N') then
402 write(5,405)
read(5,'(a)')ano
if(ano.eq.'n') go to 409
ayes 1 = 'y'
go to 190
end if
405 format(/,'Do you wish to continue this calculation? <y>')
409 write(5,410)
410 format(/,'Do you wish to reset the conductivities and',
&'time step? <n>')
read(5,'(a)')ayes
if(ayes.eq.'y') go to 50
500 stop
end
c.........SUBROUTINE GRID.......................
subroutine grid (nrow,ncol,nrock,tm,tg,dxy,ddxy,cv,
&coef0,coef1x,coef1y,coef2x,coef2y,coef3x,coef3y,
&coef4x,coef4y,conv0,conv1,conv2,conv3,conv4)
common krock(50,50),temp(50,50),tempi(50,50),
&ntempi(50,50),coefx(50,50),coefy(50,50),ntgradi(50),
&ntemp(1000,50,50),l(50),tempnew(50,50),
&ntgrad(1000,50)
open(unit=8,status='unknown',file='2dhdif.dat')
c....Set up initial rock geometry in grid......
write(5,10)
10 format(//' Read rock-grid file? <y>')
read(5,'(a)') ano
if(ano.eq.'n'.or.ano.eq.'N') go to 30
do 20 i=1,nrow
read(8,45) (krock(i,j), j=1,ncol)
20 continue
go to 50
30 write(5,35)
35 format(/,'Enter rock types in grid by row,',/,
&' 0 = magma, 1 for deepest basement rock,',
&'2,3,4 for other rocks:',/)
do 40 i=1,nrow
read(5,*) (krock(i,j), j=1,ncol)
write(8,45) (krock(i,j), j=1,ncol)
40 continue
45 format(<ncol>i3)
c......Enter x and y conductivity constants.......
c......set constant volume heat capacity .........
c......for cp = 0.24 cal/g-deg, rho = 2.5 g/cm3..
c......to cv = 0.60..........................................
50 coef0 = 0.005
coef = coef0*1000.0
conv0 = 3.0
convf = 1000.0
write(5,51) coef
51 format(/,' Enter x and y conductivities (mcal/cm-s-deg)',
&'by rock type.',/,' For veritcal convection y > x,',
&' for horizontal convection (to the right) x > y):'/,
&' Magma conductivity = ',f3.1,' mcal/cm-s-deg'//,
&' Rock 1 conductivities = ')
read(5,*) coef1x,coef1y
conv1 = 1.0
if(coef1y.gt.coef1x) then
write (5,59)
read(5,'(a)') ayes
if(ayes.eq.'y'.or.ayes.eq.'Y')
& conv1 = convf*coef1y/coef1x
end if
if(coef1x.gt.coef1y) then
write (5,59)
read(5,'(a)') ayes
if(ayes.eq.'y'.or.ayes.eq.'Y')
& conv1 = -convf* coef1x/coef1y
end if
if(nrock.eq.1) go to 60
write(5,53)
53 format(/,' Rock 2 conductivities = ')
read(5,*) coef2x,coef2y
conv2 = 1.0
if(coef2y.gt.coef2x) then
write (5,59)
read(5,'(a)') ayes
if(ayes.eq.'y'.or.ayes.eq.'Y')
& conv2 = convf* coef2y/coef2x
end if
if(coef2x.gt.coef2y) then
write (5,59)
read(5,'(a)') ayes
if(ayes.eq.'y'.or.ayes.eq.'Y')
& conv2 = -convf* coef2x/coef2y
end if
if(nrock.eq.2) go to 60
write(5,55)
55 format(/,' Rock 3 conductivities = ')
read(5,*) coef3x,coef3y
conv3 = 1.0
if(coef3y.gt.coef3x) then
write (5,59)
read(5,'(a)') ayes
if(ayes.eq.'y'.or.ayes.eq.'Y')
& conv3 = convf* coef3y/coef3x
end if
if(coef3x.gt.coef3y) then
write (5,59)
read(5,'(a)')ayes
if(ayes.eq.'y'.or.ayes.eq.'Y')
& conv3 =-convf* coef3x/coef3y
end if
if(nrock.eq.3) go to 60
write(5,57)
57 format(/,' Rock 4 conductivities =')
read(5,*) coef4x,coef4y
conv4 = 1.0
if(coef4y.gt.coef4x) then
write (5,59)
read(5,'(a)') ayes
f(ayes.eq.'y'.or.ayes.eq.'Y')
& conv4 = convf*coef4y/coef4x
end if
if(coef4x.gt.coef4y) then
write (5,59)
read(5,'(a)') ayes
if(ayes.eq.'y'.or.ayes.eq.'Y')
& conv4 = -convf*coef4x/coef4y
end if
59 format(/'Is this rock unit convective?<n>')
c....Place initial temperatures in grid.........
60 idd = 1.0/ddxy + 0.5
do 80 i=1, nrow
do 70 j=1,ncol
l(j) = j
if(krock(i,j).eq.0) then
tempi(i,j) = tm
ntempi(i,j) = tempi(i,j) + 0.5
end if
if(krock(i,j).gt.0) then
tempi(i,j) = 20.0 + (tg*i*dxy/1.0e+05)
ntempi(i,j) = tempi(i,j) + 0.5
end if
if(i.eq.idd) ntgradi(j) = (tempi(idd,j)-20.0) + 0.5
70 continue
80 continue
c....Place diffusivity coefficients in grid.........
do 100 i=1, nrow
do 90 j=1,ncol
if(krock(i,j).eq.0) then
coefx(i,j) = coef0/cv
coefy(i,j) = coef0/cv
end if
if(krock(i,j).eq.1) then
coefx(i,j) = 0.001*coef1x/cv
coefy(i,j) = 0.001*coef1y/cv
end if
if(nrock.eq.1) go to 90
if(krock(i,j).eq.2) then
coefx(i,j) = 0.001*coef2x/cv
coefy(i,j) = 0.001*coef2y/cv
end if
if(nrock.eq.2) go to 90
if(krock(i,j).eq.3) then
coefx(i,j) = 0.001*coef3x/cv
coefy(i,j) = 0.001*coef3y/cv
end if
if(nrock.eq.3) go to 90
if(krock(i,j).eq.4) then
coefx(i,j) = 0.001*coef4x/cv
coefy(i,j) = 0.001*coef4y/cv
end if
90 continue
100 continue
close(unit=8,status='keep')
return
end
c..........SUBROUTINE STABIL.......................
Subroutine stabil (stab,hfb,hft,nrow,ncol,nj,tm,tg,dxy,cv,
& coef1x,coef1y,conv0,conv1,conv2,conv3,conv4)
common krock(50,50),temp(50,50),tempi(50,50),
&ntempi(50,50),coefx(50,50),coefy(50,50),ntgradi(50),
&ntemp(1000,50,50),l(50),tempnew(50,50),
&ntgrad(1000,50)
if(stab.eq.1.0) go to 100
10 write(5,10)
10 format(///,' Stabilizing ambient heat flow')
do 30 i=1,nrow
do 20 j=1,ncol
temp(i,j) = 20.0 + (tg*i*dxy/1.0e+05)
if(krock(i,j).eq.0)coefx(i,j) = 0.001*coef1x/cv
coefy(i,j) = coefx(i,j)
20 continue
30 continue
nt = 0
ntt = 0
tob = tempi(nrow,nj)
tot = tempi(1,nj)
tmax = 0.0
tmin = tm
dt = 10.0 * 3.1536e+7 * ((dxy/1.0e+05)**2.0)
factor = dt/dxy**2.0
40 call diffus (stab,hfb,hft,ntt,nt,tmax,tmin,nrow,nj,
& ncol,factor,conv0,conv1,conv2,conv3,conv4)
if(ntt.eq.2000) go to 100
tnb = temp(nrow,nj)
tnt = temp(1,nj)
hf = hfb
tn = tnb
to = tob
i2 = 1
50 if(i2.eq.2) then
hf = hft
tn = tnt
to = tot
end if
if(tn.gt.(to+0.01)) hf=hf+0.1
if(tn.gt.(to+0.005)) hf=hf+0.01
if(tn.gt.(to+0.001)) hf=hf+0.002
if(tn.gt.(to+0.0005)) hf=hf+0.0005
if(tn.gt.(to+0.0001)) hf=hf+0.00002
if(tn.gt.(to+0.00005))hf=hf+0.000005
if(tn.lt.(to-0.01)) hf=hf-0.1
if(tn.lt.(to-0.005)) hf=hf-0.01
if(tn.lt.(to-0.001)) hf=hf-0.002
if(tn.lt.(to-0.0005)) hf=hf-0.0005
if(tn.lt.(to-0.0001)) hf=hf-0.00002
if(tn.lt.(to-0.0001)) hf=hf-0.000005
if(i2.eq.1) then
hfb = hf
tob = tn
end if
if(i2.eq.2) then
hft = hf
tot = tn
end if
if(i2.eq.2) go to 40
i2 = i2 + 1
go to 50
100 stab = 1.0
return
end
c.........SUBROUTINE DIFFUS...................
subroutine diffus (stab,hfb,hft,ntt,nt,tmax,tmin,nrow,nj,
& ncol,factor,conv0,conv1,conv2,conv3,conv4)
common krock(50,50),temp(50,50),tempi(50,50)
&ntempi(50,50),coefx(50,50),coefy(50,50),ntgradi(50),
&ntemp(1000,50,50),|(50),tempnew(50,50),
&ntgrad(1000,50)
character large*28/' Time-step too large!'/
c....Begin diffusional loop..........
c....First determine heat flow to stabilize grid...
105 ntt = ntt + 1
tmaxnew = 0.0
do 140 i=1,nrow
do 130 j=1,ncol
c......Calculate new temperatures from diffusion
equation.
c......with appropriate boundary conditions and
diffusion.
c......coefficients......................................
if(i.eq.1.and.j.eq.1) go to 110
if(i.eq.1.and.j.gt.1.and.j.lt.ncol) go to 112
if(i.eq.1.and.j.eq.ncol) go to 114
if(i.gt.1.and.i.lt.nrow.and.j.eq.ncol) go to 116
if(i.eq.nrow.and.j.eq.ncol) go to 118
if(i.eq.nrow.and.j.gt.1.and.j.lt.ncol) go to 120
if(i.eq.nrow.and.j.eq.1) go to 122
if(i.gt.1.and.i.lt.nrow.and.j.eq.1) go to 124
c....Non-boundary cells with convection.................c
convy = 1.0
convx = 1.0
if(stab.eq.0.0) go to 109
if(krock(i,j).eq.0) then
if(conv0.lt.0.0) convx = -conv0
if(conv0.gt.0.0) convy = conv0
end if
if(krock(i,j).eq.1) then
if(conv1.lt.0.0) convx = -conv1
if(conv1.gt.0.0) convy = conv1
end if
if(krock(i,j).eq.2) then
if(conv2.lt.0.0) convx = -conv2
if(conv2.gt.0.0) convy = conv2
end if
if(krock(i,j).eq.3) then
if(conv3.lt.0.0) convx = -conv3
if(conv3.gt.0.0) convy = conv3
end if
if(krock(i,j).eq.4) then
if(conv4.lt.0.0) convx = -conv4
if(conv4.gt.0.0) convy = conv4
end if
109 cx1 = (convy * coefx(i,j) + coefx(i+1,j))/2.0
cx2 = (coefx(i-1,j) + coefx(i,j))/2.0
cx = (cx1 + cx2)/2.0
cy1 = (convx * coefy(i,j) + coefy(i,j+1))/2.0
cy2 = (coefy(i,j-1) + coefy(i,j))/2.0
cy = (cy1 + cy2)/2.0
tempnew(i,j) = temp(i,j) + factor *-
& ( (temp(i-1,j)*cx2) + (temp(i+1,j)*cx1) -
& (2.0*temp(i,j)*cx) +
& (temp(i,j-1)*cy2) + (temp(i,j+1)*cy1) -
& (2.0*temp(i,j)*cy))
go to 125
c....Top left corner cell.......................
110 cx1 = (coefx(i,j) + coefx(i+1,j))/2.0
cx2 = (2.0 * coefx(i,j))/2.0
cx = hft * (cx1 + cx2)/2.0
cy1 = (coefy(i,j) + coefy(i,j+1))/2.0
cy2 = (2.0 * coefy(i,j))/2.0
cy = (cy1 + cy2)/2.0
tempnew(i,j) = temp(i,j) + factor *
& ((temp(i,j+1)*cy1) - (temp(i,j)*cy) +
& (temp(i+1,j)*cx1) - (temp(i,j)*cx))
go to 125
c....Top margin of grid........................c
112 cx1 = (coefx(i,j) + coefx(i+1,j))/2.0
cx2 = (2.0 * coefx(i,j))/2.0
cx = hft * (cx1 + cx2)/2.0
cy1 = (coefy(i,j) + coefy(i,j+1))/2.0
cy2 = (coefy(i,j-1) + coefy(i,j))/2.0
cy = (cy1 + cy2)/2.0
tempnew(i,j) = temp(i,j) + factor *
& ((temp(i,j-1)*cy2) + (temp(i,j+1)*cy1)-
& (2.0*temp(i,j)*cy) +
& (temp(i+1,j)*cx1) - (temp(i,j)*cx))
go to 125
c....Top right corner cell.......................
114 cx1 = (coefx(i,j) + coefx(i+1,j))/2.0
cx2 = 2.0 * coefx(i,j))/2.0
cx = hft * (cx1 + cx2)/2.0
cy1 = (2.0 * coefy(i,j))/2.0
cy2 = (coefy(i,j-1) + coefy(i,j))/2.0
cy = (cy1 + cy2)/2.0
tempnew(i,j) = temp(i,j) + factor*
& ((temp(i,j-1)*cy2) - (temp(i,j)*cy) +
& (temp(i+1,j)*cx1) - (temp(i,j)*cx))
go to 125
c....Right margin of grid.......................
116 cx1 = (coefx(i,j) + coefx(i+1,j))/2.0
cx2 = (coefx(i-1,j) + coefx(i,j))/2.0
cx = (cx1 + cx2)/2.0
cy1 = (2.0 * coefy(i,j))/2.0
cy2 = (coefy(i,j-1) + coefy(i,j))/2.0
cy = (cy1 + cy2)/2.0
tempnew(i,j) = temp(i,j) + factor *
& ( (temp(i,j-1)*cy2) - (temp(i,j)*cy) +
& (temp(i-1,j)*cx2) + (temp(i+1,j)*cx1)-
& (2.0*temp(i,j)*cx))
go to 125
c....Bottom right corner cell, maintain heat flow.........
118 cx1 = (2.0 * coefx(i,j))/2.0
cx2 = (coefx(i-1,j) + coefx(i,j))/2.0
cx = hfb * (cx1 + cx2)/2.0
cy1 = (2.0 * coefy(i,j))/2.0
cy2 = (coefy(i,j-1) + coefy(i,j))/2.0
cy = (cy1 + cy2)/2.0
tempnew(i,j) = temp(i,j) + factor *
& ( (temp(i,j-1)*cy2) - (temp(i,j)*cy) +
& (temp(i-1,j)*cx2) - (temp(i,j)*cx))
go to 125
c....Bottom margin of grid, maintain heat flow.........
120 cx1 = (2.0 * coefx(i,j))/2.0
cx2 = (coefx(i-1,j) + coefx(i,j))/2.0
cx = hfb * (cx1 + cx2)/2.0
cy1 = (coefy(i,j) + coefy(i,j+1))/2.0
cy2 = (coefy(i,j-1) + coefy(i,j))/2.0
cy = (cy1 + cy2)/2.0
tempnew(i,j) = temp(i,j) + factor *
& ((temp(i,j-1)* cy2) + (temp(i,j+1)*cy1)-
& (2.0*temp(i,j)*cy) +
& (temp(i-1,j)*cx2) - (temp(i,j)*cx))
go to 125
c....Bottom left corner cell, maintain heat
flow..............
122 cx1 = (2.0 * coefx(i,j))/2.0
cx2 = (coefx(i-1,j) + coefx(i,j))/2.0
cx = hfb * (cx1 + cx2)/2.0
cy1 = (coefy(i,j) + coefy(i,j+1))/2.0
cy2 = (2.0 * coefy(i,j))/2.0
cy = (cy1 + cy2)/2.0
tempnew(i,j) = temp(i,j) + factor *
& ((temp(i,j+1)*cy1) - (temp(i,j)*cy) +
& (temp(i-1,j)*cx2) - (temp(i,j)*cx))
go to 125
c....Left margin of grid........................
124 cx1 = (coefx(i,j) + coefx(i+1,j))/2.0
cx2 = (coefx(i-1,j) + coefx(i,j))/2.0
cx = (cx1 + cx2)/2.0
cy1 = (coefy(i,j) + coefy (i,j+1))/2.0
cy2 = (2.0 * coefy (i,j))/2.0
cy = (cy1 + cy2)/2.0
tempnew(i,j) = temp(i,j) + factor *
& ((temp(i,j+1)*cy1) - (temp(i,j)*cy) +
& (temp(i-1,j)*cx2) + (temp(i+1,j)*cx1)-
& (2.0*temp(i,j)*cx))
go to 125
c....Set new max and min magma
temperature......................
125 if((temp(i,j)-tempnew(i,j)).gt.500) then
write(5,'(//,28a)') large
go to 500
end if
if(krock(i,j).eq.0) then
if(tempnew(i,j).ge.tmaxnew)
& tmaxnew = tempnew(i,j)
if(tempnew(i,j).le. tmin) tmin = tempnew(i,j)
end if
130 continue
140 continue
c....Reset temp and test for stability.............
do 144 i=1, nrow
do 142 j=1, ncol
temp(i,j) = tempnew (i,j)
142 continue
144 continue
if(stab.eq.0.0) go to 500
if(tmaxnew.le.600.0) conv0 = 1.0
if(tmaxnew.gt.tmax.and.nt.gt.5) then
write(5,200)
go to 500
end if
200 format(///,'MELT DOWN!!! (Magma is heating up)')
tmax = tmaxnew
if(ntt.lt.1000) go to 105
500 return
end
Appendix F—
Core and Drill Cuttings:
Geothermal Well Logs
Cores
In geothermal exploration, continuous coring and geophysical logging techniques are an effective means of evaluating the lithologies, permeabilities, degree of hydrothermal alteration, temperatures, and reservoir potential. Continuous wireline coring (lowering core barrels on a cable into the drilling string) is used to retrieve 2.5- to 7.5-cm-diameter cores. Wireline retrieval is commonly used in the mining industry, but it can also be used effectively for geothermal-gradient well drilling. Although larger diameter cores can be collected, this process usually requires pulling up the entire drill string to retrieve the core. For a comprehensive review of coring technologies, see Rowley (1985).
If cores are to be used efficiently, an on-site geologist is needed during the entire coring operation. This person's job can be tedious, but it is essential for the successful collection and use of the cores. Before the drilling rig is in place, the well-site geologists should agree on consistent record-keeping procedures, description forms, and the best means of storing the core. This consistent approach is extremely important because by the time the project is complete, there may be several thousand meters of core.
For each core brought up by the drilling crew, the geologist should:
(1) mark the top and bottom of the core and draw a line down the long axis;
(2) note the well number and depth from which the core was taken;
(3) provide a brief lithologic description (a more complete description should be completed after drilling, when time permits detailed examination;
(4) note and mark with a number or letter all of the pieces of the core (in geothermal areas, cores rarely arrive in one piece because of fracturing and hydrothermal alteration);
(5) wrap the core with foil and then dip it in hot wax to retain fluids within the rock if this is crucial for any laboratory geophysical measurements;
(6) note the length of core and compare that measurement with the depth drilled (obtained from the driller) to determine the percentage of core recovery; and
(7) box the core and number the box.
More detailed procedures for core curation are described in Goff (1986), SPWLA (1982), and in many oil, mining, or geothermal company handbooks.
After drilling is complete, the cores can be described in a more pleasant environment, removed from the pressures of the next core barrel or rainstorm. After the major lithologic units have been identified, pieces can be cut for thin sections or chemical analysis, the hydrothermal minerals from major fractures can be sampled, and fracture orientations and frequency can be measured. These fracture data are useful for later comparison with well log measurements of temperature and flow from the reservoir.
All the core information should be ploted and interpreted on long strips of paper (Fig. F.1). If done by hand and pencil, this can be a very slow job; it is much more efficient to store the observational data in a computer where the output can be continuously modified and quickly printed out at nearly any scale. Some of this work might easily be done onsite with a portable computer.
Drill Cuttings
Rocks in geothermal areas are usually hydrothermally altered and fractured. Drill cuttings from geothermal areas, brought to the surface by circulating drilling mud, are sometimes difficult to interpret. The production of cuttings depends on not only the rock type itself, but also the type of drill bit, drilling speed, and the characteristics of the drilling mud (Hulen and Sibbett, 1982).
To maximize the data from drill cuttings, cuttings should be collected from shaker screens through which the mud is sieved. A sample should be collected for every 3 m drilled. If the wells are drilled with compressed air, cuttings can be collected from the mound around the wellhead orifice or from the muffler.
Cuttings should be placed in cloth or plastic bags and labeled with the current drilling depth in waterproof marking ink. However, the drilling depth is likely to be greater than the actual depth from which the sample came and must be corrected (Low, 1977). This discrepancy between recorded and actual depths is negligible if the well is being drilled with air.
After cuttings are washed, the coarser fractions should be examined with a binocular microscope before thin sections of epoxy-impregnated cuttings are prepared. Cuttings can be examined quickly if representative samples are mounted on continuous strips with an adhesive; these "chip boards" are an efficient means of storing samples and provide a stratigraphic record (Hulen and Sibbett, 1982).
Fig. F.1
Summarized geologic log for geothermal well VC-2B in the Valles Caldera of New Mexico.
(From Jeff Hulen, University of Utah Research Institute.)
Cuttings can be contaminated by collapse of portions of the drillhole, materials added to the drilling mud, etc. Most of these contaminants can be recognized because they are very different from the materials in the cuttings; for a full treatment of this problem, consult Hulen and Sibbett (1982), who discussed potential problems with different rock types and drilling methods.
Geothermal Well Logs
Geophysical well logging in geothermal fields can be used in place of lithologic logs (although they are not as accurate) or as a supplement to lithologic logs (for which they are quite accurate). Logging is necessary for characterizing reservoir characteristics and size (Mathews, 1982), which in turn
can be used to measure temperature, pressure, flow, borehole geometry, and fracture frequency (Table F.1). Most of these parameters are controlled by the reservoir and its fluids; they change with time and cannot be determined solely from the core or cuttings. The interpretation of well logs requires specific training, which can be acquired from intensive short courses followed by work with experienced well log analysts. Another approach is to work directly with well log analysts employed by a logging service.
Most logging tools and cables available from commercial logging services have an upper operating temperature of 260°C and cannot be used in some geothermal systems. Some high-temperature tools have been developed, but they are not yet available commercially.
|
||||||||
Appendix G—
Glossary
Terms and explanations in this glossary reflect the latest usage in the volcanological literature cited within the text. Wherever possible, the definitions are adapted from those in the American Geological Institute Glossary (1980).
A
Aa lava
Hawaiian term for lava flows characterized by a rough, jagged, spiny surface.
Accretionary lapilli
More or less spherical masses of cemented ash ranging in diameter from a few millimeters to several centimeters; sometimes referred to as volcanic bailstones, pisolites , or volcanic mudballs .
Adiabatic
Refers to a process that causes no change in the heat content of a system; for example, when a gas or fluid is compressed or expanded.
Advection
Spatial transfer of physical properties, such as heat, through a system.
Agglutinate
Vitric pyroclasts consisting of a cluster of smaller pyroclasts that are annealed or "welded" to one another.
Aphanitic
Texture of a fine-grained igneous rock in which the crystalline components are not visible to the naked eye.
Aphyric
Igneous texture in which phenocrysts are absent in a fine-grained or glassy groundmass.
Aquagene
Synonym for hyaloclastic .
Aquifer
Body of rock or unconsolidated deposits with enough permeability to conduct a significant amount of groundwater.
Aquitard
Rocks that confine, but do not necessarily prevent leakage from an aquifer.
Argillic
Type of rock alteration in which the products are mostly kaolin- and smectite-group minerals.
Ash fall
Rain of airborne volcanic ash from an eruption cloud and the resulting deposit. Synonym: Ash fallout .
Ash flow
Synonym for pyroclastic flow but referring to pyroclastic flows that consist of ash.
Asthenosphere
Region below the Earth's lithosphere in which magmas may be generated and seismic waves are strongly attenuated. Synonym: upper mantle .
Audiomagnetotelluric
Geophysical survey technique that measures global electric and magnetic fields in audiofrequencies.
Authigenic
New minerals formed in place; for example, authigenic clays formed during alteration of volcanic glass by hot water.
B
Batholith
Large, usually composite mass of plutonic rock.
Block
Pyroclast larger than 64 mm that was solid when ejected. It may be juvenile or torn from older rocks in the vent or crater walls.
Blocky
Grain shape characterized by planar or curviplanar surfaces that intersect at nearly right angles.
Bomb
Pyroclast larger than 64 mm that was partly or completely fluid when ejected.
Breccia
Fragmental rock composed of highly angular coarse fragments with or without a fine-grained matrix.
C
Calc-alkalic
Igneous rocks in which the weight percent of SiO2 is between 56 and 61 and the weight percents of CaO and K2 O+Na2 O are nearly equal. Also denotes igneous rock suites composed dominantly of feldspar with lesser amounts of quartz, biotite, amphibole, pyroxene, and other accessory minerals.
Caldera
Volcanic crater formed by collapse during an eruption.
Caprock
Rock layer or zone with low permeability, often related to authigenic cementation; restricts fluid migration from a hydrothermal system below it.
Cinder
Synonym for scoria .
Cinder cone
Synonym for scoria cone .
Clast
Individual fragment or grain within a fragmental rock. Within volcanic rocks, clasts derive from mechanical disintegration of the rising magma, fracturing of
conduit wall rocks, and/or pieces of substrata incorporated by flows.
Coignimbrite
Usually refers to fallout tephra formed during an ignimbrite eruption, including breccias composed of large clasts emplaced near the vent by a pyroclastic flow and fine-grained ash elutriated from the top of a pyroclastic flow by the turbulent rise of hot gases.
Comminution
Decrease in size of a substance to a powder or dust by crushing, grinding, or rubbing. Synonym: pulverization .
Composite cone
Large volcanoes that consist of multiple volcanic landforms and interbedded pyroclastic rocks, lavas, and volcanic sediments. Synonym: Stratovolcano or stratocone .
Connate
Originating at the same time as the adjacent material; for example, water trapped within a rock at the time of deposition.
Crossbed
Bed inclined at an angle to the plane of stratification.
Cryptodome
Uplift of the ground surface by intrusion at very shallow depths. The final land-form consists of a lava dome with a thin carapace of older rock and soil.
D
Dense-rock equivalent (DRE)
Volume of igneous rock erupted after all pore space caused by vesiculation, fracturing, and intergranular porosity has been subtracted. This calculation is used to determine the volume of magma that reached the surface during an eruption.
Devitrification
Conversion of glass to crystalline materials.
Diagenesis
Chemical and physical changes in a rock after its deposition and during and after lithification.
Diamicton
Poorly sorted clastic deposit that contains a wide range of particle sizes; for example, a lapilli clast in a matrix of fine ash.
Diapir
Rock mass that has risen buoyantly to cut or deform overlying rocks. Diapirs can refer to magma bodies, salt, or mud.
Diatreme
General term for a volcanic vent or conduit drilled upward through enclosing rocks by the explosive energy of gas-charged magmas. The surface expression of a diatreme is a maar crater or, after extensive erosion, a tuff or tuff-breccia neck.
Dike swarm
Group of closely spaced dikes intruded during the same intrusive/eruptive episode.
Dry eruption cycle
Eruptions producing pyroclastic products that show textural features characteristic of decreasing water:magma ratios during the course of the eruption.
Dry surge
Pyroclastic surge containing steam that is mostly superheated. Surge deposits show little textural evidence of the presence of moisture during emplacement.
E
Endogenous
Geologic process (or its resultant features or rocks) that originates within the Earth; refers to plutonic and volcanic rocks.
Energy line
Loci of points where a potential energy surface intersects a topographic surface. The term's application to pyroclastic flows has evolved from studies of rock-fall debris streams.
Equant
Refers to a rock fragment or crystal that has the same or nearly the same diameter in all directions.
Eruption cycle
Sequence of events or changes in behavior during a volcanic eruption. Synonym: eruption (Fisher and Schmincke, 1984).
Eruption plume
Convoluted, rolling mass of partly condensed water vapor, magmatic gases, dust, and ash that often rises to great heights. Synonym: eruption cloud .
Eruption unit
Deposits of volcanic material from an eruptive pulse, eruptive phase, or eruption (Fisher and Schmincke, 1984).
Euhedral
Refers to a mineral grain completely bounded by its own crystallographic faces, with no interference by surrounding minerals.
Exogenous
Refers to a geologic process at or above a planetary surface; for example, an extrusive volcanic dome. Contrast with endogenous .
Expansion wave
Perturbation in fluid flow that propagates at the local sound speed while causing the flow to accelerate, expand in volume, and decrease in density and pressure.
Explosion pit
Bowl-shaped crater surrounded by a low ejecta rim; generally formed by phreatic or phreatomagmatic explosions in which little or no juvenile material is ejected.
Exsolution
Process whereby an initially homogeneous solid separates into two or more distinct crystalline phases without addition or removal of material.
Extrusive
Refers to igneous rock that has been erupted onto a planetary surface.
F
Facies
Physical, chemical, and biological variations of rock bodies deposited within a specific geologic time interval.
Felsic
Somewhat archaic general term for silicic igneous rocks.
Fissure vents
Long, narrow cracks or fissures along which eruptions occur.
Flank vents
Vents located on the flanks of a larger volcano, which have their own plumbing systems that are independent of those from the larger volcano.
Fluidal
Refers to pyroclasts with smooth, round surfaces formed by surface tension within a droplet.
Fluvial
Pertaining to a river and its deposits.
Fumarole
Vent from which volcanic gases are emitted.
G
Geobarometry
Method that uses pressure-sensitive mineral reactions to indirectly determine the pressure conditions under which a rock formed.
Geothermometer
Mineral or mineral assemblage whose compositions are fixed within known temperature limits.
Glomeroporphyritic
Igneous texture denoting clustering of phenocrysts in a finely crystalline or glassy groundmass.
Granulometry
Measurement of grain sizes.
Groundmass
Fine-grained material between phenocrysts in a porphyritic volcanic rock.
H
Hawaiian eruption
Eruption of low-viscosity gas-charged magmas as lava fountains and thin, rapidly moving lava flows.
Heat flow
Amount of heat leaving the Earth; determined by measuring the thermal gradient (degrees per kilometer of depth), thermal conductivity of rocks (W/m-K), and other factors such as permeability. One heat flow unit (HFU) = 41.84 mW/m2 = 10-6 cal/cm2 -s.
Hot-dry-rock (HDR)
Geothermal resource derived from the thermal energy within rocks that lack permeability or have very low permeability. Heat transfer within these resources is by conduction only; however, the resource can be exploited by creating fractures and circulating fluids through those fractures.
Hot spring
Thermal spring whose temperature is above that of the human body (Meinzer, 1923).
Hyaloclastite
Volcaniclastic rocks generated by nonexplosive to mildly explosive granulation of volcanic glass when magmas are quenched on contact with water. These are common products of deep-sea volcanism.
Hyalotuff
Pyroclastic rocks generated by phreatomagmatic explosions in shallow surface water.
Hydration
Transfer of H2 O from a fluid phase into the structure of a mineral or glass.
Hydraulic fracturing
Fracturing of rock by fluid overpressure.
Hydroclast
Clasts formed during hydroclastic eruptions.
Hydrofracture
Shortened synonym for hydraulic fracturing .
Hydrogeochemistry
Chemistry of ground and surface waters and the fluids in hydrothermal systems.
Hydromagmatic
General term for all processes—subsurface or surface—involving interaction of magma or magmatic heat with meteoric or connate water in the Earth.
Hydrothermal systems
Natural hot water or steam systems caused by circulation of groundwater through permeable rock units over a natural source of heat; for instance, elevated heat flow in regions where there is a thin crust or a magma body.
Hydrothermal eruption
Synonym for phreatic eruption .
Hydrothermal reservoir
Combination of a heat source and permeable rock that allows the convective circulation of hot fluids; an accumulation of hot water and steam.
Hydrovolcanic
Term encompassing all volcanic activity that results from the interaction between lava, magmatic heat, or gases and meteoric or connate water at or near the surface of the Earth. Synonym: Phreatomagmatic .
I
Ignimbrite
Rock unit of consolidated tuff deposited by pyroclastic flows.
Intraplate volcanism
Volcanism occurring within tectonic plates, away from plate margins.
Isentropic
Refers to an idealized process that causes no change in entropy.
Isobaric
Refers to an idealized process that causes no change in pressure or a system in which all locations have equal pressure.
Isopach
Line on a map drawn through points of equal thickness of a designated rock unit.
Isopleth
Line on a map drawn through points of equal or constant size, composition, or abundance. In volcanology, these lines show areal distributions for values such as the diameter of pumice or lithic clasts.
Isotherm
Line connecting points of equal temperature.
Isothermal
Refers to an idealized process that causes no change in temperature or a system in which all locations have equal temperature
J
Jet
High-velocity stream of pressurized fluid forced out of a narrow or restricted opening.
L
Laccolith
Shallow igneous intrusion with a flat floor and deformed roof that is found in sequences of bedded rocks.
Lag breccia
Concentrations of large, comparatively dense lithic clasts at the base of a pyroclastic flow unit. These clasts are deposited close to the vent during sedimentation from the pyroclastic flow.
Lahar
Debris flow or mudflow of pyroclastic material that is mainly derived from pyroclastic deposits. Indonesian term for volcanic mudflow .
Lapilli (singular: lapillus)
Pyroclasts between 2 and 64 mm.
Lava fountain
Jet of molten lava driven by hydrostatic pressure and/or expansion of magmatic gases; erupted nearly vertically from vent.
Lava lake
Lake of molten lava in a crater; also applies to a solidified lake.
Liquidus
Loci of points in a temperature-composition diagram that represent conditions of maximum solubility for a solid component or phase in the liquid phase. In a binary system, it is a line and in a ternary system, a surface. It can also refer to the temperatures above which the system is completely liquid.
Lithic pyroclasts
Pyroclasts consisting of previously formed rocks; fragments of igneous, metamorphic, or sedimentary rock; or pieces of earlier lavas from the vent that are included in a pyroclastic deposit.
Lithophysae (singular: lithophysa)
Spherical structures composed of radially oriented, finely crystalline minerals—usually alkali feldspar and silica minerals; found in glassy silicic lavas and densely welded tuffs. Some lithophysae are hollow.
Lithosphere
Solid portion of the Earth; in most definitions, this includes the crust and part of the upper mantle.
Littoral cone
Tuff cone formed on or adjacent to a lava flow where it entered a body of water. Such cones are formed by steam explosions. Synonym: rootless cone .
M
Maar
Small volcano characterized by a crater that is wide (several hundred meters to several kilometers in diameter) relative to its height and whose floor commonly lies below the general level of surrounding topography. Maar volcanoes can form during hydrovolcanic eruptions or very energetic gas eruptions.
Mafic
Refers to an igneous rock that is composed chiefly of ferromagnesian minerals and is low in SiO2 content.
Magma
Molten rock within a terrestrial planet.
Maturity
Progression of a volcano through a lifetime of eruptive periods, during which it changes in composition, magnitude, volcanic landforms, and associated hydrothermal activity. Progression from first activity to complete dormancy.
Megabreccia
Clasts larger than a single outcrop that are slump deposits formed by wall collapse during caldera collapse.
Merapian
Volcanic activity caused by disintegration and collapse of a silicic dome or lava flow.
Mesobreccia
Concentrations of small lithic clasts interlayered with caldera-filling tuffs.
Microlites
Small crystals, usually of tabular or prismatic habit, that are often contained in a glassy matrix.
Microseismicity
Natural background noise that affects seismographs. Within geothermal areas, systematic variations in microseismic activity can be used to study fluid motions and natural fracturing within the system.
Mineral spring
Spring whose water contains enough mineral matter to give it a definite taste (Gary et al ., 1973). By convention, this term is applied only to nonthermal springs (Mariner et al. , 1990).
Moberg
Table mountain formed by a fissure eruption of basalt under a glacier.
Mohorovicic discontinuity
Seismic-velocity discontinuity that separates the Earth's crust from the underlying mantle; its depth ranges from 5 to 10 km beneath the ocean floor to 35 to 60 km under the continents.
Monogenetic volcano
Volcano constructed during a single phase of eruptive activity.
N
Noncondensible
Characteristic of a fluid when it passes directly from a gas to a solid with decreasing temperature.
Nuée ardente
"Glowing cloud" that consists of a mixture of pyroclasts and hot gases and moves rapidly down the flanks of a volcano as a density current. Synonym: pyroclastic flow .
O
Overpressure
Pressure in excess of lithostatic or atmospheric pressure.
P
Pahoehoe lava
Hawaiian term for a basaltic lava flow typified by a smooth, billowy, or ropy surface.
Palagonite
General term used to describe the alteration products of basaltic glass. Mineral phases in palagonite include smectite clays, iron oxides, calcite, and zeolites. Products may be formed during lithification of the deposit, weathering, or hydrothermal alteration of the glass phases.
Paleosol
Buried soil horizon of the geologic past.
Paragenesis
Characteristic order or sequence in which a group of minerals is formed; a reflection of the physical and chemical conditions under which the rock was formed.
Parasitic vents
Volcanic vent occurring on the flank of a larger volcano that is linked to the central conduit of the larger volcano. In contrast, flank vents occur on the flanks of a larger volcano but are not linked to its central plumbing system.
Peléean eruption
Characterized by explosions of moderate to extreme violence in which solid or viscous hot fragments of new lava are ejected—commonly as pyroclastic fallout and pyroclastic flows. These eruptions are usually associated with silicic magmas.
Peperite
Breccia-like rock formed as lava intrudes water-saturated sediment.
Peralkaline
Igneous rock in which molecular proportions of Na2 O+K2 O are greater than those of Al2 O3
Perlite
Glassy silicic lava or welded tuff with a relatively high water content. Perlitic
texture is characterized by multiple spheroidally curved cracks.
Petrogenesis
Study of rock origins.
Phenocryst
Large, conspicuous crystal in a porphyritic igneous rock.
Phi (f)
Logarithmic scale of particle diameters where f = -log2 (diameter in millimeters).
Phreatic eruption
Explosion that follows transformation of groundwater into steam. No incandescent or juvenile material is erupted.
Phreatomagmatic eruption
Explosive volcanic eruption caused, at least in part, by interaction of magma with meteoric water (groundwater or shallow surface water). Synonym: hydrovolcanic .
Phreatoplinian eruption
Plinian eruption during which interaction of vesiculating magma and near-surface water produces very fine ash and abundant steam in an eruption column that reaches great heights.
Pillow lava
Lavas displaying pillow- or tube-like forms that have formed in a subaqueous environment.
Pit crater
Small crater formed by collapse during magma withdrawal; not always a vent.
Platy
1. Particle texture in which length is more than three times its thickness.
2. Planar flow structure within a lava flow.
Plinian eruption
Paroxysmal ejection of large volumes of ash and pumice as a well-defined eruption column or "jet;" often precedes caldera collapse. The resulting tephra fallout covers an area of more than 500 km2 .
Pluton
Igneous intrusion.
Polygenetic
Resulting from more than one formation process, derived from more than one source, or originating at various places and times.
Porphyritic
Refers to the texture of an igneous rock in which the larger crystals (phenocrysts ) are set in a fine-grained groundmass.
Proppant
Particles within a fracture that hold the fracture open.
Pumice
Highly vesicular pyroclasts with very low bulk density and thin vesicle walls.
Pyroclast
Any fragment ejected during an explosive volcanic eruption.
Pyroclastic flow
Eruption cloud consisting of hot pyroclasts and gases that are driven by gravity and move across the ground as a density current. Many flows are generated by collapse of a particle-laden eruption column. Most flows move at high velocity downslope and along drainage systems, but some have enough energy to move across hills and valleys as well.
R
Rarefaction wave
Expansion wave that initially moves in the opposite direction from an associated
shock wave; for instance, down a volcanic conduit during an explosive eruption.
Resurgent caldera
Caldera in which the downdropped block is uplifted by magmatic intrusion following crater formation.
Reworked
Refers to any geologic material that has been removed or displaced naturally and incorporated into a younger geologic unit.
Rheomorphic tuff
Densely welded tuff that has flowed after deposition; often so similar to a silicic lava flow that it is difficult to distinguish between them in the field.
Ring faults
Steep, cylindrical, or semicylindrical faults bounding a collapse crater or caldera. Ring dikes , commonly associated with ring faults, have moved along these faults after caldera collapse.
S
Sandwave
Any sand dune or wave-like bedform in clastic rocks. A large and asymmetrical bedform.
Scoria
Vesicular, coarse-grained (lapilli-size or coarser) pyroclasts of basaltic or basaltic andesite composition. Vesicle walls are usually thick (much thicker than those in pumice pyroclasts). Synonym: Cinder .
SEM
Scanning electron microscope.
Shard
Glass fragment (vitric pyroclast) that has been broken from a vesicle wall (in magmatic eruptions) or formed during chilling and fragmentation (in phreato-magmatic eruptions). It may be flat, curved, blocky, or Y-shaped, depending upon the bubble-wall segment from which it was broken.
Shock wave
Hydrodynamic discontinuity in a fluid that is set up when the flow suddenly changes from subsonic to supersonic. Shock waves are characterized by instantaneous increases in temperature, pressure, and density.
Sideromelane
Basaltic glass; clear, brown glass found in basaltic ash and lava flow margins.
Silicic
Refers to a silica-rich igneous rock or magma. In most classifications, the amount of SiO2 is at least 65%. Granite and rhyolite are typical silicic rocks.
Silica sinter
Chemical sedimentary rock deposited as a hard encrustation by precipitation from hot springs.
Soda spring
Mineral spring whose waters effervesce carbon dioxide (Mariner et al ., 1990).
Solidus
On a temperature-composition diagram, the loci of points in a system above which solid and liquid are in equilibrium and below which the system is completely solid.
Spatter
Accumulation of fluid, coarse pyroclasts around a vent. In most spatter accumulations, the pyroclasts are welded to one another.
Stable isotope
Nuclide that does not undergo radioactive decay.
Stratocone or stratovolcano
Volcano made up of many different volcanic landforms and deposits: interbedded lavas, pyroclastic deposits, and sedimentary deposits. Synonym: composite cone .
Strombolian eruption
Weak-to-violent, sporadic, ballistic eruptions of tephra, generally of moderately fluid basaltic or andesitic magma. Scoria cones are constructed by this type of activity.
Subplinian eruption
Small-scale Plinian eruption—intermediate between Strombolian and Plinian activity—that is characterized by pumice and ash deposits covering less than 500 km2 .
Supercritical
Thermodynamic state of a system at which its temperature is greater than its critical temperature and in which it displays both liquid and vapor behavior.
Superheat
Heat in excess of that (a) required for a fluid (water) to exist as a saturated vapor or (b) necessary to cause complete melting of a solid (magma).
Surge
Density current pulse that moves laterally outward from an explosion column either by directed blast or column collapse. Surge deposits are thinly bedded and may consist of dune-like beds, inversely graded flat-lying beds, and massive beds.
Surtseyan eruption
Eruptions characterized by steam explosions that eject new lava fragments as pyroclastic surges and fallout. Activity typified by the eruptions of the volcano Surtsey in Iceland, where rising basaltic magma explosively vaporized near-surface water. Synonyms: phreatomagmatic and hydrovolcanic .
T
Tachylite
Hyalocrystalline pyroclasts; that is, pyroclasts consisting of groundmass minerals separated by glass. These are basaltic—or sometimes andesitic—and, in hand-specimen and under transmitted-light microscopes, they appear black or brown.
Tephra
Collective term (generally plural) used for all material—regardless of size—ejected during an explosive volcanic eruption. From the Greek term for volcanic ash, it was originally used by Aristotle and was revived by Thorarinsson in 1944.
Tephrochronology
Use of tephra layers for correlation and dating.
Thermal regime
Systematic patterns of heat flow within the Earth's asthenosphere and crust that are linked to dynamic conditions imposed by tectonic patterns, ground-water movement, rock chemistry, or plutonic/volcanic history.
Thermal spring
Spring whose water temperature is appreciably higher than the local mean annual atmospheric temperature; either a warm spring or a hot spring (Meinzer, 1923).
Thermal resource
Total heat contained in a body of rock; for example, a magma body.
Thermite
Incendiary mixture of fine aluminum powder and a metallic oxide, which when ignited yields intense heat through an oxidation-reduction reaction.
Tuff
Consolidated pyroclastic rock.
Tuff ring
Volcano constructed by pyroclastic deposits with low depositional slopes (2 to 10°) that encircle a relatively wide crater.
Tuff cone
Volcano composed of indurated ash with 20 to 30° slopes.
U
Ultraplinian
Highly energetic eruption in which the area of pumice and ash fall exceeds 50,000 km2 .
V
Vapor-phase alteration
Alteration of tuffs that results from crystallization of silica minerals (tridymite and cristobalite), alkali feldspar, and minor amounts of other minerals within porous zones of pyroclastic flows and lava flows. The alteration occurs when gases released during compaction of hot ash deposits interact with glass shards and pumice.
Vesicle
Bubble formed when molten rock approaches the ground surface and volatiles come out of solution at the lower pressures. Vesicularity refers to the vesicle volume in a rock.
Vitric
Glassy; for instance, a vitric tuff , which consists mostly of glass pyroclasts.
Vitrophyre
Igneous rock with a glassy groundmass.
Volcaniclastic
Clastic rock containing volcanic material in any proportion, regardless of its origin or environment.
Vulcanian eruption
Moderate to violent ejection of solid or very viscous hot fragments of new lava in short-lived, cannon-like bursts. Ash and fine ash are emitted with gases and ascend to form a cauliflower-like eruption cloud.
W
Warm spring
Thermal spring whose temperature is appreciably above the local mean annual temperature but below that of the human body (Meinzer, 1923).
Wet eruption cycle
Eruption sequence producing pyroclastic deposits that have textural features indicative of increasing water:magma ratios.
Wet surge
Pyroclastic surge containing saturated steam. This designation reflects the physical state of the tephra after deposition; wet surge deposits show textural and diagenetic evidence of being wet when emplaced.
Working fluid
Any fluid that produces pressure-volume work during changes in pressure and/or temperature. In geothermal systems, the working fluid is water.
X
Xenocryst
Crystal that resembles a phenocryst but is foreign to the body of rock in which it is found.
Xenolith
Foreign rock fragment in an igneous rock; lithic clast or lithic fragment.
References
Adams, M. C., Moore, J. N., and Forster, C., 1985. Fluid flow in volcanic terrains—hydrogeochemisty of the Meager Mountain thermal system. Geotherm. Res. Council Trans. 9: 377–382.
Aldrich, M. J. and Lauglin, A. W., 1984. A model for the tectonic development of the southeastern Colorado Plateau boundary. J. Geophys. Res. 89: 10, 207–10, 218.
Allegre, C. J. and Minster, J. F., 1978. Quantitative models of trace element behavior in magmatic processes. Earth Planet. Sci. Lett. 38 : 1–25.
Allen, E. T. and Day, A. L., 1935. Hot springs of the Yellowstone National Park. Carnegie Institute of Washington Publication 466, 515 pp.
Ander, M., 1984. Deep resistivity measurements in the Qualibou caldera, St. Lucia, West Indies. In: Evaluation of the St. Lucia geothermal resource, geologic, geophysical, and hydrogeochemical investigations. Los Alamos Nat'l.Lab. Rpt. LA-10234-MS, Los Alamos, New Mexico, pp. 43–54.
Anderson, E. M., 1936. The dynamics of the formation of cone-sheets, ringdykes, and cauldron subsidences. Proc. Roy. Soc., Edinburgh 56 : 128–163.
Anderson, E. M., 1937. Cone-sheets and ring-dykes: the dynamical explanation. Bull. Volcanol. 1 : 35–40.
Anderson, O. L. and Grew, P. C., 1977. Stress corrosion theory of crack propagation with applications to geophysics. Rev. Geophys. Space Sci. 15 : 77–104.
Aquater, 1982, Exploration of St. Lucia's geothermal resources. Consulting report for St. Lucia Ministry of Finance and Planning, Castries, St. Lucia, 23 pp.
Aramaki, S., 1984. Formation of the Aira caldera, southern Kyushu, ~22,000 years ago. J. Geophys. Res. 89 : 8485–8501.
Aramaki, S. and Ui, T., 1982. Japan. In: R. Thorpe (Ed.), Andesites . Wiley and Sons, New York, pp. 259–292.
Araña S., V. and Ortiz R., R. O., 1984. Volcanologia . Consejo Superior de Investiga-
ciones Cientificas and Editorial Rueda, Madrid, 510 pp.
Arguden, A. T. and Rodolfo, K. S., 1990. Sedimentologic and dynamic differences between hot and cold laharic flows of Mayon Volcano, Philippines. Geol. Soc. Am. Bull. 102 : 865–876.
Armstead, H. C. H. and Tester, J. W., 1987. Heat mining: A new source of energy . E. & F. N. Spon, London, 478 pp.
Arnason, B., 1976. Groundwater systems in Iceland traced by deuterium. Societas Scientarium Islandica 42, 236 pp.
Arth, J. G., 1976. Behavior of trace elements during magmatic processes—a summary of theoretical models and their applications. J. Res. U.S. Geol. Survey 4 : 41–47.
Austin, C. F. and Pringle, J. K., 1970. Geologic investigations at the Coso thermal area. China Lake Naval Ordinance Test Station Tech. Publ. 4878, China Lake, California, 40 pp.
Austin, C. F., Austin, W. H., and Leonard, G. W., 1971. Geothermal science and technology: A national program. China Lake Naval Ordinance Test Station Tech. Ser. 45-029-72, China Lake, California, 95 pp.
Bacon, C. R., 1977. High temperature heat content and heat capacity of silicate glasses: experimental determination and a model for calculation. Am. J. Sci. 277 : 109–135.
Bacon, C. R., 1982. Time-predictable bimodal volcanism in the Coso Range, California. Geol. 10 : 65–69.
Bacon, C. R., 1983. Eruptive history of Mount Mazama and Crater Lake caldera, Cascade Range, U.S.A. J. Volcanol. Geotherm. Res. 18 : 57–116.
Bacon, C. R., Duffield, W. A., and Nakamura, K., 1980. Distribution of Quaternary rhyolite domes of the Coso Range, California: Implications for extent of the geothermal anomaly. J. Geophys. Res. 85 : 2425–2433.
Bacon, C. R. and Duffield, W. A. (Eds.), 1980. Special section: geothermal investigations in the Coso Range, California. J. Geophys. Res. 85 : 2379–2516.
Bacon, C. R., MacDonald, R., Smith, R. L., and Baedecker, P. A., 1981. Pleistocene high-silica rhyolite of the Coso volcanic field, Inyo County, California. J. Geophys. Res. 86 : 10,223–10,241.
Bacon, C. R., Kurasawa, H., Delevaux, M. H., Kistler, R. W., and Doe, B. R., 1984. Lead and strontium isotopic evidence for crustal interaction and compositional zonation in the source regions of Pleistocene basaltic and rhyolitic magmas of the Coso volcanic field, California. Contrib. Mineral. Petrol. 85 : 366–375.
Bacon, C. R., 1989. Shallow and deep processes at Crater Lake, Oregon: a model system for magmatism in a young continental arc. New Mexico Bur. Mines Min. Resources Bull. 131 : 11.
Bailey, R. A., Dalrymple, G. B., and Lanphere, M. A., 1976. Volcanism, structure, and geochronology of Long Valley caldera, Mono County, California. J. Geophys. Res.. 81 : 725–744.
Baldi, P., Cameli, G. M., Locardi, E., Mouton, J., and Scandellari, F., 1975. Geology and geophysics of the Cesano geothermal field. 2nd U.N. Symp. on Geothermal Energy, San Francisco, California, pp. 871–881.
Barenblatt, G. I., 1962. Mathematical theory of equilibrium cracks. Adv. Appl. Mech. 7 : 55–129.
Barberi, F., 1985. Mecanismos de interaccion explosiva del magma con acuiferos subterraneos. In: Araña, V. (Ed.), Mecanismos eruptivos y estructuras profundas de volcanes Espanoles e Italianos . Reunio Cientifica CSIC (Espana) CNR (Italia) Prog. no. 5, pp. 13–23.
Barberi, F., Bizouard, H., Clocchiatti, R., Metrich, N., Santacroce, R., and Sbrana, A., 1981.
The Somma-Vesuvius magma chamber: a petrological and volcanological approach. Bull. Volcanol. 44 : 295–316.
Barberi, F., Innocenti, F., Landi, P., Rossi, U., Saitta, M, Santacroce, R., and Villa, I. M., 1984. The evolution of Latera caldera (Central Italy) in the light of subsurface data. Bull. Volcanol. 47 : 125–141.
Barberi, F., Innocenti, F., Lirer, L., Munno, R., Pescatore, T., and Santacroce, R., 1978. The Campanian Ignimbrite: a major prehistoric eruption in the Neapolitan area (Italy). Bull. Volcanol. 41 : 1–22.
Barberi, F., Navarro, J. M., Rosi, M., Santacroce, R., and Sbrana, A., 1988. Explosive interaction of magma with ground water: insights from xenoliths and geothermal drillings. Rend. Soc. Ital. Mineral. Petrol. 43 : 901–926.
Bargar, K. E., 1978. Geology and thermal history of Mammoth Hot Springs, Yellowstone National Park, Wyoming. U.S. Geol. Surv. Bull. 1444, 55 pp.
Bates, R. L. and Jackson, J. A., 1980. Glossary of geology . Am. Geol. Inst., Falls Church, 749 pp.
Bath, A. H., 1976. Summary of chemical data from the Sulphur Springs thermal area, St. Lucia, West Indies. Inst. Geol. Sci. Hydrogeol. Unit, WD/OS/76/21, Cnomarsh, Gifford, Wallingford, Oxfordshire, England, 19 pp.
Bath, A. H., 1977. Chemical interaction in a geothermal system in St. Lucia, West Indies. Proc. 2nd Int'l. Symp. on Water - Rock Interactions, Strausbourg, France, Sec. 3, pp. 170–179.
Bellman, R. and Pennington, R. H., 1954. Effects of surface tension and viscosity on Taylor instability. Quart. Appl. Math. 12 : 151–161.
Best, M. G., 1982. Igneous and metamorphic petrology . W. H. Freeman and Company, San Francisco, 630 pp.
Billard, G., 1974. Carte geologique de l'ile de La Reunion. Bur. de Rech. Geol. et Min., Paris.
Birch, F., 1966. Compressibility; elastic constants. In: S. P. Clark, Jr. (Ed.), Handbook of physical constants . Geol. Soc. Am. Mem. 97, pp. 98–173.
Bixley, P. F. and Browne, P. R. L., 1988. Hydrothermal eruption potential in geothermal development. Proc. 10th New Zealand Geotherm. Workshop, pp. 195–198.
Bjornsson, S., 1980. Natural heat saves millions of barrels of oil: Unique procedures developed by Icelanders—they even tap hot lava. Atlantica and Iceland Rev. 18 : 28–37.
Blackburn, E. A., Wilson, L., and Sparks, R. S. J., 1976. Mechanisms and dynamics of strombolian activity. J. Geol. Soc. London 132 : 429–440.
Board, S. J., Hall, R. W., and Hall, R. S., 1975. Detonation of fuel coolant explosions. Nature 254 : 319–321.
Bodvarsson, G., 1951. Production of thermal energy on the island of St. Lucia, West Indies. Consult. Rep. Unit. Nat. Tech. Assist. Admin., New York, 14 pp.
Bodvarsson, G., 1961. Physical characteristics of natural heat resources in Iceland. Jokull 11 : 29–38.
Bodvarsson, G., 1976. Estimates of the geothermal resources of Iceland. In: Proc. 2nd U.N. Symp. on Develop. and Use of Geotherm. Res., U.S. Gov't. Printing Office 1 : 33–35.
Bohen, S. R. and Lindsey, D. H., 1987. Thermometry and barometry of igneous and metamorphic rocks. Ann. Rev. Earth Planet. Sci. 15 : 397–420.
Bonatti, E., 1976. Mechanisms of deep sea volcanism in the South Pacific. In: P. H.
Ableson (Ed.), Researches in geochemistry, 2 . Wiley and Sons, New York, pp. 453–491.
Bonnichsen, B. and Kauffman, D. F., 1987. Physical features of rhyolite lava flows in the Snake River Plain volcanic province, southwestern Idaho. Geol. Soc. Am. Spec. Pap. 212, pp. 119–145.
Bottinga, J. and Weil, D. F., 1970. Densities of liquid silicate systems calculated from partila molar volumes of oxide components. Am. J. Sci. 269 : 169–182.
Bott, M. and Smithson, S., 1967. Gravity investigations of subsurface shape and mass distributions of granite batholiths. Geol. Soc. Am. Bull. 78 : 859–878.
Brace, W. F., 1980. Permeability of crystalline and argillaceous rocks: status and problems. Int'l. J. Rock Mech. Mineral. Sci. Geochem. Abstr. 17 : 876–893.
Branch, C. D., 1976. Development of porphyry copper and stratiform volcanogenic ore bodies during the life cycle of andesitic stratovolcanoes. In: R. W. Johnson (Ed.), Volcanism in Australasia . Elsevier Science Publications, Amsterdam, pp. 337–342.
Brook, C. A., Mariner, R. H., Mabey, D. R., Swanson, J. R., Guffanti, M., and Muffler, L. J. P., 1978. Hydrothermal convection systems with reservoir temperatures >90°C. U.S. Geol. Surv. Circ. 790 : 18–85.
Brown, G., Rymer, H., and Everett, S., 1987. Gravity constraints on the structure and evolution of Askja caldera, Iceland. In: Hawaii Symp. on How Volcanoes Work, Hilo, p. 26.
Browne, P. R. L., 1970. Hydrothermal alteration as an aid in investigating geothermal fields. Geothermics, Spec. Issue 2 : 564–570.
Browne, P. R. L., 1982. Mapping of geothermal discharge features. In: M. P. Hochstein (Ed.), Introduction to geothermal prospecting. Univ. of Auckland Publ., pp. 67–69.
Browne, P. R. L., 1977. Hydrothermal alteration in active geothermal fields. New Zeal. Geol. Surv. unpublished report M58, 57 pp.
Browne, P. R. L. and Ellis, A. J., 1970. The Ohaki–Broadlands hydrothermal area, New Zealand: mineralogy and related geochemistry. Am. J. Sci. 269 : 97–131.
Bruni, P., Chelini, W., Sbrana, A., and Verdiani, G., 1983. Deep exploration of the S. Vito area (Pozzuoli-NA)—Well S. Vito 1. European Geothermal Update EUR8853EN, pp. 102–118.
Buchanan, D. J., 1974. A model for fuel-coolant interaction. J. Phys. D: Appl. Phys. 7 : 1441–1457.
Budnikov, V. A., Markhinin, Ye. K., and Ovsyannikov, A. A., 1975. The quantity, distribution, and petrochemical features of pyroclastics of the Great Tolbachik eruption. In: S. Fedotov and Y. K. Markhinin (Eds.), The Great Tolbachik fissure eruption . Cambridge Univ. Press, Cambridge, pp. 41–71.
Burkhart, B. and Self, S., 1985. Extension and rotation of crustal blocks in northern Central America and effect on the volcanic arc. Geology 13 : 22–26.
Burnham, C. W., Holloway, J. R., and Davis, N. F., 1969. Thermodynamic properties of water to 1000°C and 10,000 bars. Geol. Soc. Am. Spec. Pap. 132, 96 pp.
Buxton, L. D. and Benedict, W. B., 1989. Steam explosion efficiency studies. Sandia Nat'l. Lab. Rpt. SAND79-1399, Albuquerque, New Mexico, and U.S. Nuclear Regulatory Commission Rpt. NUREG/CR–0947, 62 pp.
Byers, F. M., Jr., Carr, W. J., Orkild, P. P., Quinlivan, W. D., and Sargent, K. A., 1976. Volcanic suites and related cauldrons of Timber Mountain Oasis Valley caldera complex, southern Nevada. U.S. Geological Survey Prof. Pap. 919, 70 pp.
Calamai, A., Cataldi, R., Dall'aglio, M., and Ferrara, G. C., 1976. Preliminary report on the Cesano hot brine deposits (northern Latium, Italy). U. N. Symp. on Develop. and Use of Geotherm. Res., U.S. Gov't. Printing Office, pp. 305–313.
Cameli, G. M., Rendina, M., Puxeddu, M., Rossi, A., Squarci, P., and Taffi, L., 1976. Geothermal research in western Campania (southern Italy): geological and geophysical results. U.N. Symp. on Develop. and Use of Geotherm. Res., U.S. Gov't Printing Office, pp. 315–328.
Carey, S. N. and Sigurdsson, H., 1982. Influence of particle aggregation on deposition of distal tephra from the May 18, 1980 eruption of Mount St. Helens volcano. J. Geophys. Res. 87 : 7061–7072.
Carey, S. and Sparks, R. S. J., 1986. Quantitative models of the fallout and dispersal of tephra from volcanic eruption columns. Bull. Volcanol. 48 : 109–125.
Carlisle, D., 1963. Pillow breccias and their aquagene tuffs: Quadra Island, British Columbia. Am. J. Sci. 71 : 48–71.
Carmichael, I. S. E., Turner, F. J., and Verhoogen, J., 1974. Igneous petrology . McGraw–Hill Book Company, New York, 739 pp.
Carmichael, R. S., 1984. Handbook of physical properties of rocks, Vols. 1–3 . CRC Press, Boca Raton, Florida.
Carr, M. J., Rose, W. I., and Stoiber, R. E., 1982. Central America. In: R. Thorpe (Ed.), Andesites . Wiley and Sons, pp. 149–166
Carella, R. and Guglielminetti, M., 1983. Multiple reservoirs in the Mofete field, Naples, Italy. 9th Workshop on Geotherm. Res. and Eng., Stanford, California, pp. 120–131.
Cas, R. A. F. and Wright, J. V., 1987. Volcanic successions: Modern and ancient. Allen and Unwin, London, 528 pp.
Chesner, C. A., 1988. The Toba tuffs and caldera complex, Sumatra, Indonesia: Insights into magma bodies and eruptions. Ph.D. Diss., Michigan Tech. Univ., Houghton, 428 pp.
Chouet, B., 1986. Dynamics of a fluid-driven crack in three dimensions by the finite difference method. J. Geophys. Res. 91 : 13,967–13,992.
Chouet, B., 1988. Resonance of a fluid-driven crack: radiation properties and implications for the source of long-period events and harmonic tremor. J. Geophys. Res. 93 : 4375–4400.
Chouet, B. and Julian, B. R., 1985. Dynamics of an expanding fluid-filled crack. J. Geophys. Res. 90 : 11,187–11,198.
Christensen, N. I., 1984. Seismic velocities. In: R. S. Carmichael (Ed.), Handbook of physical properties of rocks, Vol. 2 . CRC Press, Boca Raton, Florida, 228 pp.
Christiansen, R. L., 1985. The Mount Shasta magmatic system. U.S. Geol. Surv. Open-File Rpt. 85-521, pp. 31–33.
Christiansen, R. L., 1987. Lithospheric processes viewed through intraplate volcanoes and "hot spots." Hawaii Symp. on How Volcanoes Work, Hilo, p. 39.
Christiansen, R. L. and Blank, H. R., Jr., 1972. Volcanic stratigraphy of the Quaternary rhyolite plateau in Yellowstone National Park, U.S. Geol. Surv. Prof. Pap. 729-B, 18 pp.
Christiansen, R. L., Kleinhample, F. J., Blakely, R. J., Tuchek, E. T., Johnson, F. L., and Conyac, M. D., 1977. Resource appraisal of the Mt. Shasta Wilderness Study Area, Siskiyou County, California. U.S. Geol. Surv. Open-File Rpt. 77-250, 53 pp.
Christiansen, R. L., Lipman, P. W., Carr, W. J., Byers, F. M., Jr., Orkild, P. P., and Sargent, K. A., 1977. Timber Mountain-Oasis Valley caldera complex of southern Nevada. Geol. Soc. Am. Bull. 88 : 943–959.
Christiansen, R. L. and McKee, E. H., 1978. Late Cenozoic volcanic and tectonic evolution of the Great Basin and Columbia Intermontane regions. In: R. B. Smith and G. P. Eaton (Eds.), Cenozoic tectonics and regional geophysics of the Western Cordillera . Geol. Soc. Am. Mem. 152, pp. 283–311.
Clague, D. A. and Dalrymple, G. B., 1987. The Hawaiian-Emperor volcanic chain: Geologic evolution. U.S. Geol. Surv. Prof. Pap. 1350, pp. 5–54.
Clark, J. B., 1949. A hydraulic process for increasing the productivity of wells. Trans. A.I.M.E. 186 : 1.
Clark, J. G., 1983. Geology and petrology of South Sister volcano, High Cascade Range, Oregon. (Ph.D. Diss.) Univ. of Oregon, Eugene, 235 pp.
Clark, N. J. and Stewart, L. K., 1991. Developing the first commercial geothermal project in the Hawaiian Islands. Geotherm. Res. Council Bull. 20 : 127–134.
Clark, S. P., Jr., 1966. Thermal conductivity. In: S. P. Clark, Jr. (Ed.), Handbook of physical constants . Geol. Soc. Am. Mem. 97, pp. 459–482.
Clifton, R. J., Simonson, E. R., Jones, A. H., and Green, S. J., 1976. Determination of the critical-stress-intensity factor K1c from internally pressurized thick-walled vessels. Exp. Mech. 16 : 233–238.
Cobbing, E. J. and Pitcher, S. P., 1972. The coastal batholith of central Peru. J. Geol. Soc. London 128 : 421–460.
Colgate, S. A. and Sigurgeirsson, T., 1973. Dynamic mixing of water and lava. Nature 244 : 552–555.
Colp, J., 1982. Final Report—Magma energy research project. Sandia Nat'l. Lab. Rpt. SAND82-2377, 36 pp.
Combs, J., 1980, Heat flow in the Coso geothermal area, Inyo County, California, J. Geophys. Res. 85 : 2411–2424.
Compton, R., R., 1962. Manual of field geology . Wiley and Sons, New York, 378 pp.
Cook, E., 1965. Stratigraphy of Tertiary volcanic rocks in eastern Nevada. Nev. Bur. Mines Rpt. 11, 66 p.
Courant, R. and Friedrichs, K. O., 1948. Supersonic flow and shock waves . Springer-Verlag, New York, 464 pp.
Cox, K. G., Bell, J. D., and Pankhurst, 1979. The Interpretation of igneous rocks . Allen and Unwin, London, 450 pp.
Crandell, D. R., 1971. Postglacial lahars from Mount Rainier volcano, Washington. U.S. Geol. Surv. Prof. Pap. 677, 75 pp.
Crandell, D. R. and Rubin, M., 1977. Late-glacial and postglacial eruptions at Mt. Hood, Oregon. Geol. Soc. Am. Abs. Prog. 9 : 406.
Crandell, D. R., Miller, C. D., Glicken, H. X., Christiansen, R. L., and Newhall, C. G., 1984. Catastrophic debris avalanche from ancestral Mount Shasta volcano, California. Geology 12 : 143–146.
Crisci, G. M., De Rosa, R., Lanzafame, G., Mazzuoli, R., Sheridan, M. F., and Zuffa, G. G., 1981. Monte Guardia sequence: a late-Pleistocene eruptive cycle on Lipari (Italy). Bull. Volcanol. 44 : 241–255.
Crisp, J. A., 1984. Rates of magma emplacement and volcanic output. J. Volcanol. Geotherm. Res. 20 : 177–211.
Crowe, B. M. and Fisher, R. V., 1973. Sedimentary structures in base-surge deposits with special reference to cross-bedding, Ubehebe Craters, Death Valley, California. Geol. Soc. Am. Bull. 84 : 663–682.
Crowe, B. and Nolf, B., 1977. Composite cone growth modeled after Broken Top, a dissected High Cascade volcano. Geol. Soc. Am. Abs. Prog. 8 : 833.
Curtis, G. H., 1954. Mode of origin of pyroclastic debris in the Mehrten Formation of the Sierra Nevada. Univ. Calif. Publ. Geol. Sci. 29 : 453–502.
Daly, R. A., Manger, G. E., and Clark, S. P, Jr., 1966. Density of rocks. In: S. P. Clark, Jr. (Ed.), Handbook of physical constants . Geol. Soc. Am. Mem. 97, pp. 19–26.
Davis, J. C., 1973. Statistics and data analysis in geology . Wiley and Sons, New York, 550 pp.
Decker, R., 1987. Dynamics of Hawaiian volcanoes: an overview. U.S. Geol. Surv. Prof. Pap. 1350, pp. 997–1018.
Decker, R., Wright, T., and Stauffer, P. (Eds), 1987. Volcanism in Hawaii. U.S. Geol. Surv. Prof. Pap. 1350, 1667 pp.
Delaney, P. T., 1982. Rapid intrusion of magma into wet rock: ground water flow due to pressure increases. J. Geophys. Res. 87 : 7739–7756.
Delaney, P. T., 1987. Heat transfer during emplacement and cooling of mafic dykes. In: H. C. Halls and W. F. Fahrig (Eds.), Mafic dyke swarms Geol. Assoc. Canada Spec. Pap. 34, pp. 31–46.
Demians, J., Archimbaud, J., and Surcin, J., 1972. Récherches géothermiques en Guadeloupe. Rev. Geograph. Geol. Dyn. 14 : 211–228.
Dennis, J. G., 1972. Structural geology . Ronald Press Company, New York, 532 pp.
DePaolo, D. J., 1985. Isotopic studies of processes in mafic magma chambers: I. The Kiglapait intrusion, Labrador. J. Petrol. 26 : 925–951.
De Rita, Funiciello, R., Rossi, U., and Sposato, A., 1983. Structure and evolution of the Sacrofano–Boccano caldera, Sabatini volcanic complex, Rome. J. Volcanol. Geotherm. Res. 17 : 219–236.
Dey, T. N. and Kranz, R. L., 1988. State of stress and relationship of mechanical properties to hydrothermal alteration at Valles Caldera core hole 1, New Mexico. J. Geophys. Res. 93 : 6108–6112.
Dodge, F. C. W., 1979. The Uyaijah Ring Structure, Kingdom of Saudi Arabia. U.S. Geol. Surv. Prof. Pap. 774-E, 17 pp.
Donaldson, I. G. and Grant, M. H., 1978. An Estimate of the resource potential of New Zealand geothermal fields for power generation. Proc. Larderello Workshop on Geotherm. Resour. Assess. and Reservoir Eng., ENEL Studie Ricerche, Larderello, Italy, Geothermics 7 : 243–252.
Dondanville, R. F., 1971. The hydrothermal geology of the Valles caldera, Jemez Mountains, New Mexico. Union Oil Co. California Open-File Consult. Rpt., 36 pp.
Dondanville, R. F., 1978. Geologic characteristics of the Valles caldera geothermal system, New Mexico. Geotherm. Res. Council Trans. 2 : 157–160.
Druitt, T. H. and Bacon, C. R., 1986. Lithic breccia and ignimbrite erupted during the collapse of Crater Lake, Oregon. J. Volcanol. Geotherm. Res. 29 : 1–32.
Druitt, T. H. and Sparks, R. S. J., 1982. A Proximal ignimbrite breccia facies on Santorini, Greece. J. Volcanol. Geotherm. Res. 13 : 147–172.
Druitt, T. H. and Sparks, R. S. J., 1984. On the formation of calderas during ignimbrite eruptions. Nature 310 : 679–681.
Duffield, W. A., 1983. Geologic framework for geothermal energy in Cascade Range. Geotherm. Res. Council Trans. 7 : 234–246.
Duffield, W. A., Jackson, D. B., and Swanson, D. A., 1976. The shallow, forceful intrusion of magma and related ground deformation at Kilauea Volcano, May 15–16, 1970. In: Proc. Symp. on Andean and Antarctic Volcanology Problems. Int'l. Assoc. Volcanol. Chem. Earth's Inter., Giannini and Figli, Naples, pp. 577–597.
Duffield, W. A. and Bacon, C. A., 1979. Preliminary geologic map of the Coso volcanic field and adjacent areas, Inyo County, California, with a table of new K/Ar dates by G. B. Dalrymple. U.S. Geol.
Surv. Open-File Rep. 77–331; scale 1:50,000.
Duffield, W. A., Bacon, C. A., and Dalrymple, G. B., 1980. Late Cenozoic volcanism, geochronology, and structure of the Coso Range, Inyo County, California, J. Geophys. Res. 85 : 2379–2380.
Duffield, W., Stieltjes, L., and Varet, J., 1982. Huge landslide blocks in the growth of Piton de la Fournaise, La Reunion and Kilauea Volcano, Hawaii. J. Volcanol. Geotherm. Res. 12 : 147–160.
Dupuy, L. W., 1948. Bucket-drilling the Coso mercury-deposit, Inyo County, California, U.S. Bur. Mines Invest. Rpt. 4201, 45 pp.
Eichelberger, J. C., 1974. Magma contamination within the volcanic pile: Origin of andesite and dacite. Geol. 2 : 29–33.
Eichelberger, J. C., 1978. Andesitic volcanism and crustal evolution. Nature 275 : 21–27.
Eichelberger, J. C. and Gooley, R., 1977. Evolution of silicic magma chambers and their relationship to basaltic volcanism. Am. Geophys. Union Mono. 20, pp. 57–77.
Eichelberger, J. C., Carrigan, C. R., Westrich, H. R., and Price, R. H., 1986. Nonexplosive silicic volcanism. Nature 323 : 598–602.
Ekren, E. B., Anderson, R. E., Rogers, C. L., and Noble, D. C., 1971. Geology of the northern Nellis A.F.B. Bombing and Gunnery Range, Nye County, Nevada. U.S. Geol. Surv. Prof. Pap. 651, 91 pp.
Elders, W. A., 1981. Applications of petrology and geochemistry to the study of active geothermal systems in the Salton Trough of California and Baja California. In: D. M Hausen and W. C. Park (Eds.), Process mineralogy, extractive metallurgy, mineral exploration, energy resources . Proc. Symp. AIME Ann. Mtg., Chicago, February 1981.
Ellis, A. J. and Mahon, W. A. J., 1977. Chemistry and geothermal systems . Academic Press, New York, 392 pp.
Elston, W. E., Rhodes, R. C., Coney, P. J., and Deal, E. G., 1976. Progress report on the Mogollon Plateau volcanic field, southwestern New Mexico, 3: Surface expression of a pluton. New Mexico Geol. Soc. Spec. Publ. 5, 328 pp.
England, A. H. and Green, A. E., 1963. Some two-dimensional punch and crack problems in classical elasticity. Proc. Cambridge Philos. Soc. 59 : 489–500.
Eppler, D. B., 1984. Characteristics of volcanic blasts, mudflows and rock-fall avalanches in Lassen Volcanic National Park, California. Ph.D. Diss., Arizona State University, Tempe, 262 pp.
Eppler, D., Baldridge, S., Perry, F., Flores, W., Paredes, J., and Finch, R., 1987. Geology of the Azacualpa geothermal site, Departamento de Comayagua, Honduras, Central America. Los Alamos Nat'l. Lab. Rpt. LA-10687-MS, 32 pp.
Espanola, O. S., 1974. Geology and hot springs of Tikitere and Taheke hydrothermal fields, Rotorua, New Zealand. New Zeal. Geol. Surv. Rpt. 68, 75 pp.
Facca, G. and Tonani, F., 1967. The self-sealing geothermal field. Bull. Volcanol. 30 : 271–273.
Faure, G., 1977. Principles of isotope geology. Wiley and Sons, New York, 464 pp.
Fauske, H. K., 1973. On the mechanism of uranium dioxide-sodium explosive interactions. Nucl. Sci. Eng. 51 : 95–101.
Fauske, H. K., 1977. Some comments on shock-induced fragmentation and detonating thermal explosions. Am. Nucl. Soc. Trans. 27 : 666–667.
Fedotov, S. A., 1987. Basaltic Klyuchvskoy Volcano, the main volcano of the Kurile-Kamchatka arc; its activity and probable development. Hawaii Symp. on How Volcanoes Work, Hilo, p. 70.
Fehler, M., 1983. Observations of volcanic tremor at Mount St. Helens volcano. J. Geophys. Res. 88 : 3476–3484.
Fertl, W. and Overton, H., 1982. Formation evaluation. In: L. M. Edwards, G. V. Chilingar, H. H. Rieke III, and W. H. Fertl (Eds.), Handbook of geothermal energy . Gulf Publishing Company, Houston, pp. 326–425.
Fink, J. H., 1980a. Surface folding and viscosity of rhyolite flows. Geology 8 : 250–254.
Fink, J. H., 1980b. Gravity instability in the Holocene Big and Little Glass Mountain rhyolitic obsidian flows, northern California. Tectonophys. 66 : 250–254.
Fink, J. H., 1983. Structure and emplacement of a rhyolitic obsidian flow: Little Glass Mountain, Medicine Lake Highland, northern California. Geol. Soc. Am. Bull. 94 : 362–380.
Fink, J. H., 1985. Geometry of silicic dikes beneath the Inyo Domes, California. J. Geophys. Res. 90 : 11, 127–11, 133.
Fink, J. H. (Ed.), 1987. The emplacement of silicic domes and lava flows. Geol. Soc. Am. Spec. Pap. 212, 145 pp.
Fink, J. H. and Pollard, D. D., 1983. Structural geologic evidence for dikes beneath silicic domes, Medicine Lake Highland volcano, California. Geology 11 : 458–461.
Fink, J. H. and Manley, C. R., 1987. Origin of pumiceous and glassy textures in rhyolite flows and domes. Geol. Soc. Am. Spec. Pap. 212, pp. 77–88.
Fisher, R. V., 1961. Proposed classification of volcanoclastic sediments and rocks. Geol. Soc. Am. Bull. 72 : 1409–1414.
Fisher, R. V., 1968. Puu Hou littoral cones, Hawaii. Geol. Rundschau 57 : 837–864.
Fisher, R. V. and Heiken, G., 1982. Mt. Pelée, Martinique: May 8 and 20, 1920, pyroclastic flows and surges. J. Volcanol. Geotherm. Res. 13 : 362–380.
Fisher, R. V. and Schmincke, H.-U., 1984. Pyroclastic rocks . Springer-Verlag, Berlin, 472 pp.
Fisher, R. V. and Smith, G. A., 1991. Volcanism, tectonics, and sedimentation. In: R. V. Fisher and G. A. Smith (Eds.), Sedimentation in volcanic settings . Soc. Econ. Paleontol. Mineral. Spec. Pub. 45, pp. 1–8.
Fisher, R. V., Schmincke, H.-U., and Bogaard, P. v. d., 1983. Origin and emplacement of a pyroclastic flow and surge unit at Laacher See, Germany. J. Volcanol. Geotherm. Res. 17 : 375–392.
Fisher, R. V. and Waters, A. C., 1970. Basesurge bed forms in maar volcanoes. Am. J. Sci. 268 : 157–180.
Folk, R. L., 1966. A review of grain-size parameters. Sedimentol. 6 : 73–93.
Folk, R. L. and Ward, W. C., 1957. Brazos River bar: a study in the significance of grain size parameters. J. Sed. Pet. 27 : 3–26.
Folk, R. L., 1974. Petrology of sedimentary rocks . Hemphill Publishing Co., Austin, Texas, 182 pp.
Fouqué, F., 1879. Santorin et ses éruptions . Masson et cie., Paris, 440 pp.
Fornari, D. J. and Campbell, J. F., 1987. Submarine topography around the Hawaiian Islands. U.S. Geol. Surv. Prof. Pap. 1350, pp. 109–124.
Foshag, W. F. and Gonzalez, J., 1955. Birth and development of Parícutin volcano, Mexico. U.S. Geol. Surv. Bull. 965-D, pp. 355–489.
Foulger, G. L. and Long, R. E., 1984. Anomalous focal mechanisms: tensile crack formation on an accreting plate boundary. Nature 310 : 43–45.
Fournier, R. O. and Rowe, J.J., 1966. Estimation of underground temperatures from the silica content of water from hot springs and wet-steam wells. Am. J. Sci. 264 : 685–697.
Fournier, R. O., Thompson, J. M., and Austin, C. F., 1980. Interpretation of chemical analyses of waters collected from two geothermal wells at Coso, J. Geophys. Res. 85 : 2405–2410.
Francis, P., Hammill, M., Kretzchmar, G., and Thorpe, R., 1978. The Cerro Galan caldera, NW Argentina and its tectonic significance. Nature 274 : 749–751.
Frazzetta, G., La Volpe, L., and Sheridan, M. F., 1983. Evolution of the Fossa cone, Vulcano. J. Volcanol. Geotherm. Res. 17 : 329–360.
Fridleifsson, I. B., 1975. Lithology and structure of geothermal reservoir rocks in Iceland. Proc. 2nd U.N. Geotherm. Symp., U.S. Gov't. Printing Office, pp. 371–376.
Friedleifsson, I. B., 1978/79. Applied volcanology in geothermal exploration in Iceland. Pageoph. 117 : 242–252.
Friedman, I., 1976. Obsidian hydration dating of volcanic events. Geol. Soc. Am. Abst. Prog. 8 : 875–876.
Friedman, I., Long, W., and Smith, R. L., 1963. Viscosity and water content of rhyolite glass. J. Geophys. Res. 4 : 6523–6535.
Friedman, I. and O'Neil, J. R., 1977. Compilation of stable isotope fractionation factors of geochemical interest. U.S. Geol. Surv. Prof. Pap. 440-K, 12 pp.
Friedman, J. D., Olhoeft, G. R., Johnson, G. R., and Frank, D., 1981. Heat content and thermal energy of the June dacite dome in relation to total energy yield, May–October 1980. U.S. Geol. Surv. Prof. Pap. 1250, pp. 557–567.
Froggatt, P. C., 1982. Review of methods of estimating rhyolytic tephra volumes; application to the Taupo volcanic zone. J. Volcanol. Geotherm. Res. 14 : 301–318.
Fukutomi, T., 1960. On volcanic hot springs of meteoric and magmatic origin and their probable span. J. Fac. Sci. Hokkaido Univ. Ser. 7 1 : 223.
Fuller, R. E., 1931. The aqueous chilling of basaltic lava on the Columbia River Plateau. Am. J. Sci. 21 : 281–300.
Funiciello, R. Locardi, E., Lombardi, G., and Parotto, M., 1976. The sedimentary ejecta from phreatomagmatic activity and their use for location of potential geothermal areas. Int'l. Cong. on Therm. Waters, Geotherm. Energy, Volcanol. Mediterranean Area, Athens.
Funiciello, R. and Parotto, M., 1978. Il substrato sedimentario nell'area dei Colli Albani (volcano laziale). Geol. Rom. 17 : 23–287.
Funiciello, R., Parotto, M., Mariotti, G., Preite Martinez, M., and Tecce, F., 1979. Geology, mineralogy, and stable isotope geochemistry of the Cesano geothermal field (Sabatini Mountains volcanic system, northern Latium, Italy). Geothermics 8 : 55–73.
Furgerson, R. B., 1973. Progress report on electrical resistivity studies, Coso geothermal area, Inyo County, California. U.S. Naval Weapons Center Rpt. NWC-TP-5497, China Lake, California.
Furnes, H., 1975. Experimental palagonitization of basaltic glasses of varied composition. Contrib. Mineral. Petrol. 50 : 105–113.
Gandino, A., Piovesana, F., Rossi, R., and Zan, L., 1985. Preliminary evaluation of Soufriere geothermal field, St. Lucia (Lesser Antilles), Geotherm. 14 : 577–590.
Gardner, J. N., Goff, F., Garcia, S., and Hagan, R. C., 1986. Stratigraphic relations and lithologic variations in the Jemez Volcanic Field, New Mexico. J. Geophys. Res. 91 : 1763–1778.
Gardner, J. N. and House, L., 1987. Seismic hazards investigations at Los Alamos National Laboratory, 1984–1985. Los Alamos Nat'l Lab. Rpt. LA-11072-MS, 76 pp.
Gast, P. W., 1968. Trace element fractionation and the origin of tholeiitic and alkaline magma types. Geochim. Cosmochim. Acta 32 : 1057–1086.
Geertsma, J. and Haafkens, R., 1979. A comparison of the theories for predicting width and extent of vertical hydraulically
induced fractures. Trans. Am. Soc. Mech. Eng. 101 : 8–20.
Geological Survey of Japan, 1986. Geothermy of Japan . Tokyo, 30 pp.
Gerard, A., Westercamp, D., Bouysse, Ph., Dubreil, G., and Varet, J., 1981. Étude géophysique preliminaire a une evaluation dupotential geothermique des Antilles Francaises (Martinique–Guadeloupe). Doc. du Bur. Rech. Min. 27, 40 pp.
Giggenbach, W. F., 1989. The El Ruiz magmatic-hydrothermal system. (abs.) New Mexico Bur. Mines Min. Resour. Bull. 131 : 106.
Gill, J., 1981. Orogenic andesites and plate tectonics . Springer-Verlag, New York, 390 pp.
Gokcen, N. A., 1975. Thermodynamics . Techscience Inc., Hawthorne, California, 460 pp.
Goff, F. and Vuataz, F.-D., 1984. Hydrogeo-chemical evaluation of the Qualibou caldera geothermal system, St. Lucia, West Indies. In: Evaluation of the St. Lucia geothermal resource, geologic, geophysical, and hydrogeochemical investigations, Los Alamos Nat'l. Lab. Rpt. LA-10234-MS, Los Alamos, New Mexico, pp. 55–88.
Goff, F. E. et al ., 1987. Hydrochemical investigation of six geothermal sites in Honduras, Central America. Los Alamos Nat'l. Lab. Rpt. LA-10785-MS, 170 pp.
Goff, F. E. and Shevenell, L., 1987. Travertine deposits of Soda Dam, New Mexico, and their implications for the age and evolution of the Valles caldera hydrothermal system. Geol. Soc. Am. Bull. 99 : 292–302.
Goff, S., 1986. Curatorial guidelines and procedures for the Continental Scientific Drilling Program. Los Alamos Nat'l. Lab. Rpt. LA-10542-OBES, 23 pp.
Goranson, C. and Schroeder, R., 1978. Static downhole characteristics of well CGEH-1 at Coso Hot Springs, China Lake, California. Lawrence Berkeley Lab. Rpt. LBL-7059, 27 pp.
Green, A. E., 1949. On Boussinesq's problem and penny-shaped cracks. Proc. Cambridge Phil. Soc. 45 : 251–257.
Greenland, L. P., 1970. An Equation for trace element distribution during magmatic crystallization. Am. Mineral. 55 : 455–465.
Greenwood, P. G. and Lee, M. K., 1976. Geophysical surveys in St. Lucia for geothermal resources. Inst. Geol. Sci. Geophys. Div., London, 30 pp.
Grindley, G. W., 1960. Taupo, Geological Map of New Zealand, sheet 8. Dept. Sci. Ind. Res., Wellington, New Zealand.
Grindley, G. W., 1965. The geology, structure, and exploitation of the Wairakei geothermal field, Taupo, New Zealand. N. Z. Geol. Surv. Bull. 75, 131 pp.
Gudmundsson, A., 1986. Mechanical aspects of postglacial volcanism and tectonics of the Reykjanes Peninsula, southwest Iceland. J. Geophys. Res. 91 : 12,711–12,721.
Gudmundsson, A., 1987. Tectonics of the Thingvellir fissure swarm, SW Iceland. J. Structural Geol. 9 : 61–69.
Gutmann, J., 1979. Structure and eruptive cycle of cinder cones in the Pinacate volcanic field and the controls of strombolian activity. J. Geol. 87 : 448–454.
Haar, L., Gallagher, J. S., and Kell, G. S., 1984. NBS/NRC steam tables . McGraw-Hill International Book Company, London, 320 pp.
Hackett, W. R. and Houghton, B. F., 1989. A Facies model for a Quaternary andesitic composite volcano: Ruapehu, New Zealand. Bull. Volcanol. 51 : 51–68.
Handin, J., 1966. Strength and ductility. In: S. P. Clark, Jr. (Ed.), Handbook of physical constants . Geol. Soc. Am. Mem. 97, pp. 224–289.
Harbaugh, J. W. and Bonham-Carter, G., 1970. Computer simulation in geology . Wiley Interscience, New York, 574 pp.
Hardee, H., 1980. Solidification in Kilauea Iki lava lake. J. Volcanol. Geotherm. Res. 1 : 211–223.
Hartz, J. D., 1976. Geothermal reservoir evaluation of the Redondo Creek area, New Mexico. Union Geothermal Co. New Mexico Open-File Rpt., 114 pp.
Hayashi, M., 1973. Hydrothermal alteration in the Otake geothermal area, Kyushu. J. Japan Geotherm. Energy Assoc. 10 : 9–46.
Head, J. W. and Wilson, L., 1986. Volcanic processes and landforms on Venus: theory, predictions, and observations. J. Geophys. Res. 91 : 9407–9446.
Heald, P., Foley, N. K., and Hayba, D. O., 1987. Comparative anatomy of volcanic-hosted epithermal deposits: acid-sulfate and adularia-sericite deposits. Econ. Geol. 82 : 1–26.
Healy, J., 1962. Structure and volcanism in the Taupo Volcanic Zone, New Zealand. In: Crust of the Pacific Basin, Am. Geophys. Union Mono. 6 : 151–157.
Healy, J., 1964. Volcanic mechanisms in the Taupo Volcanic Zone. N. Z. J. Geol. Geophys. 7 : 6–23.
Healy, J., 1976. Geothermal fields in zones of recent volcanism. Proc. 2nd U.N. Symp. on Development and Use of Geotherm. Resour., U.S. Gov't. Printing office, Washington, pp. 413–422.
Healy, J., 1982. Central volcanic region. In: J. M. Soons and M. J. Selby (Eds.), Landforms of New Zealand . Longman Paul, Auckland, pp. 161–192.
Hedenquist, J. W. and Henley, R. W., 1985. Hydrothermal eruptions in the Waiotapu geothermal system, New Zealand: their origin, associated breccias, and relation to precious metal mineralization. Econ. Geol. 80 : 1640–1668.
Heiken, G., 1971. Tuff rings: examples from the Fort Rock-Christmas Lake Valley, south-central Oregon. J. Geophys. Res. 76 : 5615–5626.
Heiken, G., 1972. Morphology and petrography of volcanic ashes. Geol. Soc. Am. Bull. 83 : 1961–1988.
Heiken, G., 1978. Characteristics of tephra from Cinder Cone, Lassen Volcanic National Park, California. Bull. Volcanol. 41 : 119–130.
Heiken, G., 1978b. Plinian-type eruptions in the Medicine Lake Highland, California, and the nature of the underlying magma. J. Volcanol. Geotherm. Res. 4 : 375–402.
Heiken, G., Crowe, B., McGetchin, T., West, F., Eichelberger, J., Bartram, D., Peterson, R., and. Wohletz, K., 1980. Phreatic eruption clouds: the activity of La Soufrière de Guadeloupe, French West Indies, August–October 1976. Bull. Volcanol. 43 : 383–395.
Heiken, G. and Goff, F., 1983. Hot dry rock geothermal energy in the Jemez volcanic field, New Mexico. J. Volcanol. Geotherm. Res. 15 : 223–246.
Heiken, G. and McCoy, F., Jr., 1984. Caldera development during the Minoan eruption, Thira, Cyclades, Greece. J. Geophys. Res. 89 : 8441–8462.
Heiken, G., Goff, F., Stix, J., Tamanyu, S., Shafiqullah, M., Garcia, S., and Hagan, R., 1986. Intracaldera volcanic activity, Toledo caldera and embayment, Jemez Mountains, New Mexico. J. Geophys. Res. 91 : 1799–1815.
Heiken, G. and Krier, D., 1987. Moat deposits of the Creede caldera, Colorado. Los Alamos Nat'l. Lab. Rpt. LA-10943-MS, 48 pp.
Heiken, G. and Wohletz, K., 1983. Phreatomagmatic ash deposits associated with caldera collapse in a shallow submarine environment. Trans. Am. Geophys. Union 64 : 876.
Heiken, G. and Wohletz, K., 1985. Volcanic ash . Univ. California Press, Berkeley, 246 pp.
Heiken, G. and Wohletz, K., 1987. Tephra deposits associated with silicic domes and
lava flows. Geol. Soc. Am. Spec. Pap. 212, pp. 55–76.
Heiken, G., Wohletz, K., and Eichelberger, J., 1988. Fracture fillings and intrusive pyroclasts, Inyo Domes, California. J. Geophys. Res. 93 : 4335–4350.
Heiken, G., Sheridan, M., Wohletz, K., and Duffield, W., 1989. Textural distinction of silicic lavas and welded tuffs using processed scanning electron microscope images. (abs.) New Mexico Bur. Mines Min. Res. Bull. 131, 126 pp.
Heim, A., 1932. Bergsturz and menchenleben . Fretz and Washmuth, Zurich.
Heinrich, E. W., 1965. Microscopic identification of minerals . McGraw-Hill Book Co., New York, 414 pp.
Helz, R. T., 1987. Diverse olivine types in lava of the 1959 eruption of Kilauea Volcano and their bearing on eruption dynamics. U.S. Geol. Surv. Pap. 1350, pp. 691–722.
Henley, R. W. and Ellis, A. J., 1983. Geothermal systems ancient and modern: a geochemical review. Earth Sci. Rev. 19 : 1–50.
Henley, R. W., Truesdell, A. H., and Barton, P. B., Jr., 1983. Fluid-mineral equilibria in hydrothermal systems. Rev. Econ. Geol. 1, 265 pp.
Henry, C. D. and Price, J. G., 1990. The Christmas Mountains caldera complex, Trans-Pecos Texas. Bull. Volcanol. 52 : 97–112.
Hermance, J. F. and Colp, J. L., 1982. Kilauea Iki lava lake: geophysical constraints on its present (1980) physical state. J. Volcanol. Geotherm. Res. 13 : 31–61.
Hildreth, W., 1979. The Bishop Tuff: evidence for the origin of compositional zonation in silicic magma chambers. Geol Soc. Am. Spec. Pap. 180, pp. 43–75.
Hildreth, W., 1981. Gradients in silicic magma chambers: Implications for lithospheric magmatism. J. Geophys. Res. 86 : 10153–10192.
Hildreth, W., Christiansen, R. L., and O'Neill, J. R., 1984. Catastrophic isotopic modification of rhyolitic magma at times of caldera subsidence, Yellowstone Plateau volcanic field. J. Geophys. Res. 89 : 8339–8369.
Hildreth, W. and Fierstein, J., 1985. Mount Adams: eruptive history of an andesitedacite stratovolcano at the focus of a fundamentally basaltic volcanic field. U.S. Geol. Surv. Open-File Rpt. 85-521, pp. 44–51.
Hildreth, W. and Mahood, G. A., 1986. Ringfracture eruption of the Bishop Tuff. Geol. Soc. Am. Bull. 97 : 396–403.
Hildreth, W. and Fierstein, J., 1989. Preliminary geologic map of the Mount Adams volcanic field, Cascade Range of southern Washington. (abs.) New Mexico Bur. Mines Min. Resour. Bull 131, p. 130.
Hill, D. and Zucca, J., 1987. Geophysical constraints on the structure of Kilauea and Mauna Loa volcanoes and some implications for seismomagmatic processes. U.S. Geol. Surv. Prof. Pap. 1350, pp. 31–61.
Hoblitt, R. P., Miller, C. D., and Vallance, J. W., 1981. Origin and stratigraphy of the deposit produced by the May 18 directed blast. In: P. W. Lipman and D. R. Mullineaux (Eds.), The 1980 Eruptions of Mount St. Helens. U.S. Geol. Surv. Prof. Pap. 1250, pp. 401–420
Holcomb, R., 1987. Eruptive history and long-term behavior of Kilauea Volcano. U.S. Geol. Surv. Prof. Pap. 1350, pp. 261–350.
Hon, K. and Fridrich, C., 1989. How calderas resurge. New Mexico Bur. Mines Min. Resour. Bull. 131 , p. 135.
Honnorez, J. and Kirst, P., 1975. Submarine basaltic volcanism: morphometric parameters for discriminating hyaloclastites from hyalotuffs. Bull. Volcanol. 39 : 441–465.
Houghton, B. F. and Schmincke, H.-U., 1989. Rothenberg scoria cone, East Eifel: a complex Strombolian and phreatomagmatic volcano. Bull. Volcanol. 52 : 28–48.
Howard, G. C. and Fast, C. R., 1970. Hydraulic fracturing . Soc. Petrol. Eng. AIME, New York, 193 pp.
Hsu, K., 1975. Catastophic debris streams (Stürzstrom) generated by rock falls. Geol. Soc. Am. Bull. 86 : 129–140.
Hubbert, M. K. and Willis, D. G., 1957. Mechanics of hydraulic fracturing. Trans. Am. Inst. Min. Eng. 210 : 153–168.
Hulen, J. B., 1978. Geology and alteration of the Coso geothermal area, Inyo County, California. Earth Sci. Lab. Res. Inst. Rpt., Univ. Utah, Salt Lake City, Utah, 28 pp.
Hulen, J. B. and Nielson, D. L., 1988. Hydrothermal brecciation in the Jemez fault zone, Valles caldera, New Mexico: results from continental scientific drilling program core hole VC-1. J. Geophys. Res. 93 : 6077–6090.
Hulen, J. B. and Sibbett, B. S., 1982. Sampling and interpretation of drill cuttings from geothermal wells. In: Geothermal log interpretation handbook . Soc. Prof. Well Log Analysts, Tulsa, pp. 1–54.
Hulme, G., 1974. The interpretation of lava flow morphology. Roy. Astr. Soc. Geophys. J. 39 : 361–383.
Hutchinson, C. S., 1974. Laboratory Handbook of petrographic techniques . Wiley-Interscience, New York, 527 pp.
Iijima, A., 1978. Geological occurrences of zeolites in marine environments. In: L. B. Sand and F. A. Mumpton (Eds.), Natural zeolites: occurrence, properties, use . Pergamon Press, Oxford, pp. 175–198.
Ingebritsen, S. E., and Sorey, M. L., 1988. Vapor-dominated zones within hydrothermal systems: evolution and natural state. J. Geophys. Res. 93 : 12635–13655.
Ingebritsen, S. E., Sherrod, D. R., and Mariner, R. H., 1989. Heat flow and hydrothermal circulation in the Cascade Range, north-central Oregon. Science 243 : 1458–1462.
Iriyama, J. and Oki, Y., 1978. Thermal structure and energy of the Hakone Volcano, Japan. Pageoph. 117 : 331–337.
Irwin, G. R., 1957. Analysis of stresses and strains near the end of a crack traversing a plate. J. Appl. Mech. 24 : 361–364.
Ishikawa, T., 1970. Geothermal fields in Japan considered from the geological and petrological view point. Geothermics Spec. Issue 2 : 1205–1211.
Jackson, D. B. and O'Donnell, J. E., 1980. Reconnaissance electrical surveys in the Coso Range, California, J. Geophys. Res. 85 : 2502–2516.
Jackson, D. and Kauahikaua, J., 1987. Regional self-potential anomalies at Kilauea Volcano. U.S. Geol. Surv. Prof. Pap. 1350, pp. 947–959.
Jacobson, R. R. E., MacLeod, W. M., and Black, R., 1958. Ring-complexes in the younger granite province of northern Nigeria. Geol. Soc. London Mem. 1, 72 pp.
Jaeger, J. C. and Cook, N. G. W., 1976. Fundamentals of rock mechanics . Chapman and Hall, London, 585 pp.
Jaggar, T. A., 1949. Steam blast volcanic eruptions. Hawaii Volcano Observatory, 4th Spec. Rpt., 137 pp.
Jakobsson, S. P. and Moore, J. G., 1982. The Surtsey Research Drilling Project of 1979. Surtsey Res. Prog. Rpt. IX, pp. 76–93.
Johnson, G. R. and Olhoeft, G. R., 1984. Density of rocks and minerals. In: R. S. Carmichael (Ed.), Handbook of physical properties of rocks Vol. 3 . CRC Press, Boca Raton, Florida, pp. 1–38.
Johnson, S. M., 1971. Explosive excavation technology. Lawrence Radiation Lab. Rpt. AD-727-651, 229 pp.
Jones, J. G., 1969. Intraglacial volcanoes of the Laugarvatn region, southwest Iceland: I. Quart. J. Geol. Soc. London 124 : 197–211.
Jonsson, V. K. and Matthiasson, M., 1974. Lava cooling on Heimaey—methods and procedures. Timarit VFI 59 : 70–81, 83 (in Icelandic).
Julian, B. R. and Simpkin, S. A., 1985. Earthquake processes in the Long Valley caldera area, California. J. Geophys. Res. 90 : 11, 155–11,169.
Kaizuka, S., Newhall, C., Oyagi, N., and Yagi, H., 1989. Remarkable unrest at Iwo–Jima caldera, Volcano Islands, Japan. (abs.) New Mexico Bur. Mines Min. Resour. Bull. 131, 146 pp.
Kamata, H., 1989. Shishimuta caldera, the buried source of the Yabakei pyroclastic flow in the Hohi volcanic zone, Japan. Bull. Volcanol. 51 : 41–50.
Katsui, Y., 1963. Evolution and magmatic history of some Krakatoan calderas in Hokkaido, Japan. J. Fac. Sci. Hokkaido Univ. Ser. 4, 11 : 631–650.
Katsui, Y., Oba, Y., Ando, S., Nishimura, S., Masuda, Y., Kursawa, H., and Fujimaki, H., 1978. Petrochemistry of the Quaternary volcanic rocks of Hokkaido, northern Japan. J. Fac. Sci. Hokkaido Univ. Ser. 4, 18 : 449–484.
Katsui, Y., Yokoyama, I., and Murozumi, M., 1981. Usu volcano. In: Field excursion guide to Usu and Tarumai Volcanoes and Noboribetsu Spa. Volcanol. Soc. Japan, Symp. on Arc Volcanism, Aug.–Sept., 1981, Tokyo and Hakone, Japan, pp. 1–37.
Keller, J., 1980. The island of Vulcano. Rend. Soc. Ital. Min. Petrol. 36 : 369–414.
Keller, G. V., 1966. Electrical properties of rocks and minerals. In: S.P. Clark, Jr. (Ed.), Handbook of physical constants . Geol. Soc. Am. Mem. 97, pp. 553–577.
Keller, G. V., Grose, L. T., Murray, J. C., and Skokan, C. K., 1979. Results of an experimental drill hole at the summit of Kilauea Volcano, Hawaii. J. Volcanol. Geotherm. Res. 5 : 345–385.
Kents, P., 1964. Special breccias associated with hydrothermal developments in the Andes. Econ. Geol. 59 : 1551–1563.
Kern, L. R., Perkins, T. K., and Wyant, R. E., 1958. The mechanics of sand movement in fracturing. Trans. Soc. Petrol. Eng. AIME 216 : 403–405.
Kieffer, G., Tricot, B., and Vincent, P. M., 1977. Un éruption inhabituelle (Avril 1977) du Piton de la Fournaise (Ile de la Réunion): ses enseignmements volcanologiques and structuraux. C. Rend. Acad. Sci. Paris (Ser. D) 285 : 957–960.
Kieffer, S. W., 1989. Geologic nozzles. Rev. Geophys. 27 : 3–38.
Kieffer, S. W., 1977, Sound speeds in liquid-gas mixtures: water-air and watersteam. J. Geophys. Res. 82 : 2895–2904.
Kieffer, S. W., 1981. Fluid dynamics of the May 18 blast at Mount St. Helens. U.S. Geol. Surv. Prof. Pap. 1250, pp. 379–400.
Kieffer, S. W., 1982. Dynamics and thermodynamics of volcanic eruptions: implication for the plumes on Io. In: D. Morrison (Ed.), Satellites of Jupiter . Univ. Arizona Press, Tucson, pp. 647–723.
Kieffer, S. W., 1984a. Seismicity at Old Faithful geyser: an isolated source of geothermal noise and possible analogue of volcanic seismicity. J. Volcanol. Geotherm. Res. 22 : 59–95.
Kieffer, S. W., 1984b. Factors governing the structure of volcanic jets. In: Explosive volcanism: inception, evolution, and hazards . Studies in Geophysics, National Academy Press, Washington, pp. 143–157.
Kieffer, S. W. and Sturtevant, B., 1984. Laboratory studies of volcanic jets. J. Geophys. Res. 89 : 8253–8268.
Kienle, J. and Forbes, R. B., 1976. Augustine-evolution of a volcano. Ann. Rpt. Geophys. Inst. Univ. Alaska 1975/76, pp. 26–48.
Kimbara, K., 1986. Hot dry rock (HDR) geothermal resources in Japan. Internal Rpt., Geotherm. Res. Dept., Geol. Surv. Japan, 53 pp.
Knapp, R. B. and Knight, J. E., 1977. Differential thermal expansion of pore fluids: fracture propagation and microearthquake production in hot pluton environments. J. Geophys. Res. 82 : 2515–2522.
Knight, M. D., Walker, G. P. L., Ellwood, B. B., and Diehl, J. F., 1986. Stratigraphy, paleo-magnetism, and magnetic fabric of the Toba Tuffs: constraints on the sources and eruptive styles. J. Geophys. Res. 91 : 10,355–10,382.
Koenig, J. B., Gawarecki, S. J., and Austin, C. F., 1972. Remote sensing survey of the Coso geothermal area, Inyo County, California. China Lake Nav. Ordn. Test Sta. Tech Pub. 5233, China Lake, California, 32 pp.
Kokelaar, P., 1986. Magma-water interactions in subaqueous and emergent basaltic volcanism. Bull. Volcanol. 48 : 275–290.
Kolstad, C. D. and McGetchin, T. R., 1978. Thermal evolution models for the Valles caldera with reference to a hot-dry-rock geothermal experiment. J. Volcanol. Geotherm. Res. 3 : 197–218.
Kondo* , Y., Fujitani, T., Katsui, Y., and Niida, K., 1979. Nature of the 1977–1978 volcanic ash from Usu volcano, Hokkaido, Japan. Bull. Volcanol. Soc. Japan 24 : 223–238.
Kroopnick, P. M., Lau, L. S., Buddemeier, R. W., Thomas, D. M., Lau, L. S., and Bills, D., 1978. Hydrology and geochemistry of a Hawaiian geothermal system: HGP-A. Hawaii Inst. Geophys. Tech. Rpt. HIG-78-6, 64 pp.
Krumbein, W. C., 1938. Size frequency of sediments and the normal phi curve. J. Sediment. Petrol. 8 : 89–90.
Kuno, H., 1962. Part XI-Japan, Taiwan, and Marianas. In: Catalogue of the Active Volcanoes of the World . Int'l. Assoc. Volcanol., Roma, 332 pp.
Kuntz, M. A., Rowley, P. D., MacLeod, N. S., Reynolds, R. L., McBroome, L. A., Kaplan, A. M., and Lidke, D. J., 1981. Petrography and particle-size distribution of pyroclastic-flow, ash-cloud, and surge deposits. In: P. W. Lipman and D. R. Mullineaux (Eds.), The 1980 Eruptions of Mount St. Helens. U.S. Geol. Surv. Prof. Pap. 1250, pp. 525–540.
Lachenbruch, A. H., Sass, J. H., Munroe, R. J., and Moses, T. H. Jr., 1976. Geothermal setting and simple heat conduction models for the Long Valley Caldera. J. Geophys. Res. 81 : 769–784.
LaFleur, J., 1983. An exploration overview. Geotherm. Res. Council Trans. 7 : 253–261.
Landau, L. D. and Lifshitz, B. M., 1959. Fluid mechanics: Vol. 6, Course of theoretical physics . Pergamon Press, New York.
Leet, R. C., 1988. Saturated and subcooled boiling in groundwater flow channels as a source of harmonic tremor. J. Geophys. Res. 93 : 4845–4849.
Le Maitre, R. W., 1976. The chemical variability of some common igneous rocks. J. Petrol. 17 : 589–637.
Lipman, P. W., 1967. Mineral and chemical variations within a ash-flow sheet from Aso caldera, southwestern Japan. Contrib. Mineral. Petrol. 16 : 300–327.
Lipman, P. W., 1968. Geology of Summer Coon volcanic center, eastern San Juan Mountains, Colorado. Quarterly of the Colorado School of Mines 63 : 211–236.
Lipman, P. W., 1975. Evolution of the Platoro caldera complex and related volcanic rocks, southeastern San Juan Mountains, Colorado. U.S. Geol. Surv. Prof. Pap. 852, 128 pp.
Lipman, P. W., 1976b. Caldera-collapse breccias in the western San Juan Mountains, Colorado. Geol. Soc. Am. Bull. 87 : 1397–1410.
Lipman, P. W., 1976b. Geologic map of the Lake City caldera area, western San Juan Mountains, southwestern Colorado. U.S. Geol. Surv. Map I–962.
Lipman, P. W., 1984. The roots of ash flow calderas in western North America: Windows into the tops of granitic batholiths. J. Geophys. Res. 89 : 8801–8841.
Lipman, P. W. and Friedman, I., 1975. Interaction of meteoric water with magma: an oxygen isotope study of ash-flow sheets from southern Nevada. Geol. Soc. Am. Bull. 86 : 695–702.
Lipman, P. W., Self, S., and Heiken, G., 1984. Introduction to calderas. (Special issue on calderas) J. Geophys. Res. 89 : 8219–8221.
Lirer, L., Luongo, G., and Scandone, R., 1987. On the volcanological evolution of Campi Flegrei. Trans. Am. Geophys. Union 68 : 226–233.
Lorenz, V., 1986. On the growth of maars and diatremes and its relevance to the formation of tuff rings. Bull. Volcanol. 48 : 265–274.
Love, A. E. H., 1939. Boussinesq's problem for a rigid cone. Quart. J. Math. 10 : 161–175.
Low, J. W., 1977. Examination of well cuttings and the lithologic log. In: L. W. Leroy, D. O. Leroy, and J. W. Raese (Eds.), Subsurface geology . (4th ed.) Colorado School of Mines, Golden, Colorado, pp. 286–303.
MacDonald, G. A., 1972. Volcanoes . Prentice-Hall, Inc., Englewood Cliffs, 510 pp.
Mahood, G. A., 1980. Geological evolution of a Pleistocene rhyolitic center: Sierra La Primavera, Jalisco, Mexico. J. Volcanol. Geotherm. Res. 8 : 199–230.
Malin, M. C. and Sheridan, M. F., 1982. Computer-assisted mapping of pyroclastic surges. Science 217 : 637–640.
Marble, F. E., 1970. Dynamics of dusty gas. Ann. Rev. Fluid Mech. 2 : 397–446.
Mariner, R. H., Presser, T. S., Evans, W. C., and Pringle, M. K. W., 1990. Discharge rates of fluid and heat by thermal springs of the Cascade Range, Washington, Oregon, and Northern California. J. Geophys. Res. 95 : 19,517–19,531.
Marsh, B. D., 1978. On the cooling of ascending andesitic magma. Phil. Trans. Roy. Soc. London (A) 288 : 611–625.
Marsh, B. D., 1979a. Island–arc volcanism. Am. Sci. 67 : 161–172.
Marsh, B. D., 1979b. Island arc development: some observations, experiments, and speculations. J. Geol. 87 : 687–713.
Marsh, B. D. 1984. On the mechanics of caldera resurgence. J. Geophys. Res. 89 : 8245–8252.
Marsh, B. D. and Carmichael, I. S. E., 1974. Benioff zone magmatism. J. Geophys. Res. 79 : 1196–1206.
Mastin, L. G. and Pollard, D. D., 1988. Surface deformation and shallow dike intrusion processes at Inyo Craters, Long Valley, California. J. Geophys. Res. 93 : 13,221–13,235.
Mathews, M., 1982. Wireline well logging—purposes and uses. In: Geothermal log interpretation bandbook . Soc. Prof. Well Log Analysts, Tulsa.
McBirney, A. R., 1959. Factors governing emplacement of volcanic necks. Am. J. Sci. 257 : 431–448.
McBirney, A. R., 1963. Breccia pipe near Cameron, Arizona: discussion. Geol. Soc. Am. Bull. 74 : 227–232.
McBirney, A. R., Sutter, J. F., Naslund, H. R., Sutton, K. G., and White, C. M., 1974. Episodic volcanism in the central Oregon Cascade Range. Geology 2 : 585–589.
McBirney, A. R. and White, C. M., 1982. The Cascade Province. In: R. Thorpe (Ed.), Andesites . Wiley and Sons, New York, pp. 115–135.
McGetchin, T. R., Settle, M., and Chouet, B. A., 1974. Cinder cone growth modeled after Northeast Crater, Mount Etna, Sicily. J. Geophys. Res. 79 : 3257–3272.
McKee, E. H., 1970. Fish Creek Mountains Tuff and volcanic center, Lander County, Nevada. U.S. Geol. Surv. Prof. Pap. 681, 17 pp.
Meijer, A., 1982. Mariana-Volcano Islands. In: R. Thorpe (Ed.), Andesites . Wiley and Sons, New York, pp. 293–306.
Meinzer, O. E., 1923. Outline of groundwater hydrology, with definitions. U.S. Geol. Surv. Water Supply Pap. 494, 71 pp.
Mercalli, G. and Silvestri, O., 1891. Le eruzioni dell'isola di Vulcano, incominciate il 3 Agosto 1888 e terminate il 22 Marzo 1890. Relazione scientifica, 1891. Ann. Uff. Cent. Meteor. Geodin. 10 (4): 1–213.
Merz and McLellan, 1976. Report on exploration and drilling at Soufrière, Ministry of Overseas Development, London, Government of St. Lucia, 48 pp.
Meyer, J., 1989. Intracaldera facies of the Amalia Tuff: insights into collapse and eruption processes. (abs) New Mexico Bur. Mines Min. Resour. Bull. 131, 189 pp.
Miller, C. D., 1985. Holocene eruptions at the Inyo volcanic chain, California: implication for possible eruptions in Long Valley caldera. Geology 13 : 14–17.
Miller, T. P. and Smith, R. L., 1977. Spectacular mobility of ash flows around Aniakchak and Fisher calderas, Alaska. Geology 5 : 173–176.
Minakami, T., Ishikawa, T., and Yagi, K., 1951. The 1944 eruption of volcano Usu in Hokkaido, Japan, Bull. Volcanol. Ser. 2 11 : 45–157.
Moore, J. G., 1966. Rate of palagonitization of submarine basalt adjacent to Hawaii. U.S. Geol. Surv. Prof. Pap. 550D, pp. 163–171.
Moore, J. G., Nakamura, K., and Alcaraz, A., 1966. The 1965 eruption of Taal Volcano. Sci. 151 : 995–960.
Moore, J. L., Osbun, E., and Storm, P. V., 1982. Geology and temperature distribution of Momotombo geothermal field, Nicaragua. Geotherm. Res. Council Spec. Rpt. 12, pp. 137–158.
Moore, R., Wolfe, E., and Ulrich, G., 1976. Volcanic rocks of the eastern and northern parts of the San Francisco volcanic field, Arizona. J. Res. U.S. Geol. Surv. 4 : 549–560.
Mooser, F., Meyer-Abich, H., and McBirney, A. R., 1958. Part IV–Central America. In: Catalogue of the active volcanoes of the world . Int'l. Volcanol. Assoc., Napoli, 146 pp.
Moyle, W. R. Jr., 1977. Summary of basic hydrologic data collected at Coso Hot Springs, Inyo County, California. U.S. Geol. Surv. Open-File Rpt. 77–485, 53 pp.
Muffler, L. J. P. and Cataldi, R., 1978. Methods for regional assessment of geothermal resources. Geothermics 7 : 53–90.
Muffler, L. J. P., White, D. E., and Truesdell, A. H., 1971. Hydrothermal explosion craters in Yellowstone National Park. Geol. Soc. Am. Bull. 82 : 723–740.
Murphy, H., Dash, Z., and Aamodt, L., 1983. Variations of earth stresses with depth near the Valles caldera, New Mexico. Los Alamos Nat'l. Lab. Rpt. ESS-4/83, Los Alamos, New Mexico, 27 pp.
Myers, J. S., 1975. Cauldron subsidence and fluidization: Mechanisms of intrusion of the coastal batholith of Peru into its own volcanic ejecta. Geol. Soc. Am. Bull. 86 : 1209–1220.
Murase, T. and McBirney, A. R., 1973. Properties of some common igneous rocks and their melts at high temperatures: Geol. Soc. Am. Bull. 84 : 3563–3592.
Nairn, I. A. and Self, S., 1978. Explosive eruptions and pyroclastic avalanches from Ngauruhoe in February 1975. J. Volcanol. Geotherm. Res. 3 : 39–60.
Nairn, I. A. and Solia, W., 1980. Late Quaternary hydrothermal explosion breccias at
Kawerau geothermal field, New Zealand. Bull. Volcanol. 43 : 1–13.
Nairn, I. A. and Wiradiradja, S., 1980. Late Quaternary hydrothermal explosion breccias at Kawerau geothermal field, New Zealand. Bull. Volcanol. 43 : 155–177.
Nakamura, K., 1974. Preliminary estimates of global volcanic production rate. In: J. Colp and A. Furomoto (Eds.), The Utilization of volcanic energy . Univ. Hawaii, Hilo, pp. 273–285.
Nakamura, K., 1977. Volcanoes as possible indicators of tectonic stress orientation, J. Volcanol. Geotherm. Res. 2 : 1–16.
Nakamura, K., Jacob, K., and Davies, J., 1977. Volcanoes as possible indicators of tectonic stress orientation—Aleutians and Alaska. Pageoph. 115 : 87–112.
Nakamura, H., 1962. Report on the geological studies of hot springs in Japan. Rpt. Geol. Surv. Japan 192.
Nakamura, H., Watanuki, K., Sumi, K., Suto, S., Sakai, S., and Mori, H., 1981. Geothermal fields of Tohuku. In: Field excursion guide to geothermal fields of Tohoku and Kyushu . Volcanol. Soc. Japan, 42 pp.
Nathenson, M., Guffanti, M., Sass, J. H., and Munroe, R. J., 1982. Regional heat flow and temperature gradients. In: M. J. Reed (Ed.), Assessment of low-temperature geothermal resources of the United States—1982. U.S. Geol. Surv. Circ. 892, pp. 9–16.
Nielson, D. L. and Hulen, J. B., 1984. Internal geology and evolution of the Redondo dome, Valles caldera, New Mexico. J. Geophys. Res. 89 : 8695–8712.
Nelson, C. E. and Giles, D. L., 1985. Hydrothermal eruption mechanisms and hot spring gold deposits. Econ. Geol. 80 : 1663–1639.
Neumann van Padang, M., 1931. Der Ausbruch des Merapi (Mittel Java) im Jahre 1930. Zeit. Vulkan. 14 : 135–148.
Neumann van Padang, M., 1951. Part I—Indonesia. In: Catalogue of the active volcanoes of the world . Int'l. Volcanol. Assoc., Napoli, 271 pp.
Newhall, C. G. and Melson, W. G., 1987. Explosive activity associated with the growth of volcanic domes. J. Volcanol. Geotherm. Res. 17 : 111–131.
Newhall, C. G. and Dzurisin, D., 1988. Historical unrest at large calderas of the World. U.S. Geological Survey Bull. 1855, 1108 pp.
Noe-Nygaard, A., 1940. Subglacial volcanic activity in ancient and recent times. Folia Geograph. Danica 1: no. 2.
Norton, D. L., 1984. Theory of hydrothermal systems. Ann. Rev. Earth Planet. Sci. 12 : 155–177.
O.L.A.D.E., 1983. Geothermal exploration methodology: the reconnaissance and prefeasibility stages. OLADE Doc. Ser. 1, 34 pp.
Ollier, C. D., 1974. Phreatic eruptions and maars. In: L. Civetta et al . (Eds.), Physical volcanology . Elsevier, New York, pp. 289–310.
Palmason, G., 1973. Kinematics and heat flow in a volcanic rift zone, with application to Iceland. Geophys. J. Roy. Astr. Soc. 33 : 451–481.
Park, C. F., Jr. and MacDiarmid, R. A., 1970. Ore deposits . 2nd ed., Freeman, San Francisco, 522 pp.
Paterne, M., Guichard, F., and Labyrie, J., 1988. Explosive activity of the south Italian volcanoes during the past 80,000 years as determined by marine tephrochronology. J. Volcanol. Geotherm. Res. 34 : 153–172.
Pierson, T. C., 1986. Flow behavior of channelized debris flows, Mount St. Helens, Washington. In: A. D. Abrahams (Ed.), Hillside processes . Allen and Unwin, Boston, Massachusetts, pp. 269–296.
Plinius Caecilius Secundus, C. (Pliny the Younger), 1763. The Letters . (English translation by William Melmoth) R. and J. Dodsley, London.
Plouff, D. and Isherwood, W. F., 1980. Aeromagnetic and gravity surveys in the Coso Range, California. J. Geophys. Res. 85 : 2491–2501.
Pollard, D. D., Delaney, P. T., Duffield, W. A., Endo, E. T., and Okamura, A. T., 1983. Surface deformation in volcanic rift zones. Tectonophys. 94 : 541–584.
Prandtl, L., 1949. The Essentials of fluid mechanics . Blackie and Son Ltd., London and Glasgow.
Press, F., 1966. Seismic velocities. In: S. P. Clark, Jr. (Ed.), Handbook of physical constants . Geol. Soc. Am. Mem. 97, pp. 196–221.
Priest, G. R., 1982. Geology and geothermal resources of the Mount Hood area, Oregon. Oregon Dept. Geol. Mineral Indus. Spec. Pap. 14, pp. 16–30.
Priest, G. R. and Vogt, B. V. (Eds.), 1982. Geology and geothermal resources of the Mount Hood area, Oregon. Oregon Dept. Geol. Mineral Indus. Spec. Pap. 14, 100 pp.
Pyle, D. M., 1989. The thickness, volume and grainsize of tephra fall deposits. Bull. Volcanol. 51 : 1–15.
Rabie, R. L., Fowles, G. R., and Fickett, W., 1979. The polymorphic detonation. Phys. Fluids 22 : 422–435.
Radice, B., 1972. Pliny Letters and Panegyricus I . Harvard University Press, Massachusetts.
Ratte, J. C. and Steven, T. A., 1967. Ash flows and related volcanic rocks associated with the Creede caldera, San Juan Mountains, Colorado. U.S. Geol. Surv. Prof. Pap. 524-H, 58 pp.
Rayleigh, J. W. S., 1896. Theoretical considerations respecting the separation of gases by diffusion and similar processes. Philos. Mag. 42 : 77–107.
Reasenberg, P., Ellsworth, W., and Walter, A., 1980. Teleseismic evidence for a low-velocity body under the Coso geothermal area. J. Geophys. Res. 85 : 2471–2483.
Reid, R. C., 1976. Superheated liquids. Am. Sci. 64 : 146–156.
Renner, J. L., White, D. E., and Williams, R. L., 1975. Hydrothermal convection systems. U.S. Geol. Surv. Circ. 726, pp. 5–57.
Rhodes, R. C., 1976. Volcanic geology of the Mogollon Range and adjacent areas, Catron and Grant Counties, New Mexico. New Mexico Geol. Soc. Spec. Publ. 5, pp. 42–50.
Richter, D., Eaton, J., Murata, J., Ault, W., and Krivoy, H., 1970. Chronological narrative of the 1959–60 eruption of Kilauea volcano, Hawaii. U.S. Geol. Surv. Prof. Pap. 537-E, 73 pp.
Richter, D. and Moore, J., 1966. Petrology of the Kilauea Iki lava lake, Hawaii. U.S. Geol. Surv. Prof. Pap. 537-B, pp. B1–B26.
Riecker, R. E. (Ed.), 1979. Rio Grande Rift: Tectonics and magmatism . American Geophysical Union, Washington, D.C., 438 pp.
Rimstadt, J. D. and Cole, D. R., 1983. Geothermal mineralization I: The mechanism of formation of the Beowawe, Nevada siliceous sinter deposit. Am. J. Sci. 283 : 861–875.
Rinehart, J. S.., 1980. Geysers and geothermal energy . Springer-Verlag, New York, 223 pp.
Robert, D., Raharso, R., and Bastaman, S., 1983. Exploration and development of the Kamojang geothermal field. Proc. Indonesian Petrol. Assoc. 12 : 171–190.
Robson, G. R. and Wilmore, P. L., 1955. Some heat measurements in West Indian Soufrières. Bull. Volcanol. 17 : 13–39.
Rogan, A. M., 1982. A geophysical study of the Taupo volcanic zone, New Zealand. J. Geophys. Res. 87 : 4073–4088.
Romagnoli, P., Cuellar, G., Jimenez, M., and Ghezzi, G., 1976. Aspectos hidrogeologicos del campo geotermico de Ahuachapan, El Salvador. In: Proc. 2nd U.N. Symp. on Develop. and Use Geotherm. Resour. U.S. Gov't. Printing Office, pp. 563–570.
Roquemore, G., 1980. Structure, tectonics, and stress field of the Coso Range, Inyo County, California. J. Geophys. Res. 85 : 2434–2440.
Rose, W. I., Jr., Pearson, T., and Bonis, S., 1976. Nuée ardente eruption from the foot of a dacite lava flow, Santiaguito Volcano. Guatemala. Bull. Volcanol. 40 : 23–28.
Rose, W. I., Jr., 1987. Volcanic activity at Santiaguito volcano, 1976–1984. Geol. Soc. Am. Spec. Pap. 212, pp. 17–27.
Rosi, M. and Santacroce, R., 1983. The A.D. 472 "Pollena" eruption: volcanological and petrological data for this poorly-known, Plinian-type event and Vesuvius. J. Volcanol. Geotherm. Res. 17 : 249–272.
Rosi, M., Sbrana, A., and Principe, C., 1983. The Phlegrean Fields: structural evolution, volcanic history, and eruptive mechanisms. J. Volcanol. Geotherm. Res. 17 : 273–288.
Rosi, M. and Sbrana, A. (Eds.), 1987. Phlegrean Fields. Consig. Naz. delle Ric., Quaderni de "la Ricerca Scientifica" 114, 175 pp.
Ross, C. P. and Yates, R. G., 1943. The Coso quicksilver district, Inyo County, California. U.S. Geol. Surv. Bull. 936-Q, pp. 395–416.
Ross, C. S. and Smith, R. L., 1961. Ash-flow tuffs: Their origin, geologic relations, and identification. U.S. Geol. Surv. Prof. Pap. 366, 81 pp.
Rowley, J. C., 1982. Worldwide Geothermal Resources. In: L. M. Edwards et al . (Eds.), Handbook of geothermal energy . Gulf Publ. Co., Houston, pp. 44–176.
Rowley, J. C., 1985. Coring Technologies for Scientific Drilling Projects—An Overview. Los Alamos Nat'l. Lab. Rpt. LA-10485-OBES, 52 pp.
Ryan, M. P. and Sammis, C. G., 1978. Cyclic fracture mechanisms in cooling basalt. Geol. Soc. Am. Bull. 89 : 1295–1308.
Ryan, M. P., 1987a. Neutral buoyancy and the mechanical evolution of magmatic systems. In: B. Mysen (Ed.), Magmatic processes . Geochem. Soc. Spec. Pub. 1, pp. 259–287.
Ryan, M. P., 1987b. Elasticity and contractancy of Hawaiian olivine tholeiite and its role in the stability and structural evolution of subcaldera magma reservoirs and rift systems. U.S. Geol. Surv. Prof. Paper 1350, pp. 1395–1447.
Scandone, R., 1979. Effusion rate and energy balance of Parícutin eruption (1943–1952), Michoacán, Mexico. J. Volcanol. Geotherm. Res. 6 : 49–59.
Schlicting, H., 1979. Boundary-layer theory . (6th ed.) McGraw-Hill, New York, 748 pp.
Schmid, R., 1981. Descriptive nomenclature and classification of pyroclastic deposits and fragments: Recommendations of the IUGS subcommission on the systematics of igneous rocks. Geol. 9 : 41–43.
Schmidt, R. A. and Huddle, C. W., 1977. Effect of confining pressure of fracture toughness of Indiana Limestone. Int'l. J. Rock Mech. Min. Sci. Geomech. Abstr. 14 : 289–293.
Schmincke, H.-U., Fisher, R. V., and Waters, A. C., 1973. Antidune and chute and pool structures in the base surge deposits of the Laacher See area, Germany. Sedimentology 20 : 553–574.
Schmincke, H.-U., 1982, Vulkane und ihre worzlein. Rhein. Westf. Akad. Wiss. Westd. Verlag Opladen. Vortrage N315 : 35–78.
Scott, W. E., 1987. Holocene rhyodacite eruptions on the flanks of South Sister volcano, Oregon. Geol. Soc. Am. Spec. Paper 212, pp. 35–53.
Self, S., 1983. Large-scale phreatomagmatic silicic volcanism: A case study from New Zealand. J. Volcanol. Geotherm. Res. 17 : 433–469.
Self, S. and Sparks, R. S. J., 1978. Characteristics of widespread pyroclastic deposits formed by the interaction of silicic magma and water. Bull. Volcanol. 41 : 196–212.
Self, S. and Sparks, R. S. J. (Eds.), 1981. Tephra studies . D. Reidel Publ. Co., Dordrecht, Holland, 481 pp.
Self, S., Sparks, R. S. J., Booth, B., and Walker, G. P. L., 1974. The 1973 Heimaey Strombolian scoria deposit, Iceland. Geol. Mag. 111 : 534–548.
Self, S., Wilson, L., and Nairn, I. A., 1979. Vulcanian eruption mechanisms. Nature, 277 : 440–443.
Self, S., Kienle, J., and Huot, J. P., 1980. Ukinrek Maars, Alaska, II. Deposits and formation of the 1977 craters. J. Volcanol. Geotherm. Res. 7 : 39–65.
Self, S., Goff, F., Wright, J. V., and Kite, W. M., 1986. Explosive rhyolitic volcanism in the Jemez Mountains: vent locations, caldera development, and relation to regional structure. J. Geophys. Res. 91 : 1779–1798.
Self, S. and Healy, J., 1987. Wairakei Formation, New Zealand: stratigraphy and correlation. N. Z. J. Geol. Geophys. 30 : 73–86.
Serviços Geológicos de Portugal, 1959. Le volcanisme de l'Îsle de Faial et l'éruption de volcan de Capelinhos. Mem. 4 (nova ser.), 100 pp.
Shaw, D. M., 1970. Trace element fractionation during anatexis. Geochim. Cosmochim. Acta. 34 : 237–243.
Shaw, H. R., 1972. Viscosities of magmatic silicate liquids: An empirical method of prediction. Am. J. Sci. 272 : 870–893.
Shaw, H. R., 1985. Links between magmatectonic rate balances, plutonism and volcanism. J. Geophys. Res. 90 : 11,275–11,288.
Shepherd, J. B. and Sigurdsson, H., 1982. Mechanism of the 1979 explosive eruption of Soufriere volcano, St. Vincent. J. Volcanol. Geotherm. Res. 13 : 119–130.
Sheridan, M. F., 1971. Particle-size characteristics of pyroclastic tuffs. J. Geophys. Res. 76 : 5627–5634.
Sheridan, M. F., 1979. Emplacement of pyroclastic flows: a review. Geol. Soc. Am. Spec. Pap. 180, pp. 125–136.
Sheridan, M. F., Barberi, F., Rosi, M., and Santacroce, R., 1981. A model for Plinian eruptions of Vesuvius. Nature 289 : 282–285.
Sheridan, M. F. and Kortemeir, C. P., 1987. Quantitative analysis of surface features on pyroclasts: an example from the Monte Guardia sequence, Lipari. In: J. R. Marshall (Ed.), Clastic Particles . Van Nostrand Reinhold Company, Inc., New York, pp. 122–133.
Sheridan, M. F. and Wohletz K. H., 1981. Hydrovolcanic eruptions I. The systematics of water-pyroclast equilibration. Science 212 : 1387–1389.
Sheridan, M. F. and Wohletz, K. H., 1983a. Hydrovolcanism: basic considerations and review. J. Volcanol. Geotherm. Res. 17 : 1–29.
Sheridan, M. F. and Wohletz, K. H., 1983b. Origin of accretionary lapilli from the Pompeii and Avellino deposits of Vesuvius. In: R. Gooley (Ed.), Microbeam analysis —1983. San Francisco Press, San Francisco, pp. 35–38.
Sheridan, M. F., Wohletz, K. H., and Dehn, J., 1987. Discrimination of grainsize subpopulations in pyroclastic deposits. Geology 15 : 367–370.
Sheridan, M. F., Moyer, T. C., and Wohletz, K. H., 1981. Preliminary report on the pyroclastic products of Vulcano. Mem. Soc. Astron. Ital. 52 : 523–527.
Shimazu, Y., 1963. Thermodynamical aspects of terrestrial evolution. J. Earth Sci. Nagoya Univ. 11 : 28–48.
Sibbett, Bruce S., 1988. Size, depth, and related structures of intrusions under stratovolcanoes and associated geothermal systems. Earth Sci. Reviews 25 : 291–309.
Siebert, L., 1984. Large volcanic debris avalanches: characteristics of source areas, deposits, and associated eruptions. J. Volcanol. Geotherm. Res. 22 : 163–197.
Sigurdsson, H., Carey, S., Cornell, W., and Pescatore, T., 1985. The eruption of Vesu-
vius in A.D. 79. Nat'l. Geograph. Res. 1 (3): 332–387.
Sigurdsson, H. and Sparks, R. S. J., 1978. Rifting episode in north Iceland in 1874–1875 and the eruptions of Askja and Sveinagja. Bull. Volcanol. 41 : 149–167.
Sigvaldason, G., 1968. Structure and products of subaquatic volcanoes in Iceland. Contrib. Mineral. Petrol. 18 : 1–16.
Sigvaldason, G., 1987. Rift volcanoes: an overview. Hawaii Symp. How Volcanoes Work, Hilo, p. 233.
Sillitoe, R., 1973. The tops and bottoms of porphyry copper deposits. Econ. Geol. 68 : 799–815.
Simkin, T. and Fiske, R. S., 1983. Krakatau 1883: The volcanic eruption and its effects . Smithsonian Inst. Press, Washington, D.C., 464 pp.
Slowdowski, T. R., 1977. Geological resume of the Valles Caldera. Union Geotherm. Co. New Mexico Open-File Rpt., 14 pp.
Smith, B. M., 1988. Oxygen isotope evidence for magma-groundwater interactions in early post-collapse rhyolites from the Long Valley caldera, California. Geol. Soc. Am. Abs. Progs. 20 (7): A114.
Smith, J. G., 1987. New compilation geologic map of the Cascade Range in Washington. Trans. Geotherm. Resour. Council 11 : 309–314.
Smith, M. C., Aamodt, R. L., Potter, R. M., and Brown, D. W., 1975. Man-made geothermal systems. Proc. U.N. Symp. on Geotherm. Energy, San Francisco, pp. 1781–1787.
Smith, R. L., 1979. Ash-flow magmatism. Geol. Soc. Am. Spec. Pap. 180, pp. 5–27.
Smith, R. L. and Bailey, R. A., 1966. The Bandelier Tuff: study of ash-flow eruption cycles from zoned magma chambers. Bull. Volcanol. 29 : 83–104.
Smith, R. L. and R. A. Bailey, 1968. Resurgent cauldrons. Geol. Soc. Am. Mem. 116, pp. 613–662.
Smith, R. L., Bailey, R. A., and Ross, C. S., 1970. Geologic map of the Jemez Mountains, New Mexico. U.S. Geol. Surv. Map I–571.
Smith, R. L. and Shaw, H.R., 1975. Igneous-related geothermal systems. In: D. E. White (Ed.), Assessment of geothermal resources of the United States—1975. U.S. Geol. Surv. Circ. 726, pp. 58–83.
Smith, R. L. and Shaw, H. R., 1979. Igneous-related geothermal systems. In: L. J. P. Muffler (Ed.), Assessment of geothermal resources of the United States—1978. U.S. Geol. Surv. Circ. 790, pp. 12–17.
Smith, R. L., Shaw, H. R., Luedke, R. G., and Russel, S. L., 1978. Comprehensive tables giving physical data and thermal energy estimates for young igneous systems in the United States. U.S. Geol. Surv. Open-File Rpt., pp. 78–92.
Society of Prof. Well Log Analysts (SPWLA), 1982. Geothermal log interpretation handbook . Tulsa.
Souther, J. G., 1985. Geothermal potential of the Garibaldi Belt. U.S. Geol. Surv. Open-File Rpt. 85-52, pp. 51–52.
Sparks, R. S. J., 1975. Stratigraphy and geology of the ignimbrites of Vulsini Volcano, Central Italy. Geol. Rundsch. 64 : 497–523.
Sparks, R. S. J., 1976. Grain size variations in ignimbrites and implications for the transport of pyroclastic flows. Sedimentology 23 : 147–188.
Sparks, R. S. J. and Wilson, L., 1976. A model for the formation of ignimbrite by gravitational column collapse. J. Geol. Soc. London 132 : 441–451.
Sparks, R. S. J., Wilson, L., and Hulme, G., 1978. Theoretical modeling of the generation, movement, and emplacement of pyroclastic flows by column collapse. J. Geophys. Res. 83 : 1727–1739.
Sparks, R. S. J., and Wilson, L., 1982. Explosive volcanic eruptions: V. Observations of plume dynamics during the 1979 Soufriere eruption, St. Vincent. Geophys. J. Roy. Astr. Soc. 69 : 551–570.
Spence, D. A. and Sharp, P. W., 1983. Self similar solutions for an elastihydrodynamic cavity flow. Univ. Canterbury Math. Dept. Rpt. 30, Christ Church, New Zealand.
Spence, D. A. and Turcotte, D. L., 1985. Magma-driven propagation of cracks. J. Geophys. Res. 90 : 575–580.
Staudigel, H. and Hart, S. R., 1983. Alteration of basaltic glass: Mechanisms and significance for the oceanic crust-seawater budget. Geochim. Cosmochim. Acta 47 : 337–350.
Stearns, H. T. and MacDonald, G. A., 1946. Geology and ground-water resources of the island of Hawaii. Hawaii Div. Hydrography Bull. 9,363 pp.
Stefansson, V., 1981. The Krafla geothermal field, Northeast Iceland. In: L. Rybach and L. Muffler (Eds.), Geothermal systems: principles and case histories . Wiley and Sons, New York, pp. 273–294.
Stefansson, V., Axelsson, G., Sigurdsson, O., Gudmundsson, G., and Steingrimsson, B., 1985. Thermal condition of Surtsey. J. Geodyn. 4 : 91–106.
Steiner, A., 1977. The Wairakei geothermal area, North Island, New Zealand. New Zeal. Geol. Surv. Bull. 90, 136 pp.
Steven, T. A. and Eaton, G. P., 1975. Environment of ore deposition in the Creede mining district, San Juan Mountains, Colorado: I: Geologic, hydrologic, and geophysical setting. Econ. Geol. 70 : 1023–1037.
Steven, T. A., Lipman, P. W., Hail, W. J., Jr., Barker, F., and Luedke, R. G., 1974. Geologic map of the Durango Quadrangle, southwestern Colorado. U.S. Geol. Surv. Map I–764.
Stieltjes, L., 1985. Statistical and probabilistic approach to volcanic hazards for location of geothermal wells and plant in Fournaise active volcano (Réunion Island, western Indian Ocean). Geotherm. Res. Council Trans. 9 : 541–545.
Stipp, J. J., 1968. The geochemistry and petrogenesis of the Cenozoic volcanics of the North Island, New Zealand. Ph.D. Diss., Australian Nat'l. Univ., Canberra.
Stoiber, R. E. and Carr, M. J., 1973. Quaternary volcanic and tectonic sedmentation of Central America. Bull. Volcanol. 37 : 304–325.
Stone, C. and Fan, P.-F., 1978. Hydrothermal alteration of basalts from Hawaii geothermal project Well-A, Kilauea, Hawaii. Geology 6 : 401–404.
Streckeisen, A. L., 1967. Classification and nomenclature of igneous rocks. Neues Jahrb. Mineral. Abhnadl. 107 : 144–240.
Sugimura, A. and Uyeda, S., 1973. Island arcs: Japan and its environs . Elsevier, Amsterdam, 247 pp.
Sun, R. J., 1969. Theoretical size of hydraulically induced horizontal fractures and corresponding surface uplift in an idealized medium. J. Geophys. Res. 74 : 5995–6011.
Swanson, D., 1966. Tieton volcano, a Miocene eruptive center in the southern Cascade Mountains, Washington. Geol. Soc. Am. Bull. 77 : 1293–1314.
Swanson, D. A., Dzurisin, D., Iwatsubo, E. Y., Chadwick, W. W., Jr., Casadevall, T. J., Ewert, J. W., and Heliker, C. C., 1987. Growth of the lava dome at Mount St. Helens, Washington (USA), 1981–1983. Geol. Soc. Am. Spec. Pap. 212, pp. 1–16.
Taylor, B. E. and Wohletz, K. H., 1985. Oxygen isotope exchange in phreatomagmatic phenomena: experimental and natural studies. In: Abs. Int'l. Volcanol. Congr. 1–9 February 1986, Aukland-Hamilton-Rotorua, New Zealand, p. 122.
Taylor, H. P., 1971. Oxygen isotope evidence for large-scale interaction between meteoric ground waters and Tertiary granodiorite intrusions, western Cascade range, Oregon. J. Geophys. Res. 76 : 7855–7874.
Tazieff, H. K., 1958. L'éruption 1957–1958 et la tectonique de Fail (Azores). Soc. Belg. Geol. Bull. 67 : 13–47.
Tester, J., 1982. Energy conversion and economic issues for geothermal energy. In: L. M. Edwards et al . (Eds.), Handbook of geothermal energy . Gulf Publ. Co., Houston, pp. 471–586.
Thomas, D. M., 1987. A geochemical model of the Kilauea east rift zone. U.S. Geological Survey Prof. Pap. 1350, pp. 1507–1525
Thomas, D., Cox, M., Erlandson, D., and Kajiwara, L., 1979. Potential geothermal resources in Hawaii: a preliminary regional survey; Ph. 1 Final Report. Hawaii Inst. Geophys. HIG-79-4, 63 pp.
Thomas, D., et al ., 1983. Geothermal resources of Hawaii. Hawaii Inst. Geophys. Map. U.S. Gov't. Printing Office.
Thompson, B. N., 1966. The geology of the Maroa district. M.Sc. thesis, Auckland Univ., Auckland, New Zealand.
Thorarinsson, S., 1964. Surtsey, the new island in the North Atlantic . Almenna Bokofelagid, Reykjavik, 47 pp.
Thorarinsson, S., 1965, 1966, 1967. The Surtsey eruption; course of events and development of the new island. Surtsey Res. Prog. Rpts. I, II, III, Reykjavik.
Thorarinsson, S., Einarsson, T., and Sigvaldason, G., 1964. The submarine eruption of the Vestmann Islands, 1963–64. Bull. Volcanol. 27 : 437–436.
Tomasson, J. and Kristmannsdottir, H., 1972. High temperature alteration minerals and thermal brines, Reykjanes, Iceland. Contrib. Mineral. Petrol. 36 : 123–134.
Tomblin, J., 1964, The volcanic history and petrology of the Soufriere region, St. Lucia. Ph.D. Diss., Oxford Univ.
Truesdell, A. H. and White, D. E., 1973. Production of superheated steam from vapor-dominated geothermal reservoirs. Geothermics 2 : 145–164.
Tryggvason, E. 1984. Widening of the Krafla fissure during the 1975–1981 volcanotectonic episode. Bull. Volcanol. 47 : 47–69.
Tsuya, H., Machida, H., and Shimozuru, D., 1981. Fuji Volcano. In: Field excursion guide to Fuji, Asama, Kusatsu Shirane and Nantai volcanoes . Volcanol. Soc. Japan, pp. 1–22.
Valentine, G. A. and Wohletz, K. H., 1989. Numerical models of plinian eruption columns and pyroclastic flows. J. Geophys. Res. 94 : 1867–1877.
van Bemmelen, R. W., 1949. The Geology of Indonesia . Gov't. Printing Office, The Hague, 732 pp.
Vaniman, D. and Crowe, B., 1981. Geology and petrology of the basalts of Crater Flat: applications to volcanic risk assessment for the Nevada nuclear waste storage investigations. Los Alamos Nat. Lab. Rpt. LA-8845-MS, 67 pp.
Vatin-Perignon, N., Semet, M. P., Blanc, F., and Joron, J. L., 1984. Petrochemistry of Quaternary pumiceous pyroclastic products in southern Guadeloupe (F.W.I.). Bull. Volcanol. 47 : 749–767.
Verbeek, R. D. M., 1885, Krakatau . Imprimerie de l'Etat, Batavia, Java, 495 pp.
Viereck, L. G., Griffin, B. J., Schmincke, H.-U., and Pritchard, R. G., 1982. Volcaniclastic rocks of the Reydarfjordur drill hole, eastern Iceland 2: alteration. J. Geophys. Res. 87 : 6459–6476.
Vucetich, C. G. and Pullar, W. A., 1964. Stratigraphy and chronology of late Quaternary volcanic ash in Taupo, Rororua and Gisborne district: Pt 2. N. Z. Geol. Surv. Bull. 73 : 43–88.
Voight, B., Glicken, H., Janda, R. J., and Douglass, P. M., 1981. Catastrophic rockslide avalanche of May 18. U.S. Geol. Surv. Prof. Pap. 1250, pp. 347–377.
Wadge, G., 1984. Comparison of volcanic production rates and subduction rates in the Lesser Antilles and Central America. Geology 12 : 555–558.
Walker, G. P. L., 1959. Geology of the Rey-darfjordur area, eastern Iceland. Quar. J. Geol. Soc. London 114 : 367–393.
Walker, G. P. L., 1971. Grain-size characteristics of pyroclastic deposits. J. Geology 79 : 696–714.
Walker, G. P. L., 1973. Explosive volcanic eruptions—a new classification scheme. Geol. Rundsch. 62 : 431–446.
Walker, G. P. L., 1980. The Taupo Pumice: product of the most powerful known (ultraplinian) eruption? J. Volcanol. Geotherm. Res. 8 : 69–94.
Walker, G. P. L., 1981. The Waimihia and Hatepe plinian deposits from the rhyolitic Taupo Volcanic Centre. N. Z. J. Geology Geophys. 24 : 305–324.
Walker, G. P. L., 1984. Downsag calderas, ring faults, caldera sizes, and incremental caldera growth. J. Geophys. Res. 89 : 8407–8416.
Walker, G. P. L., 1986. Koolau dike complex, Oahu: Intensity and origin of a sheeted-dike complex high in a Hawaiian volcanic edifice. Geology 14 : 310–313.
Walker, G. P. L., 1987. The dike complex of Koolau Volcano, Oahu: internal structure of a Hawaiian rift zone. U.S. Geol. Surv. Prof. Pap. 1350, pp. 961–993.
Walker, G. P. L. and Croasdale, R., 1972. Characteristics of some basaltic pyroclastics. Bull. Volcanol. 35 : 303–317.
Walker, G. P. L., Wilson, L., and Bowell, E. L. G., 1971. Explosive volcanic eruptions—I: The rate of fall of pyroclasts. Geophys. J. Roy. Astr. Soc. 22 : 377–383.
Walker, G. P. L., Wilson, C. J. N., and Froggatt, P. C., 1980. Fines depleted ignimbrite in New Zealand—the product of a turbulent pyroclastic flow. Geology 8 : 245–249.
Walter, A. W. and Weaver, C. S., 1980. Seismicity of the Coso Range, California. J. Geophys. Res. 85 : 2441–2458.
Wang, J. S. Y. and Narasimhan, T. N., 1986. Hydrologic mechanisms governing partially saturated fluid flow in fractured welded units and porous nonwelded units of Yucca Mountain. Sandia Nat'l. Lab. Rpt. SAND85-7114, Albuquerque, New Mexico, 74 pp.
Warpinski, N. R., Tyler, L. D., Vollendorf, W. C., and Northrop, D. A., 1981. Direct observation of a sand-propped hydraulic fracture. Sandia Nat'l. Lab. Rpt. SAND81-0225, Albuquerque, New Mexico, 63 pp.
Waters, A. C., 1961. Stratigraphic and lithologic variations in the Colombia River basalt. Am. J. Sci. 259 : 583–611.
Waters, A. C. and Fisher, R. V., 1971. Base surges and their deposits: Capelinhos and Taal Volcanoes. J. Geophys. Res. 76 : 5596–5614.
Wentworth, C. K., 1922. A scale of grade and class terms for clastic sediments. J. Geology 30 : 377–392.
Wentworth, C. K., 1938. Ash formations of the island of Hawaii. Hawaii Volcano Observatory, 3rd Spec. Rpt., Hawaiian Volcano Res. Soc., Honolulu, 173 pp.
White, D. E., 1955. Violent mud-volcano eruption of Lake City hot springs, north-eastern California. Geol. Soc. Am. Bull. 66 : 1109–1130.
White, D. E., 1968. Hydrology, activity, and heat flow of the Steamboat Springs thermal system, Washoe County, Nevada. U.S. Geol. Surv. Prof. Pap. 458C, 109 pp.
White, D. E., 1973. Characteristics of geothermal resources and problems of utilization. In: P. Kruger and C. Otte (Eds.), Geothermal energy—resources, production, stimulation . Stanford Univ. Press, Stanford, California, pp. 69–94.
White, D. E., Thompson, G. A., and Sandberg, C. H., 1964. Rocks, structure, and geologic history of Steamboat Springs thermal area, Washoe County, Nevada. U.S. Geol. Surv. Prof. Pap. 458-B, 63 pp.
White, D. E., Muffler, L. P. J., and Truesdell, A. H., 1971. Vapor-dominated hydrothermal systems compared with hot-water systems. Econ. Geol. 66 , 75–79.
White, D. E. and Williams, D. L. (Eds.), 1975. Assessment of geothermal resources of the United States—1975. U.S. Geol. Surv. Circ. 726, 155 pp.
West, F. G., Heiken, G. H., Homuth, E. F., Peterson, R. W., Crowe, B. M., and Wohletz, K. H., 1978. Tilts associated with volcanic activity Guadeloupe, French West Indies. Los Alamos Nat'l. Lab. Rpt. LA-7500-MS, Los Alamos, New Mexico, 10 pp.
Whitham, A. G. and Sparks, R. S. J., 1986. Pumice. Bull. Volcanol. 48 : 209–224.
Wilcox, R. E., 1965. Volcanic ash chronology. In: H. E. Wright, Jr. and D. G. Frey (Eds.), Quaternary of the United States . Princeton Univ. Press, Princeton, New Jersey, pp. 807–816.
Williams, D. L., Hull, D. A., Ackermann, H. D., and Beeson, M. H., 1982. The Mount Hood region: Volcanic history, structure, and geothermal energy potential. J. Geophys. Res. 87 : 2767–2781.
Williams, H., 1936. Pliocene volcanoes of the Navajo-Hopi country. Geol. Soc. Am. Bull. 47 : 111–172.
Williams, H., 1941. Calderas and their origin. Calif. Univ. Publ. Geol. Sci. Bull. 21 : 51–146.
Williams, H., 1942. The geology of Crater Lake National Park, Oregon, with a reconnaissance of the Cascade Range southward to Mount Shasta. Carnegie Inst. Washington Publ. 540, 162 pp.
Williams, H. and McBirney, A. R., 1979. Volcanology . Freeman, Cooper, and Co., San Francisco, 397 pp.
Williams H., Turner, F. J., and Gilbert, C. M., 1982. Petrography—An introduction to the study of rocks in thin sections . 2nd ed., W. H. Freeman and Company, San Francisco, 626 pp.
Williams, R. S., Jr. and Moore, J. G., 1983. Man against volcano: The eruption on Heimaey, Vestmannaeyjar, Iceland. U.S. Geol. Surv. Circ., 27 pp.
Williamson, K. H., 1979. A model for the Sulphur Springs geothermal field, St. Lucia. Geotherm. 8 : 75–83.
Wilson, C. J. N., Rogan, A. M., Smith, I. E. M., Northey, D. J., Nairn, I. A., and Houghton, B. F., 1984. Caldera volcanoes of the Taupo volcanic zone, New Zealand. J. Geophys. Res. 89 : 8463–8484.
Wilson, L., 1972, Explosive volcanic eruptions—II. The atmospheric trajectories of pyroclasts. Geophys. J. Roy. Astr. Soc. 30 : 381–392.
Wilson, L., 1976. Explosive volcanic eruptions—III. Plinian eruption columns. Geophys. J. Roy. Astr. Soc. 45 : 543–546.
Wilson, L., 1980. Relationships between pressure, volatile content and ejecta velocity in three types of volcanic explosions. J. Volcanol. Geotherm. Res. 8 : 297–313.
Wilson, L., Sparks, R. S. J., Huang, T. C., and Watkins, N. D., 1978. The control of volcanic column heights by eruption energetics and dynamics. J. Geophys. Res. 83 : 1829–1836.
Wilson, L., Sparks, R. S. J., and Walker, G. P. L., 1980. Explosive volcanic eruptions—IV. The control of magma properties and conduit geometry on eruption column behavior. Geophys. J. Roy. Astr. Soc. 63 : 117–148.
Wilson, L. and Walker, G. P. L., 1987. Explosive volcanic eruptions—VI. Ejecta dispersal in plinian eruptions: the control of eruption conditions and atmospheric properties. Geophys. J. R. Astr. Soc. 89 : 657–679.
Wise, W. S., 1968. Geology of the Mount Hood volcano. Oregon Dept. Geology, Mineral Indus. Bull. 62 : 81–98.
Witte, L. C. and Cox, J. E., 1978. The vapor explosion—a second look. J. Metals, 30 (10): 29–35.
Wohletz, K. H., 1983. Mechanisms of hydrovolcanic pyroclast formation: grain-size,
scanning electron microscopy, and experimental results. J. Volcanol. Geotherm. Res. 17 : 31–63.
Wohletz, K. H., 1986. Explosive magmawater interactions: thermodynamics, explosion mechanisms, and field studies. Bull. Volcanol. 48 : 245–264.
Wohletz, K. H., 1987. Chemical and textural surface features of pyroclasts from hydrovolcanic eruption sequences. In: J. R. Marshall (Ed.), Clastic particles . Van Nostrand Reinhold Company Inc., New York, pp. 79–97.
Wohletz, K. H. and Crowe, B. M., 1978. Development of lahars during the 1976 activity of La Soufrière de Guadeloupe. Geol. Soc. Am. Abs. Prog. 10 : 154.
Wohletz, K., Heiken, G., Ander, M., Goff, F., Vuataz, F.-D., and Wadge, G., 1986. The Qualibou caldera, St. Lucia, West Indies. J. Volcanol. Geotherm. Res. 27 : 77–115.
Wohletz, K. H., McGetchin, T. R., Sandford II, M. T., and Jones, E. M., 1984. Hydrodynamic aspects of caldera-forming eruptions: numerical models. J. Geophys. Res. 89 : 8269–8285.
Wohletz, K. H. and McQueen R. G., 1984, Experimental studies of hydromagmatic volcanism. In: Explosive volcanism: inception, evolution, and bazards , Studies in Geophysics, National Academy Press, Washington, pp. 158–169.
Wohletz, K. H. and Sheridan M. F., 1979. A model of pyroclastic surge. Geol. Soc. Am. Spec. Pap. 180, pp. 177–193.
Wohletz, K. H. and Sheridan, M. F., 1983. Hydrovolcanic explosions II: evolution of basaltic tuff rings and tuff cones. Am. J. Sci. 283 : 385–413.
Wohletz, K. H., Sheridan, M. F., and Brown, W. K., 1989. Particle size distributions and the sequential fragmentation/transport theory applied to volcanic ash. J. Geophys. Res. 94 : 15,703–15,721.
Wohletz, K. H. and Valentine, G. A., 1990. Computer simulations of explosive volcanic eruptions. In: M. P. Ryan (Ed.), Magma transport and storage . Wiley and Sons, London, pp. 113–135.
Woldegabriel, G. and Goff, F., 1989. Temporal relationships of volcanism and hydrothermal systems in two areas of the Jemez volcanic field, New Mexico. Geology 17 : 986–989.
Wolfe, J. A., 1980. Fluidization versus phreatomagmatic explosions in breccia pipes. Econ. Geology 75 : 1105–1111.
Woods, A. W., 1988. The fluid dynamics and thermodynamics of eruption columns. Bull. Volcanol. 50 : 169–193.
Wright, J. V., 1979. Formation, transport and deposition of ignimbrites and welded tuffs. Ph.D. Diss., Imperial College, London, 451 pp.
Wright, J. V., Smith, A. L., and Self, S., 1981. A working terminology of pyroclastic deposits. J. Volcanol. Geotherm. Res. 8 : 315–336.
Wright, J. V., Roobol, M. J., Smith, A. L., Sparks, R. S. J., Brazier, S. A., Rose, W. I. Jr., and Sigurdsson, H., 1984. Late Quaternary explosive silicic volcanism on St. Lucia, West Indies, Geol. Mag. 121 : 1–15.
Wright, P. M. and Ward, S. H., 1985. Application of geophysics to exploration for concealed hydrothermal systems in volcanic terrains. Geotherm. Res. Council Trans. 9 : 423–428.
Wyllie, P. J., 1971. The Dynamic earth: textbook in geosciences . Wiley and Sons, Inc., New York, 416 pp.
Yoder, H. S., Jr., 1976. Generation of basaltic magma . National Academy Press, Washington, D. C., 265 pp.
Yokoyama, I., 1964, Preliminary report on a gravimetric survey on Toya Caldera, Hokaido, Japan. J. Fac. Sci. Hokkaido Univ. Ser. 7 11 : 247–250.
Yoshida, T., 1984. Tertiary Ishizuchi cauldron, southwestern Japan arc: Formation by ring fracture subsidence. J. Geophys. Res. 89 : 8502–8510.
Young, C.-Y. and Ward, R. W., 1980, Three-dimensional Q-1 model of the Coso hot springs known geothermal resource area. J. Geophys. Res. 85 : 2459–2470.
Yuhara, K. 1974. Morphological, hydrological, and thermal characteristics of active volcanoes having no geothermal areas; and artificial hydrothermal systems for utilizing their internal heat energy. In: J. Colp and A. Furomoto (Eds.), The utilization of volcano energy . Sandia Lab., Albuquerque, New Mexico, pp. 391–415.
Zablocki, C., Tilling, R., Peterson, D., Keller, G., and Murray, J., 1974. A deep research drill hole at the summit of an active volcano, Hawaii. Geophys. Res. Lett. 1 : 323–326.
Zalessky, B. V., 1961. Use of volcanic tuffs and tuff lavas as building material. Trudy Volcan. Lab. Acad. Sci. U.S.S.R. 20 : 220–222.
Zoback, M. D., Rummel, F., Jung, R., and Raleigh, C. B., 1977. Laboratory hydraulic fracturing experiments in intact and prefractured rock. Int'l. J. Rock Mech. Min. Sci. Geomech. Abst. 14 : 49–58.
Zyvoloski, G., 1987. The effect of structural resurgence on the thermal evolution of the Creede caldera. Geol. Soc. Am. Abs. Prog. 19 : no.5.
Index
A
Accretionary lapilli 60 , 195 , 373
Acoustic
perturbations 31
Adiabatic 373
(see also isentropic )
equation 10
temperature gradient 9
Advection 373
Agglutinate (welded spatter) 269 -272, 373
Ahuachapán, El Salvador 286 -287
Alaskan Peninsula 282
Alban Hills, Italy (Albani volcanic complex) 98 -99
Aleutian arc 282
dike swarms 282
Augustine Volcano 278
Alkalic 13
Alteration 129 -140
(see also hydrothermal )
acid 130
chemical 33
facies 91
depth 134 -135
mineral assemblages 134 -135
temperature 134 -135
microcrystalline 327
palagonitization (see palagonite )
tephra 63 , 66 , 68 , 320 , 328 , 329
vapor phase 187
x-ray analysis 312
Analysis
energy dispersive x-ray 321
fluid inclusion 89
granulometric (see granulometry )
mineral 311
pyroclastic components 68 , 313 , 317 -320
scanning electron microscopy 66 , 180 , 313 , 320 , 320 , 325
water (see hydrogeochemistry )
whole-rock 311
depth 83 -84
interaction with magma 161 -166
"perched" 230
shallow 83 -84
Ash (see pyroclastic rocks )
Ash fall (see pyroclastic fall )
Ash flow (see pyroclastic flow )
Asthenosphere 374
Audiomagnetotelluric 374
Authigenic 374
B
Baccano caldera, Italy 92 , 163
Basaltic volcanoes 5 , 225 -259
geothermal exploration 225 -259
geothermal systems 225 -259
Hawaiian eruption 269 -271
Heimaey, Iceland 253 -256
islands
geothermal potential 253 -256
oceanic 225 -259
Kilauea, Hawaii 226 , 231 -246
Koolau, Hawaii 236 -241
Krafla, Iceland 247 -252
Mauna Loa, Hawaii 233 -239
Réunion Island 255 -257
scoria cones 226 -230
shield volcanoes 226 , 230 , 236
Strombolian eruptions 271 -273
Surtsey, Iceland 252 -255
thermal energy 228 , 234 -239, 250 -252
tuff rings 229
Base surge (see pyroclastic surge )
Bedforms (see pyroclastic rocks )
Block 374
Blocky 374
Bomb 374
Boiling
(see also temperature; thermal; water )
hydrostatic reference curve 51 , 117 , 245
film 52
metastable (superheating) 78 , 127
spontaneous nucleation 78 , 121
Bolsena caldera, Italy 165
Bouillante, Guadeloupe 289 -290
fault 111 -112
hydrothermal (phreatic) 111 -112, 128 -129
laharic 82
intrusive 33
Broken Top volcano, Oregon 281 -282
C
area 14
ash-flow sheets 14
Bolsena, Italy 165
Cerro Galan, Argentina 156
collapse process 146 -150
complex (multiple calderas) 158
Crater Lake, Oregon 141 , 146 , 153
crater lakes 150
downsagged 158
eruption processes 40 , 146 -150
geothermal systems 141 -175
Hakone Volcano, Japan 285
intracaldera deposits 149 , 151
Ishizuchi, Japan 159
Iwo-Jima, Japan 155
Kilauea, Hawaii 238 -239
Koolau, Hawaii 236 -241
Lake City caldera, Colorado 144 , 152 , 162
La Primavera, Mexico 151 , 154
Latera, Italy 161
Latium volcanoes, Italy 161 -166
Long Valley, California 150
magma
bodies 142 -146
composition 40
megabreccias 149
mesobreccias 149
Phlegrean Fields (Campi Flegrei), Italy 166 -170
Platoro caldera, Colorado 162
postcaldera eruptions 155
Qualibou caldera, St. Lucia
ring fault 156
resurgence 150 -156
shape 156 -159
Shishimuta, Japan 157
structure 156 -159
Taupo volcanic center, New Zealand 170 -175
Toba, Sumatra 158
Tuscolano-Artemisio caldera, Italy 92 , 98 -99
thermal energy 160
(Calderas, cont .)
thermal models 160
Valles/Toledo complex, New Mexico 144 , 155 , 157 , 160 , 162
vent distribution 146 -149
Capelinhos, Azores 52
failure 127 -129
seal (cementation) 127 -129, 131
Campanian ignimbrite, Italy 166
Carbonate rocks 161
Central Cascade Range, U.S. 266 -268
Chemistry
(see also geochemistry )
mineral 311
Chemical processes 10 -11
Berthelot-Nernst equation 10
fractional crystallization 11
magma chemistry 10
magma mixing 11
mass balance equation 11
partial melting 10
Rayleigh equation 10
reaction 9
Soret 19
Christmas Mountains, Texas 193
Cinder 374
Cinder cone (see scoria cone )
Cinder Cone, California 273
Classification
alkali-silica variation 14
magmas 13 -14
oxide concentration 14
refractive index 339
silica content 338
textural 338 -339
lava 310
pyroclastic rocks 312
Clast 374
Clay (see mineral )
Coignimbrite 375
(see also pyroclastic fall; flow )
Comminution (fragmentation) 375
(see also fuel-coolant interaction; granulometry )
dome lavas 185
Composite cone 5 , 261 -294, 375
Alaskan volcanoes 282 -283
Ahuachapán, Salvador 286 -287
Bouillante, Guadeloupe 289 -290
Broken Top, Oregon 281 -282
Central Cascade Range, U.S. 266 -270, 285
distribution 262 -265
eruption
rates 265 -267
evolution 269 -279
framework 279 -284
geothermal systems 278 , 284 -293
Hakone volcano, Japan 284
Kawah Kamodjang, Indonesia 284 -290
magma
composition 40 , 262 , 263 , 267 , 269
extrusion rate 265 -267
intrusive volume 268
intrusive/extrusive ratio 268 -269
reservoirs 261 -263
supply 262 -263
volumes of magma types 265 -268
Matsukawa, Japan 288 -289
maturity 269 -279
immature stage 269 -273
mature stage 275 -279
submature stage 273 -275
Meager Mountain, Canada 285 -286
models 279 -284
Momotombo, Nicaragua 286 -288
Mount Fuji, Japan 292
Mount Adams, Washington 292
Mount Hood, Oregon 291 -292
Mount Jefferson, Oregon 268
Mount Shasta, California 290
Mount St. Helens, Washington 278 , 284
Nevado del Ruiz, Colombia 280
Ngauruhoe, New Zealand 274
Ohnuma, Japan 287 -288
"rain curtain" 285
Ruapehu volcano, New Zealand 284
Soufrière de Guadeloupe 278
sector collapse 275 , 278 , 282
segmented arcs 262 -266
subduction zones 261
Summer Coon volcano, Colorado 283 -284
Tamagawa Spa, Japan 289
Three Sisters, Oregon 268
Tieton volcano, Washington 281
Volcanic mudflows 274
Conduit 9
(see also eruption; vent )
erosion (widening) 88
fragmentation level (surface) 86 , 88
overpressure 88
water access 88
Connate 375
Continental Scientific Drilling Program 111
Conversion
factors 353 -354
basic equivalents 354
geothermal heat to electricity 354 -355
efficiency 355
ratio (see thermodynamic )
Core (see drill; well )
Coso volcanic field, California
geologic setting 194 -199
age 197
domes 195 -201
structure 195 -201
tephra 195
volcanic rocks 195 -198
geophysics 201 -204
gravity 204
heat flow 202 -205
geothermal system 194
hydrogeochemistry 200 -201
analyses 203
manifestations 22
volcanological interpretation 204 -205, 210
Crater 4
dome 189
dimensions 43
efficiency 42
excavation 43
high explosives (TNT) 42 -43
lakes 150
Crater Lake, Oregon 141
Crossbed (sandwave, dune) 55 , 375
Cross section 331 -335
drill-hole information 332
field 332
interpretation 332 -334
preliminary interpretation 332
schematic 301
topographic profile 331
Crystal (see phenocryst )
Cuttings (see drill; well )
D
Density
dense-rock equivalent (DRE) 46 , 375
fluidization 81
gas 10
particle (solid) 10
volcanic rocks
Detonation (see fuel-coolant interaction )
Devitrification 375
Diamicton 375
Diagenesis (see alteration )
Diatreme 375
(see also heat flow )
heat 46
rate 187
water 187
Dike
fissure swarms 236 -241, 248 -250, 281 -282, 375
heat sources 236 -246, 248 -250
intensity 236 -241
stress field 111
surface deformation 108
volume 248 -250
coalescing 184
complex 190 -191
composition 40
Coso, California 194 -201
cratered 189 -190
cryptodome 207 -212
destruction 185
evolution 178 -179
geothermal (see hydrothermal )
hydrovolcanism 183 -185
importance of water 187
lava
density 183
extrusion 178
temperature 183
occurrences 157
pyroclastic activity 40
Mont Pelée, Martinique 179 , 185
Peléean and Merapian 185 , 188 , 189
Santiaguito, Guatemala 185
(Dome, cont .)
Soufriere of St. Vincent 184
structure
endogenous 179
exogenous 179
faults 190 -193
intrusive deformation 192 -194
Terre Blanche-Belfond, St. Lucia 213 -223
tephra 180 -186
apron 189
character 185
composition 185
deposits 185
grain size 185
stratigraphy 186
texture 185
volume 183
breccia 184
coarse and fine pumice 181
development 184
Little Glass Mountain, California, 182
stratigraphy 183
surface 182
Usu Volcano, Japan 205 -216
Downsag caldera 158
Drilling
(see also well )
cuttings 370
recommendations 335 -336
Dry surge (see pyroclastic surge )
E
Efficiency (conversion ratio) 32
(see also thermodynamic; fuel-coolant interaction )
cycle 355
Ejecta (see pyroclastic rocks )
Electricity
conversion of geothermal heat to 46 -47, 354 -355
cycle efficiency 354 -355
Endogenous 376
Energy
efficiency (conversion ratio) 42 , 77
electrical (see electricity )
equation
adiabatic (isentropic) 41
isothermal 40 -41
eruption (explosion) 40 -42
geothermal (see geothermal energy )
high explosives 43
mechanical 32
potential 32
pressure-volume 32
thermal 42
subsurface 42 -50
Enthalpy (see heat content )
Entropy
temperature diagram 77
water 77
Equation
adiabatic 10
Berthelot-Nernst 10
conservation
energy 41 -42
mass (continuity) 19 , 25 , 79
flow radius 81
flow volume 81
fluidization 81
gas weight fraction 10
granulometry
log-normal distribution 312
phi scale 312
sequential fragmentation/transport 316
hydraulic fracture
breakdown pressure 97
injection pressure 109 -111
length 109 -111
nondimensional stress intensity 109
volume 109
crustal 9
Fick's second law of diffusion 46 , 361
irrotationality 25
isothermal 10
magma mixing 11
(Equation, cont .)
pore fluid volume 101
pressure coefficient 101
radial deflation 81
Rayleigh 9
sound speed 42
stable isotope 11
steam fraction 77
stress
breakdown pressure 97
brittle failure 97
normal 97
shear 97
superheated expansion 77
tephra volume
circular isopachs 45
elliptical isopachs 45
thermal (internal) energy 42
thermal plume
height 21
centerline velocity 21
spread velocity 22
thermal resource 44
Eruption 7
column 10 , 18 , 21 -22, 24 , 26
cycles 33 , 57 -62, 183 , 184 , 376
effusive 9
dynamics 18 -37
ejecta velocity 10
energy line concept 23 , 28 , 81
jet 22
models 23 -37
pressure-balanced 85 -88
geyser 120 -121
Hawaiian 269 -221
hydrovolcanic (see hydrovolcanic )
magmatic 40 -41
Peléean (see Peléean )
Phreatic 125 -127
Phreatoplinian (see Phreatoplinian )
Plinian (see Plinian )
Strombolian (see Strombolian )
system 18
Vulcanian (see Vulcanian )
Euhedral 376
Exogenous 376
adiabatic 41
saturated 74 -81
superheated 77
Exploration
(see also geothermal )
approach 3 , 39 , 252 , 292 -295
conventional methods 2 -5
Explosion
energy 40 -47
Exsolution 376
Extrusive 376
F
Facies 376
alteration 91
caldera 54 -58, 144 , 152 , 165 , 301
dry surge 56
massive 56
planar 56
pyroclastic surge 57
sandwave 56
scoria cone 229
table mountain 251
tephra 56
tuff cone 56
wet and dry relationships 54 -56
wet surge 56
Fault 4
block 192
breccia 111 -112
dome 189 -190
fracture permeability 155 , 160 -162
Fall velocity
lithic fragments 315
pumice 315
Felsic 376
Field methods 295 -236
aerial photographs 296
cross sections (see cross section )
definition of the problem 295 -296
establishing a stratigraphic framework 297 -302
approach 300 -302
correlation of units 309
(Field methods, cont .)
lava flows and domes 306 -309
pyroclastic and epiclastic rocks 303 -306
volcanic rock units 302 -320
land-ownership maps 297
library research 296
lithology and structure 309 -322
lava 310 -312
pyroclastic rocks 312 -321
regional tectonics 321
volcano tectonics 321
map 322 -331
(see also map )
data 322 -331
three-dimensional modeling 334 -335
notes 303 -304
preparation
problem definition 295 -296
library research 296
geographic materials 296 -300
recommendations 335 -336
drilling 335
satellite images 296 -299
topographic maps 295
Fissure vents 236 -239, 248 -250, 376
Flow
choked 88
foliation (see lava )
heat (see heat flow )
lava 226 , 231 , 242 , 255 , 276 -277, 306 -309
pyroclastic (see pyroclastic flow )
thermal pressurization 106
Fluid
flux 109
hydrothermal (see hydrothermal )
inclusions
analyses 89
homogenization temperature 112
multiphase 24
overpressure 95
reservoir 92
Fluidal 376
Fluvial 376
Fluidization 81
(see also pyroclastic surge )
Fluvial (see water )
Formation 302
Fossa cone (see Vulcano, Italy )
Fracture (crack)
area 103
fluid 103
driven 95
intrusive fillings (pyroclasts) 111 -114
length 105 , 242 , 247 , 248 -250
permeability 95 , 155 , 160 -162
propagation
fracture resistance 110
stress corrosion 113
viscous resistance 110
shape 111
sheet 236
systems 242
Thingvelir, Iceland 248 -250
relation to magma reservoir 248 -250, 252
vertical 236 , 239 , 241 , 249
volume 109
Fragmentation 185
(see fuel-coolant interaction; granulometry )
Fuel-coolant interaction 30 , 52 , 69 -82
analysis 70 -79
conductive heat transfer 70
dynamic instabilities 78
Kelvin-Helmholtz 78
Rayleigh-Taylor 78
efficiency (conversion ratio) 32 , 75 , 77 -78
energy 78
experimental designs 72
grain sizes and shapes 70 , 75 , 76
heat flux 75
interaction phenomena 69 -73
mixing 78 -79
temperature-entropy diagram 77
predictions 74 -82
thermal detonation 78 -79
thermite 72
thermodynamics 74 -82
water/melt interface 77
vapor explosion 78
Fumarole 377
activity 130 , 132 , 178 , 185
acid alteration 132
phreatic eruptions 127
G
Gas
(see volatile; water )
noncondensible (see carbon dioxide )
Gauro Yellow Tuff, Italy 166
Geochemistry
(see chemical processes, hydrogeochemistry )
Geomorphology
(see also landforms )
constraints 5
Geothermal
(see also hydrothermal )
energy 1 -5
exploration (prospecting) 1 -5, 95 , 295
gradient (see thermal gradient )
heat
conversion to electricity 354 -355
reservoir 4
depth 89 -95, 154 -160, 243 -245, 246
development 171
geometry 89 -95, 159 -160, 243 -245, 250 -251
potential 16 , 115 , 171 , 246
pyroclastic deposits 89 -95, 159 -160
resource
systems
caldera 159 -160
basaltic volcanoes 225 -259
hot-dry rock 160
surface manifestations 119 -140, 159 -162
vapor-dominated 120
well (see well )
Geovolcanology (see volcanology )
Geyser
eruption 120 -121
Old Faithful, Wyoming 120 -121
Glass
(see also pyroclastic rocks )
alteration 94
chemical variations 70
hydration 70
palagonitization 70
basaltic 70
devitrification 187
refractive index 339
silicic 94
Glomeroporphyritic 377
Gradient
pressure 88
thermal 51
Grain (clast)
shape 320
size (see granulometry )
Granulometry (grain-size distribution) 8 , 303 , 312 -320, 377
basalts 67
class-size intervals 314
classification 21 -22, 312 , 340 -341
dome tephra 185
economic significance 90
hydrovolcanic (hydroclastic) 67 -68
log-normal distribution 312
median diameter 314 , 316 , 318
sequential fragmentation/transport 315 -320, 322
sieving 312
size-frequency distribution 60
Crater Elegante, Mexico 320
Fogo A tephra, Azores 318 , 323
Mount St. Helens 320
Vesuvius, Italy 321
Vulcano 67
Wairakei Formation 60
Gravitational slumps
Hawaii 226
Réunion Island 255 -259
Groundmass 377
Ground surge (see pyroclastic surge )
Ground tilt 97 , 102 , 107 , 108
Groundwater (see water )
H
Hachimantai geothermal area, Japan 139
Hawaii
Kapoho geothermal area 231 -246
Kilauea volcano 226 , 231 -246
Koolau volcano 236 -241
Mauna Loa volcano 233 -239
Hawaiian eruption 19 , 22 , 239 269 -271, 377
Heat
content (enthalpy) 356 -359
calculation 46 -50
code (numerical procedure) 361 -368
convective 16 , 49 , 102 , 190
cooling 47
diffusion 46
Fick's second law of diffusion 46
fuel-coolant interaction 75
long-term 106
(Heat, cont .)
radioactive decay 9
short-term 106
temporal 9
magmatic 44
mining (see hot dry rock )
source
magmatic 40 -50
Heimaey volcano, Iceland 252 -255
deposits 255
eruption 252
geothermal heating system 255 -256
Hokkaido volcanoes 211
Hot dry rock geothermal systems 46 , 50 , 160 , 377
experiments 50
Fenton Hill, New Mexico 50 , 160
Hyaloclastite 377
Hyalotuff 377
Hydration 377
Hydraulic fracture (hydrofracture) 95 -112, 377
concept 95 -96
conditions 116
experiments 102
fillings 100 -101
intrusive pyroclasts 111 -114
fluids 103
coefficient 103
pumping rate 103
viscosity 105 -116
hydrothermal breccia 112
Inyo domes, California 111
Jemez fault zone, New Mexico 112
Obsidian dome, California 111 -114
proppants 100
crack propagation 109
lubrication 109
Valles caldera, New Mexico 111
vertical 97
volcanic 118
Hydroclast 377
Coso, California 200 -201
Terre Blanche-Belfond, St. Lucia 213 -223
Hydrology
hydrologic environment 30
Hydromagmatic 377
Hydrothermal
adularia-sericite 130
alteration rank 130 -135
areas 135 -140
dating 138
facies 135 -140
mapping 135 -140
assemblage terminology 133
caprock 127 -129
circulation 189 -190
cycle 131
crater 125 -129
eruption 27 , 125 -129, 185 , 378
fields
area 138 -140
volume 138 -140
length of activity 138
manifestations 4 , 119 -140, 200
reservoir 378
depth 92 , 138 -140, 159 -160. 243 -245, 246
geometry 83 , 90 , 138 -140, 159 -160, 243 -245, 250 -251
pyroclastic rocks 188 -191
pillow lava 250 -251
system 378
basaltic volcano 225 -259
caldera 159 -175
composite cone 279 -292
dome 177 -193
presence 39
size 39
location 39
theory 102
Hydrovolcanic 378
analogs (see fuel-coolant interaction )
basic concept 52 -54
breccia 53
caldera 57 -62
chemical alteration 31
cycle 33 -37
deposit 53 -57
dry 54 -56
sequence 85 -92
wet 54 -56
(Hydrovolcanism, cont .)
depth 30
shallow 84 -85
dry 184
eruption mechanics 31 , 52 -53, 252
experiments (see fuel-coolant interaction )
explosive paradox 52
facies (see facies )
fragmentation 67 -68, 71 -79, 84 -86
level 84 -86
geothermal importance 37 , 90 , 82 -95
reservoir depth and geometry 83 -95
thermal regime 89 -93
heat transfer (see fuel-coolant interaction )
hydroclast 62 -68
Krakatau 26
oxygen isotope exchange 71 -73
phenomena 30 -34
Phreatoplinian 86 -87
polygenetic volcano 52 -67
pyroclasts (tephra or products) 33
constituents 63 -67
grain-sizes (see granulometry )
petrography 62 -68
stratigraphy 82 -88
Taupo volcano, New Zealand 57 -58
theory (see fuel-coolant interaction )
Vesuvius, Italy 59 -65
Vulcano, Italy 58 -59
water
access to magma 61
water:magma mass ratio 34 -37, 70 . 84 -85, 87 -90
wet-dry transition in deposits 80 -82
wet 184
I
Iceland
geothermal systems 246 -256
Heimaey volcano 253 -256
high-temperature systems 248 , 250 -252
hot water wells 246
Krafla volcano 247 -252
neovolcanic zones 246 -247
Reykjanes geothermal area 248
Surtsey volcano 252 -255
Ignimbrite 378
(see also pyroclastic flow )
correlation 151
eruption volume 16
Intraplate volcanism 378
Intrusions 142 -146
Inyo domes, California
Inyo crater 111 -114
Obsidian dome 111 -114
Isentropic 378
(see also adiabatic )
expansion 41 -42
exponent (coefficient) 10 , 42 , 356 -359
Isobaric 378
coefficient of thermal expansion 101 , 105
Isopach 378
area 45
circular volume 45
elliptical volume 45
Isothermal 378
coefficient of compressibility 101 , 105
equation 10
expansion 24
Isotope
Long Valley caldera, California 73
oxygen exchange 71 -73
stable 11
tracer 11
K
Kapoho geothermal area, Hawaii 231 -246
Kawah Kamodjang, Indonesia 289 -290
Kilauea Iki, Hawaii 226 , 233 , 271
Kilauea Volcano, Hawaii 108 , 226 , 231 -246
caldera 239 -243
east rift zone 235
east rift zone geothermal system 239 -246
earthquakes 237
electrical generating plant 239 -246
research drill hole 233
rift zones 235
rock densities 237
rock permeabilities 237
Koolau volcano, Hawaii 236 -241
Krafla volcano, Iceland 248 -252
geothermal reservoir 248 -252
L
La Primavera caldera, Mexico 151 , 154
Laacher See volcano, Germany 87
Laboratory analysis 310 -321
(see also analysis )
flow chart 313
pyroclastic sample 312 -322
Christmas mountains, Texas 193
Lahar 82 , 193 , 274 -275, 378
liquefaction 55
water content 79
Lake City caldera, Colorado 144 , 152 , 162
Landform 5
caldera (see caldera )
composite cone (see composite cone )
explosion pit 129
hydrovolcanic (see hydrovolcanism )
monogenetic 54
polygenetic 57 -62
tuff cone (tephra cone) 37 , 54
stapi 30
scoria cones 37 , 54 , 226 -230
Lapilli 378
Latera volcanic field, Italy 91 , 161 -163
Latium volcanoes, Italy 161 -166
Alban Hills 91
Baccano 163
Bolsena 165
Sabatini volcanic complex 91 , 92 , 97 , 101
Vico volcano 91
Vulsini (Latera) volcanic complex 91 , 161 -163
Lava 306 -309
aa 308
brittle failure 185
classification 310
dome (see dome )
flows 306 -308
flow layering 306
jointing 306 -308
pahoehoe 308
pillow 251
sampling 308 -309
thermal effects 308
thickness 308 -309
type 308
viscosity 178
Liquidus 379
(see also pyroclastic rocks )
abundances 89 -95
Alban Hills, Italy 92 , 98 -99
constituents 91 -92
geothermal prospecting 95
Nisyros, Greece 93
Sabatini volcanic complex, Italy 92 , 100 -101
thermally metamorphosed 65
Lithology 309 -320
(see also rocks )
log 370 -371
Lithosphere 379
Logging
cores and cuttings 369 -372
methods 369 -370
Long Valley caldera, California 111
oxygen isotope exchange 111
M
Mach
number 24
Mafic 379
accumulation 11
alkalic 13
body 44 , 142 -146, 234 -239, 248 -250, 261 -268, 279 -285
calcalkalic 13
classification 6
caldera ash-flow sheets 16 , 151
depth 142 -146, 234 -239, 248 -250, 261 , 279 -285
differentiation 17 -19
evolved magmas 20
heat resources 42 -50, 159 -160, 248 -250, 279 -285
neutral buoyancy theory 234 -239
shape 19 , 142 -146, 234 -239, 261 , 279 -285
silicic 20 , 142 -146, 279 -285
tectonic environment 12 , 20 , 225 -226, 248 -250, 261 -267
temperature 44
thermal energy 44
(Magma, cont .)
volume 16 , 44 , 248 -250, 265 -268
zonation 16
elemental enrichment 17
energy 231
generation 12 , 227 , 234 -239
major-element abundances 14 , 338
mixing 11
origin 12
phenocryst content 18
tectonic setting 11 -13, 227 , 234
tholeiitic 13
water 187
interaction (see hydrovolcanism )
Massive bed 55 -56, 59 , 68 , 74
Maturity 379
Map
facies 331
geothermal manifestations 330 -331
land ownership 297
lithological 328
scale and detail 325 -326
structural 328 -331
thematic mapping 326 -327
Maroa volcanic center, New Zealand 171 -175
Matsukawa, Japan 288 -289
Mauna Loa Volcano, Hawaii 233 -239
Meager Mountain, Canada 285 -286
Metamorphism
burial 94
Microlites 379
Microseismicity 379
Mineral
(see also phenocryst )
mafic 338
secondary
assemblages (see hydrothermal )
clays 94
deposition 102
paragenesis 112
temperature 93 -94
zeolites (see zeolites )
silicic 338
Mofete geothermal field, Italy 166 -170
Mohorovicic discontinuity 12 , 380
Momotombo, Nicaragua 286 -288
Monogenetic volcano 380
Mount Adams, Washington 292
Mount Fuji, Japan 292
Mount Hood, Oregon 291 -292
Mount Jefferson, Oregon 268
Mount Shasta, California 290
N
Neapolitan Yellow Tuff (Tufo Giallo), Italy 166
Neovolcanic zones, Iceland 246
Nernst distribution coefficient 10
Neutral buoyancy theory 236 -239
Nevado del Ruiz, Colombia 280
New Zealand
hydrothermal resources 171
Kawerau geothermal field 171
Ngauruhoe volcano 274
Taupo volcanic zone 57 -61, 136 , 170 -175
Ruapehu 284
Wairakei geothermal field 171 -175
Noncondensible gas 380
Nucleation
(see boiling )
O
Ohnuma, Japan 287 -288
method
Step 1 3 -4
Step 2 4
Step 3 4 -5
feasibility 3
prefeasibility 3
reconnaissance 3
Oruanui Pumice Formation, New Zealand
(see Taupo volcanic zone, New Zealand )
Overpressure 95 , 111 , 116 , 380
eruption column 87
P
chemical alteration (variation) 70 , 250 -253
temperature dependence 70
thickness 70
tuff grain size 69
Paleosol 380
Paragenesis 380
Parasitic vent 380
Parícutin volcano, Mexico 228
Peléean eruption 21 , 185 , 276 , 277 , 380
Peralkaline 380
"Perched" aquifer 230
Perlite 380
effective 95
formation (primary) 189 , 239 , 251 -252
fracture (secondary) 95 , 192 , 239
relative 251
Petrogenesis 381
Petrography
(see also analysis )
thin section 310
Petroleum exploration 100
Phenocryst 381
abundance 18
classification usage 15
Phi 381
Phlegrean Fields, Italy 166 -170
Phreatic
crater 4 , 125 -129, 189 , 193 , 213 , 278
eruption 381
Phreatomagmatic eruption 381
(see also hydrovolcanism )
Physical processes 8 -10
adiabatic 9 -10
convection 9
energy
equation 41 -42
line (Heim coefficient) 23 , 81
transfer 9
fluidization 81
fragmentation 84 -86
gravitational acceleration 9
heat flow (see heat flow )
motion equation 22 , 24 , 41 -42
Navier-Stokes equations 10 , 25
numerical solutions 22
perfect gas law 19
Rayleigh number 9
Reynolds number 9
Piton de la Fournaise volcano, 255 -259
Planar bed 55 -59
Platoro caldera, Colorado 162
Platy 381
Plinian eruption 10 , 19 , 21 , 24 , 26 , 40 -41, 87 , 115 , 276 , 381
Pluton 381
(see also magma chamber )
subvolcanic 247
Poisson's ratio 109
Polygenetic volcano 381
caldera 141 -175
composite cone 261 -294
Porosity
fluidization (void space) 81
volcanic rock 340
Pressure
breakdown 97
differential 103
hydrostatic 61 , 84 -85, 97 , 112
injection 97
lithostatic 101 -104
overburden 97
stagnation 24
static 24
Production
management 372
Proppant 381
Pumice 381
Pyroclast 381
Pyroclastic rocks (tephra) 7 , 39 -95
accretionary lapilli 60
massive 53
planar 53
sandwave 53
caldera 151
chemistry
zonation 17
chilling (see quenching )
granulometric 312 -316
textural 320
clast orientation 305
component (constituents) 63 -67, 317 -320
crystal (phenocryst) abundance 45
dense-rock equivalent (DRE) 46
stratigraphy 302 -306
diagenesis (see alteration )
(Pyroclastic rocks, cont .)
dome (see dome tephra )
eruption types 21
facies (see facies )
fallout (see pyroclastic fallout )
flow (see pyroclastic flow )
fragmentation (see fragmentation )
grading 305
grain shape and texture (morphology) 66 , 71 , 320 , 326
grain size (see granulometry )
hyaloclastite 30
hyalotuff 30
impact sag 195
isopach area 45
isopleth 25
laboratory analysis 312 -321
lithification 305
Merapian 185
mixed pyroclastic-epiclastic 341
Peléean 185
peperite 33
petrography 317
hydroclastic 66
Plinian 185
physical properties
permeability 343
porosity 340
sampling 305 -306
idealized 301
surge (see pyroclastic surge )
tephra cone (see tuff cone )
thermal remnant magnetization 305
thickness 303
vesicle 189
volume 45
Vulcanian (Surtseyan) 58 -59, 67 , 185
welding 305
Pyroclastic fallout 21 -22, 374
bedform 21
emplacement 21
isopachs 45
isopleths 25
modeling 21
terminal velocity 315
Pyroclastic flow (ignimbrite) 74 , 22 -23, 305 , 374 , 381
dispersal and emplacement 21
energy line (see physical processes )
gravitational collapse 22 -23, 27
vapor condensation 80 -82
bedform 23
dispersal 21
energy line (see physical processes )
facies (see facies )
fludization 81
grain sizes (see granulometry )
jet structure 24
vapor condensation 80 -82
wet 79
R
Radar 296
side-looking airborne (SLAR) 5 , 296
space shuttle imaging 299
(see also rock )
Reservoir (see geothermal; hydrothermal )
Reynolds number 9
Reykjanes geothermal area, Iceland 248
Resurgent caldera 382
Réunion Island 255 -257
Reworked 382
Rheomorphic tuff 382
Rift zones 225 -258
Rock
families 310
fracture 97
geophysical properties
elastic constants 343
electrical resistivity 346
heat capacity 345
permeability 343
Poisson's ratio 343
radioactivity 345
seismic velocities 344
shear modulus 343
strength 344
stress intensity factor 109 -110
(Rock, cont .)
thermal conductivity 345
well-log response 346
Young's modulus 343
unit 302 -303
volcanic (see volcanic)
Ruapehu volcano, New Zealand 284
S
Sabatini volcanic complex, Italy 92 , 97 , 101
San Ignacio, Honduras 123
San Juan volcanic field, Colorado 161
Sandwave (dune, crossbed) 53 -57, 382
earth resources technology (ERTS) 297
landsat 298
radar 299
synthetic aperture radar (SAR) 299
Scanning electron microscope (SEM) 382
(see also analysis )
microcrystalline alteration 327
pyroclast textures 66
cones 37 , 53 , 226 -230, 253 , 270 -273
bedding 226 -229
height:width ratio 53
Lathrop Wells, Nevada 319 , 324
lithology 226 -229
ejecta dispersal 228
water source 228 -229
Sediment
permeability 343
units 301
Segmented arcs 262 -265
Seismic
fracturing 112
properties 344
tremor 208
harmonic 208
Sha-Kaleri complex, Nigeria 144
Shard 382
Shield volcanoes 230 , 233 , 236
Shock wave 28 -29, 78 , 88 , 382
Silica
content 18
sinter 382
Siliceous sinter 33 , 83 , 121 , 136
amorphous silica solubility 121
chalcedonic sinter 122
form and extent 122
fragmental sinter 122
older spring deposits 125
Silicic, 382
glass 94
volcanism 276 -277
Silicic dome (see dome )
Solidus 382
Soil 5
Soufrière de Guadeloupe 97 , 278 , 289 -290
Sound speed 24
equation 42
multiphase (mixture) 42
sonic transition 88
Statistical methods 8 -9
Steam
chimney 42
dome (two-phase region) 74
fields 51
fraction 77 -78
saturated vapor (wet) 33
superheated (dry) 33
thermodynamic properties (table) 356 -359
Steamboat springs, Nevada 121 , 124
Stratovolcano (stratocone) 383
Stratigraphic framework 297 -302
approach 300 -302
correlation 321 -322
facies 300 -301
tephrochronology 309
volcanic rock units 302 -321
Stratigraphy 297 -309
analysis 300
basement (subvolcanic) 99
dome lava 306 -309
hydrovolcanic
sequence 85
lithic 89 -95
section 303 -305
Stress
compressive 105 -109
corrosion 113
horizontal 108
in situ 100
intensity factor 109
Mohr diagram 97
normal 97
(Stress, cont .)
principal 104
least 97
regional 97
rock strength 344
vertical 97
Strombolian eruption 10 , 19 , 41 , 271 -273, 383
Structure 321 -322
basin fill 193
caldera 156 -159
geophysical 101
interpretation 210
volcanic 321
regional tectonic control 321
Summer Coon volcano, Colorado 283 -284
Supercritical 383
Superheat 383
Surge 383
Surface tension 78
Surtsey volcano, Iceland 52 , 252 -255
permeability 253
(see also Vulcanian eruption )
Survey 2 -5
geophysical 2 -5
hydrogeochemical 2 -5
T
Taal volcano, Philippines 52
Tachylite 383
Tamagawa Spa, Japan 289
Taupo volcanic zone, New Zealand 57 -58, 136 , 170 -175
Maroa volcanic center 171 -175
Oruanui Pumice Formation 58
Wairakei (see Wairakei )
Temperature
economic minimum 44
homogenization (see fluid inclusions )
solidus 46
Tephra 383
Terre Blanche-Belfond, St. Lucia
geology 213 -220
cross sections 220 -221
model 222 -223
stratigraphy 218
volcanism 213 -214
geophysics 216 -221
gravity 216
hydrogeochemistry 216 -223
model 222
volcanological interpretation 218
Texbooks 8
Thermal
anomalies 4
conduction 9
detonation (see fuel-coolant interaction )
diffusion 46
energy 42 -45
expansion 9
conductive 233
convective 243 -246
hydrostatic boiling reference curve 245
modeling parameters 233 , 345 , 361 -362
regime 24 , 89 , 93 , 234 -239, 383
hydrothermal component 159 -160
modeling 44
Thermite 383
Thermodynamic
(see also fuel-coolant interaction )
efficiency (conversion ratio) 42 , 77
parameters 356 -359
state 40
work 32
Thingvelir fracture swarm, Iceland 249
Three Sisters, Oregon 267
Tieton Volcano, Washington 281 -282
Tiltmetry 97
fissure ridge 125
hot spring cones or tower 125
terraces 125
Tuff 383
(see also pyroclastic rocks )
breccia 101
palagonitic 250 -253
rings 37 , 40 , 53 , 229 , 384
height:width ratio 228 -229
water source 229
zeolitic 33
Tuscolano-Artemisio caldera, Italy 92 , 98 -99
U
Ultraplinian eruption 22 , 384
Usu Volcano, Japan
geology 205 -213
phreatic explosion 207 -213
recent volcanism 207 -208
geophysics 208 -216
geothermal manifestations 208
V
Valles/Toledo calderas, New Mexico 144 , 157 , 160 , 162
Vapor
condensation 81 -82
explosion (see fuel-coolant interaction )
phase alteration 384
vaporization 78
Vent 84 -86, 147 -148, 226 -230, 234 -239
Vesuvius, Italy 59 -65
accretionary lapilli 60
archaeological excavation 64
deposits 64
AD 79 eruption 64
model 65
hydrovolcanism 65
stratigraphy 64
Vico volcano, Italy 96
Viscosity
fracturing fluid 109 -111
lava 178
water 105
Vitric 384
Volatile
(see also vapor )
carbon dioxide 50
magmatic 17
overpressure 42
Volcaniclastic 384
Volcanology 1 -2
geothermal prospecting 2 -5
models 2
observations 3
principles 5
Volcanic
ash (see pyroclastic rocks )
conduit 19
hydrofractures (see hydraulic fracturing )
mudflows (lahars) 274 -275
recent 4
volume periodicity 44
Volcanic rocks (products) 302 -321
geophysical properties 342 -346
elastic constants 343
electrical resistivity 346
heat capacity 345
radioactivity 345
permeability 343
seismic velocities 344
shear modulus 343
thermal conductivity 345
well-log response 340
porosity 340
subglacial 250 -251
units 302 -309
characteristics 303 -309
classification 303
color 303
contact relationships 303
Volume
dense-rock equivalent (DRE) 46
extrusive 46
particle fraction 81
pyroclastic rock 45
thermal resource
water 356 -359
Vulcanian eruption 10 , 21 -22, 58 -59, 274 -275
dome growth and destruction 183 , 184 , 187 , 384
kinetic energy 42
mechanism 41 -42
overpressure 41 -42
Soufriere of St. Vincent 184
tephra
dry and wet surge 185
pumice 59
Vulcano, Italy 58 -63
eruption cycles 58
grain sizes 67
hydrovolcanism 58 -59
stratigraphy 62
Vulsini (Latera) volcanic complex, Italy
W
Wairakei, New Zealand 58 -60, 171 -175
eruption model 61
formation 60
(Wairakei, cont .)
geothermal field 171 -175
grain-size characteristics 60
Water
coefficient of thermal expansion 102
composition 203
diffusion 187
entropy 77
fluvial 30
groundwater 30 , 39 , 284 -293
heat capacity 102 , 105 , 356 -359
ice 250 -252
lacustrine 30
magmatic 187
magma interaction (see hydrovolcanism )
metastable (see fuel-coolant interaction )
pressure 105
temperature 105
transport properties 102 , 105
steam (see steam )
volatile constituent 50
weight fraction 10
working fluid 50
Well
exploration 335 -336
logs 371
essential parameters 372
geological 2
geophysical 371 -372
interpretation
method 369 -370
stimulation 50
Wet eruption cycle 33
Wet surge 384
Work
availability 354
working fluid 384