3—
HYDROLOGIC AND HYDRAULIC CONSIDERATIONS IN THE STRUCTURE, FUNCTION, AND PROTECTION OF CALIFORNIA RIPARIAN SYSTEMS
Fluvial Processes and Woodland Succession Along Dry Creek, Sonoma County, California[1]
Joe R. McBride and Jan Strahan[2]
Abstract.—Fluvial processes, as they relate to the formation of riffle bars and point bars, and banks, terraces, and swales of the floodplain terrace are examined in the context of Dry Creek, Sonoma County, California. These processes control seedling establishment and survival on riffle bars, point bars, and the banks of floodplain terraces. Autogenic forces were found to be more important in determining successional patterns on older, more stable portions of the floodplain terrace. Mule fat (Baccharisviminea ), sandbar willow (Salixhindsiana ), red willow (S . laevigata ), and Fremont cottonwood (Populusfremontii ) are dominant species in the pioneer stages on bars and at the base of the floodplain terrace. Hinds walnut (Juglanshindsii ), California box elder (Acernegundo ssp. californicum ), coast live oak (Quercusagrifolia ), and California bay (Umbellulariacalifornica ) dominate the climax woodlands of the undisturbed floodplain terrace.
Introduction
Dry Creek, a tributary of the Russian River, drains some 562 sq. km. (217 sq. mi.) along its 50-km. (31-mi.) course through the Coast Ranges in Sonoma and Mendocino counties of northern California. The lower 22.5 km. (14 mi.) of Dry Creek pass through a broad valley where fluvial geomorphic processes have created and destroyed environments for riparian woodland species. The purpose of this paper is to identify the influence of those processes upon the pattern of succession in the riparian zone.
Dry Creek is a fourth-order stream which forms with its tributaries a palmate, dendritic pattern. An overall channel gradient of 1.5% occurs from its headwaters to the Russian River. The lower reaches, in Dry Creek valley, follow a gradient of 0.2% and drop 1.9 m. per km. (10 ft. per mi.). Average annual precipitation over the Dry Creek watershed varies from 1,016 mm. (40 in.) near Healdsburg to 1,524 mm. (60 in.) in Mendocino County. Stream discharge ranges from average annual flood peaks of about 1,000 cubic feet per second (cfs) to 0 cfs when the stream dries up each year by late August. The maximum recorded flood occurred in December 1964 with a discharge of 32,400 cfs. The 100-year frequency flood is calculated to be 52,000 cfs. (US Army Corps of Engineers 1981).
The vegetation of the riparian zone along Dry Creek is typical of streams in the North Coast Ranges which drain eastward to the Eel and Russian rivers. A mosaic of woodland stands dominated by various mixtures of Fremont cottonwood (Populus fremontii ), Hinds walnut (Juglanshindsii ), red willow (Salixlaevigata ), white alder (Alnusrhombifolia ), California box elder (Acer negundo ssp. californicum ), and Oregon ash (Fraxinuslatifolia ) occur on the banks of these streams. Within the stream channels one finds patches of sandbar willow (Salixhindsiana ) and mule fat (Baccharisviminea ), as well as white alder, cottonwood, and red willow.
Fluvial Processes
Fluvial geomorphic processes, first described by Davis (1909), have recently been reviewed by Leopold etal . (1964) and Keller (1977). These processes determine the characteristics of a stream channel and its adjacent floodplain terrace(s). They also create substrates for the establishment of plants, as well as destroy areas of existing vegetation. As water moves across the land surface in response to gravity, it loses its potential energy as it loses elevation. This potential energy is dissi-
[1] Paper presented at the California Riparian Systems Conference. [University of California, Davis, September 17–19, 1981].
[2] Joe R. McBride is Associate Professor of Forestry and Landscape Architecture, Jan Strahan is Research Assistant in Forestry; both are at the University of California, Berkeley.
pated where the water is in contact with the ground surface or a streambed.
The amount of energy loss per unit area is referred to as the bed shear stress. Transportation of material by a stream occurs when the bed shear stress exceeds the gravitational forces acting upon materials in the streambed. Water velocity and particle size determine the threshold of shear stress required to transport material. Water velocity varies in different parts of a stream channel and, therefore, the potential for transporting materials also varies. In straight sections the greatest velocity occurs in the middle of the stream, just under the water surface. In bends of the channel the flow quickens, and the greatest velocity occurs near the outside of the bend.
Sediments are thus picked up on the concave sides of the stream and tend to be deposited on the convex sides. Along these convex sides the bank is gradually extended streamward by the deposition of a point bar. Along the concave sides the bank is eroded to form a cut bank. The result of these processes is a meandering of the stream, which causes the channel to move laterally. This lateral movement cuts back valley walls to form floodplain terraces. Once formed, the floodplain terrace will serve as a surface for the deposition of smaller particles carried by the stream when it overflows. Deposition on the floodplain terrace combined with scouring of the stream channel leads to an incision of the stream channel into the floodplain terrace. Deposition also occurs at the backs of the point bars. This deposition allows for the extension of the floodplain terrace as the stream moves laterally.
In relatively straight sections of a stream channel, the streambed will follow a somewhat sinuous path. Riffle bars tend to form in these straight sections on alternate sides of the channel. The pattern of riffles and pools tends to be maintained due to the greater bed shear stress in the pools during high flows. However, during peak flows the streambed may be shifted within the stream channel in these straight sections. Braiding of the streambed may also occur where the stream gradient is very low and the channel is wide.
Individual pieces of gravel are moved over the surfaces of both point and riffle bars when the bed shear stress overcomes the gravitational and frictional forces holding them in place. They are carried along the surface of the bar and redeposited as the potential energy of the water is dissipated. Smaller-diameter and lighter pieces are more easily lifted by the bed shear stresses and will be carried farther. Scouring of both the stream channel and the plants growing in the channel can occur during the movement of this material.
In addition to the fluvial processes which create and destroy surfaces for the establishment of riparian species, one must also consider streamflow characteristics which influence seedling establishment and survival in various substrates along the stream and across the stream channel. The fluctuation of water level in the channel both provides moisture to and excludes oxygen from seeds and roots of plants.
Previous Work
Publication of research into the dynamics of riparian vegetation in relation to fluvial processes in California has been limited. Conard etal . (1977) described the distribution of vegetation-types along the Sacramento River. They suggested idealized toposequences of riparian vegetation and indicated that the time interval between major disturbances was related to locations along the toposequence. Their work did not, however, specifically relate species establishment and replacement to fluvial processes.
Pelzman (1973) examined the causes of riparian plant encroachment into streambeds along streams below dams in northern California. Pelzman's field observations and laboratory experiments demonstrated the significance of fluctuations in stream height to successful establishment of common willows and mulefat. He concluded that their establishment was limited by declining spring and summer flows under natural streamflow regimes in California's Mediterranean climate. Pelzman's work is basic to an understanding of the initial stage of succession on newly created substrates in the riparian environment.
Outside of California a number of studies have investigated fluvial processes as they relate to riparian vegetation and succession. Some general concepts can be derived from this body of research; however, climatic differences and different floras limit the transfer of specific findings to the California situation. Swanson and Lienkaemper's (1979) research on the South Fork Hoh River in Washington is an outstanding study of the influence of fluvial processes upon the distribution of riparian and adjacent coniferous forest types. They were able to correlate the age of stands with the creation of various geomorphic surfaces in cross-sections of the South Fork Hoh River valley. They identified four distinctive floodplain terrace environments in the valley which were related to the geomorphic process and which described the character of the vegetation in each environment. They did not, however, examine successional trends on the various terraces.
Fonda (1974), working in the same area, did address the question of succession on the four floodplain terrace environments. He suggested a sequence of Alnusrubra to Piceasitchensis /Acer macrophyllum /Populus trichocarpa to Picea sitchensis /Tsuga heterophylla to Tsugaheterophylla . Soil profile development as it influenced moisture-holding capacity was proposed as a major factor controlling forest succession. Fonda demonstrated that an ability to tolerate soil moisture stress was a significant feature of plants in the early successional stages.
Nanson and Beach (1977) examined forest succession and sedimentation on a meandering-river floodplain in northwestern British Columbia. They used the changing age structure of dominant tree species to describe successional changes within the floodplain forest. The direction of channel migration and the earlier position of the channel's convex bank were accurately preserved in the form of ridges and swales on the floodplain terrace. This pattern allowed Nanson and Beach to establish a chronosequence of plots across the floodplain. The successional change from balsam poplar to white spruce occurred following the decline in overbank sedimentation on surfaces approximately 50 years old. Annual sedimentation during this initial 50 years destroyed any spruce seedlings beneath the balsam poplar crown canopy. The balsam poplar survived each increment of sediment by developing a new root crown near the surface of the deposition.
Research in the mid-western and eastern parts of the United States has identified successional patterns which could be linked to fluvial geomorphic processes (Hefley 1937; Ware and Penfound 1949; Shelford 1954; Wistendahl 1958; Lindsey etal . 1961; Everitt 1968; Wilson 1970; Johnson etal . 1976). Generalizations drawn from these papers suggest that sediment size on point bars controls the species composition of the pioneer stands. Willows are more commonly observed on finer-textured deposits, while cottonwoods develop on the more coarsely textured deposits. As floodplains extend over the back of point bars, the willows and cottonwoods are replaced by species adapted to mesic environments with somewhat reduced soil moisture, such as box elders, elms, ashes, and oaks. Major factors influencing species composition of the riparian forests on the floodplain are depth to water table and moisture-holding capacity of the soil. It would appear from a review of the previous research that initial patterns of succession on point bars are allogenic in character, while subsequent successional changes on the stabilized floodplain are autogenic.
Methods and Results
To study the influence of fluvial processes upon succession on Dry Creek, we selected three physiographic locations representative of the various consequences of fluvial geomorphic processes. These locations were: 1) riffle bars; 2) point bars; and 3) the hydrologically active, stream-adjacent floodplain terrace.
Stream Channel
Riffle Bars
Riffle bars in the relatively undisturbed portions of lower Dry Creek are characterized by low elevations. The highest elevations on these bars are seldom more than 2 m. above the lowest point in the channel cross section. The gradient across these bars, normal to streamflow, is generally very low, although some bars had slopes approaching 45° at the edge of the streambed.
Vegetation on these bars consists of occasional strips of basket sedge (Carexbarbarae ), mulefat, sandbar willow, or sandbar willow/cottonwood. At the back of some riffle bars, adjacent to the floodplain bank, we encountered a narrow secondary streambed which carried water only during higher flows. A lagoon was formed at both the upstream and downstream ends of this streambed. Red willow thickets were common on the floodplain side of these secondary stream banks, while mulefat, sandbar willow, and cottonwood were more commonly found on the riffle bar side.
To determine the pattern of seedling establishment and survival on riffle bars, we measured species density of seedlings and young saplings (plants less than 1 m. tall, assumed to be 1 year old in June 1981) in June and September, 1981. Twenty one-quarter-square-meter quadrats were established in strips of germinating seedlings near the stream edge during the last two weeks of June. Separate sets of 20 quadrats each were located in areas which appeared to be dominated by: 1) basket sedge; 2) mulefat; 3) sandbar willow; 4) cottonwood; and 5) red willow. A similar set of 20 quadrats was established in a zone of young saplings in which mulefat, sandbar willow, cottonwood, and red willow were present.
Results of these measurements suggest there are correlations between 1) species seedling establishment and gravel size; and 2) mortality during the first growing season and depth to groundwater. The transient viabilities of riparian species limit their germination to a moist zone adjacent to the receding stream in late spring. Floating seeds are concentrated on this moist zone. Successful establishment depends upon gravel size in the moist zone. Establishment of some species is limited by larger sizes of gravel. Our results indicate a close correlation between occurrence of particles less than 0.2 cm. and the establishment of sandbar willow (fig. 1.) Available moisture is present for a longer period of time in the fine-textured portions of riffle bars. The transient viability of sandbar willow prevents its establishment on the rockier and drier portions of the bars.
Seedling survival depends upon the availability of soil moisture through the summer months. Among tree species, mortality ranged from 65% to 100% on those plots adjacent to the section of the stream which dried out by September 1, 1981 (table 1). Weekly observations indicated mortality began during the third week in July. Mortality ranged from 6% to 88% for these same species on plots adjacent to water. The depth to water was about 20 cm. on these plots, while it exceeded 1 m. on the former plots by September 1, 1981.
In addition to drought-induced mortality, direct heat injury may kill seedlings during the summer months. Differences in survival among trees may be due to root growth capacity. Cottonwood roots for 1981 seedlings were three times
Figure l.
Percentage occurrence of gravel sizes and seedlings
on riffle bar plots along lower Dry Creek.
| ||||||||||||||||||||||||||||||||||||||||||||||||||||||||
as long as those of the willows. No mortality was recorded on the sapling plots. It is assumed that the seedlings on sapling plots produced sufficient root growth to remain in contact with a water supply during the summer of 1980. Furthermore, these plants survived the winter period of peak discharge. The absence of saplings from many areas on riffle bars suggests that winter scouring of the bars often removes seedlings which survive the first summer. Older saplings on point bars frequently have basal scars on the upstream side of their stems which are the result of scouring away of the bark, phloem, and cambium.
Examination of a series of aerial photographs of Dry Creek dating from the 1940s indicates a shifting of the locations of riffle bars. The streambed may move completely across the stream channel and obliterate a riffle bar with any seedlings and saplings growing upon it. The temporary nature of the riffle bar prevents the development of the riparian woodland beyond the pioneer stage.
Point Bars
The environment of the point bar shares certain characteristics with that of the riffle bar; however, since the point bar is built outward as the stream meanders, it is more stable over time and provides an environment for further development of the riparian woodland. Point bars along Dry Creek had a more significant increase in elevation as one moved away from the streambed than did riffle bars. They were also characterized by more vegetative cover. Seedling establishment at the margin of the streambed followed the same pattern as was observed on the riffle bars. Large numbers of seedlings became established in June only to succumb to heat and drought. Those which survived the rigors of summer, as well as winter scouring, produced linear stands ranging in length from a few to as many as 30 m. in length.
Plants in these strips reduced the velocity of water during high-flow periods and, therefore, caused gravels and smaller-sized particles to accumulate. As a result, point bars often had the appearance of ridges and swales as one moved from the streambed to the bank of the floodplain terrace. The pattern of sediment-trapping depended upon the density of the vegetation and the distance water travelled over the bar. Plant stems often trap larger-sized gravels at the upstream end of point bars and along the edge of the streambed. Finer sediments are deposited toward the downstream end of the bar and the floodplain terrace bank.
To study woodland succession on point bars we conducted a reconnaissance of several point bars along Dry Creek. Vegetative cover on these bars appeared to be closely tied to gravel size distribution and location relative to the streambed. Our reconnaissance indicated that point bars could be divided into five environments as follows: 1) point bar bank; 2) first ridge and swale; 3) interior ridges and swales; 4) lagoons; and 5) base of the floodplain terrace. Not all point bars exhibited all five of these environ-
ments along Dry Creek. Smaller point bars sometimes lacked areas of interior ridges and swales. Lagoons were also not found on all point bars.
A typical point bar exhibiting all five environments was chosen for a detailed analysis of its vegetation and gravel size distribution. The vegetation on the point bar was mapped and four transects were chosen to cut across the various environmental zones and vegetation-types. Along each transect ten adjacent one-quarter square meter plots were established parallel to the streambed in the point bar bank, first ridge and swale, and base of the floodplain terrace environments. In the area of interior ridges and swales, 10 similar plots were established at the top of each ridge and the bottom of each swale along the transect lines. Plants occurring on each plot were tallied as seedlings or, if they were older, their basal diameter and height were recorded. A point frame was also used to determine the distribution of gravel size on each plot.
The data collected along these transects suggested that an autogenic pattern of succession followed the establishment of seedlings along the point bar bank (table 2). Initial seedling establishment along these banks appeared to follow the pattern observed on the riffle bars. Numerous seedlings became established as water receded in the spring. Species success depended upon gravel size. The absence of any seedlings in the 1 cm. size-class suggested that none of last year's cohort survived. The occurrence of plants in the 1–5 cm. and >5 cm. size-classes indicated establishment had been successful in previous years.
On the first ridge and swale, current seedling establishment was dominated by cottonwood and red willow as evidenced by the 1981 seedlings and plants under 1 cm. in diameter. These ridges and swales were dominated by older sandbar willow and mulefat. It would appear that these pioneers established a footing on an earlier streambank and have trapped gravel to produce a ridge as the point bar advanced. The larger gravel sizes trapped by these plants, combined with the higher elevation of the seed beds, have not provided a suitable environment for the continued establishment of sandbar willow and mulefat. Cottonwood and red willow can become established here as evidenced by the data in table 2.
In the zone of interior ridges and swales, gravel size was associated with the distribution of the dominant species. Alder was found on areas of the smallest-sized particles, while sandbar willow and cottonwood occurred on sandy and gravelly sites. Many point bars along Dry Creek lacked extensive areas of smaller-sized particles and did not support alder. No current or recent seedling establishment was observed on any of the plots on the interior ridges and swales. Light intensities were reduced in this zone due to the crown canopy, which may have prevented successful establishment. More important, the elevation
| |||||||||||||||||||||||||||||||||||||||||||||||||||||||||||||||||||||||||||||||||||||||||||||||||||||||||||||||||||||||||||||||||||||||||||||||||||||||||||||||||||||||||||||||||||||||||||||||||||||||||||||||||||||||||||||||||||||||||||||||||||||||||||||||||||||||||||||||||||||||||||||||||||||||||||||||||||||||||||||||||||||||||||||||||||||||||||||||||||||
of this zone was above the elevation where the stream appeared to have deposited vast numbers of seeds during the spring. Seed beds in the interior ridges and swales zone may have been too dry for successful germination during this period of seed dispersal. Vegetative reproduction by layering may have been very important in this zone. Many alder sprouts were growing from buried trunks.
At the base of the floodplain terrace, a gulley occurred across the back of most of the point bars along Dry Creek. Bed shear stress is high at this location during periods of peak runoff. The larger percentage of smaller particle sizes reduces the bed shear stress necesssary to transport material. The gulleys were higher in elevation than the bank of the streambed and dried out much earlier. The more xeric character of these gulleys was responsible for the presence of arroyo willow (Salixlasiolepis ) and the absence of mulefat and sandbar willow. No seedling establishment was observed on the plots measured in these gulleys at the base of the floodplain terrace. Periodic establishment would be expected to occur in years of higher streamflow later in the spring. Winter scour may also be a factor in the dynamics of plants in this zone.
The lagoons supported a margin of mulefat or cattail (Typhalatifolia ) and basket sedge, depending upon the gravel size distribution. Mulefat occurred on coarser gravels, while the cattail and basket sedge grew on sediments less than 0.2 cm. Red willow also occurred above the lagoon margin on the finer sediments.
The conclusion drawn from investigation on point bars is that a type of autogenic succession is occurring in which the initial trapping of coarser sediments by mulefat, willows, and cottonwood produces a ridge of gravel along the outer edge of the point bar. This ridge is a more favorable environment for further cottonwood establishment. As the ridge is built up, finer sediments are deposited between it and the base of the floodplain terrace, toward the downstream end of the point bar. New ridges form adjacent to the stream as the point bar extends laterally. With the growth of cottonwood and willows in the interior ridges, more smaller-sized sediments are trapped, and the swales between ridges begin to fill in.
The increasing height of the bars also contributes to the trapping of smaller-sized particles. The decreased particle size of this substrate results in a more favorable soil-moisture regime for plant growth; however, seed bed conditions are less favorable for willows because of their transient viability. Alder becomes established on the finer sediments of these interior swales and grows up to form a dominant canopy. Shade-intolerant willows and cottonwood cannot survive beneath this canopy. With time, alder dominates the interior downstream portions of the point bars, reproducing primarily by layering. More gravelly areas remain dominated by cottonwood and willow. Floodplain terrace building during unusually high floods may eventually make the ground surface too high and therefore too dry for continued layering of the alder. As the point bar advances laterally, the distance from the streambed to the root systems of alders near the base of the floodplain terrace will become too great for effective water transport. Under these conditions alder will be replaced by species with better adaptations for the floodplain terrace environment.
Floodplain Terrace Environment
To investigate the structure and reproduction of woodlands occurring on the floodplain terrace, we first classified these woodlands into 10 types based on percent cover of dominant species (table 3). These types were mapped on aerial photographs, and their areal contributions to the total riparian woodland along lower Dry Creek were calculated. Types were considered to be dominated by a single species when over 80% of the crown canopy visible on aerial photographs was made up of that species. These types were given the name of the dominant species (e.g., cottonwood). In types where crown-cover dominance was shared by two species, the names of both species were applied using the name of the tallest species first (e.g., cottonwood/willow). Shared dominance was defined as two species making up 80% of the crown cover of an area, but neither species contributing less than 30% of the cover. The type name "mixed riparian woodland" was used for the commonly occurring stands in which several species occurred but none had a crown cover in excess of 30%.
In addition to the classification based on dominant species, the woodlands could also be divided into two broad categories on the basis of width. Narrow woodlands, seldom more than two crown diameters wide, occurred where channel erosion and land clearing had reduced the original riparian woodland. All woodland-types, based on dominant species, occurred in these narrow strips. Wider woodlands, up to 120 m. wide made up the second category. Only the mixed riparian type was observed to occur in this wider category. These wider woodlands were often situated behind point bars and were characterized by irregular surfaces. Distinct swales often cut 3–4 m. into the floodplain terrace surface, carrying water during periods of overbank flow. This characteristic may have prevented them from being cleared for agriculture.
Sampling for tree density, basal area, and regeneration was done in the mixed riparian woodland using the point quarter method with 10 square meter and one square meter plots at point centers for measuring saplings and seedlings. Nested rectangular plots (5 m. × 20 m. for trees; 2 m. × 20 m. for saplings; 1 m. × 20 m. for seedlings) were used in the narrow willow and cottonwood/willow types. Other woodland-types were not sampled because of their limited distribution.
| ||||||||||||||||||||||||||||||||||||
The mixed riparian woodlands were divided into three environments: 1) bank; 2) terrace; and 3) swale. Sample-points were located at 10-m. intervals along transects normal to the stream in each environment. Eleven transects with a total of 85 points were used in the sample. Eight rectangular plots were used to sample the narrow woodland-types.
Bank
Results from the survey of the mixed riparian woodland show a dominance of alder, cottonwood, and red willow in the bank environment (table 4). It should be noted that these two species were not uniformly distributed along the bank. Alder dominated at the upstream and downstream ends of the point bars where the streambed was adjacent to the bank. Cottonwood and red willow were dominant where the banks were in contact with point bars. Size distribution data (table 4) suggest that these dominant species were not regenerating by seed in this environment. Only current-year seedlings of box elder were observed. Stems under 2.5 cm. in diameter of alder and red willow may have been the products of layering or earlier seedling establishment. No cottonwood regeneration was observed.
| ||||||||||||||||||||||||||||||||||||||||||||||||||||||||||||||||||||||||||||||||||||||||||||||||||||||||||||||||||||||||||||||||||||||||||||||||||||||||||||||||||||||||||||||||||||||||||||||||||||||||||||||||||||||||||||||||||||||||||||||||||||||||||||||||||||||||||||||||||||||||||||||||||||||
Terrace
On the floodplain terrace, the mixed riparian woodland exhibited a large basal area of both coast live oak and valley oak (table 5). However, the relative densities of these species were low compared to that of Hinds walnut and willow. Sandbar willow, alder, and cottonwood showed significantly reduced relative densities in
the floodplain terrace environment. The pattern of regeneration suggested Hinds walnut, bay, and Oregon ash were successfully establishing seedlings in this environment. Seedbeds in this environment were dominated by herbaceous cover (often Vincamajor ) or leaf litter. Following peak floods, deposits of silt may temporarily provide mineral seedbeds. The data collected in this portion of the study reflects establishment on nonmineral seedbeds where competition from herbaceous species may be intense.
Swale
The swale environment tended to be dominated by a mixture of Hinds walnut, box elder, coast live oak, and red willow (table 5). Hinds walnut exhibited the largest basal area, while box elder had the highest relative density. Coast live oak showed a large basal area but a much lower relative density than the other dominants; it was found at the upper edge of the swales, while the other species were more common on the lower portion of the swale slopes or in the swale bottoms. Reproduction in the swale environment was dominated by box elder, although regeneration of Hinds walnut, coast live oak, and Oregon ash was evident. Seed beds in the swales tended to be less dominated by herbaceous plants and leafy litter. The swales are more frequently flushed out by winter storms than are the higher surfaces of the floodplain terrace.
The densities of various stem diameter size-classes in the narrower willow and cottonwood/willow types suggests the invasion of more shade-tolerant Hinds walnut and box elder into these types (table 6). With time, stands of willow and cottonwood/willow occurring on the floodplain terrace can be expected to succeed to the mixed riparian woodland. Increment cores taken from larger cottonwood trees in the cottonwood/willow type suggest that these stands are of relatively recent origin (within the last 20 years). At some locations, these types had arisen on fresh deposits of silt following major floods. These deposits were laid down where the floodplain was extended into the stream channel behind newly formed point bars. The two types also appeared to arise at the base of the freshly eroded floodplain banks where gravel rather than the streambed was in contact with the bank. Although initial establishment occurred at the base of the bank, both cottonwood and red willow colonized the lower portions of the floodplain bank.
Conclusions
To summarize the pattern of succession in the environments of the floodplain, one must start with the deposition of silt at the back of the point bar or the exposure of silt on cut banks in the concave sections of streams. Initial colonization of these environments occurs by seedling establishment of red willow and cottonwood. In some cases, cottonwood which is partially buried by the silt deposit may be capable of developing new root systems in the deposit and continuing its growth. Alder may also become established at the base of banks in contact with the streambed. Sandbar willow does not become established in these situations because of the very fine texture of the floodplain silts. Subsequent seedling establishment of more shade-tolerant species occurs in willow and cottonwood/willow stands on the upper slope and top of the floodplain bank. Establishment of additional
| ||||||||||||||||||||||||||||||||||||||||||||||||||||||||||||||||||||||||||||||||||||||||||||||||||||||||||||||||||||||||||||||||||||||||||||||||||||||||||||||||||||||||||
| ||||||||||||||||||||||||||||||||||||||||||||||||||||||||||||||||||||||||||||||||||||||||||||||||||||||||||||||||||||||||||||||||||||||||||||||||||||||||||
species at the base of the bank is somewhat limited by the periodic inundation of this environment. Alder stands established here appear to be self-perpetuating as long as the streambed is in contact with the bank.
Left undisturbed by man, the cottonwood/willow floodplain woodland will undergo succession to a mixture of Hinds walnut, box elder, oak, and bay, with significant variations in basal area and relative density in relation to swales and floodplain terrace locations. As the floodplain terrace builds in height or extends into the stream channel, one can anticipate an increase in the importance of the more drought-tolerant species such as the oaks and bay. These species will dominate the higher elevations in portions of the floodplain woodland and those sites most removed from the stream channel. This steady state is achieved only for brief intervals because of the continuous migration of the stream channel. This migration either destroys the woodland or isolates it from the streambed and the groundwater it needs for the existence of its various species.
Literature Cited
Conard, S. G., R.L. MacDonald, and R.F. Holland. 1977. Riparian vegetation and flora of the Sacramento valley. p. 47–55. In : A. Sands (ed.). Riparian forests of California: their ecology and conservation. Institute of Ecology Pub. 15, University of California, Davis. 122 p.
Davis, W.M. 1909. Geographical essays (reprinted in 1954). 777 p. Dover Publications, New York, N.Y.
Everitt, B.L. 1968. Use of the cottonwood in an investigation of the recent history of a flood plain Amer. Jour. Science 266:417–439.
Fonda, R.W. 1974. Forest succession in relation to river terrace development in Olympic National Park, Washington. Ecol. 55:927–942.
Hefley, H.M. 1937. Ecological studies on the Canadian River floodplain in Cleveland County, Oklahoma. Ecol. Monog. 7(3): 345–484.
Johnson, W.C., R.L. Burgess, and W.R. Keammerer. 1976. Forest overstory vegetation and environment of the Missouri River floodplain in North Dakota. Ecol. Monog. 46:59–84.
Keller, E.A. 1977. The fluvial system: selected observations. p. 39–46. In : A. Sands (ed.). Riparian forests of California: their ecology and conservation. Institute of Ecology Pub. 15, University of California, Davis. 122 p.
Leopold, L.B., W.G. Wolman, and J.P. Miller. 1964. Fluvial processes in geomorphology. 522 p. W.H. Freeman and Company, San Francisco, Calif.
Lindsey, A.A., R.O. Petty, D.K. Sterling, and W.V. Asdall. 1961. Vegetation and environment along the Wabash and Tippecanoe rivers. Ecol. Monog. 31(2):105–156.
Nanson, G.C., and H.F. Beach. 1977. Forest succession and sedimentation on a meanderingriver floodplain, northeast British Columbia, Canada. Jour. Biogeography 4:229–259.
Pelzman, R.J. 1973. Causes and possible prevention of riparian plant encroachment on anadromous fish habitat. California Department of Fish and Game Environmental Services Branch, Administrative Report No. 73-1. Sacramento, Calif. 26 p.
Shelford, V.E. 1954. Some lower Mississippi Valley floodplain biotic communities: their age and elevation. Ecol. 35(2):126–142.
Swanson, F.J. nd G.W. Lienkaemper. 1979. Interactions among fluvial processes, forest vegetation, and aquatic ecosystems, South Fork Hoh River, Olympic National Park, Washington. Proceedings of the Second Conference on Scientific Research in the National Parks. [San Francisco, Calif., Nov. 26–30, 1979]. Vol. 7:23–34.
US Army Corps of Engineers. 1981. Channel improvements. Design Memorandum No. 18. Warm Springs Dam and Lake Sonoma Project. 25 p. US Army Corps of Engineers, San Francisco, Calif.
Ware, G.H., and W.T. Penfound. 1949. The vegetation of the lower levels of the floodplain of the South Canadian River in central Oklahoma. Ecol. 30(4):478–484.
Wilson R.E. 1970. Succession in stands of Populusdeltoides along the Missouri River. Am. Midl. Nat. 83:330–342.
Wistendahl, W.A. 1958. The flood plain of the Raritan River, New Jersey. Ecol. Mono. 28(2):129–153.
Riparian Vegetation Planting for Flood Control[1]
J. Fred Chaimson[2]
Abstract.—The area around Murphy Slough on the Sacramento River near Chico is critical in the operation of the Sacramento River Flood Control Project. Erosion at this location threatens the proper function of the area with potentially catastrophic results. This paper describes a planting plan intended to alleviate some of these problems.
Introduction
Usually flood control maintenance is much more involved in clearing riparian vegetation than in planting it. However, in some cases erosion and wave wash protection are of greater concern than channel capacity. This paper describes an instance of planting riparian vegetation on a site previously cleared for agriculture where erosion control and deposition of sediment is considered desirable.
Background
The area around Murphy Slough on the Sacramento River southwest of Chico, Butte County, is a key element in the Sacramento River Flood Control Project. It is the beginning of the overbank flow of excess water from the river to the Butte Sink and Sutter Bypass. It is also an area of considerable river dynamism, with areas of almost one section (259 hectares) each having changed sides of the river (and ultimately ownership) as late as 1921 (fig. 1).[3]
A review of the current USDI Geological Survey 7.5' quadrangle map dated 1949, and photorevised in 1969, shows a surprising amount of vitality; with the river continuing to erode laterally, narrowing the neck of the oxbow between river mile (RM) points 187.5 and 189.5 in that 20 years. Subsequent erosion has opened the mouth of Murphy Slough to the full force of the Sacramento River (reversing the direction in which it once flowed in this channel).
The problem with this is that when an excessive amount of water is directed into Murphy Slough, some of it returns to the river, across the narrow neck to RM 187 (fig. 2). With the energy of 4.8 km. (3 mi.) of river concentrated in .4 km. (.25 mi.) of cutoff, erosion is inevitable. If the river were to cut off almost 4.8 km. of channel at this location, the headward erosion of the river bottom would lower the water surface upstream of the cutoff, reducing or eliminating entirely the overbank flow at the Chico weir site and carrying the additional water down the channel with the streambed gravels and sands.
Figure 1.
Centerline meanders of the Sacramento River near
Golden State Island, 1920 and 1969 (from Brice, 1977).
[1] Paper presented at the California Riparian Systems Conference [University of California, Davis, September 17–19, 1981].
[2] J. Fred Chaimson is Chief of the Flood Control Maintenance Branch for the State Department of Water Resources, Sacramento, California.
[3] George Carter, Manager of the M&T Ranch, Chico, California. Personal communication.
Figure 2.
Bank lines, Sacramento River, 1980, RM 187 to RM 191
(from Sacramento River Aerial Atlas, September 1980,
Sacramento District, US Army Corps of Engineers).
There are three alternative scenarios to this.
1. The resulting increased flow and debris would stay in the river channel and overtax the levees downstream.
2. The increased velocity and flow, coupled with a rising river bottom (caused by the adjustment of the eroding river bottom upstream), would cause the river to complete eroding of its natural levees somewhere between Sidds Landing (RM 178) and Kimmelshew Bend (RM 186.5), diverting the Sacramento River into Butte Basin (Brice 1977). This would cause widespread flooding in Butte Basin, possible failure of the levees of the Sutter Bypass, and loss of usefulness of the levees of the Sacramento River from Ord Ferry to Verona.
3. The third alternative is similar to the second except that the breakout would be to the west, flooding the nearby towns of Colusa and Princeton. This alternative is considered much less likely, however.
To forestall these possibilities, in 1974–75 the US Army Corps of Engineers (CE), with the usual State participation, constructed two revetment areas on the narrow waist of the peninsula and built an embankment or plug at the cutoff on Murphy Slough. The embankment was outflanked in high water of 1978 with some damage and again in 1980 with considerable damage, including erosion of the unit three revetment at the return to the river. Using emergency funds, the CE repaired and extended the embankment at the cutoff in 1980.
Flood Control Vegetation Studies
Recognizing the value of riparian vegetation in preventing flood damage under some circumstances, the Reclamation Board commissioned the firm of Murray, Burns, and Kienlen to identify areas of riparian vegetation of value to the stability of the river. Of the 38 sites identified, three of them are in this area and two of these, sites 35 and 36 (fig. 3), are pertinent to the problems of the division of flows at Murphy Slough.
Flood Control Planting on Golden State Island
In 1980, the Department of Water Resources and the Reclamation Board entered into an agreement with the Department of Fish and Game and M&T Ranch (the landowners) to provide for revegetation of the riverside slope of Golden State Island. The landowner agreed to provide right-of-entry for the revegetation and agreed not to remove or cause the removal of any resulting vegetation. In addition, he provided irrigation for the first planting and has agreed to do so for the replanting this year.
The planting plan includes:
1. grading of the riverside slope of Golden State Island to a three-to-one or four-to-one slope to prevent rain-caused gullying,
2. planting a mixture of Bermuda grass and rye grass on the slope face, and,
3. planting willow and cottonwood cuttings in the lower part of the slope in the fall season
Figure 3.
Proposed riparian vegetation retention sites in vicinity of
Murphy Slough (from Murray, Burns, and Kienlan 1978).
in accordance with the availability of moisture, and extending the cuttings up the slope in succeeding years as appears necessary or desirable.
In late summer/early fall of 1980, the initial planting of the Bermuda/rye grass mixture was made. Unfortunately, before it was sufficiently established, high water in the relatively mild winter of 1980–81 washed out most of the lower part of the slope (fig. 4). This year, with the promise of irrigation sprinkling being available after mid-August, we will get an earlier start and have better growth before winter (fig. 5). Also, when the California Conservation Corps crews are available, after the fire season in the fall of 1981, we will have the willow/cottonwood plantings made.
One purpose of these plantings, in addition to obvious ones of habitat replacement and erosion control, is to encourage deposition of river-borne materials. Figure 6 shows the deposition of sediments downstream of a willow clump.
The plan is to promote a growth of willows and cottonwoods along the slope of Golden State Island, so that deposition will eventually reclose the mouth of Murphy Slough, reducing the flow of water into it and the resulting pressure on the Murphy Slough Cutoff.
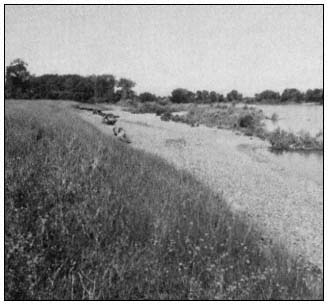
Figure 4.
Eroded bank of Golden State Island.
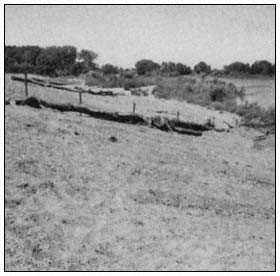
Figure 5.
Re-sloped bank of Golden State Island.
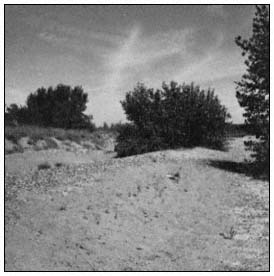
Figure 6.
Depositions downstream of willow bush.
Conclusions
While flood control maintenance at times involves removal of riparian vegetation to maintain channel capacity, there are selected areas where vegetation is beneficial for wave wash control, erosion control, and in this case sediment deposition, velocity reduction, and the redirection of flows.
Literature Cited
Brice, James. 1977. Lateral migration of the Middle Sacramento River, California. U.S. Geological Survey, Water Resources Investigation 77–43. 51 p. Menlo Park, Calif.
Murray, Burns, and Kienlen. 1978. Report to the Reclamation Board, Sacramento, California, on retention of riparian vegetation. February, 1978.
The Role of Riparian Vegetation in Channel Bank Stability
Carmel River, California[1]
G. Mathias Kondolf and Robert R. Curry[2]
Abstract.—A narrow channel with well-vegetated banks developed on the lower 15 km. of the Carmel River by 1939, and by 1960 this condition had extended to the entire lower 24 km. of river channel. Noticeable die-off of riparian trees near water supply wells began in the 1960s and intensified during the 1976–1977 drought. Substantial bank erosion occurred during the winters of 1978 and 1980 along reaches which had suffered loss of bank-stabilizing riparian trees.
Setting
The Carmel River, Monterey County, drains a 660-sq. km. (255-sq. mi.) basin. Rising in the rugged Santa Lucia Mountains and passing through the 24-km. (15-mi.) long alluvial Carmel Valley, it ultimately discharges into the Pacific Ocean near Carmel, Monterey County (fig. 1 and 2). This alluvial reach is sub-divided by a bedrock constriction and narrowing of the valley (the "Narrows") into a lower 16-km. (10-mi.) reach (the "Lower Carmel"), and a middle 8-km. (5-mi.) reach (the "Middle Carmel"), with "Upper Carmel" indicating the segment above San Clemente Dam (fig. 3). Average annual rainfall ranges from 1,040 mm. (41 in.) in the mountainous headwaters to 430 mm. (17 in.) in the lower valley. While the upper river is perennial, the lower river is intermittent, with flows typically from December through June. Near the river mouth, average discharge is 2.7 cms (97 cfs), and the bankfull discharge (here, the 2.4-year flow) is 79.2 cms (2,800 cfs).
Figure l.
Vicinity map of the Carmel River basin
(US Army Corps of Engineers 1967).
Two water supply dams, the Los Padres and San Clemente dams (fig. 2), together impound about 3,000 acre-feet (AF). The Carmel basin supplies most of the water for the Monterey Peninsula cities of Monterey, Pacific Grove, Seaside, and Carmel. As these areas have grown, demand for water has risen substantially. To meet demand over the past two decades, California-American Water Company (Cal-Am), a private utility, has drawn increasingly upon water supply wells in the alluvium along the Lower and Middle Carmel. Of the total 13,000 AF exported from the basin in 1980, 9,000 AF was diverted from reservoirs, and 4,100 AF was extracted from streamside wells.
In the late 1960s, residents began complaining that vegetation was dying off near the wells in the region near Robinson Canyon Road (Lee 1974). The Carmel Valley Property Owners Association hired a forestry consultant to study the vegetation problem; he concluded that lowered water tables near the wells had killed the vegeta-
[1] Paper presented at the California Riparian Systems Conference. [University of California, Davis, September 17–19, 1981].
[2] G. Mathias Kondolf is in the Department of Geography and Environmental Engineering, Johns Hopkins University, Baltimore, Maryland. Robert R. Curry is a member of the Board of Environmental Studies, University of California, Santa Cruz, Calif.
Figure 2.
General map of the Carmel River basin (US Army Corps of Engineers 1967).
tion (Zinke 1971). Cal-Am hired another consultant; he acknowledged that lowered water tables near the wells affected vegetation, but stated that the effect was simply to accelerate the "natural succession" of plants (Stone 1971).
The drought of 1976–1977 imposed additional demand on streamside wells. The die-off of mesic riparian plants was significant between Schulte and Robinson Canyon roads and above the Narrows—two areas of substantial groundwater withdrawal. The high flows of 1978 and 1980 resulted in severe bank erosion, primarily in areas where bank-stabilizing vegetation had been affected.
River History
River course and pattern changes were documented by comparing maps of the Carmel River from 1858 to 1945 and aerial photos of the river from 1939 to 1980.
Changes in Course
Historical changes in the Carmel River from Garland Ranch to the mouth are plotted in figures 4 and 5. The 1858 and 1882 channels were determined from boundary surveys. The 1911 course appears on the Monterey 15' USDI Geological Survey topographic map (quad) of 1913 (based on surveys in 1911–12), and the 1945 course is taken
Figure 3.
Location map, Middle and Lower Carmel River (base from Monterey, Seaside, and Carmel Valley 7.5' quads).
from the Monterey and Seaside 7.5' quads of 1947 (based on aerial photography in 1945). The 1947 maps were photorevised in 1968, but the only mapped revision in the river's course was downstream of Garland Ranch, where a northward bend of the river was eliminated by highway construction.
Comparison of these maps reveals nine localities where lateral channel migrations of 250–500 m. (820–1,640 ft.) occurred during the 87 years between 1858 and 1945. Except for the change near Garland Ranch Park, since the survey of 1911–1912, changes in course have been modest, generally less than 0.2 km. These migrations were gradual changes from 1911 to 1945, unlike the dramatic shifts that were wrought by floods in the preceding years. This is consistent with the observation that most major shifts take place during large floods. No floods comparable to the 1911 event occurred between that year and 1945, nor have they since.
Figures 4 and 5 show changes in the channel reach from San Clemente Dam downstream to Las Garzas Creek. The 1917 channel is plotted from the Jamesburg 15' quad of 1918 (from surveys in 1917). The 1954 course is from the Carmel Valley 7.5' quad of 1956 (compiled from 1954 aerial photography). The lack of dramatic changes comparable to those seen downvalley may be attributed to: 1) the lack of record prior to the 1860 and 1911 floods; and 2) bedrock confinement along much of this reach.
Flood History
The earliest flood on record along the Carmel River was the great statewide deluge of 1862. While no records exist to document the exact magnitude of this flood, it was severe enough to induce the few valley residents to move to higher ground.[3] Most of the great changes in channel course visible between the 1858 and 1882 channels in Rancho Canada de la Segunda probably occurred during this flood.
The next great flood occurred in 1911. An account in the "Monterey Cypress" of 11 March 1911 reported that Fannie Meadows and Roy Martin lost 10 acres and a pear orchard due to lateral migration of the river. Their adjacent properties extended downstream from the present Schulte Road to Meadows Road. The channel shift that consumed their land can be seen by comparing the river course of 1858 with that of 1911 (fig. 4).
[3] Roy Meadows. Personal communication of family history.
Figure 4.
Course changes of the Carmel River, Garland Ranch to mouth.
Figure 5.
Course changes of the Carmel River channel,
San Clemente Dam to Las Garzas Creek. Key:
dashed—1917 channel from 1918 edition
Jamesburg 15' quad; solid—1954 channel,
from 1956 edition Carmel Valley 7.5' quad.
The flood of 1911 was a big flood indeed. Before it was swept away, a staff gauge at the site of the San Clemente Dam indicated a discharge of 480 cms (17,000 cfs). The peak flow has been estimated at 708 cms (25,000 cfs). In 1914 another major flood occurred, but this one was far less destructive. It is not known whether this flood was significantly smaller than the 1911 event, or if it simply caused less disruption because it flowed through a channel pre-adjusted to the large 1911 flow.
No comparable floods occurred in the following decades. The absence of large floods, together with the drop in sediment load resulting from construction of the San Clemente Dam in 1921, served to permit channel narrowing, increased sinuosity, and bed degradation.
Changes in Sinuosity and Gradient
Sinuosity, defined as the ratio of stream channel length to valley length, was computed for several sequential channels. From 1911 to 1945, the reach of river from Garland Ranch to the mouth increased in sinuosity from 1.11 to 1.18. The reach from Sleepy Hollow to Las Garzas Creek experienced an overall increase in sinuosity of 1.05 to 1.09 from 1917 to 1954. Map slopes computed for the 1911 and 1945 channels from Garland Ranch to the mouth show a decrease from 0.0034 in 1911 to 0.0029 in 1945. The overall increase in sinuosity and decrease in gradient suggest that the Carmel River stabilized in the aftermath of the 1911 flood.
Changes in Channel Pattern and Form
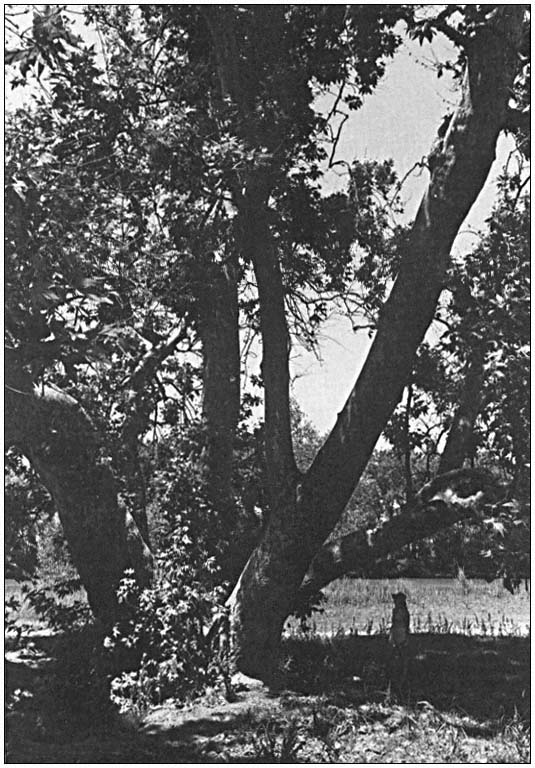
Channel pattern (pattern in plan view, e.g., meandering, braided) and form (cross sectional shape, e.g., narrow, wide) of the Lower and Middle Carmel River have changed dramatically since the last major flood and construction of the dams. No doubt, the entire Lower and Middle Carmel were strongly modified by the 1911 and 1914 floods. The resulting channel is probably well represented by the historical photos (ca. 1918) from the Slevin Collection (University of California, Berkeley). These photos of the
river, at and downstream of the Narrows (fig. 6 and 7), show a wide, sandy channel, reflecting the recent passage of a major flood.
By 1939, the Lower Carmel had developed a narrower, more sinuous channel while the Middle Carmel retained much of its braided character, as evidenced by aerial photography of 1939. Figure 7 shows the area pictured in figure 6 as it subsequently appeared in the 1930s. By this time, a riparian forest had developed along virtually all of the Lower Carmel River, narrowing the channel. Aerial photographs taken in 1965 show further development of vegetation and narrowing of the channel.
This change in channel pattern occurred concurrently with the increase in sinuosity and decrease in gradient apparent by 1945. Together, they indicate that the Lower Carmel had adjusted to the absence of major floods and the cut-off of 60% of its previous sediment load (based on drainage area upstream of San Clemente Dam). These adjustments included channel narrowing with encroaching vegetation, an increase in sinuosity, and reduction of gradient through incision.
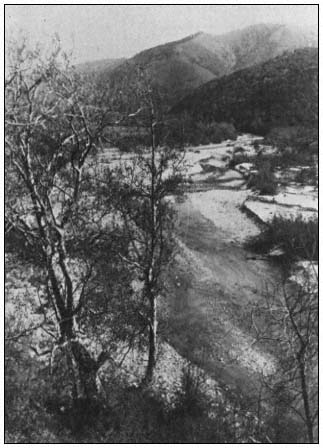
Figure 6.
Carmel River channel, 1918, viewed from right bank
upstream from location of present Robinson Canyon
Road bridge, looking upstream. (Slevin Collection,
Bancroft Library, University of California, Berkeley.)
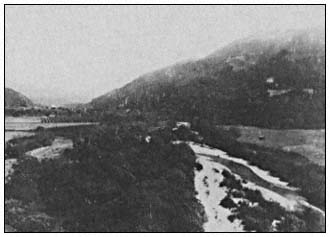
Figure 7.
Carmel River channel, 1930s, viewed from right bank
upstream from location of present Robinson Canyon
Road bridge. View upstream. Contrast this with figure 6,
essentially the same view, taken in 1918. (Pat Hathaway
Photograph Collection, Pacific Grove, California.)
Similar adjustments have been documented in other rivers in response to the absence of floods or the construction of upstream dams (Leopold etal . 1964).
By 1939, the Lower Carmel had incised about 4 m. into deposits of the 1911 flood, leaving a 4 m. terrace. Some of this incision is visible when figures 6 and 7 are compared. The flat surface of sand and gravel to the right of the river in figure 6 is the 1911 channel floor. By 1918 (when figure 6 was taken), the channel had cut down about 2 m., and willows had begun to invade the low terrace. By the 1930s (when figure 7 was taken), the channel had incised about 4 m. The 1911 channel floor appears as the terrace in figure 7, with a farmed field and small building on it. This 1911 terrace can be confidently traced along much of the Lower Carmel on the basis of morphology and historic changes in course. Figure 8 shows the 1911 terrace (Qt1) and higher terraces. There is evidence that Qt2A may be the 1862 flood terrace, but otherwise the higher terraces are of unknown age.
Above the Narrows along the Middle Carmel, similar adjustments took place, but they occurred later. The aerial photos taken in 1939 show the scars of numerous anastamosing channels in the Middle Carmel. By 1971, most of these scars no longer appeared, as exemplified by the reach from Boronda Road to Robles del Rio (fig. 9). Accompanying this change in pattern was degradation of the bed. Sequential cross sections show 1.5 m. (5 ft.) of degradation under the Boronda Road bridge from 1946 to 1980.
By the 1960s, most of the Lower and Middle Carmel had developed a narrow, sinuous, well-vegetated course. It bears repeating that these
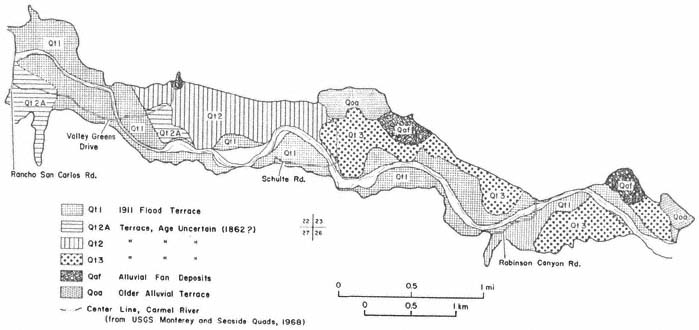
Figure 8.
1911 flood terrace and other Quaternary deposits of the Carmel River, from the Narrows to Rancho San Carlos Road.
(Based on reconnaissance-level study of aerial photographs, historic ground photographs, and historic changes in course.)
Figure 9.
Pattern changes, Middle Carmel River, from Boronda Road to Esquiline Road at Robles Del Rio.
(Data from aerial photographs of 1939 and 1971, Map Library, University of California, Santa Cruz.)
conditions developed only in the absence of major floods and, further, may have depended upon a cut-off of upstream sediment by the dams.
Additionally, before their suppression by European settlers, fires occurred regularly in the upper Carmel basin, periodically leading to vastly greater sediment yields. The accumulation of sediment in the Los Padres Reservoir after the Marble-Cone fire of 1977 was dramatic. The capacity of this reservoir decreased from 3,200 AF upon closure in 1947 to 2,600 AF in 1977, a loss of storage of 600 AF in 20 years. Consequent to the Marble-Cone fire and the high flows in the ensuing winter, the reservoir's capacity decreased to 2,040 AF by the end of 1978. Thus, in one year the reservoir lost 560 AF of storage.[4] This post-fire sedimentation rate was nearly 20 times greater than the pre-fire rate.
Prior to dam construction, all this sediment passed through to the Middle and Lower Carmel. It is probable that a wide, sandy channel would have developed in order to transport these high sediment loads. However, it is notable that the sediment contributed by the recent bank erosion has passed through the lowermost reaches of the Carmel (Valley Greens Drive downstream) without destabilizing that narrow channel. The stability of this lowermost reach may be due, in part, to the automobile bodies and riprap emplaced within the banks or to the extensive irrigating of streamside golf courses. Without these stabilizing influences, the channel might have widened in response to the higher load. Alternatively, such a narrow channel in its natural state, protected only by bank vegetation, may be able to pass these high loads without disruption of its existing geometry. In this latter case, the observed changes in channel pattern, form, gradient, and sinuosity may best be ascribed to recovery from the major floods of 1911 and 1914.
Recent Bank Erosion
Peak discharges over the winters of 1978 and 1980 were 208 cms (7,360 cfs) and 168 cms (5,920 cfs) respectively. These flows resulted in massive bank erosion along parts of the Middle and Lower Carmel. Most severely affected was the region upstream of Schulte Road Bridge. Here the channel at bankfull discharge (defined as the flow with a recurrence interval of 2.4 years on an annual maximum series) increased in width from 13 m. (43 ft.) to 35 m. (115 ft.) in two years. This increased the width: depth ratio from 15 to 113. Aerial photographs show the changing aspect of this reach from 1939 to 1980. In 1939 and 1965, a narrow channel fringed by dense riparian vegetation is visible (fig. 10a and b). The 1977 photo indicates no obvious change in the channel, but does show a marked thinning of streamside trees (fig. 10c). The 1980 photo exhibits a major widening of the channel, most of which occurred during one storm in the winter of 1980 (fig. 10d).
Throughout the Middle and Lower Carmel, the river banks are composed of unconsolidated sands and gravels, which lack cohesive strength in the absence of binding vegetation. These banks offered no resistance to lateral erosion. A comparison of surveys and aerial photographs of 1965 and 1980 from Schulte Bridge upstream 0.6 km. (0.4 mi.) indicates that 100,000 cu. m. of bank material was consumed by the river, mostly during the winter of 1980. The resulting channel is wide and floored by sand and gravel (fig. 11).
The die-off of bank vegetation and consequent lateral erosion appear to be coincident with lowering of water tables below the root zone of trees. Downstream of Valley Greens Drive, where no producing wells were located, the riparian vegetation remained largely unaffected during the drought of 1976–77. The channel there remained stable during both the 1978 and 1980 winters. A plot of water table elevations for the drought, i.e., drawdown (October 1977), and post-drought, fully recharged conditions (April 1978) shows far less drawdown in this lowermost reach of the Carmel (fig. 12). Figure 12 shows that along much of the Middle and Lower Carmel the water table was drawn down about 10 m. This is generally considerd to be below the root zone of riparian willows (Zinke 1971). The depression of the water table upstream of Schulte Road is due to the drawdown created by wells in the highly permeable alluvium of the Carmel Valley. While the drought of 1976–1977 certainly exacerbated the drawdown problem, the drought alone cannot explain the fact that severe drawdown, vegetation die-off, and subsequent bank erosion affected certain areas only.
Erosion Mitigation
Individual efforts to control bank erosion along the Carmel range widely in cost and effectiveness. Riprap has been used with mixed results. Among the materials used for riprap on the Carmel are ornamental dolomite, concrete blocks, and rubble from Cannery Row. Gabions and pervious fences with rock fill have been used successfully. Some landowners are attempting to establish willows on their eroding banks, but many of these seedlings are not adequately irrigated and die. One of the most popular revetment strategies is emplacement of automobile bodies in the eroding banks (fig. 13). The individual bank protection efforts thus far are uncoordinated and may, in some cases, have deleterious downstream effects. The government agency charged with managing the area's water resources, the Monterey Peninsula Water Management District, is now considering an integrated management plan for the Carmel River.
[4] B. Buel. 1981. Monterey Peninsula Water Management District. Personal communication.
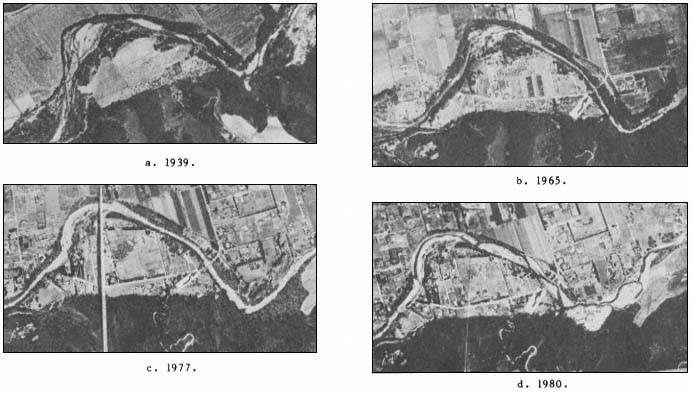
Figure 10.
Aerial photographs of the Carmel River near Schulte Road bridge. Arrows point to bridge.
(Aerial photograph collection, Monterey County Flood Control, Salinas.)
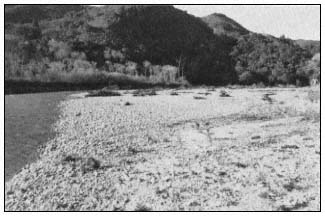
Figure 11.
Channel of the Carmel River upstream of Schulte Road bridge,
November 1980. View downstream from about 0.5 km (0.3 mi.)
upstream of bridge (photograph by the authors).
Redesigning the Carmel River
The "river-training" experience of New Zealand engineers provides a possible model for restoring unstable reaches of the Carmel (Nevins 1967). Their procedure is to determine "design geometries" from stable reaches of a river and to reengineer unstable reaches to these design geometries. Cross-sectional geometry, sinuosity, and gradient of the stable reaches are duplicated as closely as possible in the unstable reaches. Initially, bank protection works are used to stabilize the banks and willows are planted; once fully established, the willows are expected to become the principal bank-stabilizing agent. The reengineered channels in New Zealand have remained stable in all but very high flows. If large discharges disrupt the design channels, these reaches can be reengineered to design specifications at a lower cost than the initial work (ibid .).
For the Carmel River, the stable reaches downstream of the disturbed reaches can serve as design geometries. In figure 14, cross sections are plotted for an eroded reach upstream of
Figure 12.
Water table elevations, drought and recharged conditions.
(Date from Monterey County Flood Control well level records.)
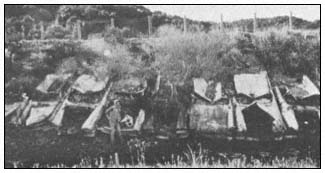
Figure 13.
Automobile bodies used as bank revetment, downstream
of Meadows Road (photograph by the authors).
Schulte Road (section 37) and for a stable reach about 1.5 km. (1 mi.) downstream (section 45). No tributaries enter between these sections, so discharge remains essentially constant. Yet the present-day geometries are vastly different. Surveys by the US Army Corps of Engineers in 1965 (US Army Corps of Engineers 1967) indicate that the reach encompassing section 37 was characterized by a geometry closely resembling that of the present-day section 45. Thus, a design-stable geometry for section 37 could be drawn largely from the existing geometry at section 45. Certain corrections would have to be made for difference in gradient, sinuosity, and bed material size between these reaches. Fortunately, many of these parameters are well documented for the stable, pre-disturbance Carmel River.
The success of a river-training program depends, in part, on a favorable flow regime in the years following channel redesign. A major flood (e.g., a 20- to 30-year event) in the first few years following the redesign may take out the new banks before they have been stabilized by vegetation. A catastrophic flood (e.g., a 75- to 100-year event) will probably carve a new channel for itself regardless of how well vegetated the existing banks might be (Nevins 1967). Applying these concepts to the Carmel, we might expect that a flow comparable to the 1980 event within the first five-to-ten years following channel redesign could take out the design banks. A flow comparable to the 1911 flow could take out the design banks whether vegetated or not.
Summary
The lower 24-km. (15-mi.) reach of the Carmel River is alluviated and is divided by a bedrock constriction into a lower 16-km. (10-mi.) reach and a middle 8-km. (5-mi.) reach. This alluvial reach of the river has experienced major changes in channel course, pattern, and form over the past 130 years. Major floods in 1862 and 1911 changed the river's course by up to 500 m. (1,640 ft.). After 1914, the absence of severe floods, coupled with dam construction upstream, led to a change from a wide, braided channel to a narrow, more sinuous channel. Accompanying this change was a decrease in overall gradient in the lower reach from .0034 to .0029 between 1911 and 1945.
By 1939, the date of the first coverage by aerial photography, the lower reach had developed a narrow, sinuous channel with well-vegetated banks that remained stable for most of the next four decades. The middle reach of the river, however, displayed a predominantly wide, braided
Figure 14.
Channel cross sections of the Carmel River near Schulte Road bridge. Section
37: 250 m. (820 ft.) upstream of bridge; section 45: 1,520 m. (5,000 ft.) downstream
of bridge. Discharge is essentially constant. (From field surveys by the authors).
pattern. Between 1939 and 1971, this middle reach developed a single thread channel and downcut up to 1.5 m. (5 ft).
As groundwater withdrawal from streamside wells increased in the 1960s, residents began complaining that riparian trees were dying near the wells. During the 1976–1977 drought, lowered water tables were associated with substantial die-off of riparian trees. The death of these bank-stabilizing trees is associated with significant lateral erosion that occurred during the winters of 1978 and 1980. Upstream of the Schulte Road bridge, the river's bankfull channel increased in width from 13 m. to 35 m., increasing the width:depth ratio from 15 to 113. Downstream, the channel remained stable despite passage of the sediment derived from the eroding reaches.
Individual efforts to control bank erosion have included planting of willows and emplacement in banks of automobile bodies and riprap. The mixed success of these efforts demonstrates that a coordinated program is needed to manage the river. Most promising as a model for the Carmel is the experience of New Zealand engineers in "river training." Their procedure is to determine design geometries from stable reaches and then redesign disturbed reaches to the design geometry. After initial stabilization using engineering works, planted willows are expected to serve as the primary stabilizing agents.
Acknowledgments
This study was supported by a contract with the Monterey Peninsula Water Management District. Our thanks to the District staff for generous assistance in every phase of the study. We are also grateful for the invaluable cooperation of Monterey County Flood Control, the California Department of Fish and Game, Monterey Office, and the US Army Corps of Engineers, San Francisco District. To the friends who helped with the field work, our thanks.
Literature Cited
Lee, E.B. 1974. A summary report of facts, analysis, and conclusions relating to the Monterey Peninsula water supply problems. Public Utilities Commission Case 9530. 23 p. Unpublished report.
Leopold, L.B., W.G. Wolman, and J.P. Miller. 1964. Fluvial processes in geomorphology. 522 p. W. Freeman and Company, San Francisco, Calif.
Nevins, T.H. 1967. River training—the single-thread channel. New Zealand Engineering 24 (Dec. 15, 1967):367–373.
Stone, E. 1971. The dynamics of vegetation change along the Carmel River. Unpublished report to the California-American Water Company, March, 1971. 54 p.
US Army Corps of Engineers. 1967. Flood plain information on Carmel River, Monterey County, California. 36 p. US Army Corps of Engineers, San Francisco District, San Francisco, Calif.
Zinke, P. 1971. The effect of water well drawdown on riparian and phreatophyte vegetation in the Middle Carmel Valley. Unpublished report to the Carmel Valley Property Owners Association, Carmel Valley, Calif. February, 1971. 27 p.
Sequential Changes in Bed Habitat Conditions in the Upper Carmel River Following the Marble-Cone Fire of August, 1977[1]
Barry Hecht[2]
Abstract.—Runoff following a major fire filled the upper Carmel River, Monterey County, California, with sediment. Repeated measurements of four habitat descriptors were made in riffles during three years following the fire. Habitat values were largely restored by the end of the first winter, with virtually complete recovery after three years.
Introduction
The importance of episodic or unusual events in the management of riparian systems in montane areas is increasingly being recognized. Wildfires are one of the major recurring disturbances affecting biologic and geomorphic processes in these watersheds. This is especially true in basins with significant areas of steep, chaparral-covered slopes.
Many resource managers consider the canyon bottoms—the channels, riparian zones, and valley flats—the most biologically significant zones in these watersheds. The bottomlands commonly remain unburned during fires which otherwise affect much of the drainage area. The primary physical changes in these corridors are frequently those associated with erosion, deposition, and channel instabilities induced by post-fire storm runoff. While numerous studies of fire-related increases in runoff and debris load have been made, relatively little is known of their effects on habitat values.
This report is a preliminary summary of an ongoing study addressing one aspect of the larger management problem—the indirect effects of fires on bed conditions affecting aquatic habitat values. The upper Carmel watershed in Los Padres National Forest, Monterey County, California was chosen for this study for three reasons. First, the drainage is used primarily for recreational, habitat, and watershed purposes; the alluvial corridor is central to all three uses. Second, direct human disruption of soil and vegetation in the basin is minimal, limited primarily to ridgetops far removed from the channels. Third, the watershed is in the size range of smaller basins capable of sustaining an anadromous fishery commonly considered to be from about 10–100 km2 (4–40 mi2 ).
There were two significant limitations on this study imposed by the choice of the upper Carmel watershed. First, there are no stream gauges in the basin. Synthesis of a flow-record for each site will be required to establish the relationship of the observed sequential changes to runoff. Data needed to develop the synthetic flow-record are presently not fully available. Secondly, access to the sites required a hike of about 8 km. (5 mi.) over damaged trails with backpacks and survey gear, limiting both the equipment which could be used and the number of sites which could be monitored during a given weekend.
Regional Setting
The Carmel River drains the northern slopes of the Santa Lucia Mountains (fig. 1). The upper portion of the basin is a rugged area of approximately 161 km2 (62 mi2 ) above Los Padres Dam, a municipal water-supply source for the Monterey Peninsula urban area about 50 km. (30 mi.) to the north.
The watershed is underlain by faulted crystalline rocks, primarily schists, gneisses, and metasomatic granitic rocks ranging in composition from granodiorite to gabbro (Wiebe 1970). Weathering of these rocks produces a large amount of medium-grained sand and a disproportionately small percentage of fine gravel. The courses of the main channels are structurally-controlled, primarily by faults and fractures. The channels are unusually steep for watersheds of comparable size in the region.
[1] Paper presented at the California Riparian Systems Conference. [University of California, Davis, September 17–19, 1981].
[2] Barry Hecht is Senior Hydrologist, HEA, a Division of J.H. Kleinfelder and Associates, Berkeley, California.
Figure 1.
Upper Carmel watershed and vicinity. Monitoring sites on the Carmel River are at Bluff Camp (1), Carmel
Camp (2), below Bruce Fork (3), at Sulphur Springs Camp (4), and on Miller Fork above its mouth (5).
Rainfall ranges from an average of 610 mm. (24 in.) per year at Los Padres Dam to an estimated 1150–1270 mm. (45–50 in.) at the drainage divide with the Big Sur watershed. This supports a vegetative mosaic with chamise/chaparral on steeper exposed slopes, oak/madrone woodland community on more protected slopes and terraces, and mixed hardwood/coniferous forest at the highest elevations.
The Marble-Cone Fire
The Marble-Cone Fire burned approximately 72,000 ha. (178,000 ac.) in the Santa Lucia Mountains during August, 1977 (fig. 1). Virtually all of the Carmel watershed above Los Padres Reservoir was affected by the fire. The USDA Forest Service staff estimated remaining canopy cover to be less than 10% in 42% of the upper Carmel basin; 11–50% over an additional 20% of the watershed; and more than 51% over the remaining 38% of the area.[3] No extensive fires had occurred in the watershed during the previous 50 years. Much of the basin had remained unburned for 76 years or more (Griffin 1978).
Two unusual occurrences contributed to the severity of the burn, and particularly to its impact on the canyon floor areas. Fuel levels were abnormally high due to an extreme amount of limb breakage sustained during a wet and sticky snowfall on January 3, 1974. The effect on fuel loadings was especially large in the riparian zone and on the terraces and lower slopes, areas seldom affected by snowfall. Secondly, conditions were also unusually dry following the severe drought of 1976 and 1977. Rainfall at Big Sur, the nearest long-term station, during each of these years was less than that measured for any of the previous 58 years.
Post-Fire Runoff
Rainfall during the 1977–78 and 1979–80 winter seasons was 40–50% above normal at many stations in the region; rainfall during 1978–79 was generally slightly below average. Runoff in the Carmel and nearby watersheds was markedly above normal during this 3-year period, reflecting both the above-average rainfall and the altered runoff characteristics (table 1). The duration of high flows was also much above normal. One measure of this duration is the number of days that flow exceeded bankfull conditions. In the Monterey Bay area (as in many other regions), this corresponds roughly to the flood with a recurrence of 1.5 years. The Big Sur River is the nearest gauged stream, and is consi-
[3] USDA Forest Service. Undated. MarbleCone fire: remaining vegetative cover. Unpublished staff report. Los Padres National Forest.
sidered most representative of the upper Carmel River. The 1.5-year flood discharge on the Big Sur River is approximately 1,600 cubic feet per second (cfs). Based on preliminary records, this discharge was exceeded for a total of about 10 days in 1978 and about 6 days in 1980, compared with an annual average of 1.1 days for the period prior to the fire.
| ||||||||||||||||||||||||||||||||||||||||||||||||||||||||||||||||||||||||||||||||||||||||||
More specific data are available on the effect of the fire on sediment yields of the upper Carmel watershed (table 2). Deposition in Los Padres Reservoir during the three years following the fire was about equal to that during the previous 30 years. In addition, a large but undetermined amount of debris has accumulated in the channels of the Carmel R ver and Danish Creek above the spillway elevation.[4]
| ||||||||||||||||||||||||||||
Sequential Changes in Bed Habitat Conditions
Habitat in the streams of the upper Carmel system is generally evaluated by its suitability for salmonid production. The local resource includes both steelhead and resident trout. Availabilities of suitable spawning and rearing habitats are considered factors limiting both populations, a common situation in streams of central California.
In riffles of boulder-bedded streams such as the upper Carmel River, both spawning and rearing occur in spaces or openings between the larger bed-forming rocks. Spawning occurs in bars and accumulations of gravels which form between the boulders or in their lees, locations partially protected from scour.
The epicycle of massive fill and scour following fires in this environment temporarily buries most of the limited habitat with finer material, largely sand. For this reconnaissance study, descriptors chosen to define the extent of burial and subsequent uncovering of habitat include:
1. net fill and scour, as measured by level-surveys following each major group of storms;
2. particle-size distribution of the bed surface, measured by censusing particles at the intersections of a grid;
3. percentage of bed area occupied by sand and finer material, also sampled on a grid; and
4. percent of the bed covered by material of sizes suitable for spawning, determined as above.
Net Fill and Scour
Minimal spawning or rearing habitat was available in the upper Carmel channels during the period of maximum fill. Habitat availability increased as the stored sediment was gradually scoured. A useful measure of these sequential changes is net mean fill or scour, determined from the change in mean bed elevation of the channel during each storm period. This change was quantified using repeated level-surveys of monumented cross-sections.
The sequence of fill and scour was recorded at six cross-sections in three riffles. The riffles were chosen shortly after the fire on the basis of observable habitat values for both spawning and rearing, their general alluvial character, absence of major unusual hydraulic properties, and presence in a long and straight reach. The last three criteria were necessary to meet the hydraulic requirement of the indirect discharge measurements used to determine the peak flows during each storm period. The sections were established in early November, 1977, fol-
[4] Bloyd, R.M. 1981. Letter of March 18 to Robert F. Blecker, hydrologist for Los Padres National Forest, which summarizes USDI Geological Survey studies of post-fire sedimentation in Los Padres Reservoir.
lowing the fire but prior to any measurable runoff. Cross-sections were resurveyed after each significant flood event during the winter of 1977–78, and again following the wet season of 1979–80. An example of data collected at one section describing the sequential changes in elevation and configuration of the bed is presented in figure 2.
The fill and scour cycle observed at each riffle is summarized in table 3. Fill occurred immediately after the first storms in December, 1977, and continued at some sections through the major storm period in January, 1978. By the end of the first winter, the bed was being scoured at all six sections, a process which continued through the second and third rainy seasons. The final column in table 3 traces the proportion of maximum net fill removed during each period.[5] By the end of the first season, 57–102% of the maximum observed net fill had been scoured. "Recovery percentages" of 80–151% were recorded by the end of the third year. At four of the six sections, 80–90% of the maximum observed fill had been removed by the end of the third year. Mean scour exceeding the mean maximum fill was limited to the riffle at Carmel Camp, where about half of the mean scour is attributable to lateral erosion of the lower bank area on one side of the channel.
Figure 2.
Bed configuration and high-water marks during the fill and scour
cycle following the Marble-Cone fire, looking downstream.
Some high-water profiles slope toward the right bank, discussed below in the text.
[5] Maximum fills may have been greater during one of the storm periods. Ephemeral bed conditions during storm crests may not have great importance in defining spawning or rearing habitat value; thus the methodology is appropriate for the purposes of this study. The reader is cautioned that recovery percentages in table 3 may underestimate the removal of within-storm fill maxima.
| ||||||||||||||||||||||||||||||||||||||||||||||||||||||||||||||||||||||||||||||||||||||||||||||||||||||||||||||||||||||||||||||||||||||||||||||||||||||||||||||||||||||||||||||||||||
Size Distribution of Bed Material
The particle-size distribution of bed material is commonly quantified in the course of habitat assessments, either by a visual estimate or by a grid-by-number census. The latter approach was used in this study.
Particle-size distributions of bed-surface material were determined by measurement made at the same five riffles in the early fall months of each year, prior to the onset of rains. This is the season in which rearing habitat is most likely to be constrained by sediment. An area-stratified random sample of the entire riffle bed was drawn by stretching cloth measuring tapes between rows of eight to ten iron pins at the top and base of each riffle. Lengths of intermediate axes of particles immediately beneath preselected points on the tapes were measured and grouped in standard size-classes. This procedure is an adaption for use in boulder-bed channels of Wolman's (1954) now-standard methodology. A sample of 50 to 100 rocks is generally considered sufficient to describe bed-surface populations; larger samples were drawn following the 1978 storms as a wider range of size-classes were observed.
Sequential changes in the size distribution of bed material are shown in table 4. Sizes at the key descriptive percentiles generally decreased following the fire, then subsequently have increased. Relative changes were more pronounced at the 16th and 50th percentiles than in the larger materials, as might be expected.
Much, and probably most, of the change in particle-size distribution occurred during the first year following the fire. It was not feasible to recensus the bed between storms due to the unusually high flows of the winter of 1978. In most cases, the minimum sizes probably were associated with the December, 1977, or January, 1978 storm periods. Had no more storms occurred during the winter of 1978, a much greater effect on habitat conditions would have been observed during the summer and fall of 1978.
Sand-Covered Bed Areas
Aquatic biologists have often identified percent bed area covered by sand (or finer material) as a significant influence on the distribution of species in the channel, and as a factor affecting salmonid egg viability. The distribution of sand and finer material on the bed of mountain stream riffles appears to be controlled by different geomorphic processes than those governing the coarser sizes. In this study, sand is considered as a separate population, one whose variability is also best described by the percentage of the riffle bed which it covers. In this study, the sand-and-finer percentage of the bed surface was determined in the course of the particle-size measurements. Intermediate axial lengths of particles smaller than 4 mm. could not be readily measured under field conditions; these were grouped in a single class informally labelled "fines."[6]
[6] Most standard classifications divide sands and gravels at 2 mm. In the upper Carmel environment, which is deficient in very fine gravels, any interpretive difficulty introduced by including 2–4 mm. material with the sands is minor.
|
Sequential changes in the sand-covered portion of the bed are shown in figure 3. The abundance of fines increased markedly with the first storms after the fire. At the Bluff Camp riffle, the percentage of bed area covered by sand or finer debris on December 25, 1977, was visually estimated to be 40% in the riffle and 95% in the pool beneath it. By the end of the first year, the fines abundance at the five sites averaged only very slightly greater than at the time of the fire. As with the particle-size changes, the sequential variations in fines abundance were greatly accelerated by the unusually high runoff conditions of the 1978 water year.
Availability of Spawning-sized Material
Salmonid spawning habitat in the upper Carmel watershed may be limited by the availability of material of suitable sizes in riffles. The relative abundance of this material can be quantified for the Carmel channels as the percentage of the bed surface occupied by rocks within the range of suitable sizes, as no appreciable armoring of the bed was observed. For this study, it is assumed that the range of 4 mm. to 90 mm. defines the bulk of material found in and above freshly-constructed redds in streams of comparable size, slope, and underlying rock types (e.g., Orcutt etal . 1968, Platts etal . 1979).[7]
The availability of spawning-size material increased markedly at four of the five riffles in the first year after the fire. The percentage of the bed occupied by this size-range has remained slightly elevated, although depletion has probably occurred since 1978, particularly in the smaller sizes. To an appreciable degree, the increase has been manifested as expanded bars in
[7] Percentages of bed area occupied by material of other ranges may be computed from table 4 by those who would prefer to consider different sizes.
Figure 3.
Sequential changes in bed area occupied by spawning-sized
material and sand-and-finer debris following the Marble-Cone
fire. Runoff events substantially exceeding bankfull discharge
are considered major storms. Sites are numbered as on figure 1
and table 4.
the lees of larger boulders, a location preferentially used for spawning in boulder-bedded channels. The role of fires in the supply of gravels in high-gradient streams merits study.
Supplemental Observations
Other processes related to post-fire sedimentation also affected the channels and riparian corridors. These were observed in a more general way.
1. The fill and scour cycle in pools and glides (or "runs") was greater in absolute magnitude than in riffles. Several traditional swimming holes were completely filled during the December and January storms following the fire. The relative rates of recovery in pools and glides seemed to be similar to or slightly slower than those in the riffles of this boulder-bedded channel.
This study was limited to describing sequential changes in riffles, where indirect discharge estimates and bed-material census are customarily made. Equally important in this decision was the historical emphasis placed on riffles by aquatic biologists. Subsequent research has clarified and quantified the importance of rearing habitat within pools and glides in salmonid production (e.g., Bjornn etal . 1977; Kelley and Dettman 1979). Future studies of post-fire changes in habitat should include pools and glides.
2. Few secondary slope instabilities were induced by the fire. Landslide-related sediment delivery to the main channels was probably of negligible magnitude; this presumably contributed to the rapid rate of sediment depletion in the channels. The relative stability of the slopes is considered to be primarily a function of bed-rock type.
3. Interception of sediment on the lowermost terrace was widespread, particularly at the mouths of ravines, chutes, and small tributaries. Much of this material is of gravel or pebble size. Relative to the volume of coarse material deposited in and above Los Padres Reservoir since the fire, the volume of debris intercepted on the terrace was small, perhaps 1–3%. This is a smaller amount, but somewhat similar to the fire-related sediment still stored in the main channels at least above the tailwater areas of Los Padres Reservoir. Delayed delivery of coarse material stored in these debris cones may be a factor in maintaining the supply of spawning-sized material during extended periods between major fires and floods.
4. Floods following the fire removed much of the organic matter which had accumulated in the channel. Most fallen trunks and limbs on or spanning the streambed were dislodged, then either washed through to Los Padres Reservoir or wedged between the trunks of larger riparian trees distributed along the banks. These small debris jams generated significant eddies during flood periods. As an example, the high-water marks of the December, 1977, February, 1978, and February, 1980 floods indicate that the water-surface profile sloped toward the right bank, the result of a small debris jam 12 m. (40 ft.) upstream. Nearly continuous lines of broken twigs and other fine organic matter accumulated in these eddies during each storm. Each line contained an appreciable amount of material, generally 0.5 to 5 cm. thick. Partial incorporation of this material into the soil was clearly visible by November, 1980. Post-fire additions of organic material to soils at or slightly above the active floodplain may be an appreciable factor in the development of soils in the riparian zone.
Conclusions
1. Sequential changes in riffle conditions in the upper Carmel watershed following the Marble-Cone fire were observed using four physical descriptors of salmonid habitat:
a. mean fill and scour;
b. particle-size distribution of the bed surface;
c. percent of the bed surface covered by sand and finer debris;
d. percent of the bed surface occupied by material of sizes suitable for spawning.
2. Riffles in the master channels of the upper Carmel watershed filled up to 0.3 m. (1 ft.) during the first storms following the Marble-Cone fire, primarily with sand. By the end of the first year, most of the fill had been scoured; much of what remained was of pebble and cobble size. By the end of the third year, all descriptors had returned to within 20% (relative to the maximum measured disruption) of their pre-fire conditions. Other on-going watershed processes were probably more important than residual effects of the fire as influences on habitat conditions by the end of the third year.
3. Effects of the fire on runs and pools were not measured. Maximum mean channel fill was generally observed to be several times greater than in riffles. Recovery of habitat values appears to occur at relative rates similar to or slightly slower than those in the riffles.
4. A substantial volume of sediment, primarily gravels and cobbles, was intercepted in the riparian and terrace areas. Delayed delivery to main channels is likely to be an important factor in maintaining the availability of spawning-sized material between major disruptive events.
Acknowledgments
This study was conducted in cooperation with the USDA Forest Service, Pacific Southwest Forest and Range Experiment Station, as part of the Chaparral Management Research and Development Program. Suggestions and assistance were contributed by Wade G. Wells and C. Eugene Conrad of the station; Robert F. Blecker (Los Padres National Forest); Gene H. Taylor (Monterey County Flood Control and Water Conservation District); and Vincent Piro and Randal Benthin (California Department of Fish and Game). Special thanks are extended to friends and colleagues who assisted in the field work, often under wet and cold conditions: Robert Herman, David F. Hoexter, Mark Jansen, G. Matt Kondolf, Yane Nordhav, Mark Springer, and Philip B. Williams. Wade Wells, David Hoexter and Nicholas M. Johnson reviewed the report in draft form.
Literature Cited
Bjornn, T.C., M.A. Brusven, M.P. Molnau, J.H. Milligan, R.A. Klamt, E. Chacho, and C. Schaye. 1977. Transport of granitic sediment in streams and its effects on insects and fish. University of Idaho Forest, Wildlife, and Range Experiment Station Bull. No. 17. 43 p.
Griffin, J.R. 1978. The Marble-Cone fire ten months later. Fremontia 6(2):8–14.
Kelley, D.W., and D.H. Dettman. 1980. Relationships between streamflow, rearing habitat, substrate conditions, and juvenile steelhead populations in Lagunitas Creek, Marin County. Report to the Marin Municipal Water District. 36 p. D.W. Kelley and Associates, Newcastle, California.
Orcutt, D.R., T.R. Pulliam, and A. Arp. 1968. Characteristics of steelhead trout redds in Idaho streams. Trans. Amer. Fish Soc. 97(1):42–45.
Platts, W.S., M.A. Shirazi, and D.H. Lewis. 1979. Sediment particle sizes used for spawning, with methods for evaluation. US Environmental Protection Agency Pub. 3-79-043. Cincinnati, Ohio. 32 p.
Wiebe, R.A. 1970. Relations of granitic and gabbroic rocks, northern Santa Lucia Range, California. Geol. Soc. Am. Bull. 81(1):105–116.
Wolman, M.G. 1954. A method of sampling coarse river-bed material. Trans. Am. Geophys. Union 35(6):951–956.
Flood Control and Riparian System Destruction
Lower San Lorenzo River, Santa Cruz County, California[1]
Gary B. Griggs[2]
Abstract.—A 1959 flood control project on the lower San Lorenzo River in Santa Cruz County, California, involved levee construction and excavation below the river's natural grade. Subsequent siltation has greatly reduced the channel's capability to contain flood waters. Annual dredging has destroyed the riparian corridor and has not significantly increased flood protection.
Introduction
The San Lorenzo River drains 357 km2 of the central California Coast Ranges (fig. 1). Annual rainfall in the redwood-forested basin averages 150 cm., and flooding has been common within the communities which occupy the river's floodplain. Steep slopes, landslides, and unstable soils combined with high-intensity precipitation have led to severe erosion in certain parts of the basin. Logging, quarrying, and the grading and vegetation removal that accompany urban and rural developments have compounded the erosion and sediment-production problem.
Excluding the population of the city of Santa Cruz at the river's mouth, the watershed is home to 33,000 people. Most of the population is concentrated along the stream bottoms of the river and its tributaries.
As a result of disastrous flooding within the city of Santa Cruz during December 1955, the US Army Corps of Engineers (CE) proposed a flood-control project along the lower San Lorenzo River. The project consisted of levee construction and channel dredging for 4 km. upstream from the river mouth. Changes in channel equilibrium have produced heavy siltation which has greatly reduced the project's flood control capacity. For the past four years the city has annually removed all river-bottom vegetation and bulldozed the accumulated sediment into windrows in the hope that the river would scour out its bed. Scouring has not taken place, but loss of riparian system has occurred.
Figure l.
Index map showing the San Lorenzo River
watershed and its location in California.
[1] Paper presented at the California Riparian Systems Conference. [University of California, Davis, September 17–19, 1981].
[2] Gary B. Griggs is Professor of Earth Sciences, University of California, Santa Cruz.
Flooding
Flooding is the most widespread geologic hazard in the United States, accounting for greater annual property loss than any other single hazard. Despite the construction of ever-increasing numbers of dams, channels, and levees for "flood control" purposes, losses from flooding have continued to increase primarily due to expanded use, re-occupation, and development of downstream floodplains.
There is little doubt that river control works accelerate floodplain development. Once a sense of security from flooding has been established, the conversion of open space to densely populated areas has become commonplace. Although flood control projects do offer protection from all events smaller than the design flood, if properly designed, they will not be effective against the infrequent larger events. In other words, all flood control ends somewhere; we simply cannot afford to provide protection from the 500- or 1,000-year flood. Thus, as "protected" floodplain areas are more intensively developed, the potential damage from a great or catastrophic flood, which cannot be contained, continues to rise.
Developments located in the floodplain are not only more susceptible to damage, but also reduce the capacity of the floodplain to transport and store floodwaters, and may actually increase the depth and areal extent of inundation. Virtually the entire downtown portion of Santa Cruz lies within the 100-year floodplain of the San Lorenzo River, as do certain residential areas along the river's upper reaches.
Logging and land clearing activity can contribute to flooding problems. Logjams can form as logs and other debris are swept downstream during high flows. Considerable damage during past floods in the densely wooded and heavily logged San Lorenzo basin was apparently caused by logjams occurring at bridges, followed by river back-up and over-bank flooding.
Continued heavy rainfall during December, 1955, led to severe flooding throughout the San Lorenzo basin. Fifty centimeters of rain fell between 15 and 28 December at Boulder Creek, with almost half of that (23 cm.) falling on 22 December. The gauging station at Big Trees in Felton recorded a 6.88-m. stage with a discharge of 861 cu. m. per second (30,400 cfs). Overflow occurred from the headwaters to the mouth, resulting in the maximum flood on record. Numerous logjams and other channel obstructions diverted the floodflows, causing streams to change from their normal alignments and undercut and scour out numerous bridges, road fills, and private developments (US Army Corps of Engineers 1973). Seven persons lost their lives, 2,830 people were displaced from homes, and damages amounted to $8.7 million; most of this was within the city of Santa Cruz itself.
Flood Control
Almost two years before the 1955 flood, in the spring of 1954, the CE applied to Congress for $2.265 million for the construction of a flood control project on the lower 4 km. of the San Lorenzo River and lower Branciforte Creek in the city of Santa Cruz (fig. 2). Preliminary designs had already been completed using discharge from a 1940 flood.
The December 1955 flood apparently interrupted work and necessitated a re-evaluation of the "standard project flood" (the 150-year event), but it also provided the CE with even stronger justification for proceeding with the project. Construction began in 1957, after the following revisions in the discharge capacities of the project: a 25% increase for the San Lorenzo, and a 110% increase for Branciforte Creek, to 1,303 cu. m. per second (46,000 cfs) and 238 cu. m. per second (8,400 cfs) respectively (US Army Corps of Engineers 1957).
The CE project consisted of the construction of levees for 4 km. upstream from the mouth, and the excavation of about 590,000 cu. m. of sediments from the existing channel, to increase the slope and capacity of the new channelized reach. The "design" channel bottom was lowered as much as 2.1 m. below the natural or original river-bottom (fig. 3). In conjunction with the excavation, the CE design utilized flow velocities of 2.4–7.5 m. per second (7.9–24.7 ft. per second) to move the necessary water volumes through the various design cross sections.
In July of 1959 the project was completed and was deeded to the City of Santa Cruz by the CE. The city agreed to maintain the channel to design specifications and was provided with a maintenance plan and procedure. Annual maintenance costs were estimated by the CE at $25,000. Total project cost at the time of completion was $6,466,000. The CE departed at this point, absolved of all further responsibility. Considering the awesome reputation of the CE and the docile mentality of the times, it is not surprising that no one questioned the wisdom of dredging the channel and altering the gradient, the velocities used in the design, or the size of the channel. Because the CE presumably had the most experience in the field, it was assumed that the project as planned was the best long-term solution.
Flood protection assured, Santa Cruz intensively redeveloped the "former" floodplain of the
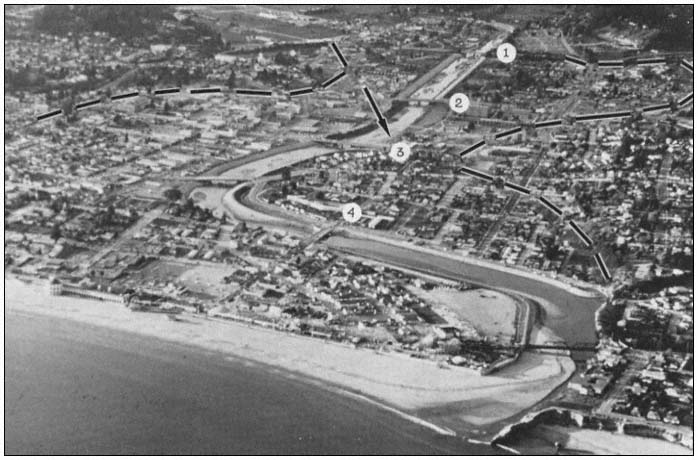
Figure 2.
The city of Santa Cruz and the San Lorenzo River Flood Control Project in 1971. Dashed line delineates
the floodplain. Numbers refer to individual bridges—1) Highway 1, 2) Water Street, 3) Soquel Avenue,
4) Riverside Avenue. Arrow indicates point where Branciforte Creek enters San Lorenzo River.
now-tamed San Lorenzo River over the next 10 years. A shopping mall became the showpiece of a downtown renovation project. The early 1970s, however, brought some threatening revelations about the safety of downtown Santa Cruz and the condition of the channel. A 1975 channel centerline survey showed that at least 306,000 cu. m. of sediment had accumulated, significantly reducing the project's capacity. Annual dredging to project depth was not performed by the city, as public works officials felt that high winter flows would scour the accumulated sediments out to sea.
In an effort to aid this process, the city began to utilize a bulldozer with ripper blades to uproot all river-bottom vegetation along the entire 4-km. length of the flood control project, believing that the roots held sediment in place, thereby preventing scour. Scour, however, still did not occur. Subsequent surveys have shown only minor variation in the amount of channel fill, which now stands at about 350,000 cu. m. (figs. 3 and 4).
The California Department of Water Resources (DWR) discovered the situation in 1976. DWR threatened to assume responsibility for clearing the channel and charge the City of Santa Cruz for the dredging later. Responding to these official warnings, the city began to bulldoze sediment up into windrows within the last four years, again, hoping for winter scour to remove the sand (fig. 5). The city also started to remove sediment on a small scale; as of June 1981 less than 40,000 cu. m. had been removed. This has led to nearly total destruction of the riparian vegetation on an annual basis, as well as an unsightly downtown river channel. However, the city is unable to
Figure 3.
Changing gradient of the San Lorenzo River as it passes through Santa Cruz. Note the contrast between
original or design river bottom after dredging and surveys taken in the late 1970s. Baseline survey refers
to channel condition prior to commencement of flood control project in 1959. Station numbers refer to
distance upstream from the river mouth in hundreds of feet (Station 20 = 2,000 feet).
finance the total removal of the accumulated sediments, with the cost estimated to be as much as $3 million initially and at least $200,000 annually to maintain. These are considerably different figures (even allowing for inflation) than the CE estimated in 1959 ($25,000/year). As a result, the city is concerned both about the cost of removing sediment and the potential flood hazard of leaving the sediment in the channel.
With no scouring during a large storm, it has been determined that some individual cross sections could only contain the 25- to 30-year flood. This is of immediate concern because the city is now hydrologically, as well as legally, back within the 100-year floodplain, as it was prior to the construction of the "flood control" project. No federal monies should thus be available for projects in the area; flood insurance coverage is also in question. Santa Cruz is stuck with a poorly designed project, a difficult dilemma, and a financial and ecological disaster. Why has this happened? Are there any solutions? And can we learn something from this expensive mistake?
The Effect of Altering the Natural Channel Gradient
Stream equilibrium is a dynamic process that is continually reacting to changing hydraulic conditions and basin sediment production. Water velocity, channel slope, and sediment transport capacity are adjusted in response to variations in discharge, channel morphology, and sediment availability.
In removing 590,000 cu. m. of sediment during construction of the flood control project,
Figure 4.
Selected channel cross sections along San
Lorenzo River in Santa Cruz showing extent
of channel fill above original design channel
bottom. Station locations refer to Figure 3. All
elevations are in feet relative to mean sea level.
the CE increased the channel slope 32% over its last 4 km. and upset the equilibrium conditions established over thousands of years. Sea level is the ultimate base level for the San Lorenzo and most other rivers; however, due to channel excavation, high tides could extend 4 km. inland to the Highway 1 bridge. During a spring tide of 2 m. (mean sea level), 1.7 m. of standing water would occur at the bridge.
The anticipated hydrologic response of flowing water upon entering a standing body of seawater would be a reduction in velocity with accompanying deposition of sediment load. The "improved" channel was actually a sink that would eventually be filled in with sediment from the watershed, much like a dam or reservoir traps sediment. This process would continue until the channel returned to an equilibrium slope. Periodic surveys of the channel centerline and various cross sections indicated that equilibrium was gradually reestablishing, and it has now been reached.
However, the new equilibrium channel has a different profile than either the original or the design channel in the reach between Soquel and Highway 1 bridges (see fig. 3). The increased channel width and an increase in river sediment load have created a new equilibrium gradient in this reach. The channel bottom is now 2 m. above the initial design bottom and 0.9–1.2 m. above the original natural channel.
The estimated quantity of sediment that must now be removed in order to restore the design channel is about 350,000 cu. m. The CE made no mention of deposition problems in their design manual except to note frequent dredging would be required to maintain the channel grade. Effects of the sediment removal on the river's aquatic system and riparian vegetation were also not discussed. The basis for the CE estimate of annual dredging cost is unknown, but no sediment discharge measurements from the watershed had been made at the time the project was initiated.
Sediment Yield and Transport
Sediment yield within the San Lorenzo watershed is high and volumes of material transported by major runoff events can be very large. The natural basin conditions (steep and unstable slopes, highly erodible soils, and high intensity precipitation) combined with the vegetation removal and soil disturbance accompanying logging, quarrying, road-building and construction activities have all contributed to high erosion rates and the production of large volumes of sediment. Much of the construction and population growth in the watershed (the population tripled from 1960 to 1979, from 11,600 to 33,000 people) has occurred in areas with soils which are particularly erosion-prone. The San Lorenzo River Watershed Management Plan estimates that the two- to four-fold increase in sediment production during these years is directly attributable to human disturbance of the basin's soils.
Suspended sediment and limited bedload measurements have been intermittently collected at two stations within the basin since 1973. Using the sediment transport curves, flood frequency distribution, and particle size breakdown, projections can be made for the magnitude of sediment transport under various flood conditions as the river passes through
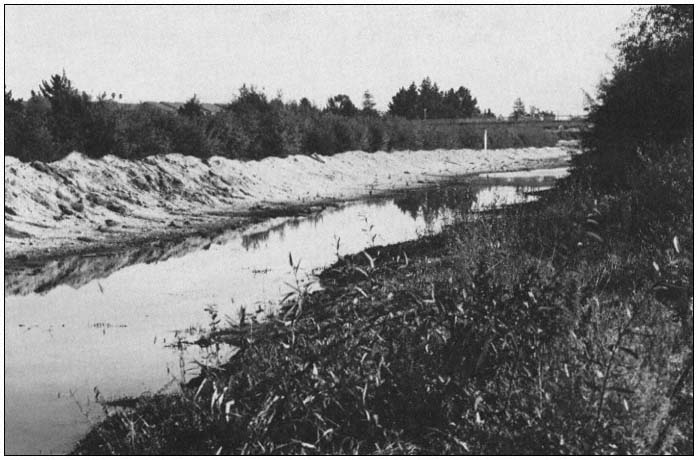
Figure 5.
San Lorenzo River channel immediately downstream from the Water
Street bridge showing efforts by the City of Santa Cruz Department of
Public Works to pile up sediment in hopes of flushing by high flows.
Santa Cruz (table 1). For example, the 10-year flood can carry over 800,000 metric tons per day (520,000 cu. m.) of sand-sized or larger material in suspension. Bedload would increase this by 5% to 10%. If a sink (as was created in the "flood control" project) or tide water was encountered by material of this size in transit, it seems probable that much of it would be deposited. Again, although flood conditions would not normally persist for 24 hours, even eight hours of the 10-year storm could produce 173,000 cu. m. of sediment. Significant volumes of sediment can be transported by the two- or five-year events. Even if the channel were to be dredged to original project design, sediment carried by one large floodflow (or even the cumulative effect of several years of moderate flow conditions) could soon fill the channel back to an equilibrium grade. This raises serious questions about the effectiveness of annual dredging as a solution to the flood control problem.
The unavoidable conclusions are the following. 1) The San Lorenzo River channel is now at equilibrium grade, and the sediment fill appears from all evidence to be stable. 2) The channel can no longer carry the 100-year event, and in fact cannot, in all probability, hold the 30- to 40-year flood. 3) Downtown Santa Cruz is endangered and has far less protection than is required by the Federal Flood Insurance Act. The $6.5 million flood control project designed by the CE grossly underestimated the sediment load being carried by the river and also failed to account for the changes in channel equilibrium gradient which would be produced by the alteration of channel morphology.
| ||||||||||||||||||||||||||||||||||||||||
Future Options
There are no simple solutions to the flood hazard which the city of Santa Cruz is currently faced with, but any solution clearly involves the riparian corridor and the life it supports and the natural beauty it can present. This problem is not unique to Santa Cruz and the San Lorenzo River, but develops anywhere major "flood control" projects have been carried out. Through dams and reservoirs, aquatic systems are totally flooded; through "channel improvements" (levees, dredging, and channel straightening) these same systems are destroyed or eliminated, temporarily if not permanently. Thus, the price of flood control using engineering works is riparian corridor elimination in most cases. The San Lorenzo River is an extreme example in that the annual river-bottom vegetation removal and sediment shuffling has not even produced the anticipated protection from flooding.
Two important factors to consider in any proposal dealing with Santa Cruz and the San Lorenzo River are: 1) is the solution permanent and does it deal with the root cause, or is it simply a temporary stopgap approach; and 2) how will it ultimately affect the riparian corridor?
We invariably select engineering rather than planning solutions because these are more visible, more impressive, and they are also driven by institutional inertia. In addition, once the engineering structure is in place, additional engineering is the usual solution to shortcomings or flaws in the original design. (The reality is, however, that large natural systems, such as rivers and the ocean, simply can never be totally controlled by man-made structures).
A number of possibilities exist or have been proposed.
Option l.—Dredging and removal of all the accumulated sediment from the channelized reach of the river would cost about $3 million today. Although this would reduce the immediate flood threat to the city, it would offer only temporary protection. At average annual sand transport rates of 40–80,000 cu. m., either channel capacity would soon be reduced or expensive (estimated $100–200,000) yearly dredging would be required, thereby producing annual riparian corridor destruction. The city currently is using this dredging approach, but has only been removing sediment from the channel on a very modest scale. Channel surveys indicate that upstream sand input from winter flows is keeping pace with the sand removal operations.
Option 2.—A combination of erosion control measures and sediment or debris basins could be used to reduce downstream sediment transport in the San Lorenzo River. This effort would have to be accompanied by initial dredging of the channel reach through Santa Cruz in order to provide the required flood protection. Although any erosion control measures in the watershed would be beneficial, the costs of land acquisition and maintenance, and biological effects of a number of large sediment traps on the San Lorenzo River or major tributaries are serious negative factors. For comparison, costs for 20 such structures, each impounding one square mile watershed, would approximate the initial outlay and annual costs of maintaining the downtown channel.
Option 3.—A single large dam on the San Lorenzo itself or several smaller dams on major tributaries could reduce flood peaks by 20,000 cfs, such that the present channel could convey the reduced floodflows. No suitable site exists on the San Lorenzo for a dam of this sort without producing major inundation of populated areas. Construction costs and environmental impacts of the number of smaller dams required make this alternative an unattractive one.
Option 4.—The levees and bridges could be raised in order to increase the channel capacity such that the 100-year flood could be effectively contained. This option essentially enables the channel gradient to remain at its equilibrium position and allows for increased flood capacity
through raising the banks. The costs for the replacement of four bridges and a six-foot increase in levee heights is estimted to be $20 million, over three times the cost of the original project (Jones-Tillson and Associates 1979). Any engineering solution of this sort has an obvious economic limitation, and the 100-year flood may well occur and top the banks despite the expenditure of $20 million. Should a flood large enough to breach the levees occur, the height of the floodwaters above the channel floor would provide a hydraulic head that could quickly erode the levee and inundate downtown Santa Cruz.
Perhaps the all too obvious solution is not to have built our cities on floodplains to begin with. History is against us however, and it is senseless to blame our ancestors for settling on the fertile flatlands adjacent to our rivers and streams. Although it may be cheaper and safer in the long run to relocate many floodplain communities, this is unlikely to ever occur without the occurrence of major floods which totally destroy those communities.
A compromise of sorts may be obtained by allowing a river to develop some sort of natural course, within the broader confines of a flood control structure. In the case of the San Lorenzo, a width increase of 18–34 m. would increase the channel capacity to original design conditions (approximately accomodating the 100-year flood). This proposal presents some challenges and opportunities in allowing the river to reconstruct some of its natural meanders and retain its natural gradient (both eliminated by the present levee system).
Utilizing a meandering pattern would only require rebuilding one of the levees at any particular location. A survey of land adjacent to the river shows that streets, parking lots, used car lots, parks, and tennis courts occupy much of the 18 to 34 m. of land in question. These uses could be continued after excavation occurs. The widening of the river could be designed such that a smaller pilot channel could hold perhaps the five- to 10-year event. Much of the remaining channel could be vegetated as a downtown park and green belt such as the recessed park which presently exists between Soquel and Water streets adjacent to the river. Other higher floodplain land could be used for the previously mentioned parking and streets except during and immediately after major flood events. The pilot channel could also provide an adequate flow depth for anadromous fish migration.
Existing bridges could probably be extended, obviating the complete bridge replacements necessitated by Option 3. Some houses and small commercial buildings may have to be removed, but initial investigation indicates that displacement need not be extensive. Much of the required land is city property which would lower acquisition costs.
Conclusions
In any attempt to control a natural system, we must realize that we are usually going to disturb a delicate equilibrium. By excavating the San Lorenzo River's bed to increase its slope and capacity to transmit floodwaters, we also created a disequilibrium to which the river had to adjust. As a result of the river aggrading its channel back to an equilibrium gradient, flood control capacity has been significantly reduced. Because the channel can no longer contain the 100-year event, the entire downtown area of Santa Cruz is apparently no longer covered by the Federal Flood Insurance Act. The stopgap bulldozer approach presently being used has led to yearly destruction of the riparian corridor and no significant alleviation of the flood hazard.
We must begin to focus our efforts on controlling our own activity, rather than persisting in the ineffective historical approach of an increasingly expensive system of dams, levees, and channels. All flood protection ends somewhere. We can never afford complete flood protection, as a community, a state, or a nation. The continued increase in annual flood losses despite the construction of an ever-increasing number of "flood control" structures is clear testimony to the failure of this approach.
Literature Cited
US Army Corps of Engineers. 1973. Flood plain information—San Lorenzo River, Felton to Boulder Creek. US Army Corps of Engineers, San Francisco, Calif.
US Army Corps of Engineers. 1957. General design memorandum—San Lorenzo River flood control project. US Army Corps of Engineers, San Francisco District, San Francisco, Calif.
Jones-Tillson and Associates and Water Resources Engineers. 1979. San Lorenzo River reconnaissance study. US Army Corps of Engineers, San Francisco, Calif.
Photodocumentation of Vegetation and Landform Change on a Riparian Site, 1880–1980
Dog Island, Red Bluff, California[1]
Stephen A. Laymon[2]
Abstract.—This study used ground and aerial photos taken over the past 100 years to trace the development of the present riparian vegetation. The photos show the changes in the Sacramento River channel which have led to the present configuration of the area. Principles illustrated by these photos are: 1) the dynamic nature of the riparian system showing rapid and dramatic changes at this site; 2) the rapidity with which riparian vegetation develops; and 3) the use of historic and present day photography to document changes in a riparian environment.
Introduction
During the course of my 5-year study at Dog Island, Tehama County, I became interested in the development of the present day landforms and riparian vegetation at this site. I was able to follow up on this interest in connection with a job as archivist at the Tehama County Library and in a physical geography seminar at California State University, Chico.
Little or no work has been done to document changes at riparian sites. This study was undertaken to show the changes at this particular site, but more importantly to show the potential resources available to document land use, landforms, and vegetation pattern changes, and to show the dynamic nature of the riparian system. The use of ground photos to compare past with present conditions is a common practice in forest and rangeland situations. Problems were encountered in this study when an attempt was made to apply this technique to a flat Sacramento Valley site with tall riparian vegetation.
Methods
Research Techniques
Early ground photos were obtained from the collection of the Tehama County Library and several longtime local residents. Attempts to rephotograph these views of the study area met with limited success since the vegetation had grown so much in the ensuing 100 years, blocking the view from most angles.
The aerial photos were obtained from the United States Soil Conservation Service, US Army Corps of Engineers, and the California Department of Water Resources. Overlay projection using a photographic enlarger was used to document boundary changes.
Study Area
Dog Island, or Walton's Pasture, as it was known in the early days, has long been a favorite picnic spot for the people of Red Bluff. Now a small island in the Sacramento River, the site's amenities included an area of still water, where the land sloped gently to the river, in contrast to the high, steep bluff for which the city is named. Here the city had its waterworks, which originally consisted of a horse and wagon delivering water door to door. Later, the city pumped water directly from the river, and still later from deep wells.[3] Here also, local youths spent their days cutting school classes, and in the early days this is where most of the local people learned to swim.
In the mid-1960's the area was donated to the city of Red Bluff by the Samuel Ayers family for use as a city park and natural area. The city has kept development at a fairly low level, with a footbridge to the island, a parking lot
[1] Paper presented at the California Riparian Systems Conference. [University of California, Davis, September 17–19, 1981].
[2] Stephen A. Laymon is a Graduate Student in the Department of Forestry and Resource Management, University of California, Berkeley.
[3] Walton, T. 1956. Tehama County centennial oral history interview. Tehama County Library oral history tape.
with landscaping, two restrooms, and trails. One loop road which was put in on the mainland portion has since been closed to vehicles due to a high level of vandalism.
The origin of the name Dog Island remains a mystery since long time residents say that the area was always called Walton's Pasture, and that the dairy cattle from Walton's Dairy on the bluff to the south grazed there. One story has it that an old man ran a kennel on the island in the 1880's, but since no island existed at that time, this is impossible. A more plausible explanation is that park officials asked some local truants what they called the area and "Dog Island" was the answer.
Landforms and Topography
The Dog Island study area consists of the river, the island, the channel around the island, the mainland plain, the red bluff, Brewery Creek, and the gently sloping area from the parking lot to the footbridge (see fig. 1). The entire study area has a remarkably narrow elevation range, with 95% lying between 77.1 m. and 79.2 m. above sea level. On the northwest side, the red bluff known as Duncan Hill rises almost vertically to a height of 97.5 m., or 20.4 m. above the river level. The parking lot at the west edge of the area is between 82.3 and 85.3 m. elevation. From there the land slopes in two terraces to the side channel 76 m. away. The highest point on the island is not more than 3 m. above the gross pool level of the Red Bluff diversion dam.
Figure l.
Map of Dog Island study area and environs.
Despite having such a narrow elevation range, the area is not level, having many channels which have waterflow during flood stage. The three most prominent are old river channels that have been silted in over the years. One of these lies east of the bluff near the north boundary of the park, and was the 1850 river channel. Another lies near the east end of the footbridge. The third is found on the southeast side of the island, and was the main river channel prior to the 1937 flood.
The Sacramento River at Dog Island ranges from 170 m. to 250 m. in width. As a result of the diversion dam below Red Bluff, it is kept at a constant 77.1 m. above sea level. This is 2.4 m. higher than the river level would be without the influence of the dam. The water level is lowered slightly to 76.5 m. in the winter when no water is being diverted for irrigation. During flood stage the waters at times rise to 81 m. covering the entire area except the bluff and the parking lot. The river channel that separates the island from the mainland ranges in width from 20 m. to 41 m.
Brewery Creek is an intermittent stream which flows into the study area from the west. It was named for the brewery which was located along it near here in the 1880's. The creek has two main branches, the longer of which is 4.8 km. in length. It drains 8–10 km2 of highly eroded impermeable soils. During heavy local rains the runoff is great and the creek runs high, carrying with it heavy bedloads of rock, gravel, and soil. This is building up a delta in the side channel which may in the future connect the island to the mainland. The creek has cut a deep channel on the north side of the parking lot, and is responsible for the gently sloping gap between the red bluffs of Duncan Hill to the north and the city to the south.
Soils
Soil is the base for the vegetation of any area. Ninety percent of the soils in the study area are fertile loams, so the dense vegetation found here is not surprising.
Five types of soils are found on or near Dog Island. The island itself is an alluvial soil known as Red Bluff loam. It consists of up to 15% gravel, and has both high available water and high moisture-holding capacity (USDA Soil Conservation Service 1967).
The low area to the north of the island is made up of the Columbia loam complex, ranging from mixed soils of silt and gravels to fine sandy loams. These soils generally lie above all but the highest floods, are well drained, and have moderate permeability. They are brown to pale brown in color and are neutral to slightly acid. These are very fertile soils, favored for farming (ibid .).
The soil in the sloping area to the south of Brewery Creek is an Arbuckle gravelly loam. It
is an easily channeled soil with poor waterholding characteristics, very slow permeability, and a clay substrate (ibid .).
Duncan Hill, the bluff on the northwest side, is made up primarily of Newville gravelly loam. This soil is yellowish-brown on the surface and is slightly acidic. The subsoil is a reddish-brown gravelly clay. It is made up of sediment from conglomerate and silt stone of the Tehama formation. In addition, a portion of the hill consists of a mixture of Corning-Redding gravelly loams, a medium acidic, reddish-brown soil with a red clay subsoil. This soil has low permeability and high runoff (ibid .).
Vegetation
The vegetation-types that are found in the study area are floodplain riparian woodland, blue oak woodland, cattail marsh, and landscape plantings. Of the aforementioned vegetation-types, the latter three are the least important since they form such a small portion of the total area. The blue oak woodland found on the hill north of Brewery Creek covers only 1% of the land area. Scattered blue oaks (Quercusdouglasii ) form the canopy here, reaching up to 10 m. There is no understory, and the shrub layer consists of scattered buckbrush (Ceanothuscuneatus ). The groundcover primarily consists of introduced grasses.
The landscape plantings are found around the main parking lot, restrooms and waterworks facilities. They consist mainly of several introduced cedars and pines, a border of live oaks (Quercus sp.) along the highway, several pyracantha (Pyracantha coccinea ) hedges, scattered introduced flowering shrubs, and approximately 0.25 ha. of lawn. These are planted around several native blue oaks.
The two marsh areas are the most important of the minor vegetation-types. They cover about 1% of the area. The marsh on the southern part of the island has a thick growth of cattail (Typha sp.) with a border of willows (Salix spp.). The water is up to 0.3 m. in depth at this spot. The open areas of water are thick with small aquatic plants such as duckweed (Azollafiliculoides ). The land area around the pond that is not covered with cattail and willows is grown up with dense stands of grasses. The marsh on the mainland is just north of the mouth of Brewery Creek. It is higher than river level and only contains water after a flood or heavy rain. The cattail here is much more scattered and intergrown with grasses, herbs, shrubs, and willows, a pattern that has accelerated over the past seven years.
The primary vegetation-type in the study area is riparian woodland. Various forms of this plant community cover 95% of the land. It is an exceptional vegetation-type in the arid West. The riparian vegetation in the study area is quite diverse. Various species of trees are dominant on different portions of the area, often forming stands of clumps or bands of a single species. The western border of the island, facing the slough, is primarily old-growth cottonwood (Populusfremontii ) reaching 40 m. in height, with scattered willows (fig. 2). An understory of box elder (Acernegundo ), willows, black walnut (Juglanshindsii ), and elderberry (Sambucusmexicana ), and bands of shrubcover and groundcover layers of wild blackberry (Rubusursinus and R . vitifolius ), and the introduced Himalayan blackberry (R . discolor ) are found. The central part of the northern third of the island is the most open. It has a cottonwood canopy with a scattered understory of box elder, valley oak (Quercuslobata ), blue oak, and buckeye (Aesculuscalifornica ), and a groundcover of mugwort (Artemisiadouglasiana ) sometimes reaching 2.5 m. The northern tip of the island is a white alder (Alnus rhombifolia ) and willow thicket with no groundcover, surrounded by a blackberry thicket. The northeastern side of the island also has a cottonwood canopy with an understory of box elder, willow, and elderberry, and a shrub and groundcover of blackberry and herbaceous growth. The border of vegetation closest to the water is a dense mixture of white alder, Oregon ash (Fraxinuslatifolia ), and willows. Further south this band of alders and willows widens to about 30 m.
Cottonwoods are absent from the southeast quarter of the island. This area has a very dense canopy of alder, box elder, and willow reaching to 15 m. The trees are closely spaced, allowing very little light penetration. Groundcover is lacking in the thickly forested areas, but bands of blackberry and herbaceous growth are found in the more open spots. One alder thicket of almost 0.75 ha. is especially interesting; the trees have grown to 18 m. and many are now dying. There is no groundcover, but an understory of sycamores (Platanusracemosa ) and Oregon ash is developing. At the southern tip of the island there is a willow thicket reaching 8 m. in height and 30 m. across.
The vegetation on the mainland, south of Brewery Creek, is similar to the western part of
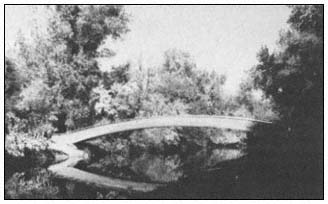
Figure 2.
Footbridge to Dog Island showing dense vegetation
along side channel, looking north (August, 1979).
the island, with a cottonwood canopy to 40 m., a well-developed understory of box elder, alder, and willow, and a groundcover of blackberry. This type of growth also extends along the northwest side of the slough, from 50 m. north of Brewery Creek to the freeway bridge. Also found in this area, in the slightly lower and more open spots near the slough, are several dense willow thickets reaching 7 m. in height and up to 30 m. across.
Along Brewery Creek the vegetation also has a canopy of scattered cottonwoods reaching 25 m., but the understory is much less typically riparian, with live oaks, blue oaks, toyon (Heteromelesarbutifolia ) mixed with the willows, Oregon ash, and box elders. The groundcover is a mix of grasses, blackberries, and herbaceous growth.
Black walnut is the dominant tree in the area just north of Brewery Creek and along the base of the bluff. The trees are not large, reaching only 20 m., and do not form a closed canopy. This allows light penetration and the formation of a dense ground layer of blackberries with patches of willows and elderberries. Also in this area are a number of introduced species such as mulberry (Morus sp.), black locust (Robinia pseudoaccacia ), osage orange (Maclura pomerifera ), plum (Prunus sp.), fig (Ficus carica ), and pyracantha.
At the north end of the bluff the dominant tree species is valley oak. The largest of these trees reaches 35 m. in height, and some are at least 100 years old. This site has a groundcover of grasses and a scattered understory of box elder and black walnut. The valley oak area borders the field to the north for about 300 m. and merges into an area with a canopy of black walnut and cottonwoods. In this location there is also a dense osage orange thicket of about 1 ha. which is devoid of groundcover.
The center of the mainland portion is the most open of the entire study area. Until 1975 it was a large, grassy meadow with a few scattered clumps of box elder, plum trees, and two dense box elder thickets. When the park loop road was constructed, the grass in the meadow was mowed to cut down on fire danger and provide a more "park-like" atmosphere. The meadow instantly became a defacto parking lot, the gathering place for the local teenagers, which totally denuded large areas of it. Due to reduction of competition from the grasses, the box elders began to grow rapidly and now are large trees reaching 15 m. and covering a much more extensive area. The tall rye and Johnson grasses that previously covered the meadow provided a vegetation-type that is now missing. More information on this area can be found in Laymon (1983).
Results
As static as the scene appears today at this bend in the river, as little as 40 years ago the island was very different in appearance, and as recently as 100 years ago the entire study area was litte more than a sandbar, devoid of vegetation. With the use of maps, aerial photographs, ground photos, and local legend, I was able to reconstruct the development of Dog Island over the past 100 to 130 years.
Two basic types of geologic formations are found in the study area. They are the recently formed alluvial deposits of the island and low regions to the east, and the red bluffs consisting of Pleistocene and Pliocene nonmarine sedimentary deposits to the west (USDA Soil Conservation Service 1967). This hard, red soil has been an effective barrier to westward river movement for many thousands of years. One can picture the river migrating without restraint eastward across the valley many times, always to return to the west and to stop at this 23-m. bluff.
In the early 1850's when the first settlers came to Red Bluff, they found the river flowing against these bluffs from the center of the study area to 3.2 km. (2 mi.) south of town.[3] Maps from 1850 to 1900 show no evidence of even a sandbar in the river at this location. A photo taken in 1881 from the bluff adjacent to the study area looking south toward Red Bluff (fig. 3) shows a bare bluff with the river running at its base. On the right (west bank) a small delta from Brewery Creek was beginning to build up. The closest brick building on the right was the city waterworks. The building is still located at the site.
Another photo (fig. 4) taken from Red Bluff, looking north, circa 1900, shows the sides of the bluff and the rest of the study area, devoid of vegetation except for a few low willows on the sandbar in the river, a valley oak at the far right, and scattered blue oaks on top of the bluff. The amount of deposition at the foot of the bluff can be seen by comparing figures 3 and 4. Alluvial deposits had built out 30 to 50 m. in 20 years.
The next photo (fig. 5), taken in 1912, shows the area from the west, looking past the waterworks toward the Tuscan Buttes to the east. This photo illustrates the lack of vegetation and shows the river flowing towards the waterworks building (today the main flow is directed 350 m. south of that point due to deflection by Dog Island). No sandbars are seen in the river, but the west bank above the Brewery Creek outlet is in the same position as it is today. The area appears to be much lower than at present, indicating continued deposition on the mainland since the picture was taken. The first band of trees to the west of the river is very likely the 1850 river channel.
Figure 6 shows the river, looking towards Red Bluff, circa 1910, with the waterworks building on the right. One interesting feature is the amount of vegetation that has grown on the bank between 1881 and 1910.
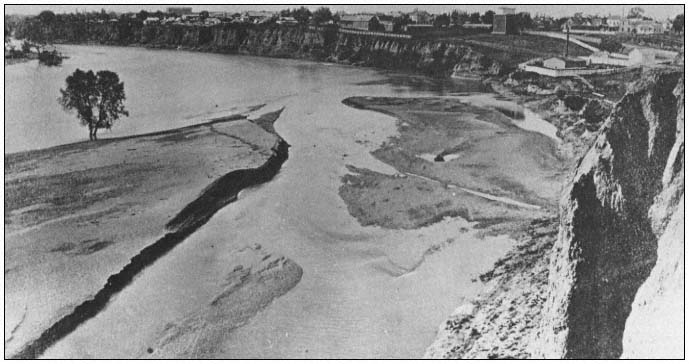
Figure 3.
Dog Island area from bluff looking south toward Red Bluff, 1881 (courtesy of Tehama County Library collection).
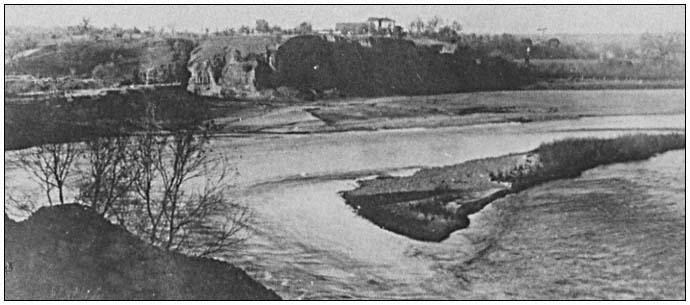
Figure 4.
Dog Island from bluff at Red Bluff looking north, circa 1900 (courtesy of Tehama County Library collection).
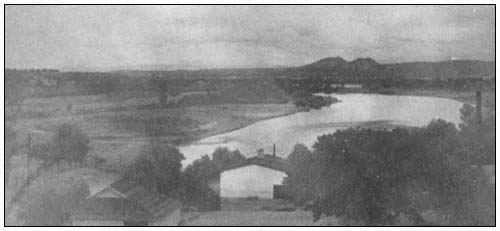
Figure 5.
Dog Island from Garrett home looking east toward Tuscan
Buttes, 1912 (courtesy of the Wetter collection).
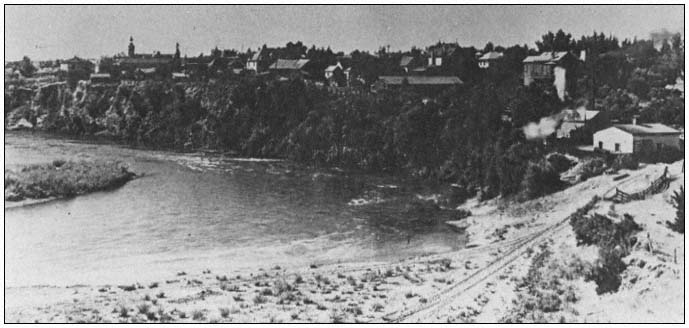
Figure 6.
Dog Island area from bluff looking south toward Red Bluff, 1910 (courtesy Tehama County Library).
I found it impossible to rephotograph any of the four historic photos of the area. The vegetation had grown up so much that the scenes were not repeatable. An oblique aerial photo (fig. 7), taken in 1979, was an attempt to duplicate figure 4. This photo illustrates the dramatic growth of vegetation at the site. Any photo taken at the point from which the photo in figure 4 was taken would today show only the first row of cottonwoods on the south end of the island.
Figure 5 was taken from an upstairs balcony of the Garrett house, a 1900 Victorian, on the west side of Main Street. I was not able to attempt a photo from this spot, but did try one from the front porch. All that could be seen from this point was the live oaks along Main Street. From the balcony, possibly the first row of cottonwoods along the slough could have been seen. I was able to take figure 8 from a point on the bluff, along the river, two blocks to the south. This photo, with Tuscan Buttes in the background, again shows how strikingly the area has changed.
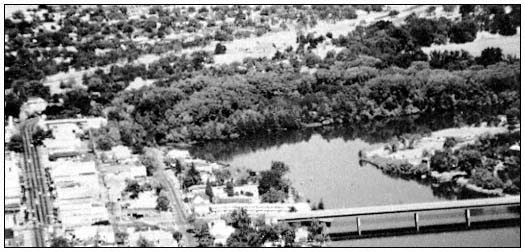
Figure 7.
Oblique aerial photo looking north, 1979.
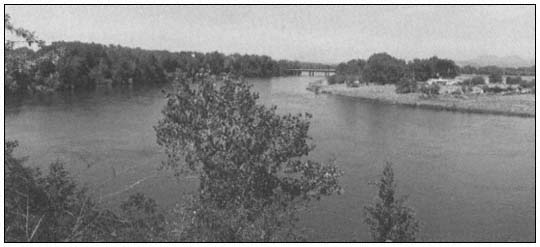
Figure 8.
Dog Island area looking east from Red Bluff with Tuscan Buttes in the background, 1981.
The aerial photos (fig. 9, 10, 11, and 12) were taken in 1942, 1956, 1970, and 1980. This sequence illustrates the increase in riparian vegetation at the site during the 38-year period. In 1942 only 15% of the island was covered with riparian vegetation. This had increased to 50% by 1956; to 90% by 1970; and to 100% by 1980. The mainland portion shows a similar pattern with the most dramatic increase between 1970 and 1980, when the box elders filled in the center of the mainland plain.
The first aerial photos of the Sacramento Valley were taken in 1938. I was able to study the photo of the Red Bluff area. In Figure 13 the 1938 land boundaries, the pre-1937 flood boundary, and the present boundaries are shown. From this composite map one can see the recent changes in the area. Prior to the 1937–38 flood, the land that later became the eastern portion of Dog Island was part of the mainland on the east side of the river. During the floodwaters, 65 m. of bank were carved off. The end of the peninsula was cut off, forming an island.[4] By 1952 this channel had widened to about three times the 1938 width, and the channel between it and the other island had filled in, leaving the area with its present shape.
Discussion
It is unfortunate that aerial photo coverage of the study site and the Sacramento River only go back as far as 1938. Quantitative land use changes can only be derived using these photos as a baseline. At Dog Island I was fortunate to find historic photos dating back 100 years. At most sites one would not be so lucky. Also, without the use of geographic and man-made landmarks, as I had at this site, it would be very difficult to tell where the early photos were
[4] Wetter, Judge Curtis E., Red Bluff, California. Personal communication, September, 1978.
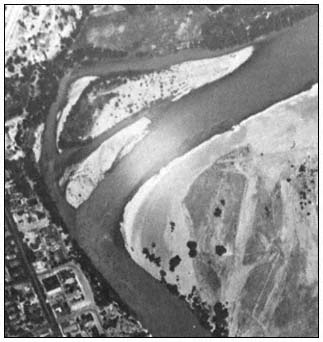
Figure 9.
Aerial photo, Dog Island, 1942 (courtesy
of the US Army Corps of Engineers).
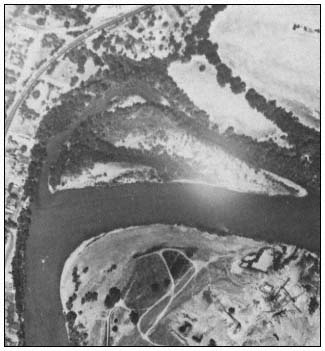
Figure 10.
Aerial photo, Dog Island, 1956 (courtesy
of the US Army Corps of Engineers).
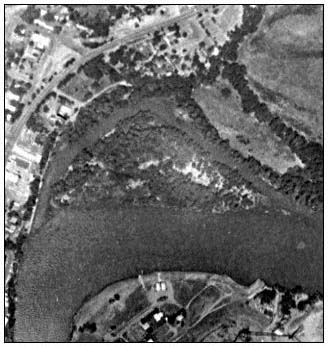
Figure 11.
Aerial photo, Dog Island, 1970 (courtesy
of the US Army Corps of Engineers).
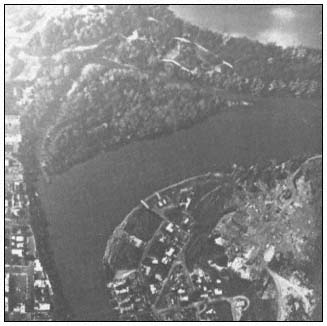
Figure 12.
Aerial photo, Dog Island, 1980 (courtesy
of the US Army Corps of Engineers).
taken. Areas where photos would be most readily available would be near towns.
The technique of rephotographing a scene to document vegetation changes on a site appears to have limited usefulness in a riparian setting of low relief. Even at Dog Island where the 20 m. bluffs were available, it was not successful since the vegetation had grown so much and views were blocked from all previously photographed angles.
Figure 13.
Geographical changes at Dog Island, 1937–1980.
Significant changes have occurred at this site and the reasons are not obvious. I believe that the deposition at Dog Island is part of the normal east-west migration of the Sacramento River. When the early settlers arrived in the late 1840's, the river had reached the red bluffs on the west. Gradually, since then, it has been moving back to the east. This process was accelerated by the 1937–38 flood which cut off the tip of the peninsula on the east side of the river. This stabilized the west side at Dog Island by deflecting the main force of the water away from the island area, such that it hit a full 1.5 blocks farther south on the red bluff. This process has slowed again since the mid-1960's when the Red Bluff diversion dam was built and some attempt was made to stabilize the banks on portions of the pool by limited use of riprap.
The increase in vegetation is a natural process as new land is being formed, but it is likely that man has accelerated the process here. The first of these factors is the construction of Shasta Dam. This dam controls the level of flow on the Sacramento River throughout the year by storing the winter floodwater and releasing it for agricultural use during the summer and fall. This creates much higher flows in the summer than would normally occur and gives more free water to the riparian vegetation than would normally be available during this period of water stress.
Possibly the most significant reason for this increase in vegetation is the raised water table created by the Red Bluff diversion dam. This dam created Lake Red Bluff which is held at a constant water level throughout the growing season. This provides the vegetation with an unlimited supply of water. At no place on the area (except the bluff itself) is water a limiting factor to plant growth.
It will be interesting in the years to come to see what landform and vegetational changes take place on the island. It is doubtful, with the bank stabilization that has taken place near the area, that major changes in the shape of the site will occur. The most significant change that is now taking place is the silting in of the side channel. Riparian vegetation will be growing here within 20 years if this process continues. Young valley oaks and black walnuts are found on higher portions of the area and these species will likely become more dominant as the years pass.
When considering the study area and the riparian woodland system in general, two concepts must by held foremost in one's mind when making management decisions. The first concept is that change is the essence of the riparian zone. In 120 years, major changes have taken place here and the current vegetation structure is a product of this change. If man insists on a stagnant situation through the use of channelization, the riparian community will not survive.
The second concept is that of the rapid growth and resistance of this vegetation-type. In a period of 40 years this area has been transformed from a gravelbar to a mature cottonwood/willow riparian woodland. The successional changes are still taking place, and in another 40 years a valley oak/black walnut riparian woodland will have taken its place. The land is the important resource, and if man can refrain from plowing, grazing, or riprapping it, the forest will return in a very short time.
Literature Cited
Laymon, Stephen A. 1983. Riparian bird community structure and dynamics: Dog Island, Red Bluff, California. In : R.E. Warner and K.M. Hendrix (ed.). California Riparian Systems. [University of California, Davis, September 17–19, 1981.] University of California Press, Berkeley.
USDA Soil Conservation Service. 1967. Soil survey, Tehama County, California. U.S. Department of Agriculture.