Policy Overview, 1950–1983
Hill-Burton Promotes Hospital Growth
Very little hospital construction took place during the depression and World War II. After the war, however, there was both a general belief that hospital beds were in short supply and much concern about the uneven distribution of beds among the states and between rural and urban areas.[2]
Commission on Hospital Care, Hospital Care in the United States: A Study of the Function of the General Hospital, Its Role in the Care of All Types of Illnesses, and the Conduct of Activities Related to Patient Service with Recommendations for Its Extension and Integration for More Adequate Care of the American Public (New York: The Commonwealth Fund, 1947).
Congress passed the Hospital Survey and Construction Act of 1946, which has come to be known as Hill-Burton, the names of its congressional sponsors.[3]Public Law 79-725. For a complete description of the history of the Hill-Burton Program, see Judith R. Lave and Lester B. Lave, The Hospital Construction Act: An Evaluation of the Hill-Burton Program, 1948-1973 (Washington, D.C.: American Enterprise Institute, 1974).
Hill-Burton represented an unprecedented involvement of the federal government in facilitating access to health care. The objectives of the new legislation were to survey the need for construction and to aid in the building of public and other nonprofit hospitals.Consistent with ongoing concerns about the propriety of federal involvement in health services, the program was set up as a federal and state partnership. An agency in each state was designated as the state approved Hill-Burton organization and was given an initial grant to survey hospital needs. The state then received funds to carry out the construction program, subject to federal approval. Priority was given to states where shortages were the greatest. The ultimate allotment formula was based on the state's relative population and its per capita income. The poorer and the more rural the state, the greater the level of federal funds available to it.
In the period of 1946–1971, short-term acute or general hospitals received the largest share of Hill-Burton support, averaging over 71 percent of program funds. While Hill-Burton funds did not dominate spending on hospital facilities, their impact on hospitals was high. Between 1949 and 1962, the federal government paid directly about 10 percent of the annual costs of all hospital construction under the program. In other words, about 30 percent of all hospital construction projects received some form of federal assistance.[4]
Lave and Lave, Hospital Construction, chap. 1.
The number of available hospital beds grew accordingly. In 1948, there were 469,398 short-term beds; by 1969, the number had almost doubled to 826,711. Of these, 40 percent had been
partially supported by Hill-Burton monies.[5]
Ibid., 25.
Studies indicate that the program had a generally significant effect on the change in hospital beds per capita between 1947 and 1970.[6]Ibid., 37.
In particular, it increased the number of hospital beds in smaller cities and targeted low-income states.The impact clearly favored the growth of short-term acute care facilities. Some years after the program began, there was a recognition of the bias in favor of these institutions. In 1954, Congress amended the law to provide grants to assist with out-patient facilities and long-term care facilities. In 1964, additional changes earmarked funds specifically for modernization of older facilities rather than for a further increase of beds. Despite these amendments, the thrust of the program was expansion of acute care facilities. Government funds essentially established the mix of facilities in the marketplace. The result was growth of the potential market for medical technology appropriately designed for these settings. The beds were available; the problem then became access to this costly and sophisticated hospital care.
The Pressure for Access Grows
Expansion of hospitals inevitably led to pressure to provide more services as hospitals sought to fill their beds. During the prewar period, particularly during the depression, families denied themselves medical care. However, medicine now offered more benefits than ever before, particularly in the modern hospital setting. In response, interest groups began to press policies that would increase access to these new and expensive therapies. Some turned to government as the logical source of funds for health care services. However, reformers confronted the traditional long-standing objection to federal involvement in health care services.
This opposition to federal entry into health care was intense. In stark contrast to the expansion of Social Security during the postwar period, there was a political deadlock over state supported health insurance proposals.[7]
Starr, Transformation, 286.
Physicians, represented by the American Medical Association (AMA), and many business groups strongly opposed all forms of national health insurance.The AMA denounced disability insurance as "another step toward wholesale nationalization of medical care and the socialization of the practice of medicine."[8]
Arthur J. Altmeyer, The Formative Years of Social Security (Madison: University of Wisconsin Press, 1968), 185-186, cited in Starr, Transformation, 286 n. 151.
The debate has been characterized as partly ideological, partly social, and partly material. For all these reasons, compulsory national health insurance was not forthcoming in the 1950s. Only American veterans received extensive, federally supported medical care through Veterans Administration hospitals that were greatly expanded during the postwar period. "The AMA opposed the extension of the veterans' program to nonservice connected illness, but the veterans were one lobby even the medical profession could not overcome."[9]
Starr, Transformation, 289.
There is real irony in this physician-led opposition to federal health programs given both the subsequent expansion of the patient base through Medicare and Medicaid and the flow of millions of dollars to physicians from government coffers.Although the government remained intransigent, there were options in the private sector for some groups. The middle class continued to seek forms of private insurance coverage; unions began to look for health benefits in collective bargaining agreements. By the 1950s, there was a stable pattern of growth in private insurance coverage, expanding the market for health care to the employed and the middle class. Much of the insurance was available to working people as fringe benefits; labor managed to bargain successfully for health insurance. By mid-1958, nearly two-thirds of the population had some insurance coverage for hospital costs. The higher the family income, the more likely that it had insurance. In 1948, 72 percent of patients paid directly for health care and only 6 percent had any form of private third-party insurance. By 1966, 52 percent of patients paid directly for health care and 25 percent had private insurance (see table 2). The numbers that received care from public funds remained relatively stable—19 percent in 1948 and only 21 percent by 1966. The poor received welfare and charity care when they could. The retired, unemployed, and disabled were often virtually excluded from the benefits of hospital based care.
The availability of insurance provided stability to the market and increased market size. The financing mechanisms through
| ||||||||||||||||||||||||||||
payroll withholding kept spending stable during recessions and reduced market uncertainty for providers and suppliers. Although causality is difficult to document, the growth in private health care expenditures during this period did expand the market for medical products, particularly in the hospital sector. The value of medical product shipments, based on data in the SIC codes, began to climb, and sales in the five relevant SIC categories rose at an average annual rate of 6 percent, which is three times the growth rate immediately before World War II but less than half of the wartime rate of increase.[10]
Foote, "Crutches to CT Scans," 10.
Table 3 captures the boom in sales during this period.Despite the growth of private insurance, pressure to expand access to health care from those outside the medical care system continued. Some favored a compulsory and contributory health insurance system. Although legislation had been introduced as early as 1958, the real impetus came after the Democratic sweep of the presidency and the Congress in 1964. In 1965, President Johnson signed the Medicare Amendments to the Social Security Act in which the federal government definitively entered the marketplace. The new law's intention was to open the health care system to the elderly. The president declared: "Every citizen will be able, in his productive years when he is earning, to insure
| ||||||||||||||||||||||||||||||||||||||||||||||||||||||||||||||||||||||||||||||||||||
himself against the ravages of illness in his old age…. No longer will illness crush and destroy the savings that they have so carefully put away over a lifetime."[11]
Quoted in Andrew Stein, "Medicare's Broken Promises," New York Times Magazine, 17 February 1985, 44, 84. For a detailed discussion of the politics of Medicare, see Starr, Transformation, book. 2, chap. 1; see also Rashi Fein, Medical Care, Medical Costs: The Search for a Health Insurance Policy (Cambridge: Harvard University Press, 1986).
Medicare in Brief
This section briefly examines the key attributes of the Medicare insurance program through 1983, at which time occurred a massive restructuring to contain costs.[12]
These changes, which altered the thrust of the program, are discussed in chapter 7 along with other cost-containment policies.
Medicare's hospital insurance program, Part A, covered specific hospital inpatient services for the elderly and some other extended care. Part B, Medicare's supplementary medical insurance program, covered costs associated with physicians and hospital outpatient services and various other kinds of limited ambulatory care. Part A is supported by the Medicare trust fund and is available to all elderly citizens. Part B is a voluntary program, supported by subscriber payments and congressional appropriations. In 1972, Medicare eligibility was extended to disabled persons and most persons with end-stage renal disease (ESRD), those with kidney failure (see table 4).[13]Social Security Amendments of 1972, Public Law 92-603. The specific impact of this legislation on kidney dialysis equipment is discussed in the next section of this chapter.
Moreover, the Medicare-eligible population has greater health needs than the average citizen. While the elderly constitute about 11.2 percent of the population, they account for 31.4 percent of the health care costs.[14]
U.S. Congress, Office of Technology Assessment, Medical Technology and the Costs of the Medicare Program (Washington, D.C.: GPO, July 1984), 3.
By the mid-1980s, Medicare became the largest single payer for hospital services, accounting for 28 percent of the nation's hospital bills. Medicare also accounted for a significant portion of funds for physician payments under Part B.[15]See Waldo et al., "National Health Expenditures."
The Medicare program had an immediate and significant impact on medical devices. Medicare costs are tied to the dollars paid by the government for services provided under the programs. The method of reimbursement was a cost-plus system that retroactively compensated providers for all "necessary and proper" expenses associated with treatment for the covered individuals. This system encouraged the purchase and use of medical technology.
Reimbursement rates for Medicare patients included a capital cost pass-through, which meant that hospitals could receive reimbursement for capital expenditures to the extent that those
| ||||||||||||||||||||||||||||||||||||||||
capital costs were part of Medicare services. (Capital expenditures generally include durable medical equipment, such as beds, operating room machinery, and diagnostic equipment.) Hospital administrators had little reason to resist pressure from physicians and others to buy new, specialized, and perhaps underutilized equipment. Indeed, the growing prevalence of third-party financing, particularly in the public sector, is considered one of the major causes of inflation in hospital costs.[16]
Lave and Lave, Hospital Construction, 54.
Much of those costs were associated with spending on medical devices.The Medicare system is administered by the Health Care Financing Administration (HCFA). The HCFA contracts with private organizations, such as Blue Cross and Blue Shield, to process the claims. Private insurers, called fiscal intermediaries , handle claims under Part A of the program; insurers for Part B
are called carriers . Figure 13 illustrates the complicated process for Medicare claims.
Claims processing is an enormous undertaking. In 1987, HCFA processed approximately 366 million Medicare claims.[17]
U.S. Department of Health and Human Services, 1987 budget request, 5 February 1986.
In addition, HCFA also handles disputes about whether Medicare covers a particular procedure or technology. To be eligible for Medicare payment, there must be a determination that a new technology or device will be covered. Indeed, advisors to the Department of Health and Human Services concluded in a recent report that "Medicare coverage policy involves so large a portion of U.S. health care delivery that it can significantly affect the diffusion of a technology as well as the environment for technological innovation."[18]National Advisory Council on Health Care Technology Assessment, The Medicare Coverage Process (14 September 1988). This report reviews and then critiques HCFA's coverage process.
The Medicare Act prohibited payment for any items or service not considered reasonable and necessary for patient care. However, the law did not include a comprehensive list of items or services considered "reasonable and necessary" under the program. Medicare coverage policy continuously evolved and was implemented in a decentralized manner. Some coverage decisions were made at a national level by HCFA's central office, under advice from the federal Office of Health Technology Assessment (OHTA).[19]
For detailed discussion of OHTA, see Committee for Evaluating Medical Technologies in Clinical Use, Assessing Medical Technologies (Washington, D.C.: National Academy Press, 1985), particularly 355-363.
Most decisions were made by Medicare contractors who processed claims. The decentralized nature of the process can create an uncertain marketplace for newly introduced technologies. However, in the early years of the federal program, coverage decisions were consistently favorable for devices and the complex process was little threat to the industry.Medicaid in Brief
The 1965 law also established the Medicaid program, a silent partner to Medicare that received much more publicity at the time. The goals and structure of Medicaid are quite different than Medicare. Its purpose is to provide payment for medical care for certain low-income families defined by law as medically needy. The goal is to increase access of the poor to health care services.[20]
For a complete description of the Medicaid program, see Allen D. Spiegel, ed., The Medicaid Experience (Germantown, Md.: Aspen Systems, 1979). See also Thomas W. Grannemann and Mark V. Pauly, Controlling Medicaid Costs: Federalism, Competition, and Choice (Washington, D.C.: American Enterprise Institute, 1982); and Robert Stevens and Rosemary Stevens, Welfare Medicine in America: A Case of Medicaid (New York: Free Press, 1974).
Unlike Medicare, which is a wholly federal program, Medicaid uses a combination of federal and state funds but states
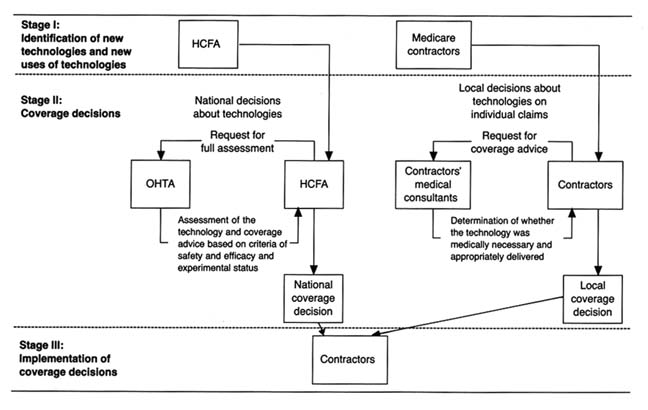
Figure 13. Model of Medicare's coverage process for individual medical technologies.
Source: Medical Technology and Costs of the Medicare Program (Washington, D.C.:
Office of Technology Assessment, July 1984), 76.
control and administer them. Medicare is tied to Social Security and has uniform national standards for eligibility and benefits. Medicaid, however, defers to the states on many aspects of its programs for the poor and places more restrictions on physician participation. States are not required to participate in Medicaid, but elaborate financial incentives virtually guarantee participation. By 1977, all states had a Medicaid program in place. States may impose complicated eligibility requirements and benefits vary significantly from state to state. States set the definition of income limits for an individual or a family. These limits differ considerably among the states. Many families below the federally defined poverty line are not eligible for Medicaid in some states.[21]
Stephen F. Loebs, "Medicaid: A Survey of Indicators and Issues," in Spiegel, The Medicaid Experience, 5-19.
The federal government matches the state expenditures in the program based on a formula tied to each state's per capita income. The federal contribution to the program ranges from approximately 50 to 78 percent of the state's total costs.[22]
Charles N. Oberg and Cynthia Longseth Polich, "Medicaid: Entering the Third Decade," Health Affairs 7 (Fall 1988): 83-96, 85.
When Medicaid was passed, supporters argued that it would add only $250 million to the health care expenditures of the federal government. In the first year of the program, the outlays of the federal and state governments were $1.5 billion. By 1975, spending rose to $14.2 billion, and in 1987 the expenditures exceeded $47 billion (see figure 14).The number of people enrolled in the programs has increased as well. There were 4.5 million recipients in 1968 and 24 million in 1977, at Medicaid's peak; the figure dropped to 23.2 million in 1987. Medicaid accounted for over 10 percent of America's total health care expenses in the 1980s. At that time the distribution of recipients included dependent children under twenty-one years of age, adults in families with dependent children, persons over sixty-five, the permanently and totally disabled, and the blind. The types of services covered include inpatient, acute care, skilled nursing homes, mental hospitals, physicians services, and outpatient and clinic services. However, inpatient services (including hospitals and nursing homes) constitute about 70 percent of Medicaid payments.[23]
Loebs, "Medicaid," 6-8.
The program has been tremendously controversial. It has been criticized for rapidly rising costs, well-documented claims of fraud and abuse by providers, and questions about management,
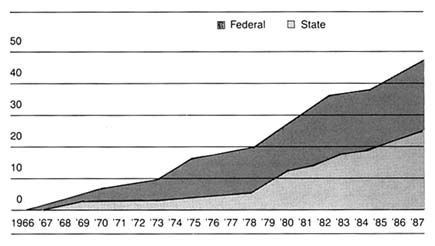
Figure 14. Federal and state Medicaid expenditures, 1966–1987 (in billions of dollars).
Source: Health Care Financing Administration. Reprinted from Oberg and Polichj,
"Medicaid: Entering the Third Decade," Health Affairs (Fall 1988), 85.
quality, and equity. But Medicaid remains the primary vehicle for access to health care for the nation's poor.
Impact on Medical Device Sales
These two major health initiatives led to greatly increased spending on health. National health care expenditures rose from $40.46 billion in 1965, which was 5.9 percent of the GNP, to $322.3 billion, or 10.5 percent of the GNP, by 1982. Per capita expenditures increased more than fivefold, from $207 in 1965 to $1,337 in 1982. The public share of coverage rose from only 21 percent in 1966 to 41 percent in 1982.
It is clear that private insurance programs helped to increase and to stabilize the health care market generally. However, the infusion of capital from federal and state governments brought millions of heretofore excluded individuals into the system.
Without question, government spending significantly expanded the marketplace for health care services and, inevitably, for medical devices associated with treatment. In general, hospitals benefited the most by federal and state spending programs,
but device sales increased in all relevant categories. Examination of the individual SIC categories of medical devices supports the conclusion that federal spending expanded industry sales. In 1982, hospitals purchased $7 billion of the $16.8 billion in sales of products in the five SIC codes, and this total does not include some infrequently purchased larger items (see table 5).
Three SIC categories—3693: X-ray, electromedical, and electrotherapeutic apparatus; 3841: surgical and medical supplies; and 3842: surgical appliances and supplies—are particularly closely tied to federal Medicare and Medicaid payments because of their strong association with a hospital base. Dental and ophthalmic supplies (SIC 3843 and 3851 respectively) are less likely to be covered by Medicare payments. Before Medicare, four of the five SIC categories had similar growth patterns from 1945 to 1965; the fifth, surgical and medical instruments, grew faster because of demand stimulated by hospital construction. After 1965, however, sales in the three Medicare affected categories were much higher (14 to 22 percent) than the other two (8 to 11 percent).[24]
U.S. Bureau of the Census, Census of Manufactures: Industry Series (Washington, D.C.: GPO, 1963, 1982), table 6c.
The following case studies illustrate more specifically the powerful impact of federal spending on medical device growth.