Pyroclastic Samples
Field Classification
Several classification schemes are provided in Appendix B. Field descriptions include general grain size and sorting, bedding textures, color, and topographic effects on the pyroclastic deposit. More detailed descriptive aspects are discussed in Chapter 2.
Laboratory Analysis
Analysis of tephra samples in the laboratory involves several interdependent techniques that generally do not require elaborate analytical equipment. Figure A.8 is a flow chart that outlines laboratory treatment of pyroclastic samples, including both preparatory and analytical steps. The petrographic inspection follows procedures outlined above for lava samples and can be simply performed with a binocular scope on small sample splits or thin sections of epoxy-impregnated samples. Fundamental measurements comprise granulometry, mode and component analysis, grain shape and texture description, and mineral and glass chemical analysis.
Granulometric Analysis
Grain-size analysis of pyroclastic samples is a standard characterizing technique and, over the last 20 years, has been increasingly used to interpret the origin of samples (for instance, Sheridan, 1971; Walker, 1971; Wohletz, 1983). Granulometric characterization of samples is an especially important tool for correlation and classification in areas where many pyroclastic deposits are encountered. Interpretation is generally needed to determine the eruption and emplacement mechanisms for the deposits sampled.
Sieving is a practical approach for classifying samples in the range of ~16 to 0.064 mm, for which standard screens are readily available (see, for instance, Folk and Ward, 1957). Above this grain size, hand counts of individual fragments are useful; below this size, settling-tube measurements, based on either a pipette method (Folk, 1976) or optical methods such as fluid suspension absorbance measurements can extend the range to near 1 µm. The wide range easily analyzed by screen sieves provides enough data to adequately characterize and interpret most tephra samples. Table A.2 presents class size intervals for clastic sediments and pyroclastic rocks. Because of the broad range of grain sizes represented by pyroclastic materials, it is common to use a logarithmic transformation of grain diameters called the phi (f ) scale (Wentworth, 1922):

for which dmm is the grain diameter in millimeters. Krumbein (1938) showed that on this scale transformation, plots of mass frequency vs phi size approximated a Gaussian distribution, which can be characterized by the use of log-normal statistics:

where d m/df = the mass per unit interval of f , Ks = a constant to normalize the distribution (usually Ks = 1), sd = the standard deviation in log units, d = particle diameter, and dm = the mode diameter of the distribution.
Tephra size data are useful for various types of interpretation. For example, Sparks et al .
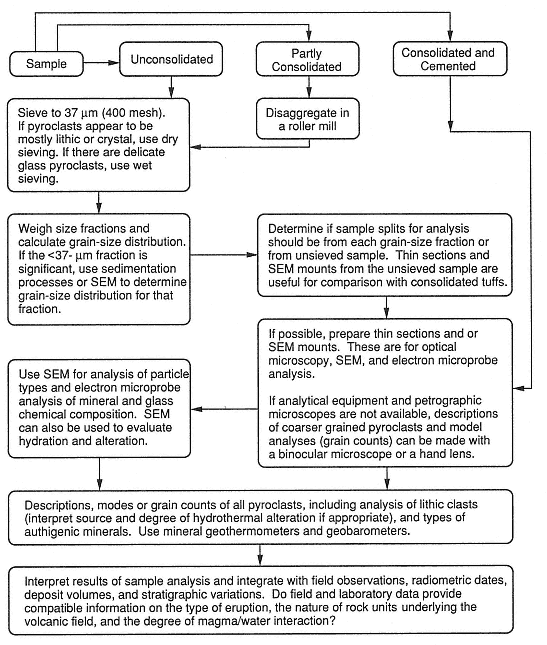
Fig. A.8
Flow chart for laboratory treatment of pyroclastic samples.
(1978) discussed the importance of particle size to terminal fall velocity, which is useful in determining the amount of time required for pyroclasts to fall out of eruption plumes and clouds (Fig. A.9). Carey and Sparks (1986; Figs. 1.13 and 1.14) related maximum clast sizes to distance from source for eruptions of different magnitudes. A plot of median diameter vs distance from the source (Fig. A.10) shows the general fining of pyroclastic samples with distance for a number of different eruptions.
By using single-mode lognormal statistics, Walker (1971) characterized tephra samples of pyroclastic fall and flow origin. Wohletz (1983) described similar size data for pyroclastic surge samples. Sheridan and Wohletz (1983a) characterized size data for numerous samples of hydrovolcanic origin (see Fig. 2.20). Taken together and plotted on a sorting vs median diameter plot (Fig. A.11), these data provide a general interpretation scheme for tephra samples.
Another, more specific example illustrates the application of size data to a stratigraphic section of the Lathrop Wells scoria cone in Nevada that exhibits two main types of eruptive behavior (Wohletz, 1986): early
| |||||||||||||||||||||||||||||||||||||||||||||||||||||||||||||||||||||||||||||||||||||||||||||||||||||||||||||||||||||||||||||
hydrovolcanic explosions and later Strombolian eruptions (Fig. A.12). Three types of bedforms were recognizable: scoria fall, fine ash layers of undetermined origin, and pyroclastic surge. Figure A.13 is a sorting vs median diameter plot that nicely differentiates between the three bedforms. Because of their relatively poor sorting, it was assumed that the fine ash layers had been emplaced by pyroclastic surge. Furthermore, a plot of median diameter and weight percent of fine ash (Fig. A.14) correlated the fine ash layers with similar size distributions from early hydrovolcanic samples in the cone stratigraphy and thus permitted their classification as hydrovolcanic. This interpretation was supported by a later study of pyroclast constituents, morphology, and surface chemistry.
We believe that size analysis can provide even more information about the history of fragmentation and dispersal of pyroclastic samples through mathematical analysis of individual size-frequency distributions. Sheridan et al . (1987) discussed the typical polymodality of tephra size-frequency distributions and possible types of interpretations. Typically, size-frequency distributions are analyzed as lognormal-type distributions, in which, for any particular sample, one or more lognormal subpopulations may overlap to form the total observed distribution. Because the single-mode lognormal statistics are not strictly applicable to tephra samples, we advocate the subpopulation discrimination technique established by Sheridan et al . (1987), in which microcomputer software can be applied to sieve data for fully characterized sized distributions. More recently, Wohletz et al . (1989) developed a new mathematical distribution, the sequential fragmentation/transport model, that relates distribution shapes to physical
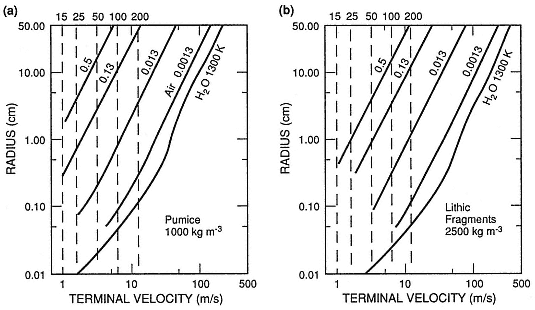
Fig. A.9
Terminal fall velocities for (a) pumice and (b) lithic fragments of varying radii in fluid of
several densities (for example, the lower two curves of each plot are for fallout in air at room
temperature and steam at 1300 K). Vertical dashed lines are shear velocities of 15 to 200 m/s,
assuming a drag coefficient of 0.01; these lines define the rate of fallout of tephra from
an eruption plume and velocities required to suspend the fragments in a pyroclastic flow.
(Adapted from Sparks et al., 1978.)
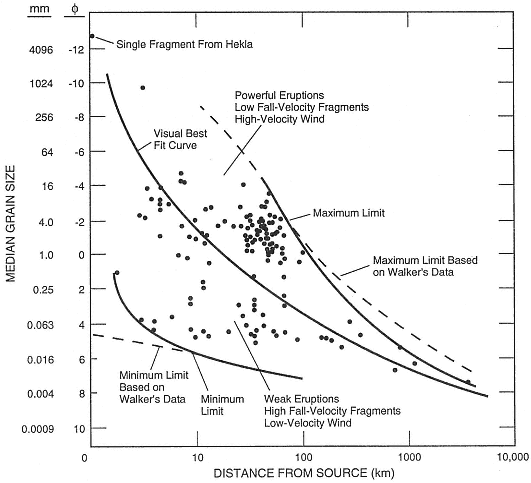
Fig. A.10
Plot of median grain size vs distance from the source for various tephra deposits.
(Adapted from Fisher and Schmincke, 1984.)
processes of fragmentation and transport sorting, which allows a much more extensive analysis of size data. The distribution is given as

where the normalization constant (Ks ) and the transport distance factor (x/xo ) are set to unity for frequency distributions totaling 100%, gf = a parameter analogous in part to standard deviation, and gf = gf + 2 for fragmentation processes or gf = 2 for transport processes. Because the distribution shapes for the fragmentation and transport forms of Eq. (A-3) are nearly identical and because almost all tephra samples have experienced some sorting by a transporting agent, the gf = 2 form is most appropriate. Figures A. 15 through A.17 show the results when Eq. (A-3) is applied to several tephra samples. In Table A.3, we show observed ranges and expected values of gf for volcanic fragmentation and transporting process.
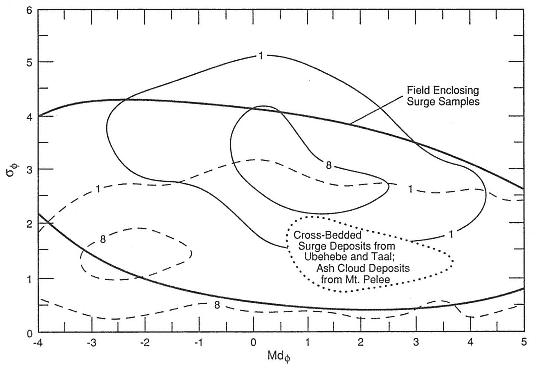
Fig. A.11
Plot of sorting (sf ) vs median diameter (Mdf ), showing ranges of values as 1 and 8%
contours for fallout (dashed lines) and pyroclastic flows (solid lines).
(Adapted from Walker, 1971.)
The bold solid line encloses the range of values observed for pyroclastic surge samples
from observations referenced by Fisher and Schmincke (1984); the dotted line
surrounds values of cross-bedded surge deposits.
(Adapted from Fisher and Schmincke, 1984.)
Component Analysis
Tephra samples contain essential juvenile, (meaning new magma), accessory (older volcanic materials), and accidental (subvolcanic basement fragments) components. In juvenile components, fragments of glass, lava, and crystals vary in proportion in a complex fashion that is dependent on the magma composition and temperature as well as the mode of ejection and transport. Glass is often vesiculated and forms pumice or scoria. The three tephra components (glass, crystals, and lithic fragments) can be easily recognized with assistance of a hand lens or microscope. An example from Walker and Croasdale (1972) shows vertical and lateral changes of pyroclast constituents for the Fogo A tephra sampled southeast of Lake Fogo at Sao Miguel in the Azores (Fig. A.18).
An analysis of tephra components is especially important for identifying samples from deposits that have major nonjuvenile contributions. Abundant accidental and accessory lithic fragments are indicative of eruptions that have fractured and excavated rocks from around the magma conduit, as is the case for vent-opening and hydrovolcanic eruptions. A careful count of lithic-fragment abundances for the scoria cone at Lathrop Wells (Fig. A.12) showed the relative abundance of lithic fragments in pyroclastic deposits from hydrovolcanic phases (Fig. A.19). In addition, Fig. A.19 illustrates the relative increases of crystals in pyroclastic surge samples from the tuff ring and fine ashes from
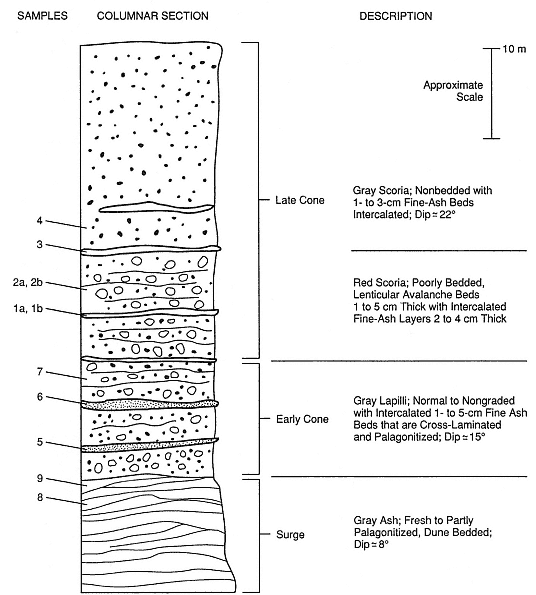
Fig. A.12
Stratigraphic section of the Lathrop Wells, Nevada, scoria cone,
showing sampled intervals.
(Adapted from Wohletz, 1986.)
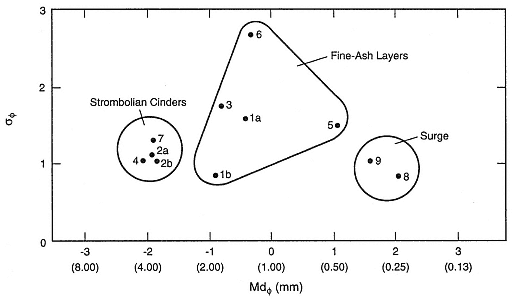
Fig. A.13
Plot of sorting vs median diameter for samples from the scoria cone described in Fig. A.12.
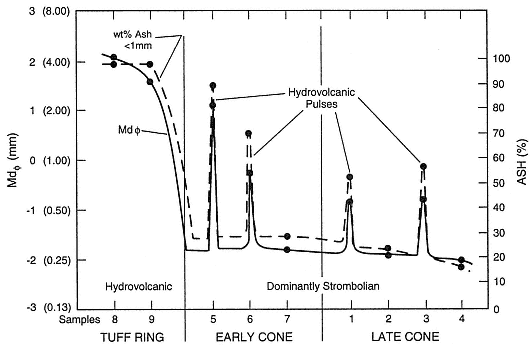
Fig. A.14
Plot median diameter (Mdf ) and wt% ash <1 mm vs the scoria cone
stratigraphy (shown in Fig. A.12). The peaks in median diameter and ash abundance
for the hydrovolcanic samples are unlike those for the Strombolian
samples, which are products of magmatic eruption.
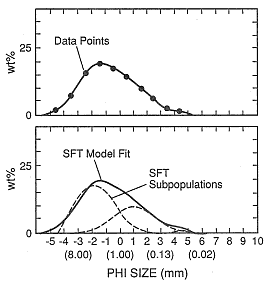
Fig. A.15
Plots of the size-frequency distribution for a
sample of a planar surge bed from Crater
Elegante in Sonora, Mexico. The upper plot
shows a cubic spline curve fit to the data
points (

modeled distribution (solid curve) made
by adding three subpopulations of SFT
form (dashed curves).
(Adapted from Wohletz et al ., 1989.)
the early and late cone samples, which were interpreted as surge deposits. This increase in crystal concentration is a typical feature of surge-emplaced tephra.
Grain Shape and Texture
For most samples (except those with a high content of fine ash), a hand lens is sufficient to make vital observations about features such as those listed here.
· Vesicularity: the relative abundance and size of vesicles and whether they are spherical or elongated; in most cases, this is a measure of the contribution of magmatic gas
· Angularity: blocky grains with few vesicles—earmarks of phreatomagmatic or phreatic pyroclasts
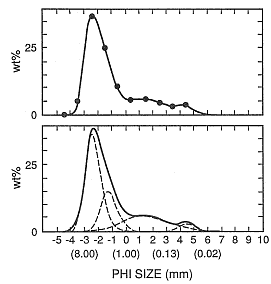
Fig. A.16
Plots of the size-frequency distribution for
a sample of the proximal bedded deposits
of the Mount St. Helens May 18, 1980
pyroclastic flow. The upper plot shows
a cubic spline curve fit to the data points (

and the lower plot shows the modeled
distribution (solid curve) made by adding four
subpopulations of SFT form (dashed curves).
(Adapted from Wohletz et al ., 1989.)
· Rounding: used to determine the relative degree of transport abrasion and reworking by epiclastic processes
· Surface alteration: indicates weathering or hydrothermal processes; phreatomagmatic pyroclasts from wet surge deposits show abundant alteration coatings.
Grain-shape analysis can be further developed by using an SEM; methods for analysis and interpretation are discussed by Heiken (1972), Wohletz (1983; 1986), and Heiken and Wohletz (1985). The SEM micrographs in Fig. A.20 reveal prominent textural features. Figure A.21 plots the variation of grain textures that proved useful in distinguishing between Strombolian (magmatic) and hydrovolcanic samples from the scoria cone at Lathrop Wells (Fig. A.12).
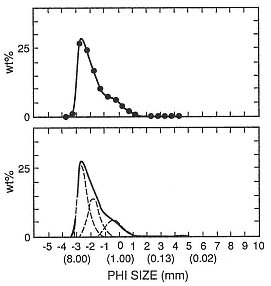
Fig. A.17
Plots of the size-frequency distribution for a
sample of gray pumice fall from the AD 79
eruption of Vesuvius. The upper plot
shows a cubic spline curve fit to the
data points (

the modeled distribution (solid curve) made
by adding three subpopulations of
sequential fragmentation/transport (SFT)
form (dashed curves).
(Adapted from Wohletz et al ., 1989.)
Tephra Chemistry and Alteration
Bulk chemical analyses can be obtained by x-ray fluorescence (XRF) and atomic absorption (AA) methods, as discussed for lava samples earlier; however, such analyses are not commonly performed because of the secondary alterations typical found in tephra samples. Glass silica content can easily be determined by index of refraction measurements with a petrographic microscope (see Fig. B.1). An x-ray analyzer attached to the scanning electron microscope (SEM) also provides a rapid means by which to obtain relative chemical compositions; using this technique, it is possible to analyze small alteration crystals that cover individual pyroclast surfaces (Fig. A.22). Many types of pyroclastic deposits show variations of glass surface chemistry with stratigraphic position (Fig. A.23). These variations can be interpreted with respect to the degree of secondary alteration (an essential measurement for porosity and permeability), the degree of water interaction during hydrovolcanic eruption, and changes in magma chemistry. In the Fig. A.24 plot of major-element variations for the Lathrop Wells scoria cone (Fig. A.12), the strongest variations occur in hydrovolcanic samples, as is the case for palagonitic constituents and surface alteration textures (Figs. A.19 and A.20, respectively).