Nineteen—
Constraints from Seismograms on the Physical Characteristics of Explosions
Brian W. Stump
Introduction
The waveforms generated by explosions contain information about both the physical properties of the explosion and the surrounding geologic material (Minster, 1985; Bache, 1982; Massé, 1981; Rodean, 1981). This paper presents a short review of these waveforms and some of their implications. The particular subjects discussed are: (1) the physical characterization of contained explosions; (2) the effect of source depth on characterization, in particular relating the motion from a near-surface burst to a fully contained explosion; (3) the relative importance and separation of stochastic and deterministic wave propagation effects; and (4) some simple experiments to check linear superposition.
Ground motions from explosions have been recorded from the very near nonlinear regime out to teleseismic distances (figure 1). At the closest ranges the material surrounding the explosion responds nonlinearly, with accelerations of hundreds or thousands of gs and rise times on the order of milliseconds (Rodean, 1981). In the near-field linear region one observes fairly simple seismograms, with durations on the order of seconds and accelerations generally less than 1 g (Stump and Johnson, 1984; Stump and Reinke, 1987; Vidale and Helmberger, 1987). Typical ranges for the near-field linear region of small chemical explosions (tens of pounds) are tens of meters, while for large nuclear explosions they are on the order of several kilometers. At regional distances the seismogram duration is tens to hundreds of seconds and characterized by Pn , Pg , S, Rg , and Lg phases (Pomeroy et al., 1982). Finally, at teleseismic distances the body waves have frequencies under 1 Hz, while long-period surface waves are also observed (Massé, 1981, Bache, 1982).
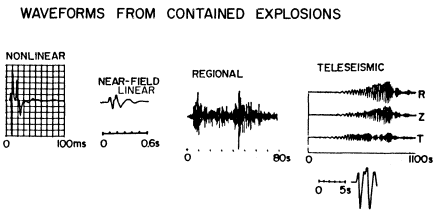
Figure 1
Schematic representation of explosion waveforms ranging from
the close-in nonlinear regime out to teleseismic distances.
The work discussed in this paper focuses upon the near-field linear region. There are three reasons for this emphasis: (1) propagation path effects can be minimized; (2) a broadband characterization of the source can be attempted; and (3) the length scale of the problem allows the formulation and implementation of carefully designed experiments.
Contained Explosions
Two sets of data from contained explosions are investigated. The first is from a small-scale chemical explosion (256 lb) detonated at a depth of 11.5 m in alluvium (acronym CHEAT). The second is from a nuclear explosion with an announced yield of less than 20 kton, also detonated in alluvium, at a depth of 273 m (acronym COALORA). The physical processes that accompany these events include: (1) initial cavity formation and subsequent simple Sharpe (1942) pressure-pulse generation dependent on material type; (2) tensile failure of near-surface layers (spallation), which repartitions the initial spherical energy radiation from the source (Viecelli, 1973; Day et al., 1983); (3) tectonic strain release or motion driven along planes of weakness, which leads to complex radiation and transverse motions (Massé, 1981); and (4) cavity collapse (McEvilly and Peppin, 1972).
The vertical and radial accelerograms recorded at 50 m from the chemical explosion are shown in figure 2. The amplitudes and waveshapes as a function of azimuth around the source support a fair amount of azimuthal symmetry. Such data are replicated by simple isotropic cavity models. In contrast, transverse motions from the same source are as displayed in figure 3. Although these waveforms have peak amplitudes on the order of only four-
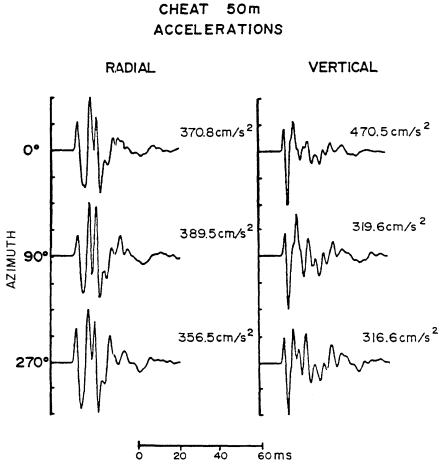
Figure 2
Vertical and radial accelerations from the chemical
explosion CHEAT at azimuths ranging from 0 to 270°.
teen to forty-seven percent of the radial acceleration at 50 m, they indicate a source or propagation effect that leads to azimuthally variable radiation.
Similar observations are made for the nuclear explosion as indicated in figure 4 where the vertical, radial, and transverse displacements from COALORA are displayed. Even though the observation range is an order of magnitude greater than that from the chemical explosion (549 m compared to 50 m), the radial and vertical motions are similar in shape and amplitude. The transverse motions are generally smaller in amplitude, have higher frequency, and exhibit considerable azimuthal variation. Spectral estimates of these same data illustrate further azmuthal differences in the motions (fig. 5).
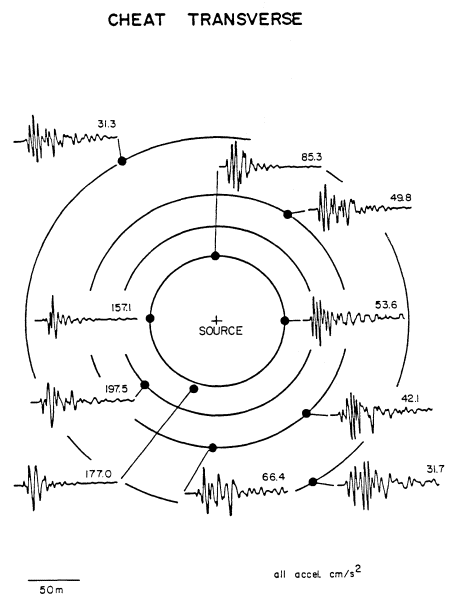
Figure 3
Transverse accelerations from the chemical explosion CHEAT.
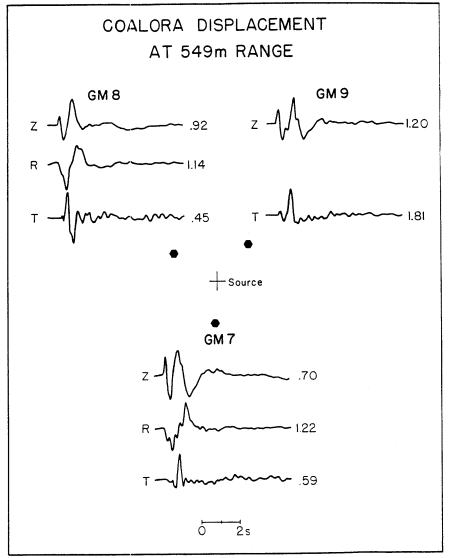
Figure 4
Vertical, radial, and transverse displacements from
the nuclear explosion COALORA.
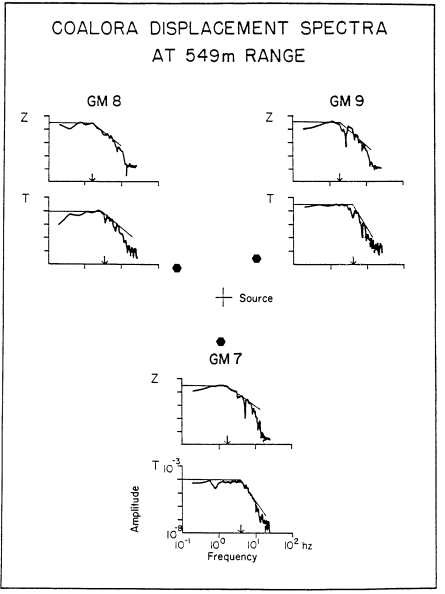
Figure 5
Displacement spectra from COALORA. Arrows
indicate approximate spectral corner frequency.
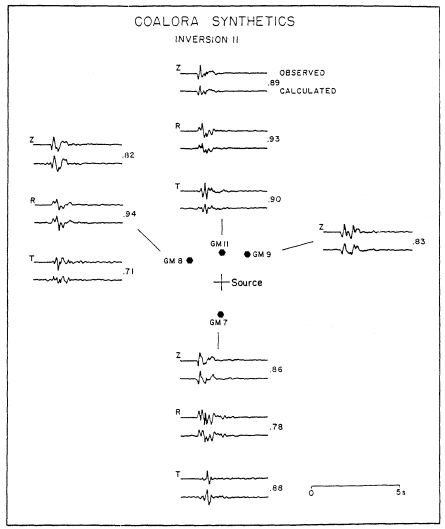
Figure 6
Observed and modeled velocity waveforms from COALORA. The
correlation coefficents are given to the right of each waveform pair.
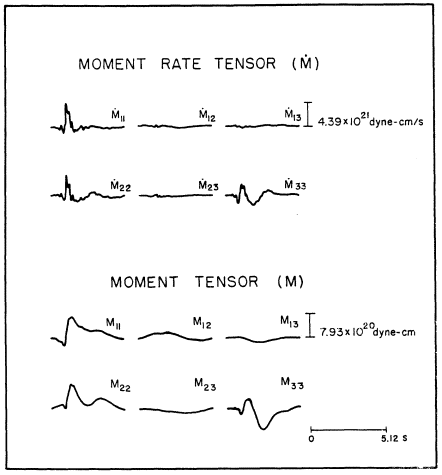
Figure 7
The moment and moment rate tensors for COALORA. Only six elements
of the moment tensor are given since the second rank tensor is symmetric.
The vertical spectra are characterized by a 1.5-Hz corner frequency, f–2 high-frequency decay, and a long-period level at least three times greater than the transverse long-period level. The transverse motions also have a considerably higher-corner frequency (4 Hz) and f–3 high-frequency decay.
In order to separate the source and propagation effects, an inverse modeling exercise was undertaken in which the source is represented as a set of force-moments, Mij , while the propagation effects are accounted for by a set of Green's functions appropriate to the medium, Gni,j . Then,

an equation that holds in the frequency domain. The modeling exercise consists of computing a set of Green's functions and then solving for the source, given an observational data set. In matrix form this result becomes

The ability of this procedure to model the observations from the nuclear explosion COALORA is summarized in figure 6. Both peak amplitudes and waveshapes are well replicated as indicated by the average radial correlation coefficent of 0.88, vertical correlation coefficent of 0.85, and transverse correlation coefficent of 0.83.
The force-moment and force-moment rate tensor from this modeling exercise are summarized in figure 7 (COALORA), in which the 1 and 2 indices represent the horizontal coordinates, and the 3 index represents the vertical coordinate. Three attributes are noted: (1) the diagonal elements of the forcemoment tensor, the isotropic source, dominate; (2) the deviatoric components are an order of magnitude smaller than the diagonal elements; and (3) the M33 component, which represents the force couple in the vertical direction, has a secondary long-period component attributable to spallation, the tensile failure of near-surface layers.
A similar result came from the inverse modeling of CHEAT (figure 8). The source is primarily isotropic, followed by the longer-period spallation contribution as indicated on the M33 component. The source time functions for the COALORA and CHEAT explosions are remarkably similar except for the order of magnitude change in time scale.
The resulting source of the radiated near-field waveforms is dominated by the isotropic component followed by spallation that repartitions the energy. The relative importance of spallation on the M33 component is further supported by studies of synthetic data that include spallation contributions (Stump, 1987). The deviatoric moments are a factor of ten smaller, with indication of a higher-frequency content.
Source Depth Effects and Energy Coupling
Taking advantage of the small-scale characteristic of the near-field experiments, a set of chemical explosion tests were designed to quantify the effect of source depth on radiated seismic energy. Sources (256-lb TNT spheres) were placed at depths varying from 1.84 to 11.5 m in alluvium. Waveforms were recorded in the 17–228-m range.
Radial and vertical velocity records for all source depths at the 228-m range are shown in figure 9. The initial body waves are identified by the rectilinear motion. Surface waves yield clear retrograde elliptical motion, with the vertical (dashed line) following the radial (solid line) motion. Qual-
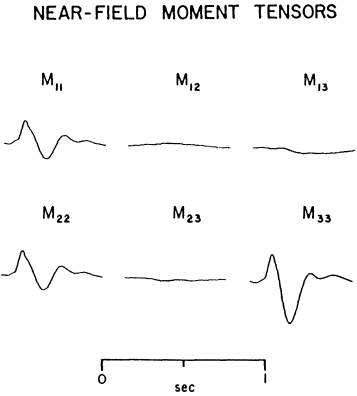
Figure 8
The moment tensor for CHEAT. All moments are relative to
the M33 component, which has a peak of 5.10 × 10¹⁶ dyne-cm.
itatively, one can observe the rise in body-wave amplitudes relative to the surface waves with increasing source depth.
The particle motions are used to separate the body and surface waves, as discussed above. Once this separation is completed, the data are used to quantify the relative and absolute coupling of seismic energy into body and surface waves (Flynn and Stump, 1987). The body and surface waves are corrected for geometrical spreading and attenuation. Once this process is completed, the energy flux is calculated in the time or frequency domain

where F is the energy flux (ergs/cm2 ), r is density (g/cm3 ), C is the propagation velocity (cm/s), and v(t) is the recorded particle velocity (cm/s). The total energy in the body waves observed at the range, R, becomes

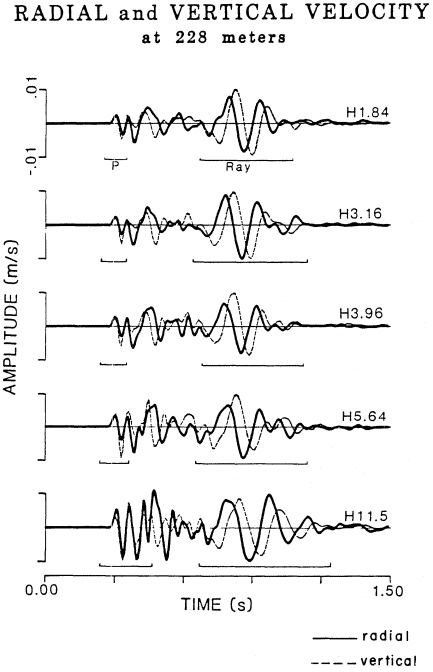
Figure 9
Velocity waveforms observed at 228 m from 256-lb explosions at 1.84 to 11.5 m
depth. Solid lines are the radial motion, dashed lines the vertical. H is the source depth.
Similarly, the total energy in the surface wave becomes

where h is the effective depth of penetration for the surface wave.
These procedures are used to develop the percent total energy in body and surface waves for all source depths (fig. 10). These estimates were made for observation ranges of 17, 37, 73, and 228 m, yielding consistent results. For the shallowest source, 1.84 m, sixty percent of the energy is in the Rayleigh wave, while forty percent is in the P-wave. The percentage of energy in the P-wave increases with increasing source depth until, at 11.5 m, eighty percent of the seismic energy is in the body (P-)waves and twenty percent in the
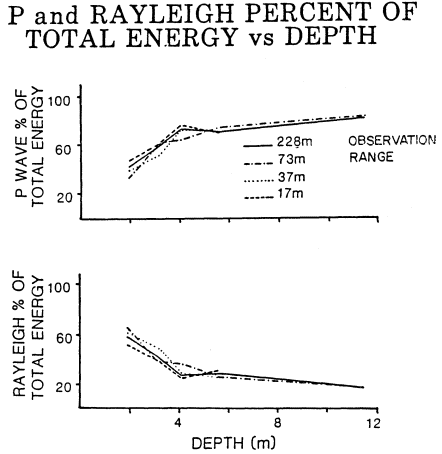
Figure 10
Percent P- and Rayleigh energy as a function of source depth at
four ranges. All charges are 256 lb.
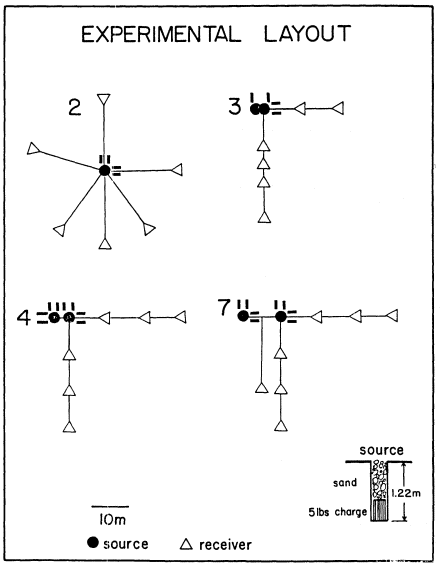
Figure 11
The experimental layout for a series of 5-lb sources designed to quantify
stochastic and deterministic propagation effects and check superposition
between sources (acronym ARTS). Solid lines represent the edges of the
crater following the explosion.
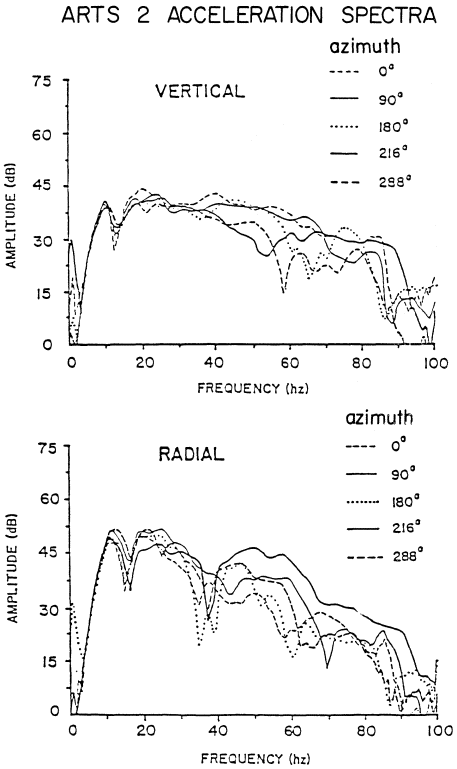
Figure 12
Acceleration spectra from ARTS 2.
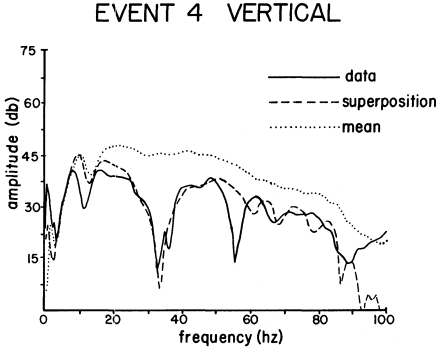
Figure 13
Data and single-burst predictions from the two-burst ARTS 4. The two 5-lb
charges were 4 m apart. The superposition waveform represents the results for
two single-burst waveforms delayed in time to simulate the 4-m separation
between charges. The mean estimate is for two charges no time delay.
surface (Rayleigh) waves. Since the chemical energy in the explosion is known, absolute estimates of seismic energy are obtainable. The efficiency of energy coupling varies from 0.7 percent for the 1.84-m source to three percent for the 11.5-m source.
Stochastic and Deterministic Propagation
All propagation-path effects cannot be modeled deterministically. The random nature of geological media makes a statistical characterization more appropriate for some studies. A final set of experiments was designed to separate deterministic and stochastic propagation effects and to test for linear superposition of motions from multiple sources.
Figure 11 gives the experimental layout for a series of 5-lb sources designed to characterized the single-burst environment (event 2) and check for superposition in the plane of symmetry between the two charges and in the plane of the two charges (events 3, 4, 7). The radial and vertical acceleration
spectra from event 2 (all gauges at 20 m) are given in figure 12. The waveforms themselves, their spectra, and coherence estimates all indicate little variation in waveforms for frequences between 3 and 35 Hz. Above 35 Hz as much as a 15-dB variation in spectral levels is observed. The alluvial test site where these experiments were conducted has intermittent caliche beds. These caliche lenses are 0.5 to 1.5 m in length and have twice the P-wave velocity of the surrounding alluvium. Simple single-scattering calculations indicate that the large variation in amplitude above 35 Hz can be explained by wave-field interactions with the caliche beds.
Taking the 3–35-Hz band as deterministic, one can use the ensemble single-source estimate to check superposition in the two-burst data. Figure 13 gives the observed and predicted spectra from event 4 (4-m source separation) in the plane of the two sources. The observations and predictions support linear superposition to about 40 Hz, including the interference hole at 32 Hz.
Conclusions
A number of physical models of explosive sources have been shown, along with the supporting observational data. These representations include partially and fully contained explosions. Both chemical and nuclear sources are shown to generate waveforms by similar mechanisms, including spallation. Energy partitioning between body and surface waves is found to be strongly influenced by source depth. Absolute coupling values for a suite of chemical explosions in alluvium range from 0.7 to 3.0 percent. Finally, it is found that the deterministic and stochastic wave-propagation effects must be quantified prior to in-situ experimental superposition checks.
References
Bache, T. C. (1982). Estimating the yield of underground nuclear explosion. Bull. Seism. Soc. Am., 72: S131–S168.
Day, S. M., N. Rimer, and J. T. Cherry (1983). Surface waves from underground explosions with spall: Analysis of elastic and nonlinear source models. Bull. Seism. Soc. Am., 73: 247–264.
Flynn, E. C., and B. W. Stump (1987). Effects of source depth on near source seismograms. J . Geophys. Res. (to appear).
Massé, R. P. (1981). Review of seismic source models for underground nuclear explosions. Bull. Seism. Soc. Am., 71: 1249–1268.
McEvilly, T. V., and W. A. Peppin (1972). Source characteristics of earthquakes, explosions, and afterevents. Geophys. J. R. Astr. Soc., 31: 67–82.
Minster, B. J. (1985). Twenty-five years of source theory. In Ann U. Kerr, ed., The Vela Program—A Twenty-five Year Review of Basic Research. Executive Graphic Services, Defense Advanced Research Projects Agency, Rosslyn, Virginia, 67–116.
Pomeroy, P. W., W. J. Best, and T. V. McEvilly (1982). Test ban treaty verification with regional data—A review. Bull. Seism. Soc. Am., 72: S829–S129.
Rodean, H. C. (1981). Inelastic processes in seismic wave generation by underground explosions. In E. S. Husebye and S. Mykkeltveit, eds., Identification of Seismic Sources—Earthquake or Underground Explosion. D. Reidel, Dordrecht, The Netherlands, 97–190.
Sharpe, J. A. (1942). The production of elastic waves by explosive pressures. 1. Theory and empirical field observations. Geophysics, 7: 144–154.
Stump. B. W. (1987). Resolution of complex explosive source functions in the frequency domain. Geophys. J. R. Astr. Soc. (to appear).
Stump, B. W., and L. R. Johnson (1984). Near-field source characterization of contained nuclear explosion in tuff. Bull. Seism. Soc. Am., 74: 1–26.
Stump, B. W., and R. E. Reinke (1987). Experimental seismology: In situ source experiments. Bull. Seism. Soc. Am., 77: 1295–1311.
Vidale, J. E., and D. V. Helmberger (1987). Path effects in strong motion seismology. In Bruce A. Bolt, ed., Seismic Strong Motion Synthesis. Academic Press, Orlando, Florida.
Viecelli, J. A. (1973). Spallation and the generation of surface waves by an underground explosion. J . Geophys. Res., 78: 2475–2487.